Embed Size (px)
Citation preview

ISO-NE PUBLIC
F E R C C O N F E R E N C E , W A S H I N G T O N D C , J U N E 2 7 - 2 9 , 2 0 1 6
Feng Zhao, Tongxin Zheng, Eugene Litvinov I S O N E W E N G L A N D
Demand Curves in Forward Capacity Market (FCM)
ISO-NE PUBLIC
2
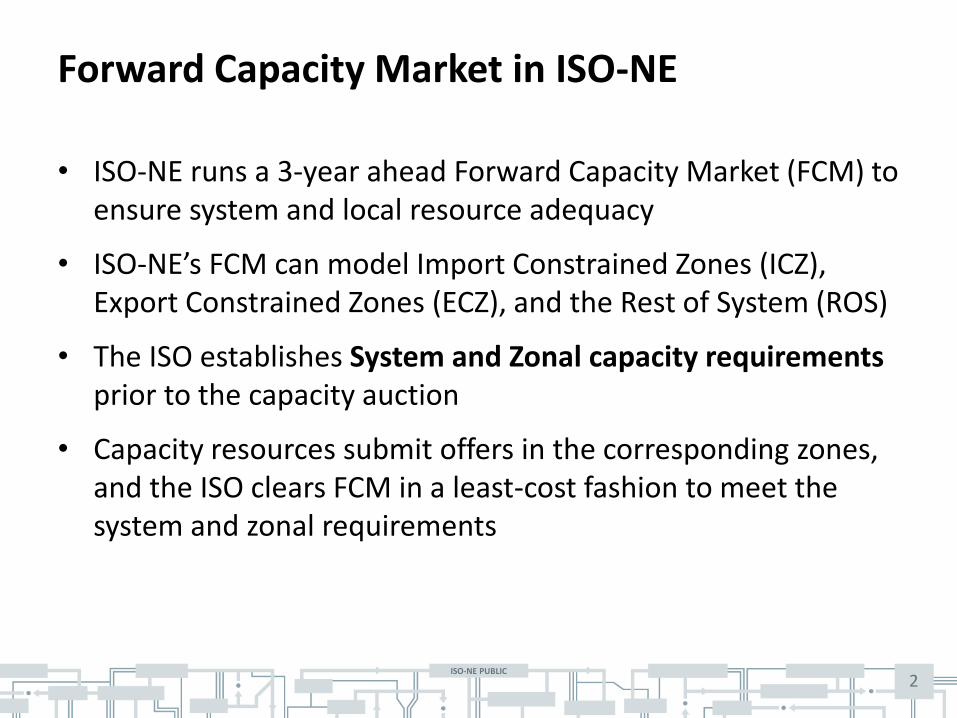
Forward Capacity Market in ISO-NE
• ISO-NE runs a 3-year ahead Forward Capacity Market (FCM) to ensure system and local resource adequacy
• ISO-NE’s FCM can model Import Constrained Zones (ICZ), Export Constrained Zones (ECZ), and the Rest of System (ROS)
• The ISO establishes System and Zonal capacity requirements prior to the capacity auction
• Capacity resources submit offers in the corresponding zones, and the ISO clears FCM in a least-cost fashion to meet the system and zonal requirements

ISO-NE PUBLIC
3
Capacity Requirements in FCM
• System and zonal capacity requirements are surrogates for system reliability
• The ISO determines the capacity requirements through resource adequacy studies to maintain the Loss of Load Expectation (LOLE) of 0.1 days/year
– The system-wide requirement is “Installed Capacity Requirement” (ICR)
– The requirement for an Import Zone is “Local Source Requirement” (LSR)
– The limit for an Export Zone is “Maximum Capacity Limit” (MCL)

ISO-NE PUBLIC
Issues with Fixed Capacity Requirements
• Fixed capacity requirement, or vertical capacity demand curves, may lead to volatile capacity prices, increasing risk for investment and load
• No economic tradeoff between different reliability levels
• No economic tradeoff between different zones
4
Solution: Sloped Capacity Demand Curves

ISO-NE PUBLIC
Capacity Demand Curve Illustration
5
Capacity
Price
Fixed Capacity Requirement Q0:
D(Q): Capacity Demand Curve

ISO-NE PUBLIC
6
Major Challenge For Capacity Demand Curves
• Capacity demand curves should reflect consumers’ willingness to pay for capacity, or “reliability”
• However, reliability is treated as a public good and there are no private capacity demand bids in FCM
• The major challenge for designing capacity demand curves is to reflect their economic essence, i.e., the value of reliability, without direct expression from the consumers

ISO-NE PUBLIC
7
Technical Challenge For Capacity Demand Curves
• As a public good, reliability is defined at the system level and measured by the system-level indices
• However, system reliability is affected by not only the total system capacity, but its allocation among the zones as well
• Therefore, reliability is a multi-variate function of the capacities in different zones
• The technical challenge is to decompose the multi-variate reliability function into individual single-variable functions that appropriately reflect the reliability impact of different zones

ISO-NE PUBLIC
8
Outline
• Overview of ISO-NE’s Forward Capacity Market (FCM)
• Issues with fixed capacity requirements
• Challenges for designing capacity demand curves
• An illustrative FCM problem
• Value of Reliability and its decomposition
• Capacity Demand Curves
• Conclusion

ISO-NE PUBLIC
9
An Illustrative FCM Problem
The system is composed of an Import-Constrained Zone (ICZ), an Export-Constrained Zone (ECZ), and the Rest of System (ROS) zone
ICZ
ROS
ECZ

ISO-NE PUBLIC
{ , , , }
0 0 0
( )r SYS ICZ ECZ
ICZ ECZ ROS
SYS ICZ ECZ
q Q Q Q r r
r Z Z Z
Q Q Q
SYS ICZ ECZ
Minimize C q
D Q dQ D Q dQ D Q dQ
10
FCM Model with Capacity Demand Curves
DSYS(·), DICZ(·) and DECZ(·) are system and zonal capacity demand curves replacing the fixed requirements/limits – How to derive them?
. .ICZ ECZ ROS
i j k SYS
i Z j Z k Z
s t q q q Q
ICZ
i ICZ
i Z
q Q
ECZ
j ECZ
j Z
q Q
,r r ICZ ECZ ROSq r Z Z Z
Cost of Capacity
ICR System Capacity Requirement
LSR Local Source Requirement for the import zone
MCL Maximum Capacity Limit for the export zone

ISO-NE PUBLIC
Capacity Demand Curve Design Guidelines
• Based on rigorous economic foundation and reliability theory
• Allow tradeoffs between different reliability levels and zones
• Clear and justifiable assumptions and approximations
• Viable for practical implementation
11
ISO-NE PUBLIC
12
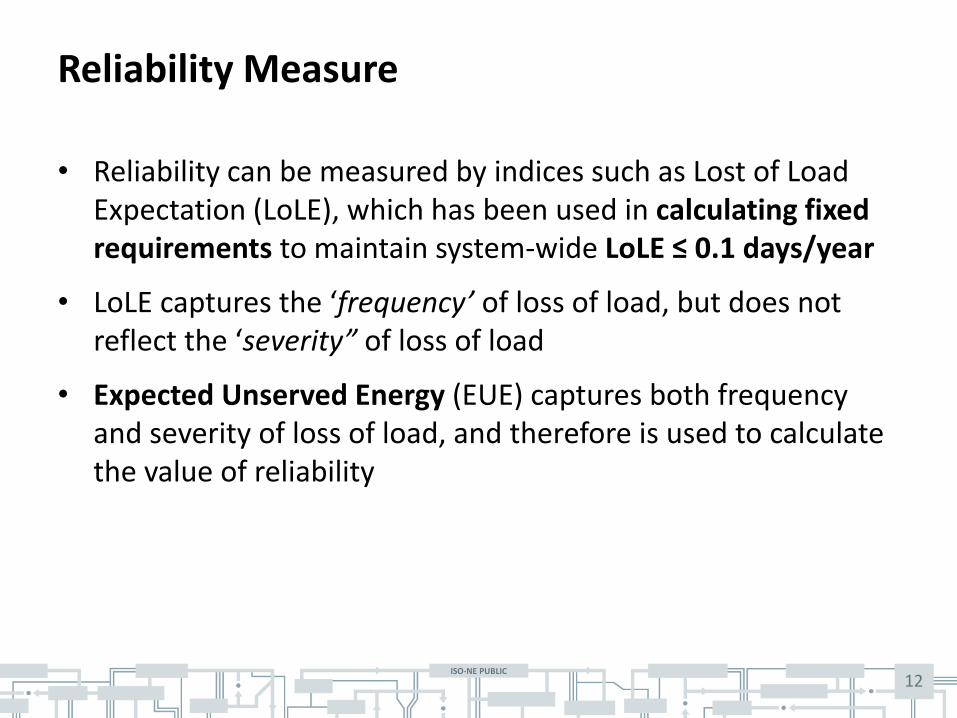
Reliability Measure
• Reliability can be measured by indices such as Lost of Load Expectation (LoLE), which has been used in calculating fixed requirements to maintain system-wide LoLE ≤ 0.1 days/year
• LoLE captures the ‘frequency’ of loss of load, but does not reflect the ‘severity” of loss of load
• Expected Unserved Energy (EUE) captures both frequency and severity of loss of load, and therefore is used to calculate the value of reliability

ISO-NE PUBLIC
13
Expected Unserved Energy
• Unserved energy could be caused by deficiency in system capacity or limitation of the transfer capability between zones
• Therefore, system reliability is impacted by both the total system capacity and its allocation among zones
• Denote the capacities in system, ICZ and ECZ respectively, by QSYS, QICZ and QECZ; then the system reliability, measured by EUE, is a multivariate function of the three capacity variables:
, ,SYS ICZ ECZEUE Q Q Q
Decomposition is needed to obtain single-variable demand functions

ISO-NE PUBLIC
14
Illustrative Multivariate EUE Function: 2-Zone
EUE
EUE for a given (QSYS, QICZ)

ISO-NE PUBLIC
15
EUE Decomposition
• Unserved energy can be caused by system capacity deficiency or the allocation of capacity (in the presence of interface limits)
• Therefore, EUE(QSYS, QICZ, QECZ) can be decomposed as
|, , , |SYS ICZ ECZ SYS SYS A SYS ICZ ECZ SYSEUE Q Q Q EUE Q EUE Q Q Q
unserved energy caused by system capacity deficiency
Additional unserved energy caused by the allocation of system capacity to zones given the system capacity

ISO-NE PUBLIC
16
EUE Decomposition Ctn’d
• The additional reliability impacts of zones are considered independent of each other, as in the existing calculation of zonal capacity requirements
• Then EUE is further decomposed into zones
| | |, | | |A SYS ICZ ECZ SYS ICZ SYS ICZ SYS ECZ SYS ECZ SYSEUE Q Q Q EUE Q Q EUE Q Q
EUE caused by allocating QICZ out of the total system capacity to the ICZ
EUE caused by allocating QECZ out of the total system capacity to the ECZ

ISO-NE PUBLIC
17
EUE Decomposition Ctn’d
• The additional reliability impact of a zone does not vary significantly with respect to the total system capacity as verified with the NE system
• Then the total system capacity in the additional reliability impact function can be fixed at the nominal value of ICR that corresponds to the 1-day in 10-year LoLE
| || |ICZ SYS ICZ sys ICZ SYS ICZEUE Q Q EUE Q ICR
| || |ECZ SYS ECZ sys ECZ SYS ECZEUE Q Q EUE Q ICR

ISO-NE PUBLIC
18
The Value of Reliability
• To measure the value of reliability, we introduce the Value of Lost Load (VoLL) parameter in $/MWh
• Reliability is treated as a public good, so VoLL is considered the same for all zones
• With VoLL and EUE, the Value of Reliability is measured by the Cost of Expected Unserved Energy (CEUE):
, , , ,SYS ICZ ECZ SYS ICZ ECZCEUE Q Q Q VoLL EUE Q Q Q
| || |SYS SYS ICZ SYS ICZ ECZ SYS ECZVoLL EUE Q EUE Q ICR EUE Q ICR
ISO-NE PUBLIC
19
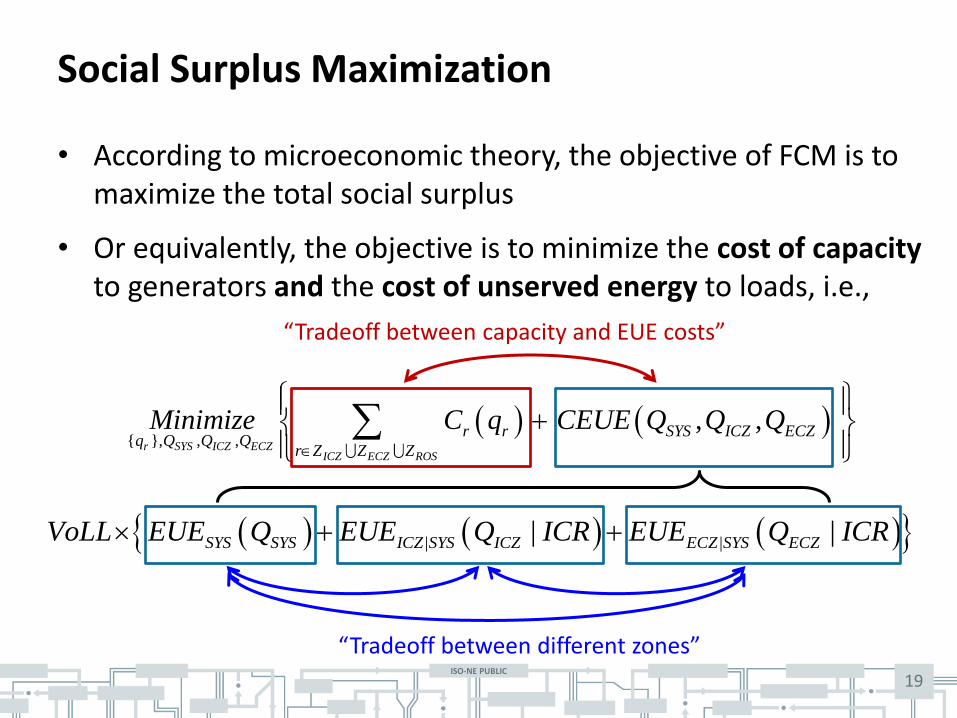
Social Surplus Maximization
• According to microeconomic theory, the objective of FCM is to maximize the total social surplus
• Or equivalently, the objective is to minimize the cost of capacity to generators and the cost of unserved energy to loads, i.e.,
{ }, , ,
, ,r SYS ICZ ECZ
ICZ ECZ ROS
r r SYS ICZ ECZq Q Q Q
r Z Z Z
Minimize C q CEUE Q Q Q
| || |SYS SYS ICZ SYS ICZ ECZ SYS ECZVoLL EUE Q EUE Q ICR EUE Q ICR
“Tradeoff between capacity and EUE costs”
“Tradeoff between different zones”
ISO-NE PUBLIC
20
SYS SYS
SYS SYS
SYS
dEUE QD Q VoLL
dQ
| |ICZ SYS ICZ
ICZ ICZ
ICZ
dEUE Q ICRD Q VoLL
dQ
| |ECZ SYS ECZ
ECZ ECZ
ECZ
dEUE Q ICRD Q VoLL
dQ
“$ per MW-Year”
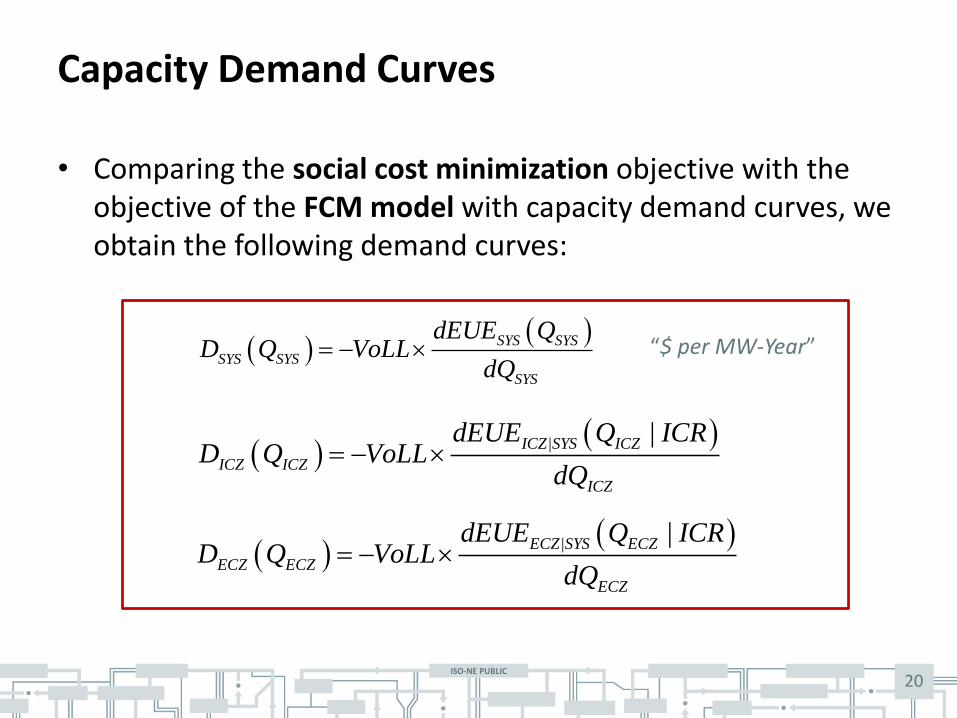
Capacity Demand Curves
• Comparing the social cost minimization objective with the objective of the FCM model with capacity demand curves, we obtain the following demand curves:

ISO-NE PUBLIC
21
Meanings of Capacity Demand Curves
• DSYS(QSYS) represents the marginal reliability cost of system capacity without considering zones
• DICZ (QICZ) represents the marginal reliability cost of shifting capacity from the rest of system into ICZ
• DECZ (QECZ) represents the marginal reliability cost of shifting capacity from the rest of system into ECZ

ISO-NE PUBLIC
22
Calculation of VoLL
• Under the long-term market equilibrium, the marginal value of reliability at the desired reliability level (i.e., 1-day in 10-year LoLE) should be equal to the marginal cost of new entry for each zone
• The marginal cost of new entry, i.e., Net Cost of New Entry (Net CONE), is determined by the ISO under reasonable assumptions prior to the FCM
• VoLL is implied from the Net CONE values based on the long-term market equilibrium property

ISO-NE PUBLIC
23
Illustrative Capacity Demand Curves
Monotonically Decreasing!
QSYS(MW)
QECZ(MW)
QICZ(MW)

ISO-NE PUBLIC
Conclusion
• We propose a sensible economic framework for designing capacity demand curves in FCM
• The resulting demand curves allow cost trade-offs between different capacity zones and different reliability levels
• Necessary and justifiable decompositions are used to obtain zonal demand curves
• The design retains existing reliability evaluations as core elements, and therefore is viable for practical implementation
• The proposed framework provides possibilities for exploring interesting questions (VoLL estimation, NET CONE values, appropriate reliability level, etc.)
24