Embed Size (px)
DESCRIPTION
Demand Analysis
Citation preview
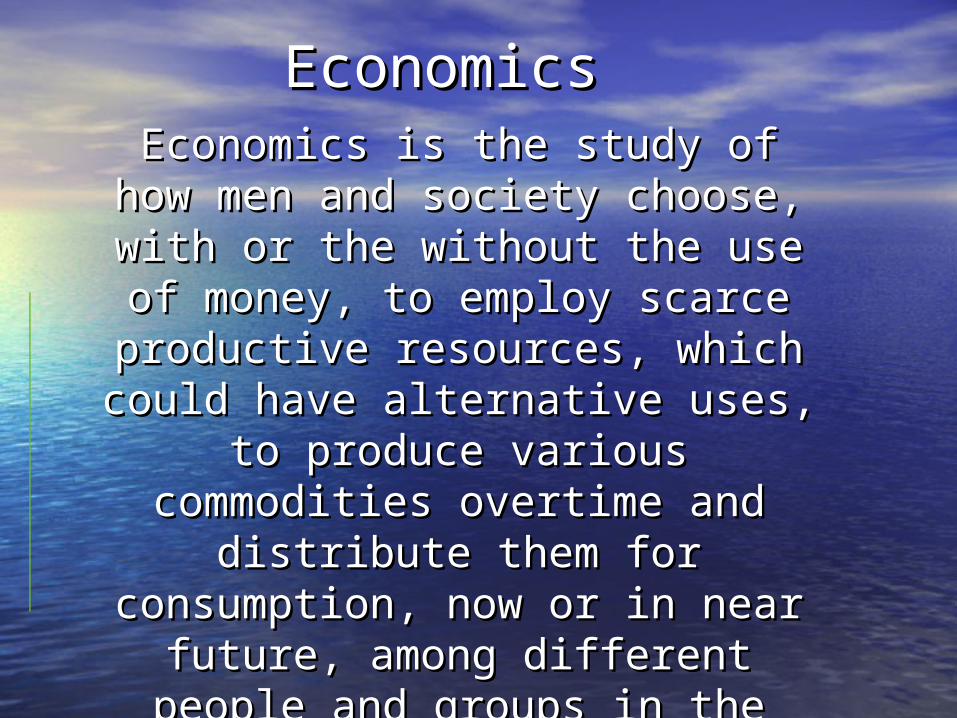
Economics Economics Economics is the study of how Economics is the study of how
men and society choose, with or men and society choose, with or the without the use of money, to the without the use of money, to
employ scarce productive employ scarce productive resources, which could have resources, which could have alternative uses, to produce alternative uses, to produce
various commodities overtime various commodities overtime and distribute them for and distribute them for
consumption, now or in near consumption, now or in near future, among different people future, among different people
and groups in the societyand groups in the society - P.A.Samuelson- P.A.Samuelson

Terms Used in the DefinitionTerms Used in the Definition• SocietySociety• MenMen• MoneyMoney• Productive ResourcesProductive Resources• Alternative UsesAlternative Uses
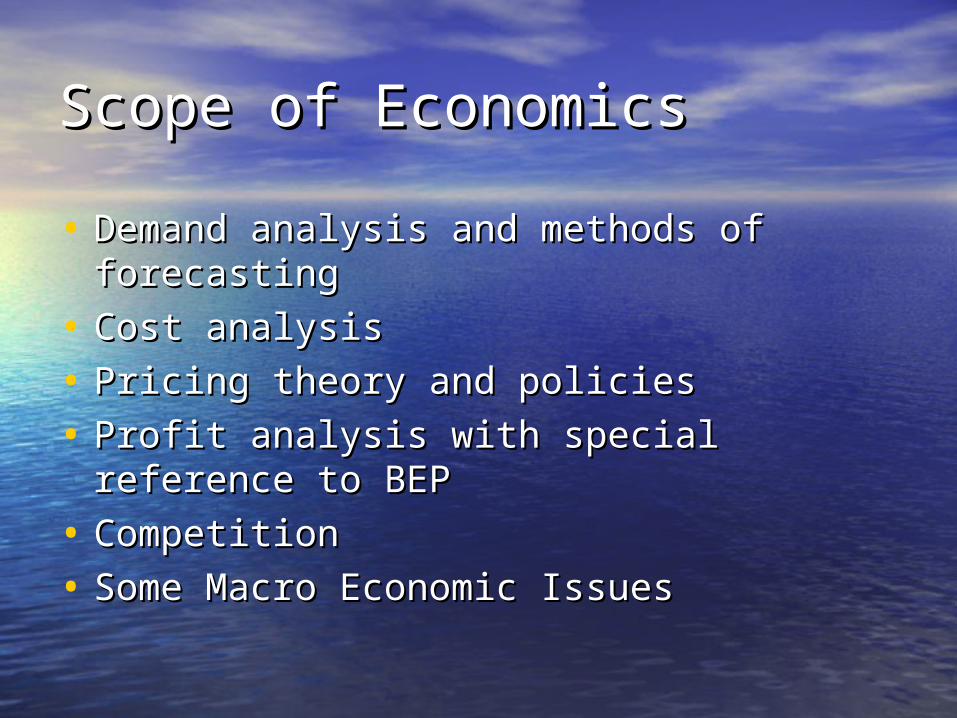
Scope of EconomicsScope of Economics• Demand analysis and methods of Demand analysis and methods of
forecastingforecasting• Cost analysis Cost analysis • Pricing theory and policiesPricing theory and policies• Profit analysis with special reference to Profit analysis with special reference to
BEPBEP• Competition Competition • Some Macro Economic IssuesSome Macro Economic Issues
Factors Affecting an Factors Affecting an OrganizationOrganization• External Factors: which are not in External Factors: which are not in
control.control.• Internal Factors: which are in control.Internal Factors: which are in control.
Different Branches of Different Branches of EconomicsEconomics• Micro EconomicsMicro Economics• Macro EconomicsMacro Economics• International EconomicsInternational Economics• Monetary EconomicsMonetary Economics• Public Finance etc.Public Finance etc.

Economics AnalysisEconomics Analysis• Partial and General equilibrium Partial and General equilibrium
analysisanalysis• Static, Comparative and Dynamic Static, Comparative and Dynamic
analysisanalysis• Deductive and Inductive analysisDeductive and Inductive analysis• Positive and Normative analysis Positive and Normative analysis

Five Fundamental ConceptsFive Fundamental Concepts• Opportunity CostOpportunity Cost• Time PerspectiveTime Perspective• Incremental CostIncremental Cost• Discounting ConceptDiscounting Concept• Equi MarginalismEqui Marginalism
Consumption TheoryConsumption Theory• Want : feeling of mental painWant : feeling of mental pain• Need: requirement of body or mindNeed: requirement of body or mind• Satisfaction: process of consumption Satisfaction: process of consumption
gives satisfactiongives satisfaction• Utility: capacity to yield satisfactionUtility: capacity to yield satisfaction
Demand AnalysisDemand Analysis• Demand Theory, Objectives of Demand Demand Theory, Objectives of Demand
AnalysisAnalysis• Determinants of DemandDeterminants of Demand• Elasticity of Demand and Demand Elasticity of Demand and Demand
EstimatesEstimates• Importance in decision makingImportance in decision making• Demand Forecasting MethodsDemand Forecasting Methods
Marginal UtilityMarginal Utility• Assumptions Assumptions 1.1. Identical UnitsIdentical Units2.2. No Time IntervalNo Time Interval3.3. Tastes and Preferences are Tastes and Preferences are
constantconstant
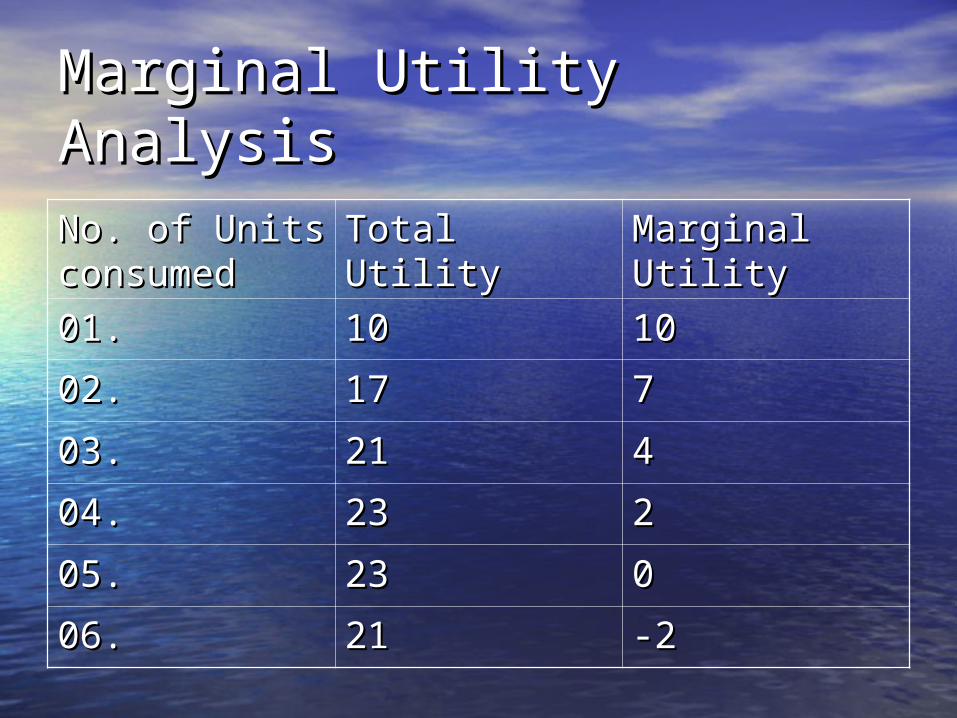
Marginal Utility AnalysisMarginal Utility AnalysisNo. of Units No. of Units consumed consumed
Total UtilityTotal Utility Marginal Marginal UtilityUtility
01.01. 1010 101002.02. 1717 7703.03. 2121 4404.04. 2323 2205.05. 2323 0006.06. 2121 -2-2
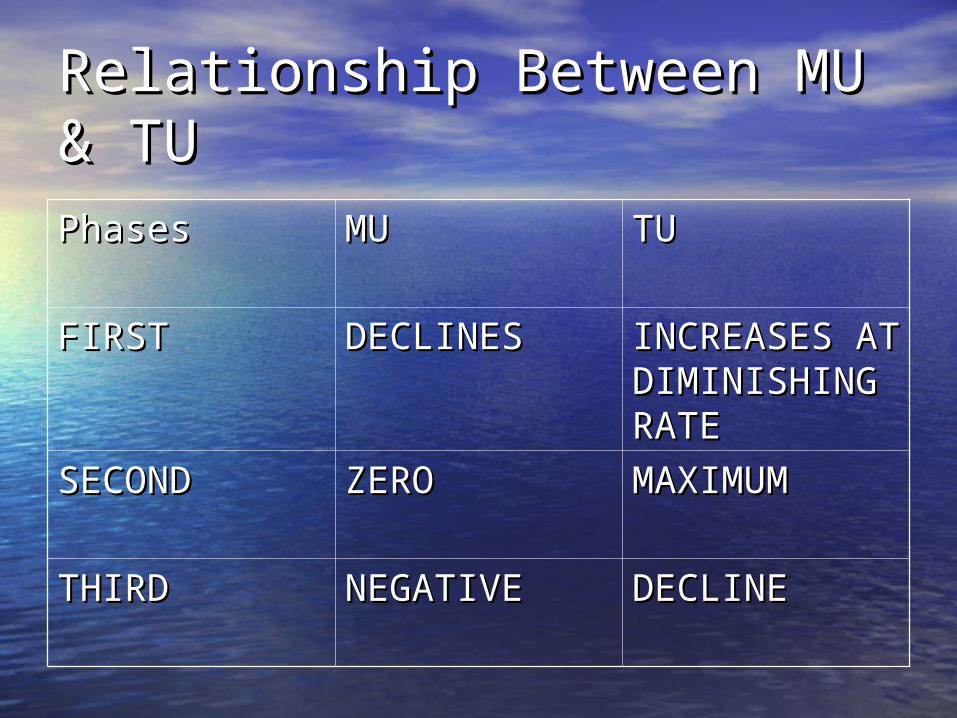
Relationship Between MU & Relationship Between MU & TUTUPhasesPhases MUMU TUTU
FIRSTFIRST DECLINESDECLINES INCREASES INCREASES AT AT DIMINISHING DIMINISHING RATERATE
SECONDSECOND ZEROZERO MAXIMUMMAXIMUM
THIRDTHIRD NEGATIVENEGATIVE DECLINEDECLINE
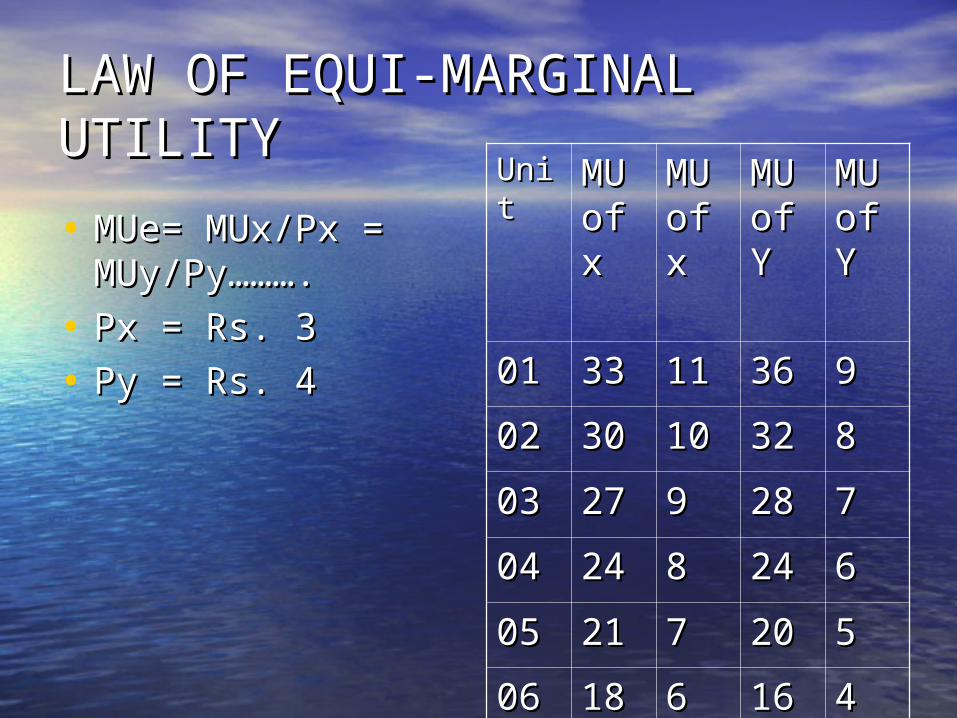
LAW OF EQUI-MARGINAL LAW OF EQUI-MARGINAL UTILITY UTILITY • MUe= MUx/Px = MUe= MUx/Px =
MUy/Py………. MUy/Py………. • Px = Rs. 3Px = Rs. 3• Py = Rs. 4Py = Rs. 4
UnitUnit MUMUof of xx
MUMUof of xx
MUMUof of YY
MUMUof of YY
0101 3333 1111 3636 990202 3030 1010 3232 880303 2727 99 2828 770404 2424 88 2424 660505 2121 77 2020 550606 1818 66 1616 44

CONCEPT OF DEMANDCONCEPT OF DEMAND• Desire to acquire itDesire to acquire it• Willingness to payWillingness to pay• Capability to payCapability to pay• Price, Place and Time. Price, Place and Time.
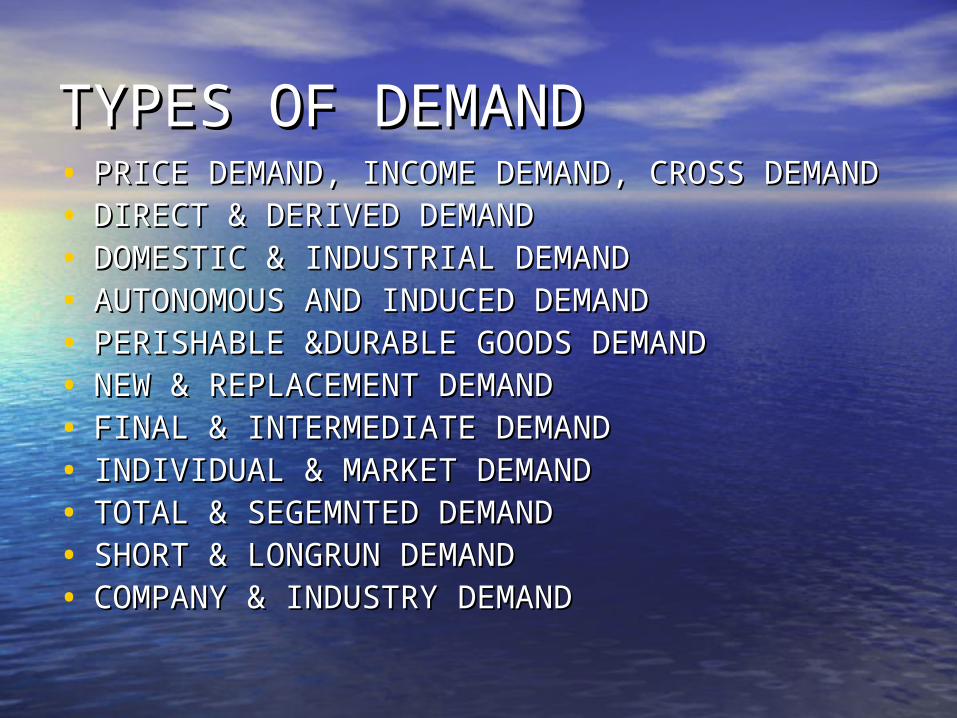
TYPES OF DEMANDTYPES OF DEMAND• PRICE DEMAND, INCOME DEMAND, CROSS DEMANDPRICE DEMAND, INCOME DEMAND, CROSS DEMAND• DIRECT & DERIVED DEMANDDIRECT & DERIVED DEMAND• DOMESTIC & INDUSTRIAL DEMANDDOMESTIC & INDUSTRIAL DEMAND• AUTONOMOUS AND INDUCED DEMANDAUTONOMOUS AND INDUCED DEMAND• PERISHABLE &DURABLE GOODS DEMANDPERISHABLE &DURABLE GOODS DEMAND• NEW & REPLACEMENT DEMANDNEW & REPLACEMENT DEMAND• FINAL & INTERMEDIATE DEMANDFINAL & INTERMEDIATE DEMAND• INDIVIDUAL & MARKET DEMAND INDIVIDUAL & MARKET DEMAND • TOTAL & SEGEMNTED DEMANDTOTAL & SEGEMNTED DEMAND• SHORT & LONGRUN DEMANDSHORT & LONGRUN DEMAND• COMPANY & INDUSTRY DEMANDCOMPANY & INDUSTRY DEMAND
SIGNIFICANCE OF DEMAND ANALYSIS SIGNIFICANCE OF DEMAND ANALYSIS
• PRODUCTION PLANNINGPRODUCTION PLANNING• INVENTORY PLANNINGINVENTORY PLANNING• COST BUDGETINGCOST BUDGETING• PURCHASE PLANNINGPURCHASE PLANNING• PRICING DECISIONSPRICING DECISIONS
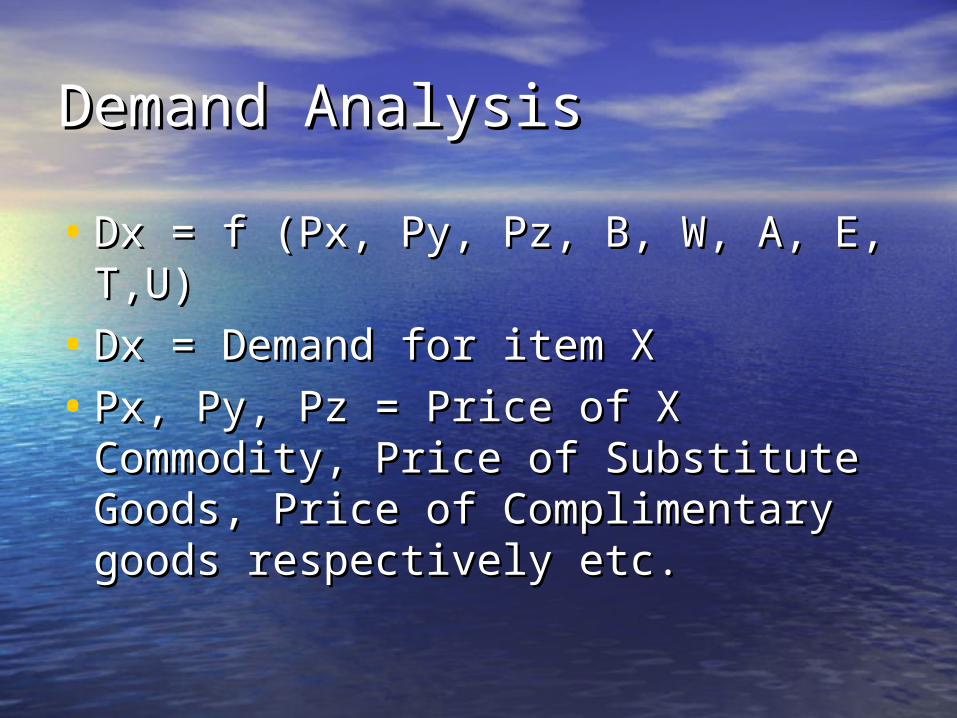
Demand AnalysisDemand Analysis• Dx = f (Px, Py, Pz, B, W, A, E, T,U)Dx = f (Px, Py, Pz, B, W, A, E, T,U)• Dx = Demand for item XDx = Demand for item X• Px, Py, Pz = Price of X Commodity, Px, Py, Pz = Price of X Commodity,
Price of Substitute Goods, Price of Price of Substitute Goods, Price of Complimentary goods respectively Complimentary goods respectively etc. etc.
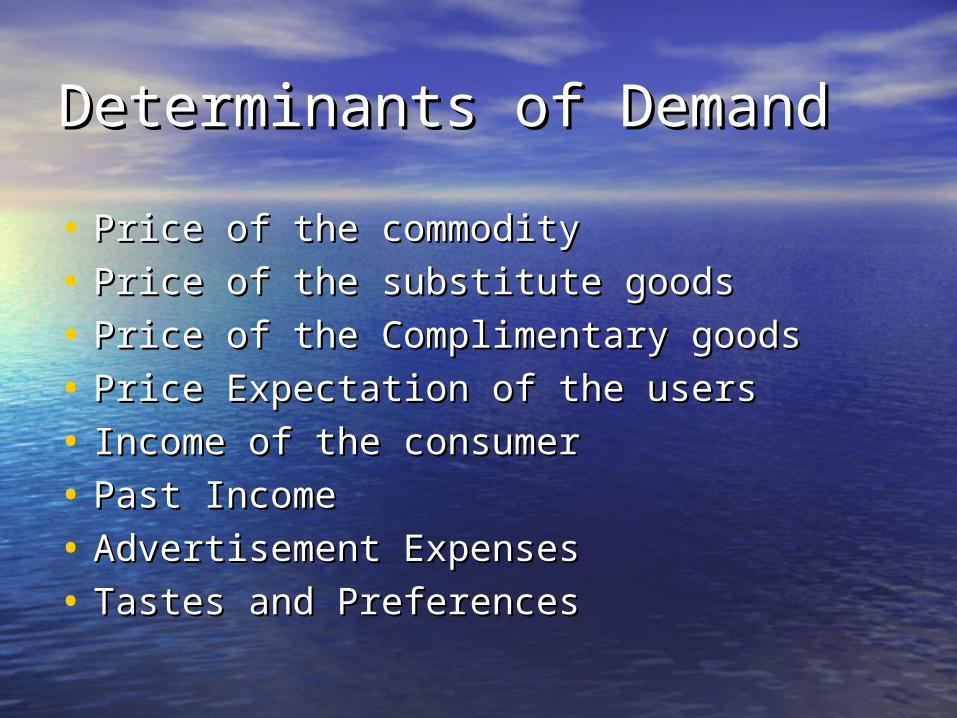
Determinants of DemandDeterminants of Demand• Price of the commodityPrice of the commodity• Price of the substitute goodsPrice of the substitute goods• Price of the Complimentary goodsPrice of the Complimentary goods• Price Expectation of the usersPrice Expectation of the users• Income of the consumerIncome of the consumer• Past IncomePast Income• Advertisement ExpensesAdvertisement Expenses• Tastes and PreferencesTastes and Preferences
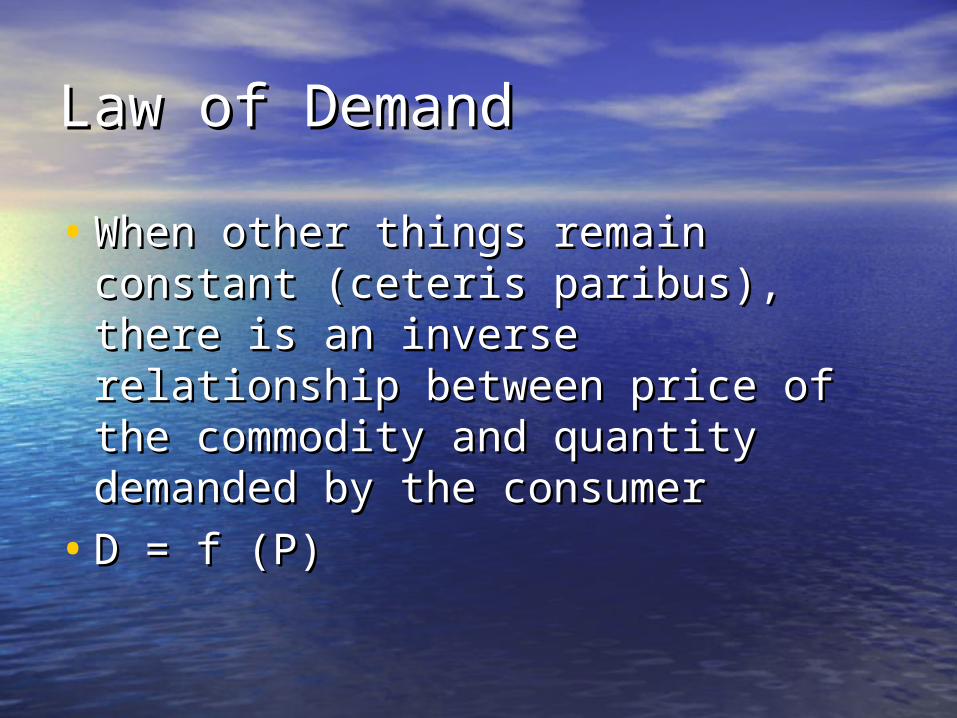
Law of DemandLaw of Demand• When other things remain constant When other things remain constant
(ceteris paribus), there is an inverse (ceteris paribus), there is an inverse relationship between price of the relationship between price of the commodity and quantity demanded commodity and quantity demanded by the consumerby the consumer
• D = f (P) D = f (P)
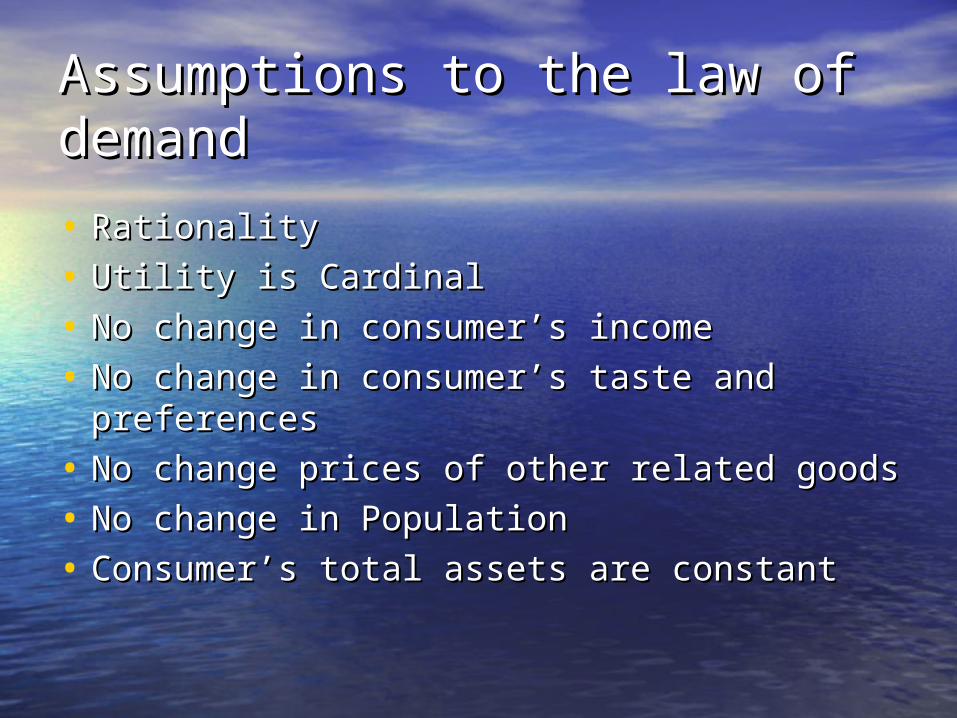
Assumptions to the law of Assumptions to the law of demanddemand• RationalityRationality• Utility is CardinalUtility is Cardinal• No change in consumer’s incomeNo change in consumer’s income• No change in consumer’s taste and No change in consumer’s taste and
preferencespreferences• No change prices of other related goodsNo change prices of other related goods• No change in PopulationNo change in Population• Consumer’s total assets are constantConsumer’s total assets are constant
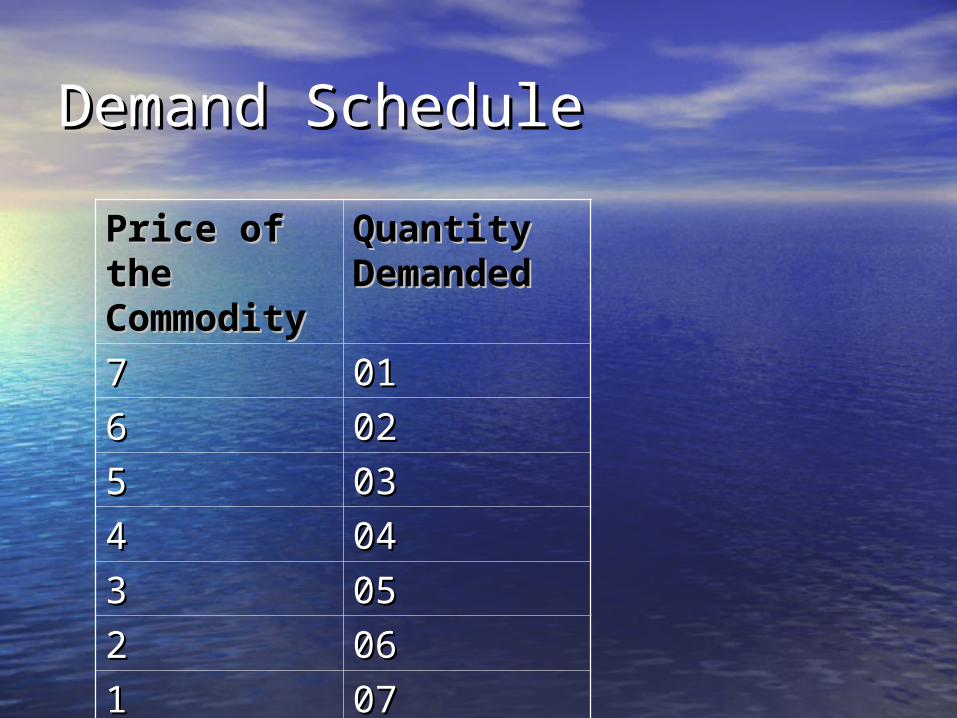
Demand ScheduleDemand SchedulePrice of Price of the the CommoditCommodityy
Quantity Quantity DemandedDemanded
77 010166 020255 030344 040433 050522 060611 0707
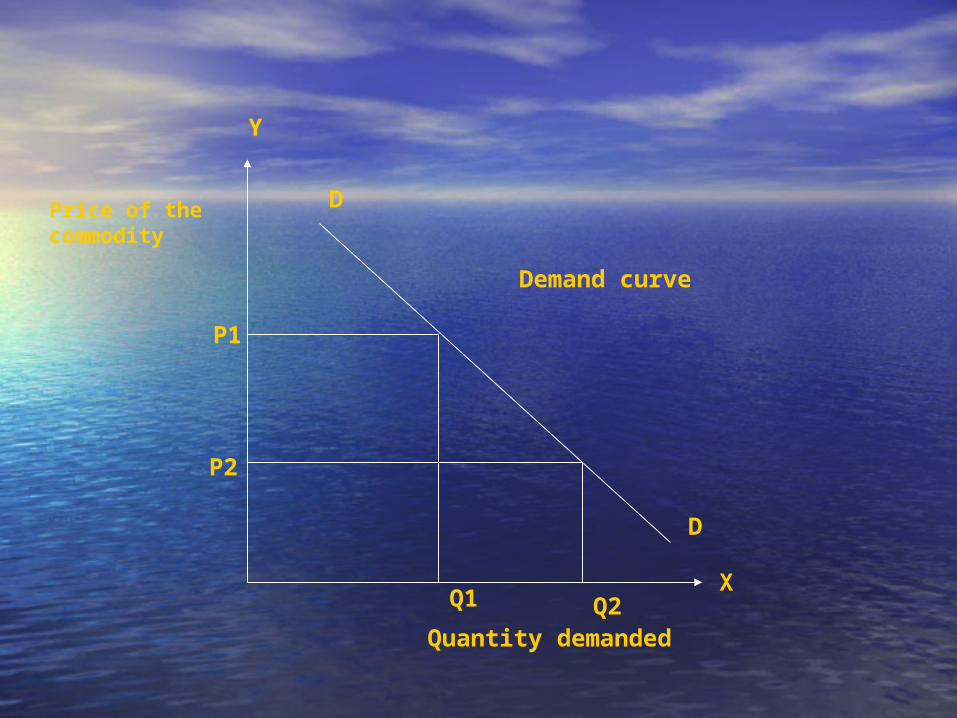
Price of the commodity
Quantity demanded
P1
P2
Q1 Q2
Y
X
Demand curve
D
D
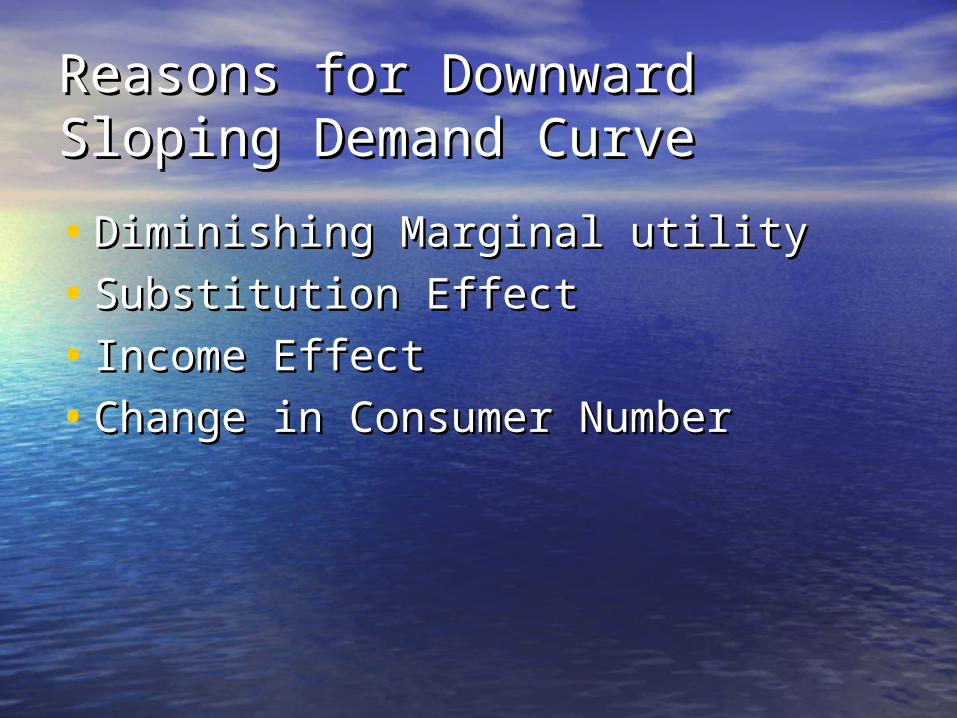
Reasons for Downward Sloping Reasons for Downward Sloping Demand CurveDemand Curve• Diminishing Marginal utilityDiminishing Marginal utility• Substitution EffectSubstitution Effect• Income Effect Income Effect • Change in Consumer NumberChange in Consumer Number
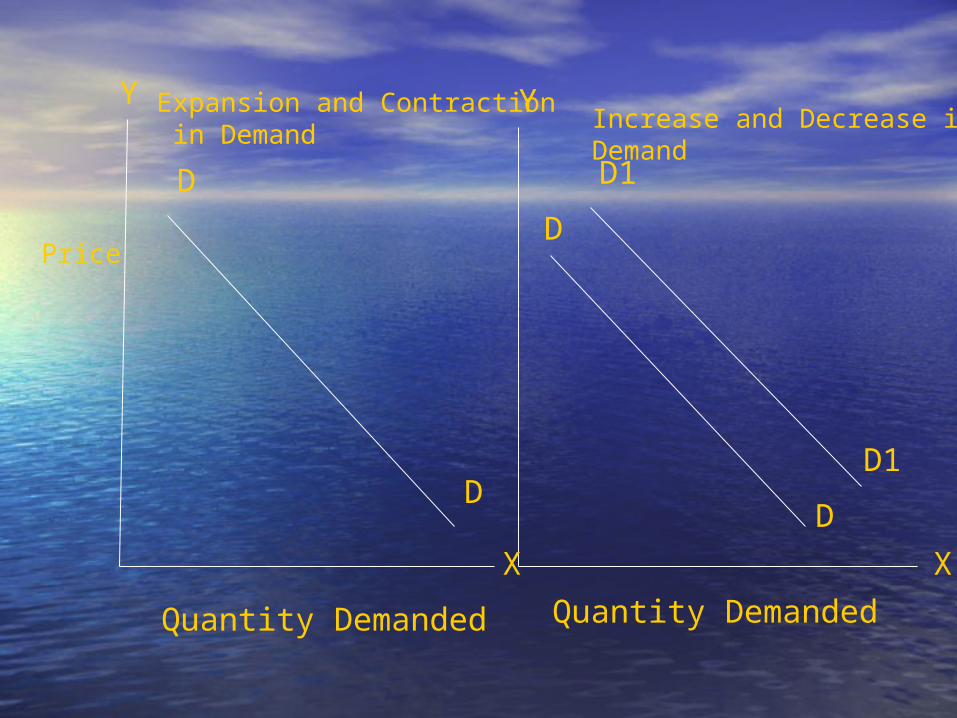
Price
Quantity Demanded Quantity Demanded
D
D
Y
X
Y
X
D
D
D1
D1
Expansion and Contraction in Demand Increase and Decrease in
Demand
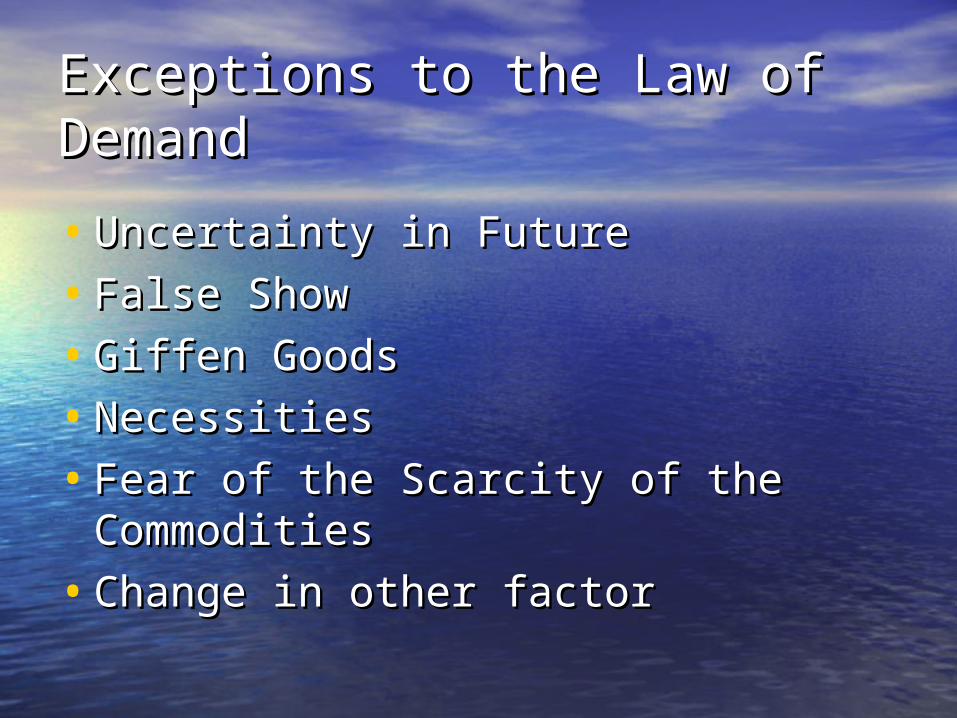
Exceptions to the Law of Exceptions to the Law of DemandDemand• Uncertainty in FutureUncertainty in Future• False ShowFalse Show• Giffen GoodsGiffen Goods• NecessitiesNecessities• Fear of the Scarcity of the Fear of the Scarcity of the
CommoditiesCommodities• Change in other factor Change in other factor
Change in Demand CurvesChange in Demand Curves
•Expansion and Contraction Expansion and Contraction of Demandof Demand
•Increase and Decrease in Increase and Decrease in Demand Demand
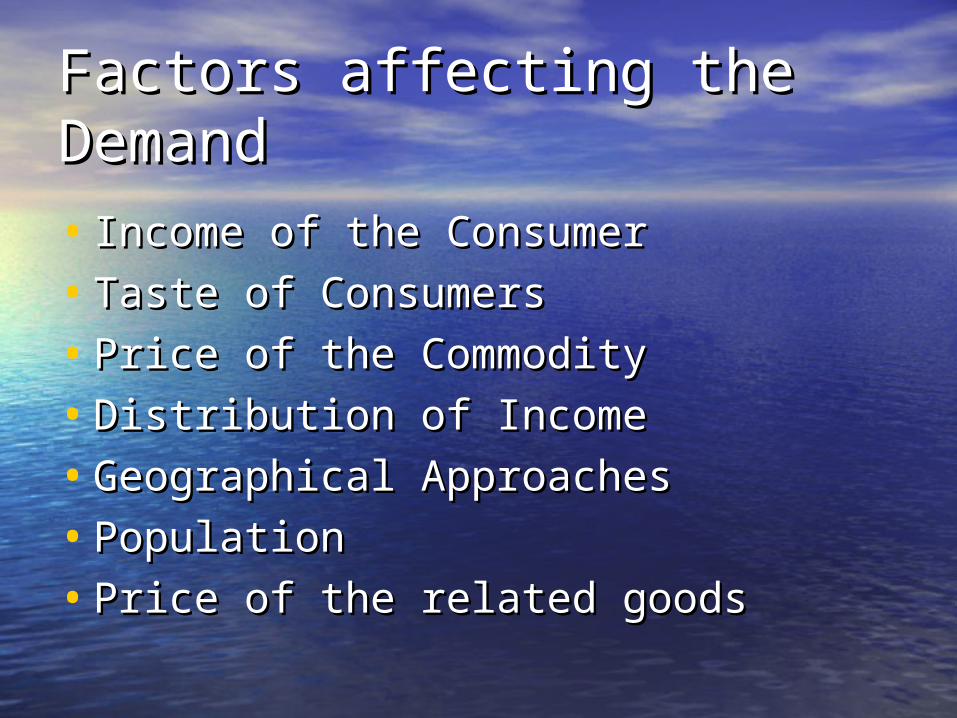
Factors affecting the Factors affecting the DemandDemand• Income of the ConsumerIncome of the Consumer• Taste of ConsumersTaste of Consumers• Price of the CommodityPrice of the Commodity• Distribution of IncomeDistribution of Income• Geographical ApproachesGeographical Approaches• PopulationPopulation• Price of the related goodsPrice of the related goods
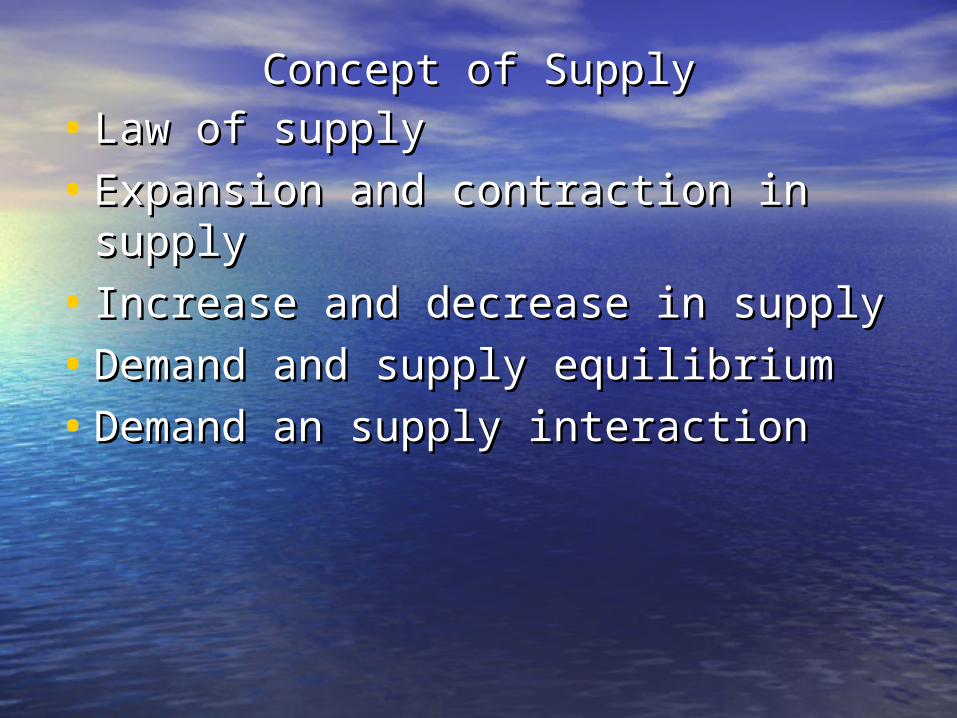
Concept of SupplyConcept of Supply• Law of supplyLaw of supply• Expansion and contraction in supplyExpansion and contraction in supply• Increase and decrease in supplyIncrease and decrease in supply• Demand and supply equilibriumDemand and supply equilibrium• Demand an supply interactionDemand an supply interaction

Demand and supply Demand and supply equilibriumequilibrium
Price of the commodity
Total Quantity Supplied
per month
Total Quantity
demanded per month
Supply or shortage
5 12000 2000 +100004 10000 4000 + 60003 7000 7000 02 4000 11000 -70001 1000 16000 -15000
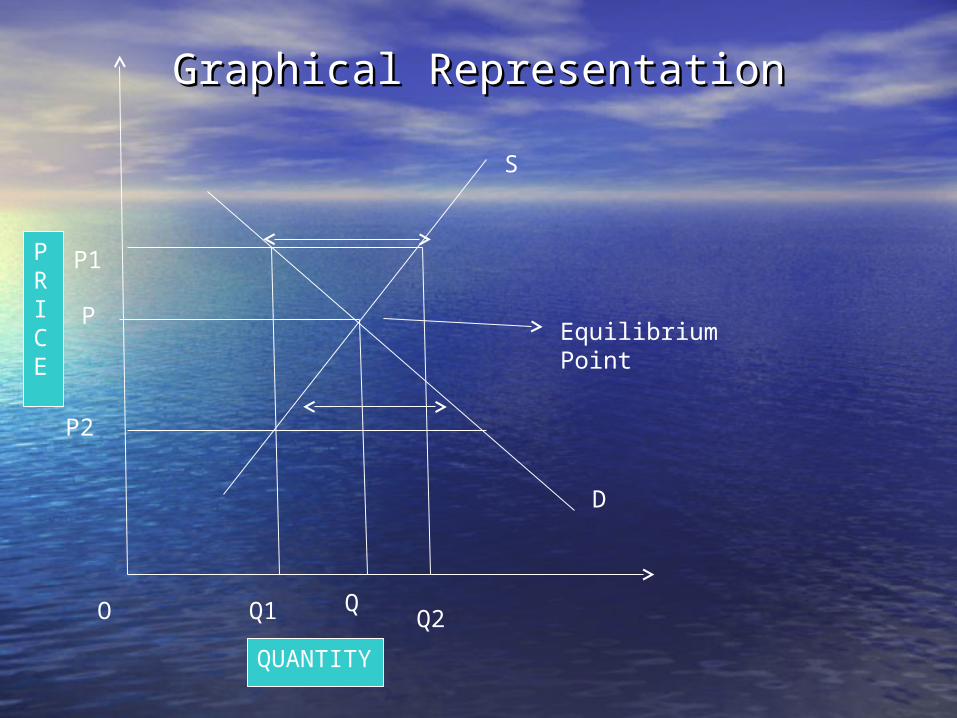
Graphical RepresentationGraphical Representation
PRICE
P1
P
P2
S
D
QUANTITY
O Q1 Q Q2
Equilibrium Point
Elasticity of DemandElasticity of Demand• It measures the rate of change in It measures the rate of change in
consumers responsiveness with consumers responsiveness with respect to change in different factors respect to change in different factors affecting demand.affecting demand.
• Elasticity of Demand = proportionate Elasticity of Demand = proportionate change in Quantity Demanded/ change in Quantity Demanded/ proportionate change in Priceproportionate change in Price
Methods of Elasticity of Methods of Elasticity of DemandDemand• Percentage MethodPercentage Method• Point Elasticity Point Elasticity • Outlay MethodOutlay Method• Graphical MethodGraphical Method
Types of Elasticity of Types of Elasticity of DemandDemand• Price Elasticity of DemandPrice Elasticity of Demand• Income Elasticity of DemandIncome Elasticity of Demand• Cross Elasticity of DemandCross Elasticity of Demand• Advertising Elasticity of DemandAdvertising Elasticity of Demand• Expenditure Elasticity of DemandExpenditure Elasticity of Demand
Price Elasticity of DemandPrice Elasticity of Demand• Price Elasticity of Demand measures Price Elasticity of Demand measures
the degree responsiveness of the degree responsiveness of quantity demanded of a commodity quantity demanded of a commodity to a change in the price.to a change in the price.
• It varies from Zero to infinite. It varies from Zero to infinite.
Degrees of Price Elasticity of Degrees of Price Elasticity of DemandDemand• Perfectly Inelastic DemandPerfectly Inelastic Demand• Relatively Inelastic DemandRelatively Inelastic Demand• Unitary Elastic DemandUnitary Elastic Demand• Relatively Elastic DemandRelatively Elastic Demand• Perfectly Elastic DemandPerfectly Elastic Demand
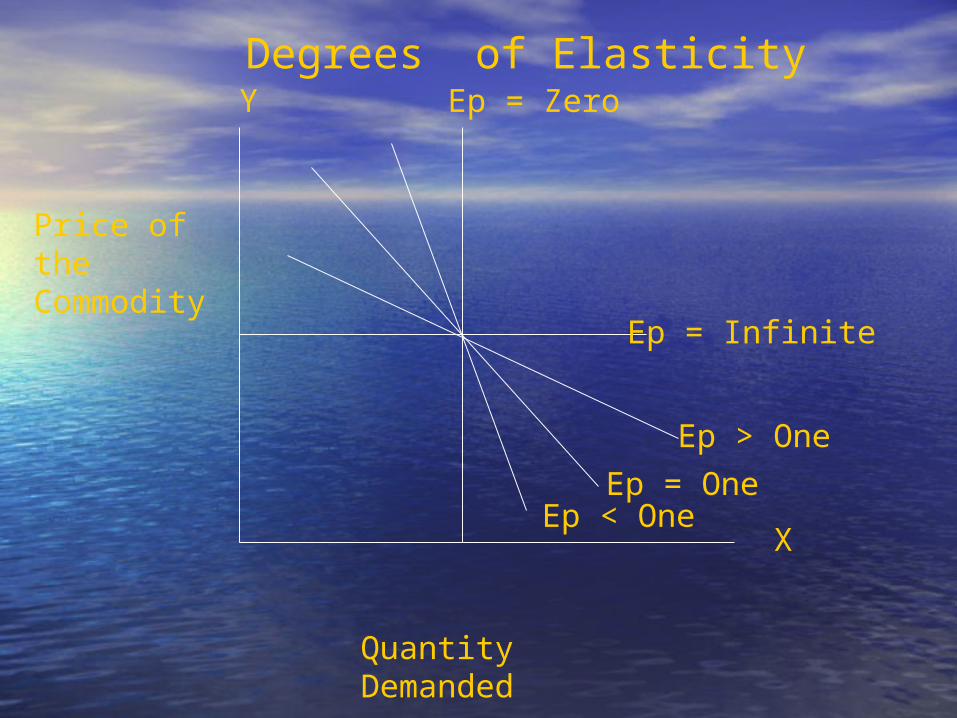
Price of the Commodity
Quantity Demanded
Y
X
Ep = Zero
Ep = Infinite
Ep > OneEp = One
Ep < One
Degrees of Elasticity
Income Elasticity of DemandIncome Elasticity of Demand• It is the measure of responsiveness It is the measure of responsiveness
of quantity demanded to a change in of quantity demanded to a change in income of the consumer.income of the consumer.
• It can be of two types: Positive and It can be of two types: Positive and Negative Income Elasticity of Negative Income Elasticity of Demand.Demand.
Cross Elasticity of DemandCross Elasticity of Demand• When the price of any one When the price of any one
commodity changes and due to this commodity changes and due to this the quantity demanded of another the quantity demanded of another commodity changes, the commodity changes, the measurement of this is called cross measurement of this is called cross elasticity of demandelasticity of demand
Point Elasticity of DemandPoint Elasticity of Demand• It measures a very minute change in It measures a very minute change in
price and then measure the elasticityprice and then measure the elasticity• Ed = Lower segment of Demand Ed = Lower segment of Demand
Curve/Upper segment of Demand Curve/Upper segment of Demand CurveCurve
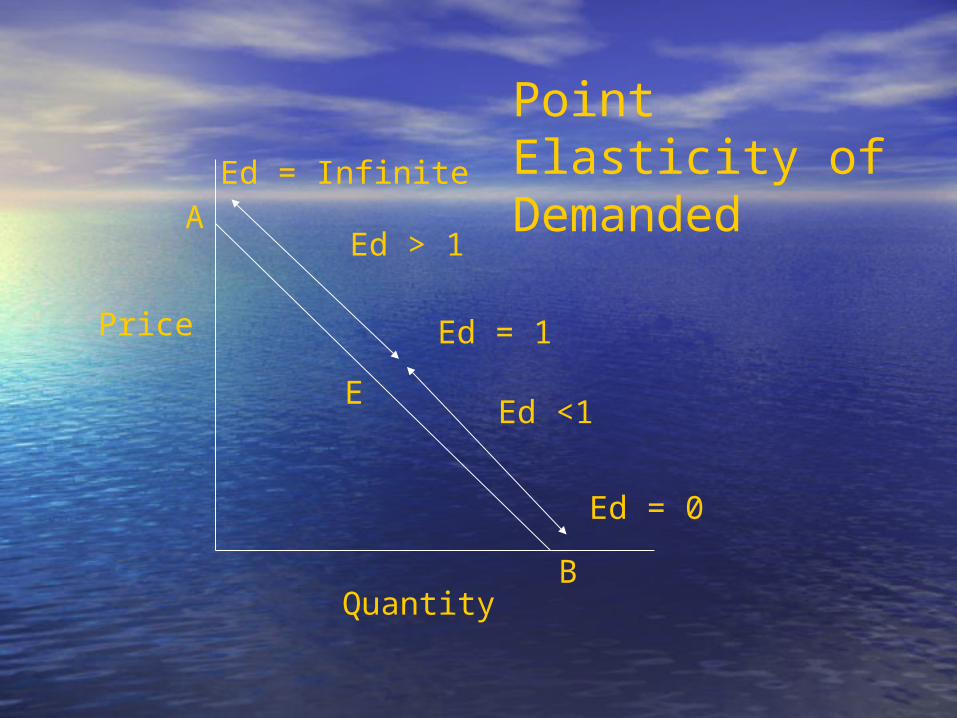
Price
Quantity
A
B
E
Ed = 0
Ed <1
Ed = 1
Ed > 1
Ed = InfinitePoint Elasticity of Demanded
Arc ElasticityArc Elasticity• It measures the responsiveness of It measures the responsiveness of
demand between two points on the demand between two points on the demand curve such as X and Y. In other demand curve such as X and Y. In other words it is a measure of average words it is a measure of average elasticity i.e. the elasticity at the elasticity i.e. the elasticity at the midpoint of the chord that connects the midpoint of the chord that connects the two points on the demand curve defined two points on the demand curve defined by the initial and new price levels. by the initial and new price levels.
Factors affecting Elasticity of Factors affecting Elasticity of DemandDemand
• Nature of CommodityNature of Commodity• Money spent on a commodityMoney spent on a commodity• Availability of SubstitutesAvailability of Substitutes• Multiple uses of a commodityMultiple uses of a commodity• Possibility of Postponement of Possibility of Postponement of
ConsumptionConsumption• Price level and Extent of Price changePrice level and Extent of Price change• Time ElementTime Element
Demand EstimatesDemand Estimates• Market studies and ExperimentationMarket studies and Experimentation• Survey of IntentionsSurvey of Intentions• Statistical Analysis of Historical DataStatistical Analysis of Historical Data• Estimating the quantitative Effects on Estimating the quantitative Effects on
the Demand Curve of changes in the Demand Curve of changes in Determining Forces:Determining Forces:11. Changes over . Changes over Time as Source of Information Time as Source of Information 22. . Different Groups of Consumers as Different Groups of Consumers as Sources of Information Sources of Information
Demand Estimation for New Demand Estimation for New ProductsProducts• Evolutionary ApproachEvolutionary Approach• Substitute ApproachSubstitute Approach• Growth curve ApproachGrowth curve Approach• Sales experience ApproachSales experience Approach• Opinion sampling ApproachOpinion sampling Approach• Vicarious ApproachVicarious Approach
Demand ForecastingDemand Forecasting• Prediction: refers to the more than one Prediction: refers to the more than one
variable analyzed altogether. variable analyzed altogether. • Projection: refers to the single variable at a Projection: refers to the single variable at a
time.time.• Estimation: refers to expected sales level, Estimation: refers to expected sales level,
given the present state of demand given the present state of demand determinantsdeterminants
• Forecasting: refers to the future trend of Forecasting: refers to the future trend of variable. variable.
Passive Forecast: when the firm does not Passive Forecast: when the firm does not change the course of its action.change the course of its action.
• Active Forecast: when the firm changes Active Forecast: when the firm changes the course of its action.the course of its action.
• Purpose of ForecastingPurpose of Forecasting– To avoid over-stockingTo avoid over-stocking– To save the wastage in materialTo save the wastage in material– To save man-hours, machine time & CapacityTo save man-hours, machine time & Capacity– Long term financial planningLong term financial planning– expansion of existing unitsexpansion of existing units– Man power requirements Man power requirements
Steps involved in Steps involved in ForecastingForecasting• First – Identification of ObjectiveFirst – Identification of Objective• Second – determining the nature of Second – determining the nature of
goods under considerationgoods under consideration• Third - Selecting a proper method of Third - Selecting a proper method of
forecastingforecasting• Fourth- Interpretation of resultsFourth- Interpretation of results
Determining scope of a forecasting exerciseDetermining scope of a forecasting exercise• Period of ForecastingPeriod of Forecasting• Short run forecastingShort run forecasting• Medium term forecastingMedium term forecasting• Long run forecastingLong run forecasting• Levels of forecastLevels of forecast• Macro economic forecastMacro economic forecast• Industry demand forecastIndustry demand forecast• firm demand forecastingfirm demand forecasting• product line forecastingproduct line forecasting• General purpose or specific purpose forecast General purpose or specific purpose forecast
Methods of ForecastingMethods of Forecasting
Opinion Polling MethodsOpinion Polling Methods• Consumers’ Survey Consumers’ Survey
MethodMethod Complete Enumeration Complete Enumeration
SurveySurveySample Survey and Test Sample Survey and Test
MarketingMarketingEnd UseEnd Use• Sales Force Opinion Sales Force Opinion
MethodMethod• Expert Opinion Method Expert Opinion Method
Statistical MethodsStatistical Methods• Trend Projection Trend Projection
MethodMethod• Barometric Barometric
TechniquesTechniques• Regression MethodRegression Method• Simultaneous Simultaneous
Equation MethodEquation Method
Trend Projection MethodTrend Projection Method• Fitting Trend Line by Fitting Trend Line by
ObservationObservation• Least Squares Linear Least Squares Linear
RegressionRegression Straight LineStraight Line ParabolicParabolic Logarithmic or Logarithmic or
ExponentialExponential• Time Series AnalysisTime Series Analysis• Moving Average and Moving Average and
Annual DifferenceAnnual Difference• Exponential SmoothingExponential Smoothing• ARIMA MethodARIMA Method
Barometric TechniquesBarometric Techniques• Leading, Lagging and Leading, Lagging and
Coincident IndicatorsCoincident Indicators• Diffusion IndicesDiffusion Indices
Meaning of ProductionMeaning of Production• Prof. J. R. Hicks, “ Production may be Prof. J. R. Hicks, “ Production may be
defined as any activity, whether defined as any activity, whether physical or mental, which is directed physical or mental, which is directed to the satisfaction of other peoples to the satisfaction of other peoples wants through exchange. wants through exchange.
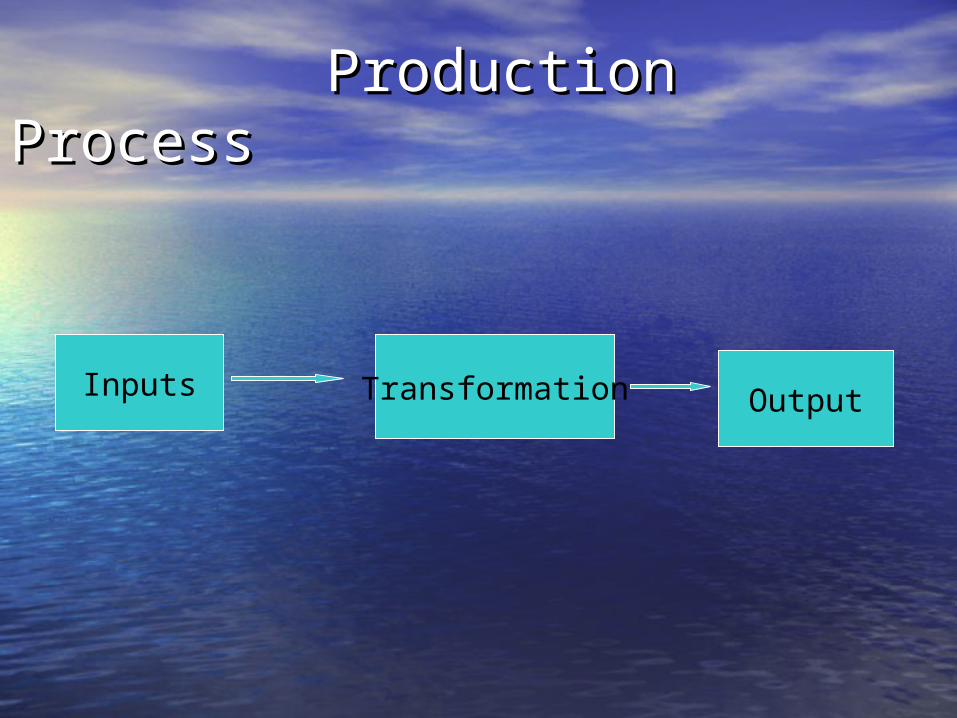
Production ProcessProduction Process
Inputs Transformation Output
Factors of ProductionFactors of Production
•Land Land •LaborLabor•CapitalCapital•EntrepreneurshipEntrepreneurship
Characteristics of Factors of Characteristics of Factors of ProductionProduction• Complementarity Complementarity • SubstutabilitySubstutability• SpecificitySpecificity• MobilityMobility
Laws of ProductionLaws of Production• Laws of Variable ProportionsLaws of Variable Proportions• Laws of Returns to ScaleLaws of Returns to Scale
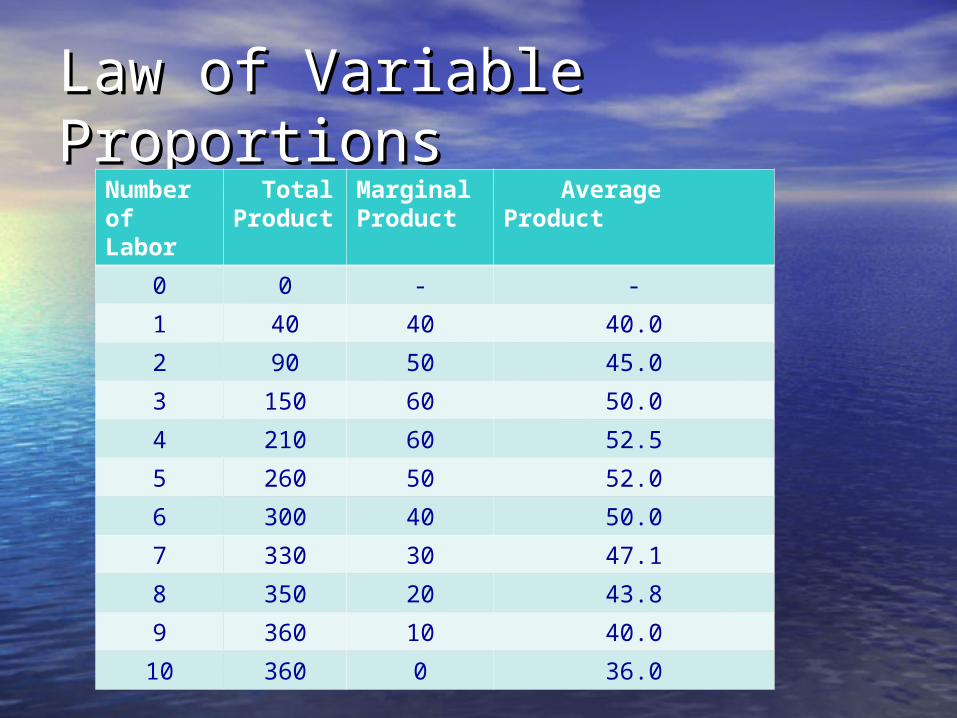
Law of Variable ProportionsLaw of Variable ProportionsNumber of Labor
Total Product
Marginal Product
Average Product
0 0 - -1 40 40 40.02 90 50 45.03 150 60 50.04 210 60 52.55 260 50 52.06 300 40 50.07 330 30 47.18 350 20 43.89 360 10 40.010 360 0 36.0
Assumptions of the Law Assumptions of the Law • Only one factor is increased while Only one factor is increased while
others are kept constant.others are kept constant.• The various units of the variable The various units of the variable
factor are homogeneous.factor are homogeneous.• Conditions of production like Conditions of production like
production production method,technique,climatic conditions method,technique,climatic conditions are constant. are constant.
Laws of Variables Laws of Variables ProportionsProportions• Law of increasing returnsLaw of increasing returns• Law of decreasing returns Law of decreasing returns • Law of constant returnsLaw of constant returns
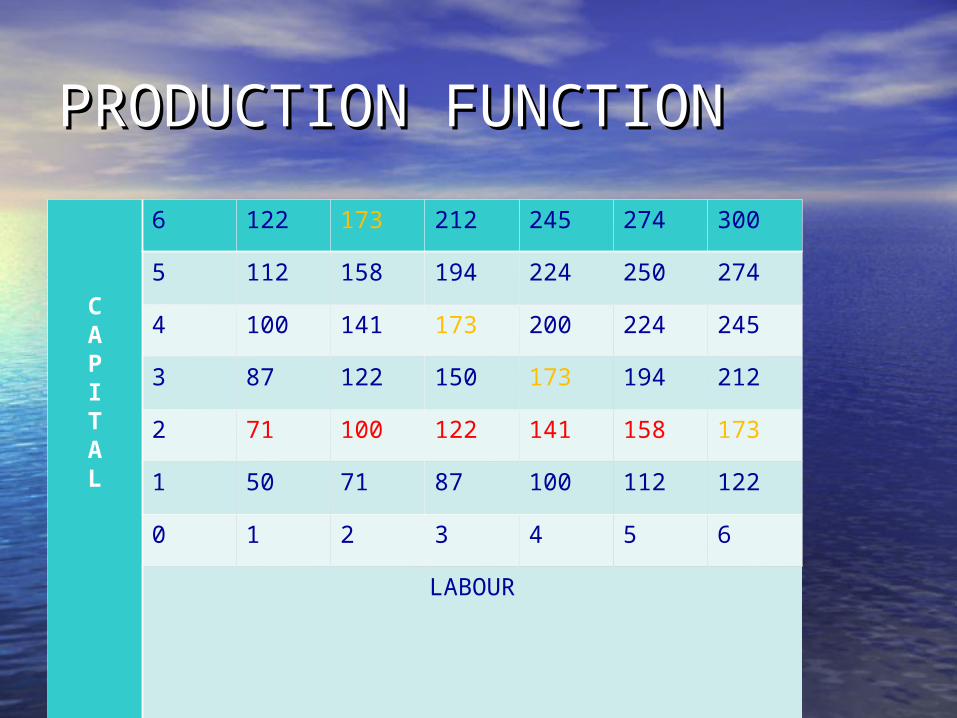
PRODUCTION FUNCTIONPRODUCTION FUNCTION
CAPITAL
6 122 173 212 245 274 3005 112 158 194 224 250 2744 100 141 173 200 224 2453 87 122 150 173 194 2122 71 100 122 141 158 1731 50 71 87 100 112 1220 1 2 3 4 5 6
LABOUR
Cobb-Douglas Production Cobb-Douglas Production Function Function • Diminishing Returns to a factorDiminishing Returns to a factor• Constant returns to scale Constant returns to scale
Economies of large scale Economies of large scale productionproduction• Internal economies of scaleInternal economies of scale Labor economiesLabor economies Purchase economiesPurchase economies Marketing economiesMarketing economies Financial economiesFinancial economiesTechnological economiesTechnological economies Managerial economies Managerial economies
Continue…Continue…
• External economies of scaleExternal economies of scaleEconomies of concentrationEconomies of concentrationEconomies of InformationEconomies of InformationEconomies of research and Economies of research and
developmentdevelopmentEconomies of NegotiationEconomies of Negotiation
Cost of ProductionCost of Production• Average Total CostAverage Total Cost• Average Fixed CostAverage Fixed Cost• Average Variable CostAverage Variable Cost• Fixed CostFixed Cost• Variable CostVariable Cost• Marginal CostMarginal Cost• Long run average cost curveLong run average cost curve
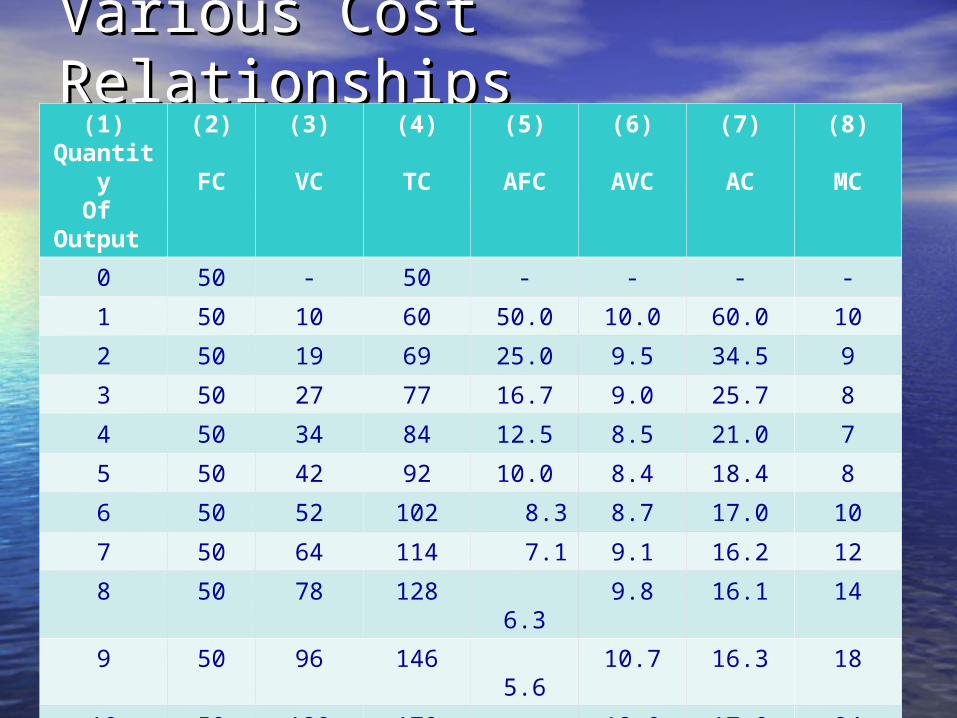
Various Cost RelationshipsVarious Cost Relationships(1)
Quantity
Of Output
(2)
FC
(3)
VC
(4)
TC
(5)
AFC
(6)
AVC
(7)
AC
(8)
MC
0 50 - 50 - - - -1 50 10 60 50.0 10.0 60.0 102 50 19 69 25.0 9.5 34.5 93 50 27 77 16.7 9.0 25.7 84 50 34 84 12.5 8.5 21.0 75 50 42 92 10.0 8.4 18.4 86 50 52 102 8.3 8.7 17.0 107 50 64 114 7.1 9.1 16.2 128 50 78 128 6.3 9.8 16.1 149 50 96 146 5.6 10.7 16.3 1810 50 120 170 5.0 12.0 17.0 24
Break Even AnalysisBreak Even Analysis• It is that minimum level of output or It is that minimum level of output or
sales which is necessary to avoid sales which is necessary to avoid losses.losses.
• AssumptionsAssumptions total cost of the firm can be clearly divided total cost of the firm can be clearly divided
into fixed costs and variable costs.into fixed costs and variable costs. the fixed cost remain fixed.the fixed cost remain fixed. the variable cost changes at a constant rate.the variable cost changes at a constant rate. constant inputs costsconstant inputs costs the firm is a single manufacturing firm.the firm is a single manufacturing firm.
Different Types of MarketDifferent Types of Market• Perfect Competition MarketPerfect Competition Market• Monopolistic Competition Monopolistic Competition • OligopolyOligopoly• Monopoly Monopoly
Perfect Competition market Perfect Competition market characteristicscharacteristics• Large number of buyers and sellersLarge number of buyers and sellers• Homogeneity of productHomogeneity of product• Free entry and exit in the marketFree entry and exit in the market• Perfect knowledge of the marketPerfect knowledge of the market• No discriminationNo discrimination
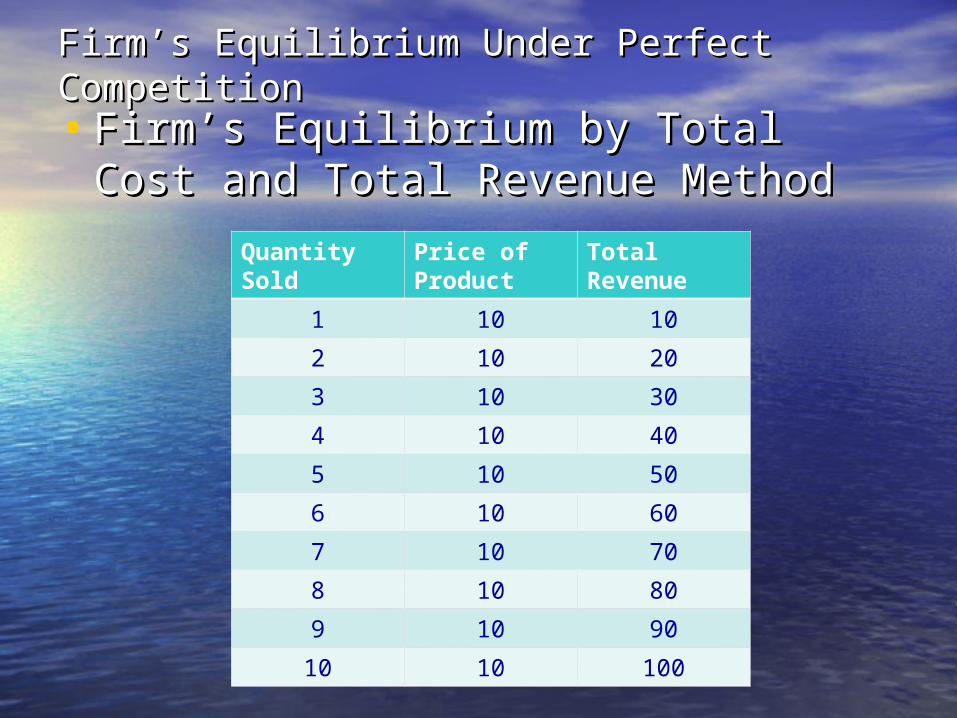
Firm’s Equilibrium Under Perfect Firm’s Equilibrium Under Perfect CompetitionCompetition• Firm’s Equilibrium by Total Cost and Firm’s Equilibrium by Total Cost and
Total Revenue MethodTotal Revenue MethodQuantity Sold
Price of Product
Total Revenue
1 10 102 10 203 10 304 10 405 10 506 10 607 10 708 10 809 10 9010 10 100
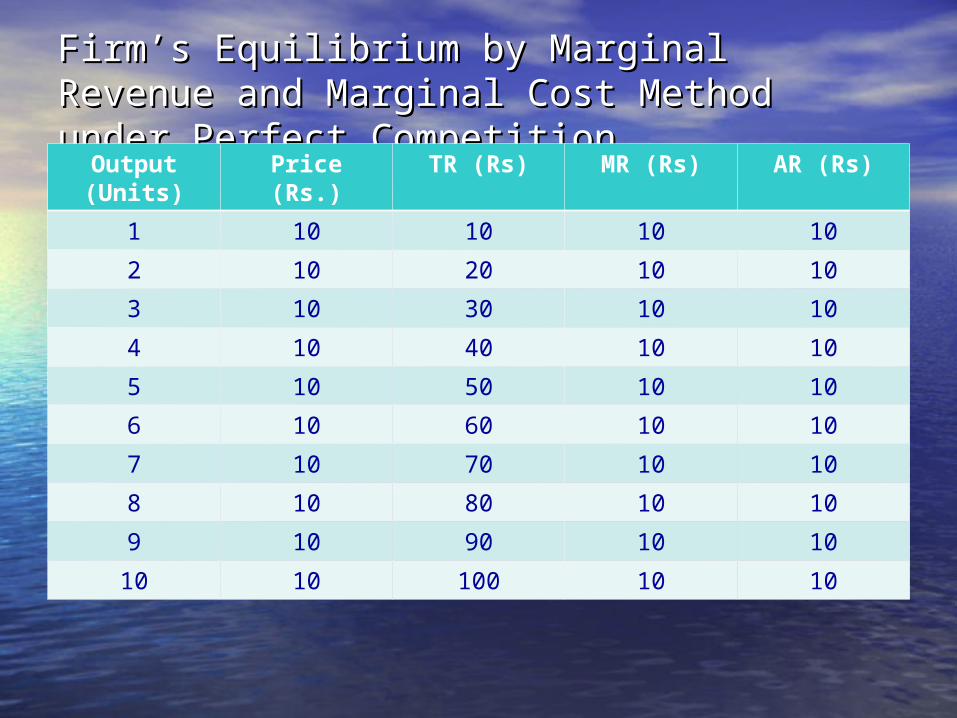
Firm’s Equilibrium by Marginal Revenue and Firm’s Equilibrium by Marginal Revenue and Marginal Cost Method under Perfect Marginal Cost Method under Perfect CompetitionCompetition
Output (Units)
Price (Rs.) TR (Rs) MR (Rs) AR (Rs)
1 10 10 10 102 10 20 10 103 10 30 10 104 10 40 10 105 10 50 10 106 10 60 10 107 10 70 10 108 10 80 10 109 10 90 10 1010 10 100 10 10
Monopoly MarketMonopoly Market• When there is only one seller in the When there is only one seller in the
marketmarket• The distinction between firm and The distinction between firm and
market disappearsmarket disappears• Railways is an example of a Railways is an example of a
monopoly market in India monopoly market in India
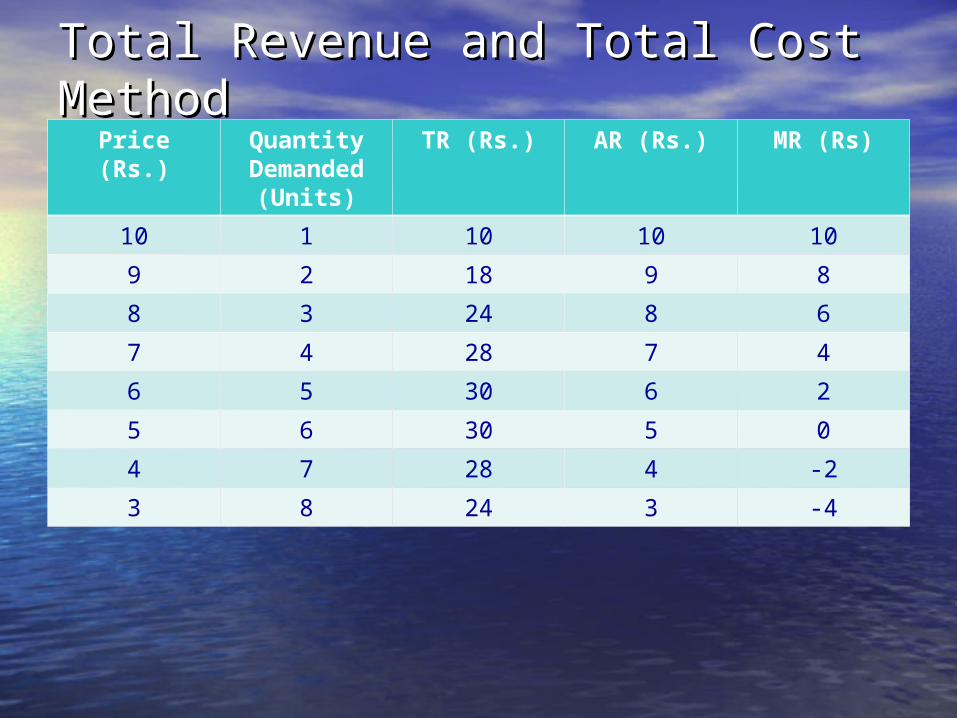
Total Revenue and Total Cost Total Revenue and Total Cost MethodMethodPrice (Rs.) Quantity
Demanded (Units)
TR (Rs.) AR (Rs.) MR (Rs)
10 1 10 10 109 2 18 9 88 3 24 8 67 4 28 7 46 5 30 6 25 6 30 5 04 7 28 4 -23 8 24 3 -4
Monopoly Firm’s By Marginal Monopoly Firm’s By Marginal Method Method • MC, AC, MR and AR curves are usedMC, AC, MR and AR curves are used• AR curve will lie on the demand AR curve will lie on the demand
curve of the firm curve of the firm • The conditions for firm’s equilibrium:The conditions for firm’s equilibrium:• MR = MCMR = MC• MC must cut MR from below of it. MC must cut MR from below of it.
Price Discrimination in Price Discrimination in MonopolyMonopoly• It is a situation where a seller charges It is a situation where a seller charges
different prices from different different prices from different customers for the same product.customers for the same product.
• It is possible It is possible Monopoly MarketMonopoly Market elasticity of demand is different in the elasticity of demand is different in the
two marketstwo markets the commodity or service being sold is the commodity or service being sold is
not transferable between persons and not transferable between persons and markets.markets.
Monopolistic MarketMonopolistic Market• Monopolistic competition is that market Monopolistic competition is that market
in which firms compete with each other in which firms compete with each other but it is not like a perfectly competitive but it is not like a perfectly competitive market.market.
• Characteristics:Characteristics: the no. of firms is large, but it is not as the no. of firms is large, but it is not as
large as in perfect competition.large as in perfect competition. Goods are similar but not homogeneous.Goods are similar but not homogeneous.Entry and exit is easy and there are no Entry and exit is easy and there are no
significant barriers.significant barriers.Price is not the only basis of competition Price is not the only basis of competition
between different sellers. between different sellers.
Pricing Policy in PracticePricing Policy in Practice• Mark-up PricingMark-up Pricing• Marginal Cost PricingMarginal Cost Pricing• Going Rate PricingGoing Rate Pricing• Penetration Pricing/ Predatory PricingPenetration Pricing/ Predatory Pricing• Skimming Pricing Skimming Pricing • Limit Pricing: it is adopted to prevent the Limit Pricing: it is adopted to prevent the
entry of other firms by existing producers in entry of other firms by existing producers in the market.the market.
• Discriminatory PricingDiscriminatory Pricing• Differential PricingDifferential Pricing• Product line PricingProduct line Pricing• Psychological PricingPsychological Pricing• Two Part PricingTwo Part Pricing
Oligopoly MarketOligopoly Market• It is a market form in which the number of It is a market form in which the number of
sellers is quite few and they are affected sellers is quite few and they are affected by the behavior of each other.by the behavior of each other.
• Characteristics:Characteristics:Difficulties in oligopoly forms, Difficulties in oligopoly forms,
Differentiated and Undifferentiated.Differentiated and Undifferentiated.Uncertainty in behaviorUncertainty in behavior Mutual interdependence amongst Mutual interdependence amongst
different firms.(Price Rigidity and Kinked different firms.(Price Rigidity and Kinked Demand Curve)Demand Curve)
Non- Price Competition is more prominent Non- Price Competition is more prominent than price competition than price competition
DefinitionDefinition• Macro Economics, is a study of Macro Economics, is a study of
aggregates or the study of a system as a aggregates or the study of a system as a whole in which different micro units are whole in which different micro units are operating. Accordingly, when we study operating. Accordingly, when we study the behavior of a country’s economy, the behavior of a country’s economy, which consists of different consumers, which consists of different consumers, producers(firms), markets and industries, producers(firms), markets and industries, we are in the domain of ‘Macro we are in the domain of ‘Macro Economics’.Economics’.
Characteristics Characteristics • Study of aggregatesStudy of aggregates• Dynamic in natureDynamic in nature• Individual an collective problems are Individual an collective problems are
different. e.g. problem of unemployment different. e.g. problem of unemployment for an individual and general for an individual and general unemployment.unemployment.
• Paradox of thriftParadox of thrift
Functioning of a Macro Economic of a Macro Economic System System • There is a very high degree of There is a very high degree of
interdependence between the two interdependence between the two segments of the economy and it is in segments of the economy and it is in the interest of everybody to keep the the interest of everybody to keep the circular flow moving without any circular flow moving without any obstruction.obstruction.
• The flow of income is circular. It means The flow of income is circular. It means that money is in continuous motion that money is in continuous motion and any payment made by any sector and any payment made by any sector comes back to it after sometimes. comes back to it after sometimes.
NATIONAL INCOMENATIONAL INCOME• It is a flow concept.• It is always in monetary terms.• It is total value of goods and services
produced annually in a country.• It includes payments made to all
resources in the form of wages,interest, rent and profits.
DIFFERENT CONCEPTS OF NATIONAL DIFFERENT CONCEPTS OF NATIONAL INCOMEINCOME •Gross National Product: It is the total
measure of the flow of goods and services at market value resulting from current production during a year in a country, including net income from abroad.
•GNP at FC= GNP at MP – Ind.taxes+ Sub.
•NNP = GNP – Depreciation
Continue… Continue… • Private Income= NI+ Transfer
Payments+Int. on Public Debt – Social Security – Profits & Surpluses of Public Undertakings.
• Personal Income= Pri. I – Undistributed Corporate Profits – Profits Taxes
• Disposable Income= Personal Income – Direct Taxes
• Discretionary Income= DI- compulsory savings and loan repayment.
• Per Capita Income
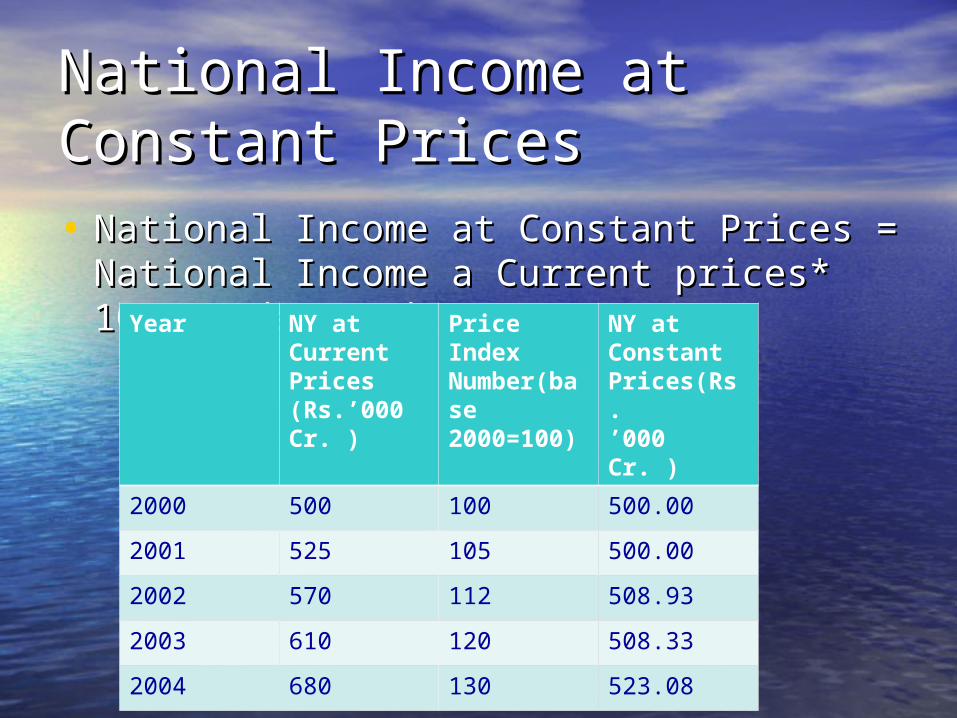
National Income at Constant National Income at Constant PricesPrices• National Income at Constant Prices = National Income at Constant Prices =
National Income a Current prices* 100/ National Income a Current prices* 100/ Index NumberIndex NumberYear NY at
Current Prices (Rs.’000 Cr. )
Price Index Number(base 2000=100)
NY at Constant Prices(Rs.’000 Cr. )
2000 500 100 500.002001 525 105 500.002002 570 112 508.932003 610 120 508.332004 680 130 523.08
Methods to Measure Methods to Measure National IncomeNational Income• Production MethodProduction Method• Income MethodIncome Method• Expenditure MethodExpenditure Method
Consumption FunctionConsumption Function• Consumption is a function of Income.Consumption is a function of Income.• C= a+bY, C= C= a+bY, C=
consumption=minimum level of consumption=minimum level of consumption,b=MPC,Y=incomesconsumption,b=MPC,Y=incomes
• MPCMPC• MPSMPS
Investment functionInvestment function• I=d + eYI=d + eY• Where, I = Total Investment Amount,Where, I = Total Investment Amount,• d= autonomous investment,d= autonomous investment,• e= the marginal rate of increase of e= the marginal rate of increase of
investment on account of increase in investment on account of increase in incomeincome
• Y = Level of incomeY = Level of income
MultiplierMultiplier• It gives the ratio between increase in It gives the ratio between increase in
national income and increase in national income and increase in investment.investment.
• Multiplier=1/1-MPC=1/MPSMultiplier=1/1-MPC=1/MPS
Inflation Inflation • When too much money chasing too When too much money chasing too
few goods.few goods.• Type of Inflation: Type of Inflation: • Creeping InflationCreeping Inflation• Walking InflationWalking Inflation• Running InflationRunning Inflation• Hyper InflationHyper Inflation
Measurement of changes in Price LevelMeasurement of changes in Price Level• Three methods to calculate index Three methods to calculate index
based:based:• Wholesale Price IndexWholesale Price Index• Consumer Price IndexConsumer Price Index• Producers’ Price Index Producers’ Price Index
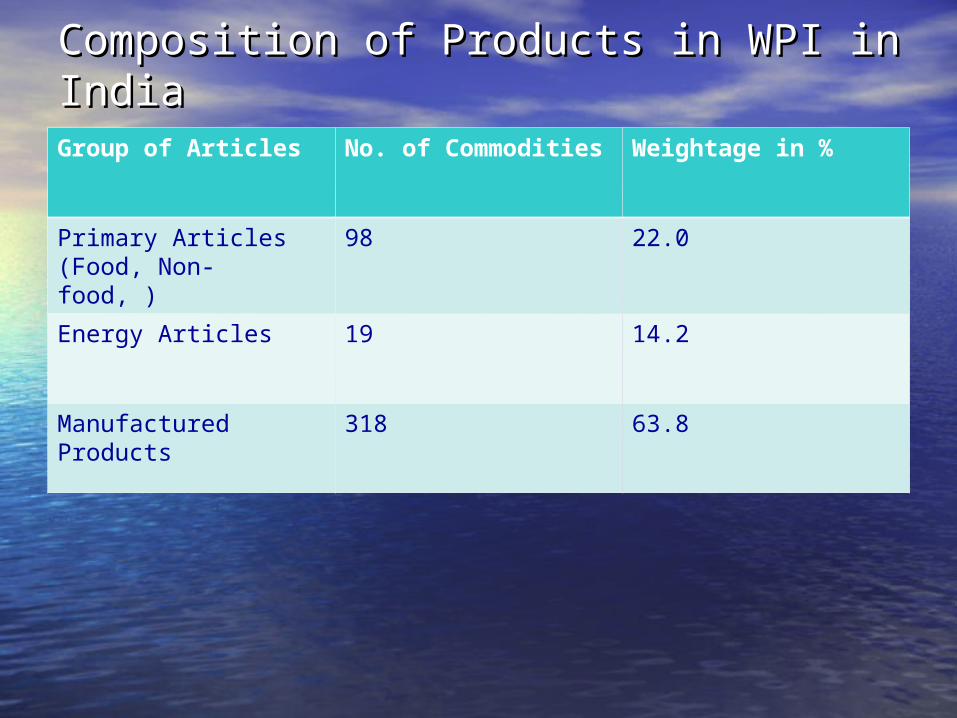
Composition of Products in WPI in India Composition of Products in WPI in India Group of Articles No. of Commodities
Weightage in %
Primary Articles (Food, Non- food, )
98 22.0
Energy Articles 19 14.2
Manufactured Products
318 63.8