Embed Size (px)
Citation preview

Unit 3
Demand Analysis - II
Objectives:
After going through this unit, you will be able to explain:
Meaning and factors influencing demand
Law of demand, its explanations, applications and exceptions
Types of changes in demand
Concept and types of elasticity of demand
Meaning and uses of price, income, and cross elasticity of demand
Structure:
1.1 Introduction
1.2 Demand Concepts
1.3 Law of demand
1.4 Exceptions to the Law of demand
1.5 Factors affecting Demand
1.6 Changes in Demand – Expansion/Contraction and Increase/Decrease
1.7 Elasticity and Demand
1.8 Price elasticity of demand
1.9 Factors affecting price elasticity of demand
1.10 Types of price elasticity of demand
1.11 Business applications of price elasticity of demand
1.12 Other types of elasticity of demand
1.13 Income elasticity of demand
1.14 Factors affecting income elasticity of demand
1.15 Cross elasticity of demand
1.16 Summary
1.17 Key words
1.18 Self assessment questions

1.1 Introduction
Managerial decision making necessarily occurs within any of the organizational forms
that modern business enterprises may take. Managers may make a myriad of decisions
ranging from day to day operational decisions to long term tactical decisions. Managerial
economics aids in rational decision making by managers of business enterprises. One
important tool in this regard helps managers understand consumer needs and wants, so as
to enable building innate capabilities in businesses to fulfill them in the best possible
manner. This requires knowing more about the economic concept of Demand.
1.2 Demand – Concepts
The study of economics makes it necessary to distinguish between demand and the desire
or need. To keep it simple, let us think of buyers as consumers. The buyers want or need
the product or service, but there is more to demand then just the need or desire for goods
and services. To say that a person has a demand for a particular product is to say that the
person also,
a) has the money with which to buy, and
b) is eager to exchange the money for the specific commodity
People will not demand what they do not want or need, but a want or a need not
supported by purchasing power is not consumer demand. This leads us to the definition
of demand which is as follows,
a) Demand refers to how much (quantity) of a product or service is desired by
buyers at a given price.
b) Demand is the relationship between price and quantity demanded for a particular
good and service in particular circumstances.
c) The word demand refers to the willingness and ability of people to purchase
goods or services in the market.

All definitions and perspectives on demand highlight two important characteristics of
economic demand, viz,
a) Ability to purchase
b) Willingness to purchase
Demand or the demand relationship is popularly depicted through the Law of Demand
and can be expressed in the form of a demand schedule and a demand curve.
1.3 Law of Demand
We have already established that a consumer’s demand cannot be expressed independent
of the price of the product. How much of a commodity the consumer will be willing to
buy is dependent on its price. We will add to it now by saying that it is only logical that a
consumer will tend to buy more of a commodity if the price is less, and less of it if the
price is more. This is called the Law of Demand. To put it more formally,
The law of demand states that, if all other factors remain equal, the higher the price of a
good, the less people will demand that good. In other words, at higher prices, a lower
quantity will be demanded than at lower prices, other things being equal. Alternatively, at
lower prices, a higher quantity will be demanded, other things being equal.
An elementary way to capture the relationship is in the form of a demand schedule as
shown in the following table. The numbers in the table below are what one expects in a
demand curve: as price goes up, the amount people are willing to buy decreases.
Demand SchedulePrice
(in Rs.)
Quantity demanded
(in units)10 10020 90
30 8040 7050 6060 5070 40
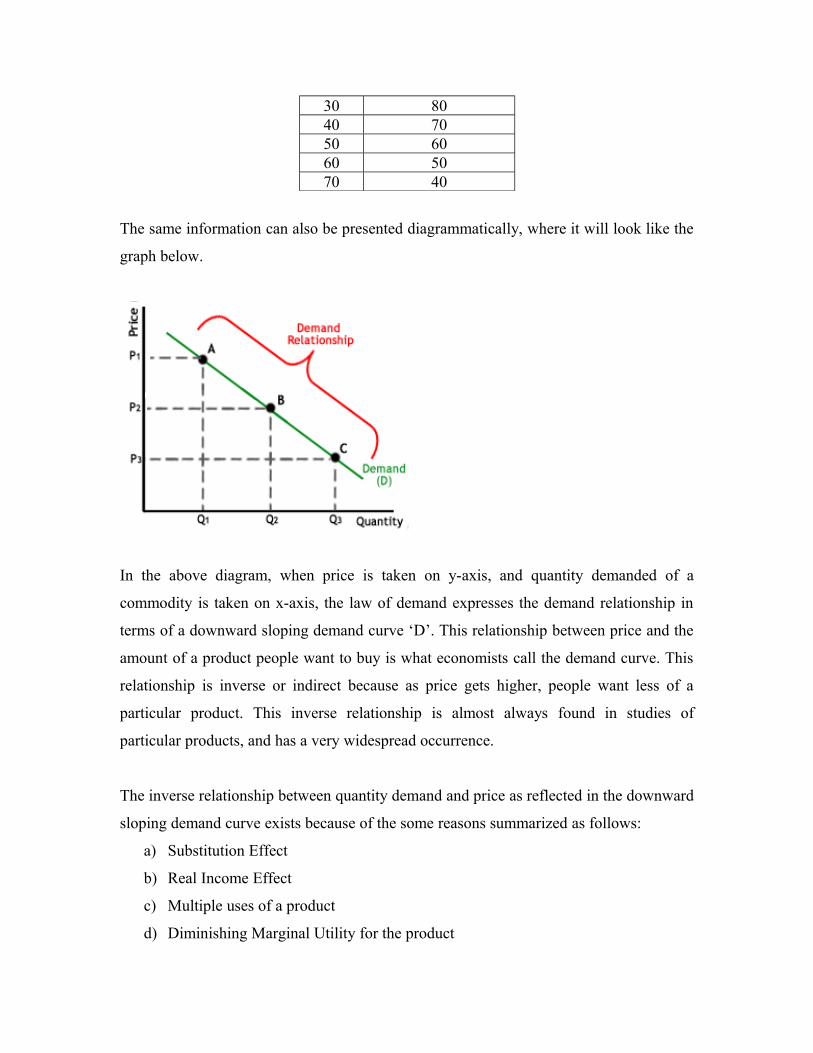
The same information can also be presented diagrammatically, where it will look like the
graph below.
In the above diagram, when price is taken on y-axis, and quantity demanded of a
commodity is taken on x-axis, the law of demand expresses the demand relationship in
terms of a downward sloping demand curve ‘D’. This relationship between price and the
amount of a product people want to buy is what economists call the demand curve. This
relationship is inverse or indirect because as price gets higher, people want less of a
particular product. This inverse relationship is almost always found in studies of
particular products, and has a very widespread occurrence.
The inverse relationship between quantity demand and price as reflected in the downward
sloping demand curve exists because of the some reasons summarized as follows:
a) Substitution Effect
b) Real Income Effect
c) Multiple uses of a product
d) Diminishing Marginal Utility for the product

Here is an explanation of each of the above factors causing the demand curve to slope
downwards,
a) Substitution effect : Consumers have a tendency to shift to cheaper commodities
when the price of a commodity increases. This results in reduction in demand of
the expensive commodity causing an inverse relationship between quantity
demanded and price.
b) Real-income effect: Change in purchasing power occurs when the price of a
commodity changes. Purchasing power increase when price of a commodity falls
and it declines when the price rises. Consumer’s affordability accordingly
changes reflecting this in the downward sloping demand curve.
The income and substitution effect are shown in the following diagram,
c) Multiple uses of a product: If a product has more than one use, then when the
price of the product increases the consumer starts restricting the usage of the
product only to important uses. Hence, the quantity demanded lowers as price
increases.
d) Diminishing Marginal Utility: As a consumer consumes subsequent units of a
commodity the utility diminishes. This is the famous Law of diminishing
marginal utility, which describes that a consumer equates the price paid for a

commodity with the satisfaction derived from the commodity. This is why if price
increases consumer reduces the quantities of the commodity consumed.
1.4 Exceptions to the law of demand
The law of Demand may not hold true even under ceteris paribus conditions. Consider
the following situations where law of demand may not hold true.
a) War or war like conditions
b) Economic Depression
c) Speculation
d) Natural Calamities
e) Giffen’s paradox
f) Demonstration effect
All the above situations do not allow an inverse relationship between the demand for a
product and its price to function even when everything else is kept constant. This is
explained as follows:
a) During war or war like conditions there are great possibilities of potential
scarcities or doubts of scarcities. Under such a situation people may buy
commodities even at higher prices and law of demand may not hold true.
b) When there is economic depression the economy is low and everything goes
down, which is why even if prices are falling people may not buy more.
c) When consumers speculate they anticipate price movements. In a situation when
prices are lower, the consumer demand may not rise because they anticipate
further lowering of prices and, hence, may postpone purchase.
d) Natural calamities may also cause demand to be high at higher prices and low at
lower prices because of abnormal economic conditions.
e) As Giffen’s paradox states that the consumers attach status to commodities
referring them as superior or inferior. For inferior commodities, for instance,
demand may not be higher even if prices are falling because the impact of falling
prices would enhance consumer affordability and this enhanced affordability
could get spent on superior goods rather than inferior goods. So the law of
demand may not hold true.
f) Every product has a demonstration effect, meaning that consumer purchase
pattern is influenced by the purchase patterns in the society in general.
1.5 Factors affecting Demand
We already know the dependency of demand on the price of the commodity. There are
some other factors which affect demand. It is imperative for the marketers to know about
these factors to understand consumer demand and what could cause it to change. This
dependency of demand on various factors is described as Demand Function which can be
expressed as,
Q = f (Price, Income, Price of related commodities, tastes and preferences)
Where Q is the Quantity of goods demanded.
The response of demand to each of these factors can be discussed in detail as follows:
a) Price : The relationship between price and quantity demanded has been discussed
in detail under the Law of Demand. We can recollect that quantity demanded is
inversely proportional to a change in price, ceteris paribus (everything remaining
constant). This implies an increase in price causes an increase in quantity
demanded and vice-versa.
b) Income: The relationship between income and price of a commodity is positive.
Ceteris paribus, a rise in consumer income will increase his affordability thereby
having a positive impact on quantity demanded of a product.
c) Tastes and preferences : Consumers tastes and preferences change with time and
with trends and fashion, causing demand for goods and services to fluctuate
accordingly.

d) Prices of related goods: Commodities may be related to each other and the
demand for a commodity is influenced by the price of the related commodity in
following ways:
(i) Substitutes: Substitutes are those commodities which are used in place of
each other. Brands in the same product category such as Pepsi and Coke, or
some products like tea and coffee can be viewed as substitutes of each other.
If commodities are substitutes, a change in the price of one causes a change
in demand for the other in the same direction. Suppose commodities A an B
are substitutes of each other. The relationship between their price and
quantity demanded is exhibited in the following figure:
(ii) Complements: Complements are those commodities which have to be
consumed simultaneously for greater satisfaction or any satisfaction at all.
Ink and pen, Car and petrol are examples of complement goods. When
commodities are complements, a change in the price of one good causes a
shift in demand for the other in the opposite direction. The relationship
between their price and quantity demanded is exhibited in the following
figure:
Increase in Price of A
Increase in quantity demanded of B
Decrease in Price of A
Decrease in quantity demanded of B
Increase in Price of A
Decrease in quantity demanded of B
Decrease in Price of A
Increase in quantity demanded of B

The degree to which goods complement each other or can be substituted for
each other varies.
e) Changes in expectations of future relative prices: People, extensively,
anticipate about the future. When they make such anticipations about price
movements in the future their current demand for various commodities gets
influenced. It is common to see people pre-pone their purchases before the
implementation of contentions of the budget in anticipation of a future price
increase as a result of changes in taxation policy.
f) Population: The size of the market in general influences the demand for a
commodity. The larger the size the greater is the demand.
1.6 Changes in Demand
A marketer is interested in knowing what causes the demand to change in order to
anticipate the demand for the product or alter the consumer demand in his favor. We have
discussed in the earlier sections various factors that affect demand for a commodity. To
understand the impact of these factors on demand it will be useful to, broadly classify,
them into two categories, viz.,
a) Price factors
b) Non Price factors
This classification is done because of the varying response of the demand to the
influencing variable – an expansion/contraction or increase/decrease in demand.
a) Change in Quantity demanded or expansion or contraction of demand means
that a greater or lesser number of units are bought because of a change in price.
An expansion in quantity demanded means that a greater number of units are
bought because the price has been lowered. We are moving down a particular
demand curve. A contraction in quantity demanded means that a lesser number of
units are bought because the price has been raised.
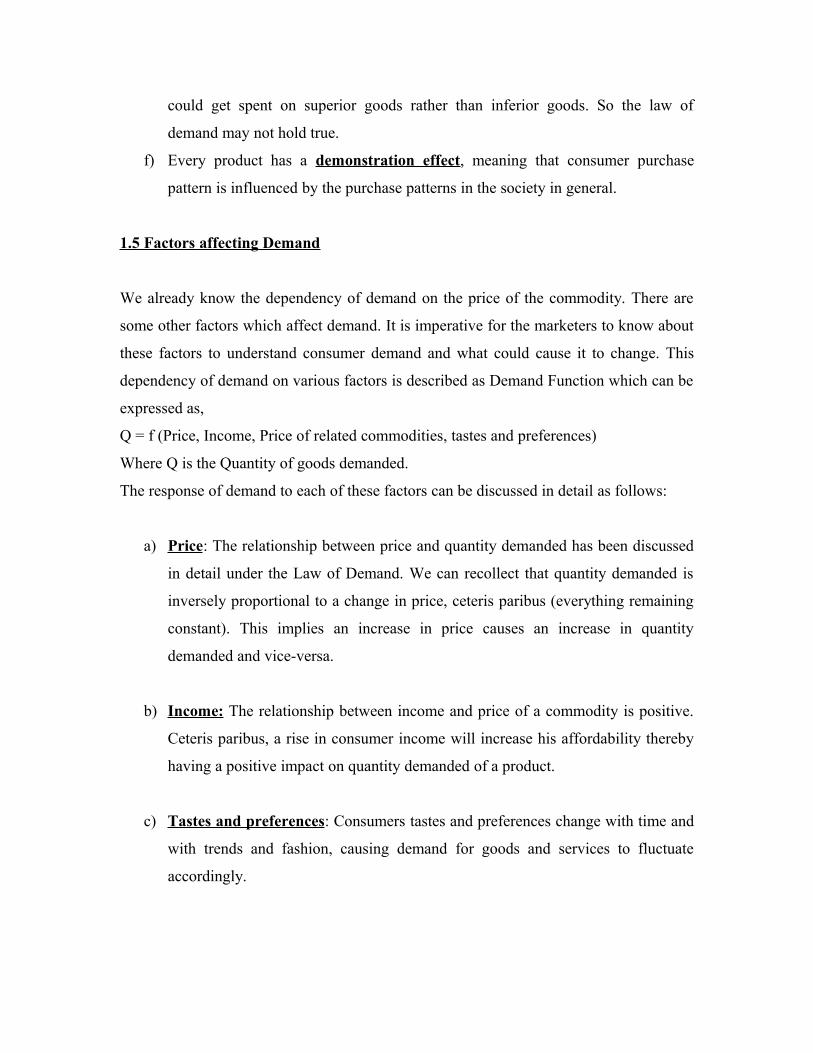
b) Increase or decrease in demand means that a greater or lesser number of units
are bought without changing price. This means that there is a shift in the demand
curve. If it shifts up and to the right, a greater number of units are demanded at
any given price. If it shifts down and to the left, a lesser number of units are
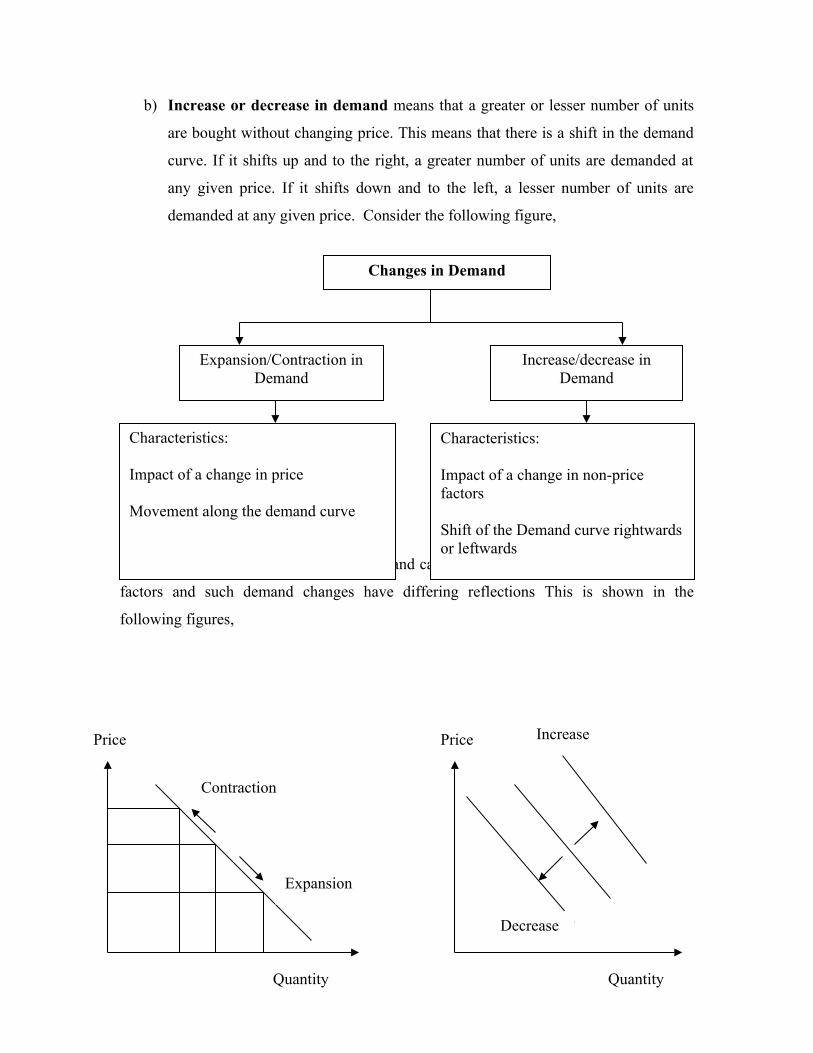
demanded at any given price. Consider the following figure,
From the above figure, it is clear that demand can change because of price and non-price
factors and such demand changes have differing reflections This is shown in the
following figures,
Changes in Demand
Expansion/Contraction in Demand
Increase/decrease in Demand
Characteristics:
Impact of a change in price
Movement along the demand curve
Characteristics:
Impact of a change in non-price factors
Shift of the Demand curve rightwards or leftwards
Quantity
Price Price
Quantity
Contraction
Expansion
Increase
Decrease

1.7 Elasticity and Demand
An understanding of demand enables managers to know more about what, why and how
much of the consumers purchase of goods and services. In this context knowledge of all
the factors that influence demand also helps, in order to find out the changes in demand
and the underlying reasons. Each of these factors has varying impact on the demand for a
commodity. Economics provides managers with an important tool called Elasticity which
highlights the degree of impact that individual influencing factors has on demand.
Elasticity, in general, can be understood as a measure of the responsiveness of one
variable to changes in another variable.
In the theory of consumer behavior it highlights demand changes in response to various
stimuli. In case of demand we can consider Price, Income, and Prices of related goods as
important influencing variables. The following section analyses the degree of demand’s
responsiveness to changes in these variables.
1.8 Price Elasticity of Demand
Price elasticity of demand measures the response of the quantity demanded to a change in
price. Formally,
The price elasticity of demand is the ratio of the proportionate change in quantity
demanded of a commodity with respect to a proportionate change in its price.
It is an important concept in understanding consumer demand theory. Price is the single
most important determining factor of consumer’s demand and price elasticity of demand
brings out the total response of demand to a change in price quantitatively. Price
elasticity of demand can be can be calculated and expressed as,
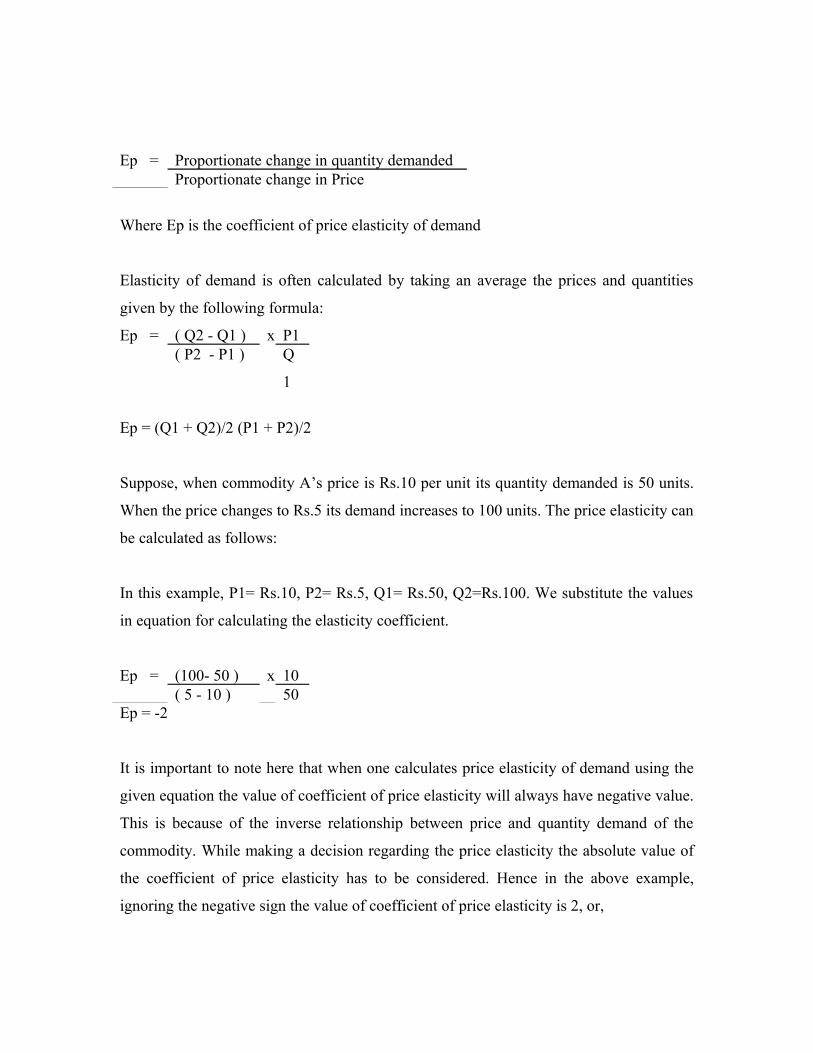
Ep = Proportionate change in quantity demandedProportionate change in Price
Where Ep is the coefficient of price elasticity of demand
Elasticity of demand is often calculated by taking an average the prices and quantities
given by the following formula:
Ep = ( Q2 - Q1 ) x P1( P2 - P1 ) Q
1
Ep = (Q1 + Q2)/2 (P1 + P2)/2
Suppose, when commodity A’s price is Rs.10 per unit its quantity demanded is 50 units.
When the price changes to Rs.5 its demand increases to 100 units. The price elasticity can
be calculated as follows:
In this example, P1= Rs.10, P2= Rs.5, Q1= Rs.50, Q2=Rs.100. We substitute the values
in equation for calculating the elasticity coefficient.
Ep = (100- 50 ) x 10( 5 - 10 ) 50
Ep = -2
It is important to note here that when one calculates price elasticity of demand using the
given equation the value of coefficient of price elasticity will always have negative value.
This is because of the inverse relationship between price and quantity demand of the
commodity. While making a decision regarding the price elasticity the absolute value of
the coefficient of price elasticity has to be considered. Hence in the above example,
ignoring the negative sign the value of coefficient of price elasticity is 2, or,

|Ep| = 2
For all calculation and decision making purposes a mod value or absolute value of the
coefficient of price elasticity has to be considered.
1.9 Factors affecting price elasticity of demand
The degree of demand’s dependency on price is not same for all products. The intensity
of relationship between price and quantity demanded of a product or price elasticity of
demand varies depending on certain factors. They are:
a) Existence of substitutes - the closer the substitutes for a particular commodity,
the greater will be its price elasticity of demand
b) Importance of the commodity in the consumers budget - the greater the
percentage of a total budget spent on the commodity, the greater the person’s
price elasticity of demand for that commodity
c) Time for adjustment in rate of purchase - the longer any price change persists,
the greater the price elasticity of demand
d) Nature of the commodity - the commodity’s demand is relatively more elastic if
it is a necessity as against a luxury good.
e) Number of uses of the product - the greater the number of uses a commodity
can be put to use the greater is its elasticity.
f) Durability - the greater the durability of the product the greater will be its
elasticity.
g) Addiction - where the products have addictive ability, the elasticity will reduce
h) Economic and human constraints - such constraints as posed by availability of
resources, government policy, etc. reduce price elasticity of demand.
Based on the above factors the response of demand for a commodity to a change in its
price will be high or low. Further, depending on whether the response is high or low one
can classify various types of price elasticity. This is discussed in the following section:
1.10 Types of price elasticity of demand

Depending on the degree of demand’s dependency on price and value of coefficient of
price elasticity of demand there can be five cases of price elasticity of demand. They are:
a) Relatively Elastic Demand: Proportionate change in demand is more than the
proportionate change in price.
b) Relatively Inelastic Demand: Proportionate change in demand is less than the
proportionate change in price.
c) Perfectly Elastic Demand: Change in demand is infinitely possible even when
there may not be any change in price.
d) Perfectly Inelastic Demand: Change in demand is not possible even when any
changes in price.
e) Unitary Elasticity: A change in demand is exactly proportionate to a change in
price.
The various cases of price elasticity of demand are summarized in the following table:
S.No. Price elasticity of demand Numerical
value
Shape of the demand
curve1. Relatively Elastic Demand Ep>1 Downward sloping
demand curve which is
relatively flatter2. Relatively Inelastic Demand Ep<1 Downward sloping
demand curve which is
relatively steeper3. Perfectly Elastic Demand Ep=∝ Perfectly horizontal
demand curve4. Perfectly Inelastic Demand Ep=0 Perfectly vertical demand
curve5. Unitary Elasticity Ep=1 Rectangular hyperbole
The above elasticity can be shown through diagrams as follows:
P
Q
P
Q 0
1.
2
0
P
Q0
34P
0Q
P
0Q
5
The different price elasticity of demand can also be depicted in same figure as follows,
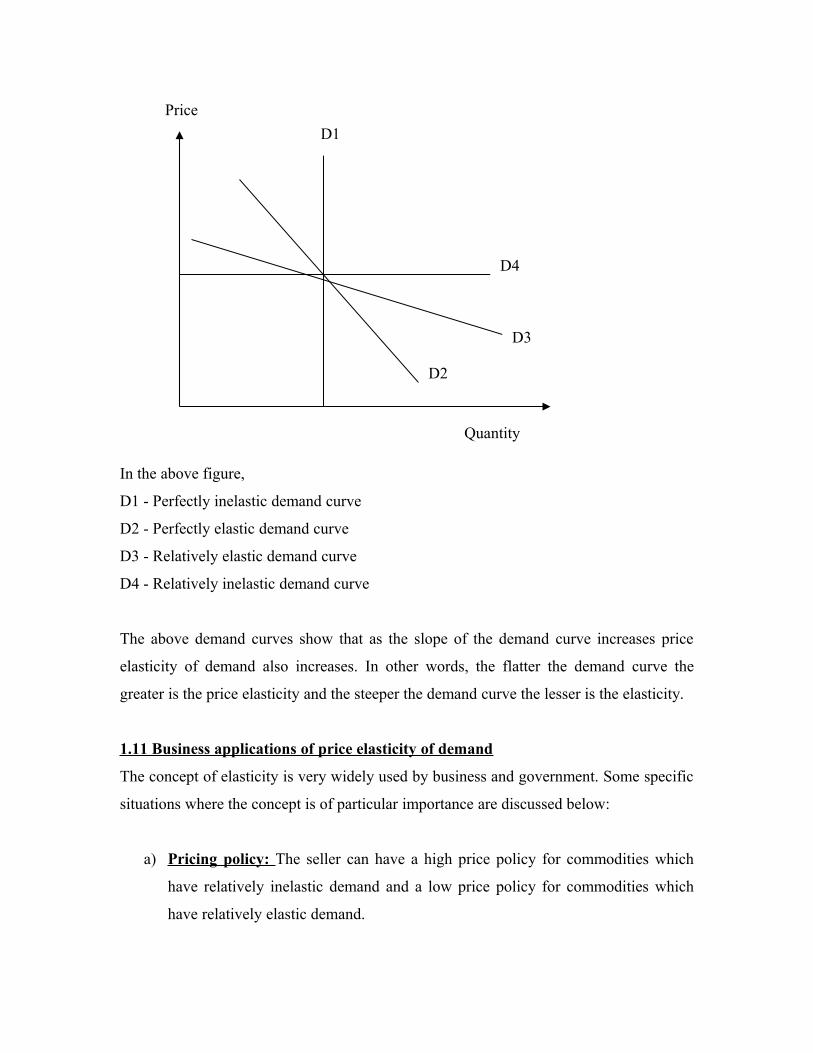
In the above figure,
D1 - Perfectly inelastic demand curve
D2 - Perfectly elastic demand curve
D3 - Relatively elastic demand curve
D4 - Relatively inelastic demand curve
The above demand curves show that as the slope of the demand curve increases price
elasticity of demand also increases. In other words, the flatter the demand curve the
greater is the price elasticity and the steeper the demand curve the lesser is the elasticity.
1.11 Business applications of price elasticity of demand
The concept of elasticity is very widely used by business and government. Some specific
situations where the concept is of particular importance are discussed below:
a) Pricing policy: The seller can have a high price policy for commodities which
have relatively inelastic demand and a low price policy for commodities which
have relatively elastic demand.
Price
Quantity
D1
D4
D3
D2

b) Joint demand: Commodities can have joint demand whereby the source of the
products is the same. For example fruit juice and jam, or meat and wool. In such
cases the prices of the products can be fixed so that a higher price can be charged
for the product whose demand is relatively inelastic and lower price for the
product whose demand is relatively elastic.
c) Taxation Policy: While deciding on the taxation policy for various commodities,
particularly the indirect taxes like sales tax, octroi, etc, government makes use of
the concept of price elasticity of demand in order to know who will bear the
burden of the tax between the buyer and the seller. If the demand for the
commodity is relatively elastic the seller may have to bear he burden of the tax,
while if the demand is relatively inelastic there are greater chances that the buyer
has to bear the burden of the tax. For example the government may decide to have
minimum taxation on essential commodities for the common good for their
demand is highly price inelastic. On the other hand, government may levy heavy
taxation on commodities having addictive value so as to discourage their
consumption for their demand is again relatively inelastic.
d) Public Utility: Government renders those services under public utility whose
demand is highly inelastic such as sewage, garbage disposal etc. If these services
were not under public utility there would be great chances of user exploitation.
e) International Trade: A country benefits from international trade if its imports
are price elastic while its exports are price elastic. If this happens the country
operates in buyers market when importing and in a sellers market when exporting.
The gulf countries enjoy this advantage when exporting petroleum.
1.12 Other types of Elasticity
Apart from price there are certain other factors that affect demand which marketers take
significant cognizance of. We have already established the relationship between demand
and several non-price factors. The concept of elasticity can be further used to arrive at the
degree of demand’s dependency on each of these factors.
The following section analyzes two elasticity concepts,
a) Income Elasticity of demand
b) Cross elasticity of demand
1.13 Income Elasticity of demand
Income elasticity of demand measures the relationship between changes in quantity
demanded as a result of a change in consumer income. The coefficient of income
elasticity of demand can be, formally, defined as is:
Percentage change in quantity demanded of good X divided by the percentage
change in real consumers’ income
Income elasticity of demand can be calculated using the following equation,
Ey = Proportionate change in quantity demandedProportionate change in Income
Where Ey is the coefficient of income elasticity of demand
Based on the value of the coefficient of income elasticity of demand one can conclude
about the nature of the commodity. This can be drawn out from the response of demand
for a commodity to a change in income. For instance, the demand for necessities will
increase with income, but at a slower rate. This is because consumers, instead of buying
more of only the necessity, will want to use their increased income to buy more of a
luxury. During a period of increasing income, demand for luxury products tends to
increase at a higher rate than the demand for necessities.
Here is a classification of various types of goods based on their income elasticity of
demand.
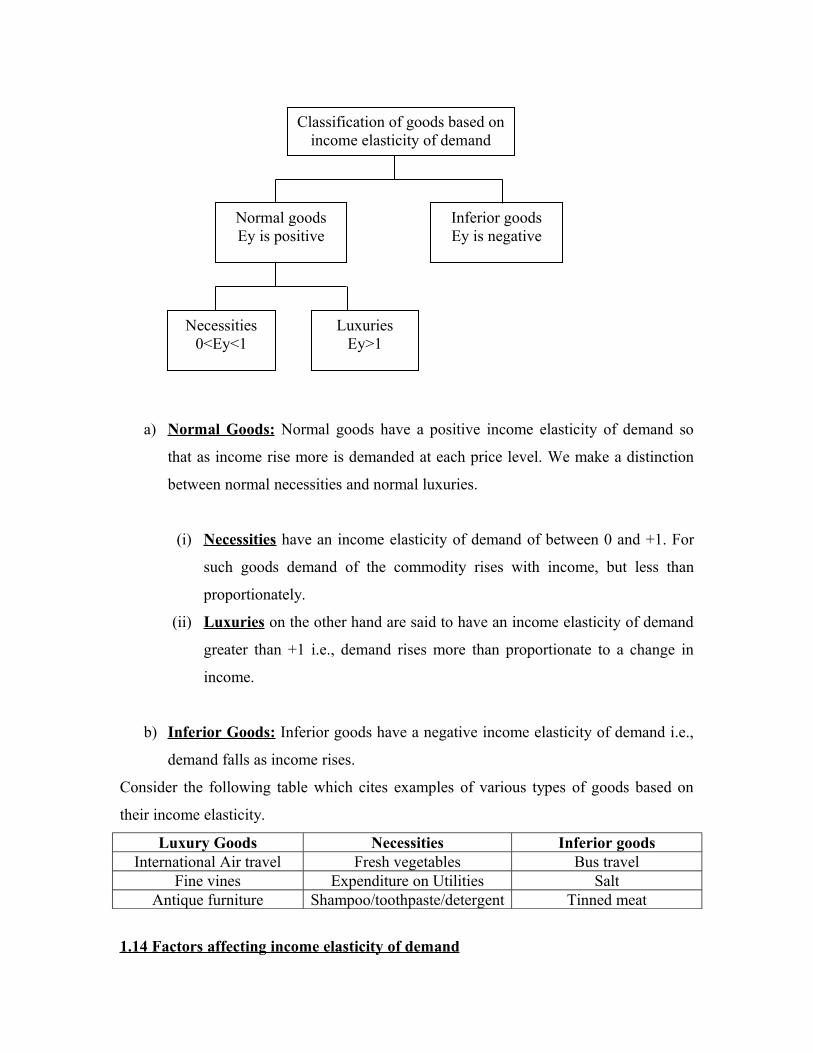
a) Normal Goods: Normal goods have a positive income elasticity of demand so
that as income rise more is demanded at each price level. We make a distinction
between normal necessities and normal luxuries.
(i) Necessities have an income elasticity of demand of between 0 and +1. For
such goods demand of the commodity rises with income, but less than
proportionately.
(ii) Luxuries on the other hand are said to have an income elasticity of demand
greater than +1 i.e., demand rises more than proportionate to a change in
income.
b) Inferior Goods: Inferior goods have a negative income elasticity of demand i.e.,
demand falls as income rises.
Consider the following table which cites examples of various types of goods based on
their income elasticity.
Luxury Goods Necessities Inferior goodsInternational Air travel Fresh vegetables Bus travel
Fine vines Expenditure on Utilities SaltAntique furniture Shampoo/toothpaste/detergent Tinned meat
1.14 Factors affecting income elasticity of demand
Classification of goods based on income elasticity of demand
Normal goodsEy is positive
Inferior goodsEy is negative
Necessities0<Ey<1
LuxuriesEy>1

Within a given market, the income elasticity of demand for various products can vary.
Consider the following factors:
a) Perception of a product : Perception of a product must differ from consumer to
consumer. What to some people is a necessity might be a luxury to others.
b) Income and spending decisions : For many products, the final income elasticity
of demand might be close to zero, in other words there is a very weak link at best
between fluctuations in income and spending decisions. In this case the “real
income effect” arising from a fall in prices is likely to be relatively small. Most of
the impact on demand following a change in price will be due to changes in the
relative prices of substitute goods and services. Consider the following diagram,
c) Time: The above diagram also shows that the income elasticity of demand for a
product will also change over time – the vast majority of products have a finite
life-cycle. Consumer perceptions of the value and desirability of a good or service
will be influenced not just by their own experiences of consuming it but also the
appearance of new products onto the market. One can take the example of the
income elasticity of demand for flat-screen color televisions as the market for

plasma screens develops and the income elasticity of demand for TV services
provided through satellite dishes set against the growing availability and falling
cost (in nominal and real terms) of integrated digital televisions.
1.15. Cross Elasticity of demand
Commodities may be related to each other. They can be substitutes or complements. Such
relationships imply that changes or price movements of one commodity invites response
in quantity demanded of the related commodity. The concept of cross elasticity of
demand can be used to establish this relation between commodities that of substitutes and
complements. It can be defined as,
Cross price elasticity (Ec) measures the degree of responsiveness of demand for
commodity X following a change in the price of another commodity Y.
It can be calculated as,
Ec = Proportionate change in quantity demandedProportionate change in price of related
goods
Where Ec is the coefficient of cross elasticity of demand.
We have already discussed the concept of substitutes and complements earlier, with cross
price elasticity we make an important distinction between substitute products and
complementary goods and services as shown in the following table:
Nature of the commodity Coefficient of cross
elasticity of demandSubstitutes PositiveComplements Negative
As shown in the above table if coefficient of cross elasticity of demand is positive the
commodities are substitutes and if coefficient of cross elasticity of demand is negative

then commodities are complements to each other. Unrelated products have a zero cross
elasticity
Besides the higher is the co-efficient of cross-price elasticity of demand, the stronger the
relationship between two products. For example with two close substitutes, the cross-
price elasticity coefficient will be strongly positive. Likewise when there is a strong
complementary relationship between two products, the cross-price elasticity coefficient
will be highly negative. Consider the following diagram,
1.16 Summary
This unit discusses a very important economic tool for managers that are demand.
Various concepts and issues related to demand are explained to enable skills to better
understand consumer demand and what motivates it. The concept of elasticity further
clarifies demand and its degree of dependency on price, income, and related

commodities. The applications of elasticity in day to day and strategic business decisions
make it very vital for managers to be equipped with the knowledge of the concept.
1.17 Key words
a) Demand: Willingness and ability of people to purchase goods or services in the
market for a given price.
b) Law of demand: If all other factors remain equal, the higher the price of a good,
the less people will demand that good.
c) Substitution effect : Consumers have a tendency to shift to cheaper commodities
when the price of a commodity increases.
d) Real-income effect: Change in purchasing power occurs when the price of a
commodity changes.
e) Substitutes: Substitutes are those commodities which are used in place of each
other.
f) Complements: Complements are those commodities which have to be consumed
simultaneously for greater satisfaction or any satisfaction at all.
g) Expansion or contraction of demand: Greater or lesser number of units of a
product is bought because of a change in price.
h) Increase or decrease in demand: Greater or lesser number of units of a product
is bought because of changes in factors other than the price.
i) Elasticity: A measure of the degree of responsiveness of one variable to changes
in another variable.
j) Price elasticity of demand: Degree of responsiveness of quantity demanded of a
commodity to a change in its price.
k) Income elasticity of demand: Degree of responsiveness of quantity demanded of
a commodity to a change in consumer’s income.
l) Normal Goods: Goods having a positive income elasticity of demand.
m) Inferior Goods: Goods having a negative income elasticity of demand.
n) Cross elasticity of demand: Degree of responsiveness of quantity demanded of a
commodity to a change in price of related goods.
1.18 Self assessment questions
1. Explain the concept of economic demand. What factors determine consumer’s
demand?
2. Discuss in detail the law of demand and its exceptions
3. Distinguish between:
a) Substitution effect and real-income effect
b) Substitutes and complements
4. What is price elasticity of demand? What factors determine the value of
coefficient of price elasticity?
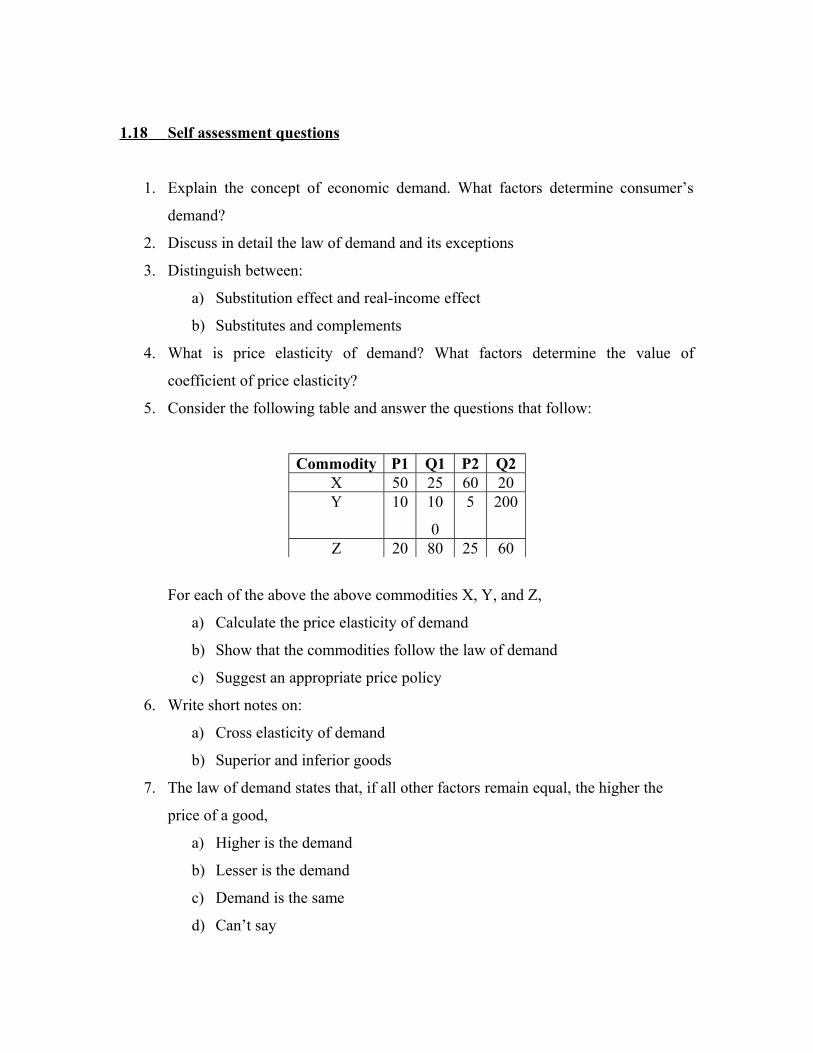
5. Consider the following table and answer the questions that follow:
Commodity P1 Q1 P2 Q2X 50 25 60 20Y 10 10
0
5 200
Z 20 80 25 60
For each of the above the above commodities X, Y, and Z,
a) Calculate the price elasticity of demand
b) Show that the commodities follow the law of demand
c) Suggest an appropriate price policy
6. Write short notes on:
a) Cross elasticity of demand
b) Superior and inferior goods
7. The law of demand states that, if all other factors remain equal, the higher the
price of a good,
a) Higher is the demand
b) Lesser is the demand
c) Demand is the same
d) Can’t say

8. Consumers have a tendency to shift to cheaper commodities when the price of a
commodity increases.
a) Mostly true
b) Never true
c) Can’t say
d) None of the above
9. When consumers speculate they anticipate
a) Price movements
b) Elasticity movements
c) Both a and b
d) Neither a nor b
10. Giffen’s paradox states that the consumers attach status to commodities referring
them as
a) Superior or inferior
b) Substitutes or Complements
c) Necessities or luxuries
d) None of the above
11. Demonstration effect means that consumer purchase pattern is influenced by the
purchase patterns in the society in general.
a) True
b) False
c) They are not related
d) Can’t say
12. Fill in the blanks:
a) Consumer’s tastes and preferences change with time and with trends and
fashion, causing demand for goods and services to ________________
accordingly.
b) The size of the market ________________ the demand for a commodity.

c) Expansion or contraction of demand means that a greater or lesser number
of units are bought because of a change in________________ .
d) Elasticity highlights the degree of impact that individual influencing
factors has on ________________.
e) The price elasticity of demand is the ratio of the proportionate change in
________________ of a commodity with respect to a proportionate
change in its________________.
f) The commodity’s demand is relatively more elastic if it is a
________________ as against a luxury good.
g) The greater the number of uses a commodity can be put to use the
________________ is its elasticity.
h) Commodities can have joint demand whereby the ________________ of
the products is the same.
i) Income elasticity of demand measures the relationship between changes in
quantity demanded as a result of a change in ________________.
j) Cross price elasticity measures the degree of responsiveness of
________________ for commodity X following a change in
the________________ of another commodity Y.