Embed Size (px)
Citation preview

14/05/2014
1

14/05/2014
2
AGENDA
1. WELCOME AND INTRODUCTION PEARSON GOWERO
2. TRADING REVIEW PEARSON GOWERO
3. FINANCIALS MATTS VALELA
4. DISCUSSION/QUESTIONS ALL
5. REFRESHMENTS ALL

14/05/2014
3
VOLUME BEVERAGE CATEGORY
• Declined by 18% LAGER
• Declined by 2% SPARKLING BEVERAGES
• Grew by 12% SORGHUM BEER
• Grew by 33% ALTERNATIVE BEVERAGES
(MAHEU)
• Grew by 11% PLASTICS
TRADING REVIEW - ALL BEVERAGES
Population 653,337 PCC
Lagers -22% 25
SBs -1% 28
Sorghum 22% 17
Population 683,893 PCC
Lagers -26% 4
SBs -9% 6
Sorghum 3% 9
Population 1,485,090 PCC
Lagers -11% 9
SBs 0% 9
Sorghum -4% 31
Population 1,614,941 PCC
Lagers -14% 9
SBs 2% 10
Sorghum 1% 28
Population 749,017 PCC
Lagers -13% 4
SBs 6% 5
Sorghum 3% 13
Population 1,752,698 PCC
Lagers -10% 7
SBs
Sorghum 30% 21
Population 2,123,132 PCC
Lagers -13% 32
SBs -4% 32
Sorghum 37% 39
Population 1,344,955 PCC
Lagers -9% 6
SBs 0% 6
Sorghum 10% 16
Population 1,152,520 PCC
Lagers -9% 7
SBs 9% 6
Sorghum 5% 19
Population 1,501,656 PCC
Lagers -5% 11
SBs 3% 10
Sorghum 2% 37
Total Beverages Volume
F14 F13 Growth
6,904 6,887 0%

14/05/2014
4
VOLUME REVIEW
Full year volume flat
Marked slowdown in consumer spend in last half.
Worsening economic fundamentals.
Premium category contribution up.
Retail pricing for beer still an issue.
Consumer switch to affordable offerings.
LAGER BEER FIVE YEAR VOLUME PERFORMANCE
HLs ‘000
0
500
1 000
1 500
2 000
2 500
F10 F11 F12 F13 F14
1 148
1 6081 981 2 060
1 697

14/05/2014
5
TRADING REVIEW - LAGER BEER
� Resource deployment follows the per capita map.� Parallel imports in border areas. (same brands different source)
ProvinceF14/F15Volume PCC
Mashonaland West -10% 11
Matabeleland North -14% 4
Mashonaland East -15% 6
Masvingo Province -16% 9
Harare -16% 32
Manicaland -17% 8
Midlands Province -17% 9
Mashonaland Central -17% 7
Bulawayo -23% 25
Matabeleland South -28% 4
Total Lagers -18% 13
TRADING REVIEW - LAGER BEER MIX
HLs ‘000
0
500
1000
1500
2000
2500
F13 F14
4% 7%
77% 72%
19%21% Premium
Main StreamEconomy

14/05/2014
6
SPARKLING BEVERAGES FIVE YEAR VOLUME PERFORMANCE
HLs ‘000
0
500
1 000
1 500
2 000
F10 F11 F12 F13 F14
770
1 1751 480 1 615 1 589
TRADING REVIEW - SPARKLING BEVERAGES
� Demand held for most of the year except 4th quarter.� Harare had an acute water problem leading to stock outs in 4th quarter.
ProvinceF14/F15Volume PCC
Mashonaland Central 9% 7
Matabeleland North 6% 4
Mashonaland West 3% 10
Midlands Province 2% 11
Masvingo Province 0% 9
Mashonaland East 0% 6
Bulawayo -1% 28
Harare -4% 32
Matabeleland South -9% 6
Total SBs -1% 12

14/05/2014
7
TRADING REVIEW - SPARKLING BEVERAGES MIX
HLs ‘000
0
500
1000
1500
2000
F13 F14
68% 60%
32% 40%Convenience…RGB
SORGHUM BEER FIVE YEAR VOLUME PERFORMANCE
HLs ‘000
1 200
1 700
2 200
2 700
3 200
3 700
F10 F11 F12 F13 F14
3 1142 908
3 3543 080
3 442
14/05/2014
8
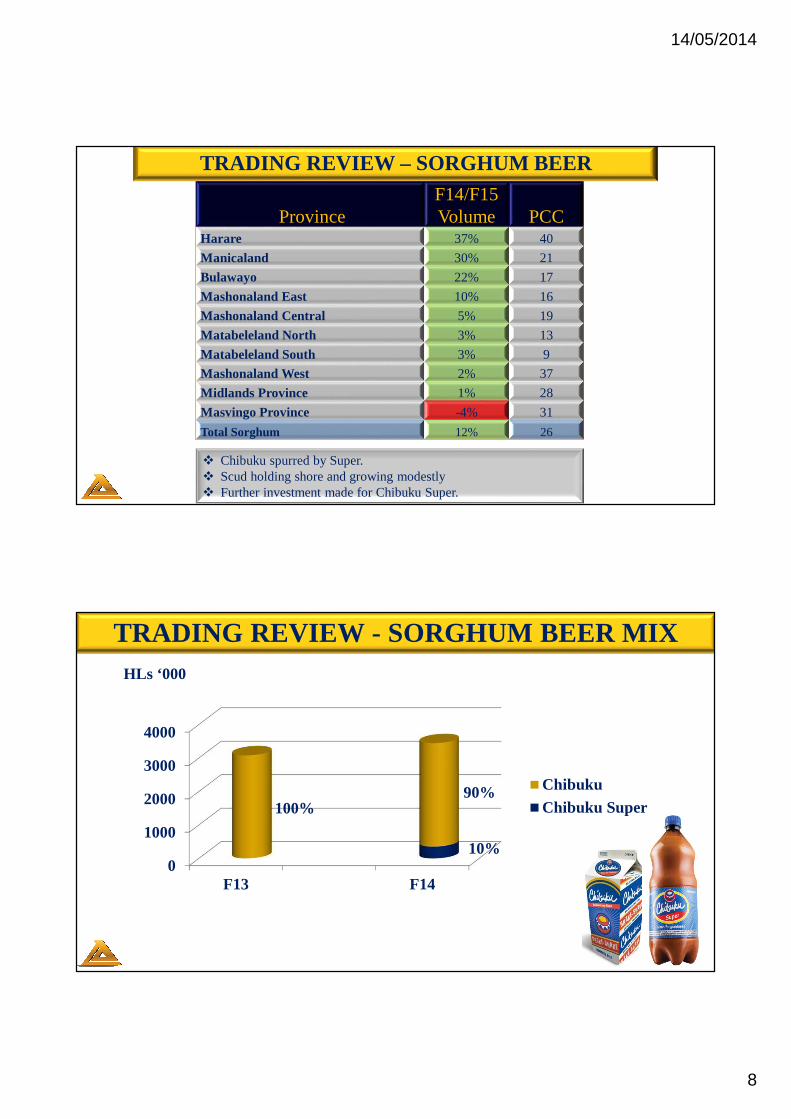
TRADING REVIEW – SORGHUM BEER
� Chibuku spurred by Super.� Scud holding shore and growing modestly� Further investment made for Chibuku Super.
ProvinceF14/F15Volume PCC
Harare 37% 40
Manicaland 30% 21
Bulawayo 22% 17
Mashonaland East 10% 16
Mashonaland Central 5% 19
Matabeleland North 3% 13
Matabeleland South 3% 9
Mashonaland West 2% 37
Midlands Province 1% 28
Masvingo Province -4% 31
Total Sorghum 12% 26
TRADING REVIEW - SORGHUM BEER MIXHLs ‘000
0
1000
2000
3000
4000
F13 F14
10%
100%90% Chibuku
Chibuku Super

14/05/2014
9
MARKET SHARE
� Focus was on market retention and building brand loyalty.� Lager share largely driven by mainstream � Sorghum beer demand reignited by Chibuku Super
Lager Beer Sorghum Beer Soft Drinks
DELTA BEVERAGES 99 84 98
PLASTIC PACKAGING FIVE YEAR TONNAGE PERFORMANCE
Tonnes
0
2 000
4 000
6 000
8 000
10 000
12 000
F10 F11 F12 F13 F14
4 5505 796
7 4689 451
10 495
� Tonnage driven by PET preforms for Sparkling Beverages.
14/05/2014
10
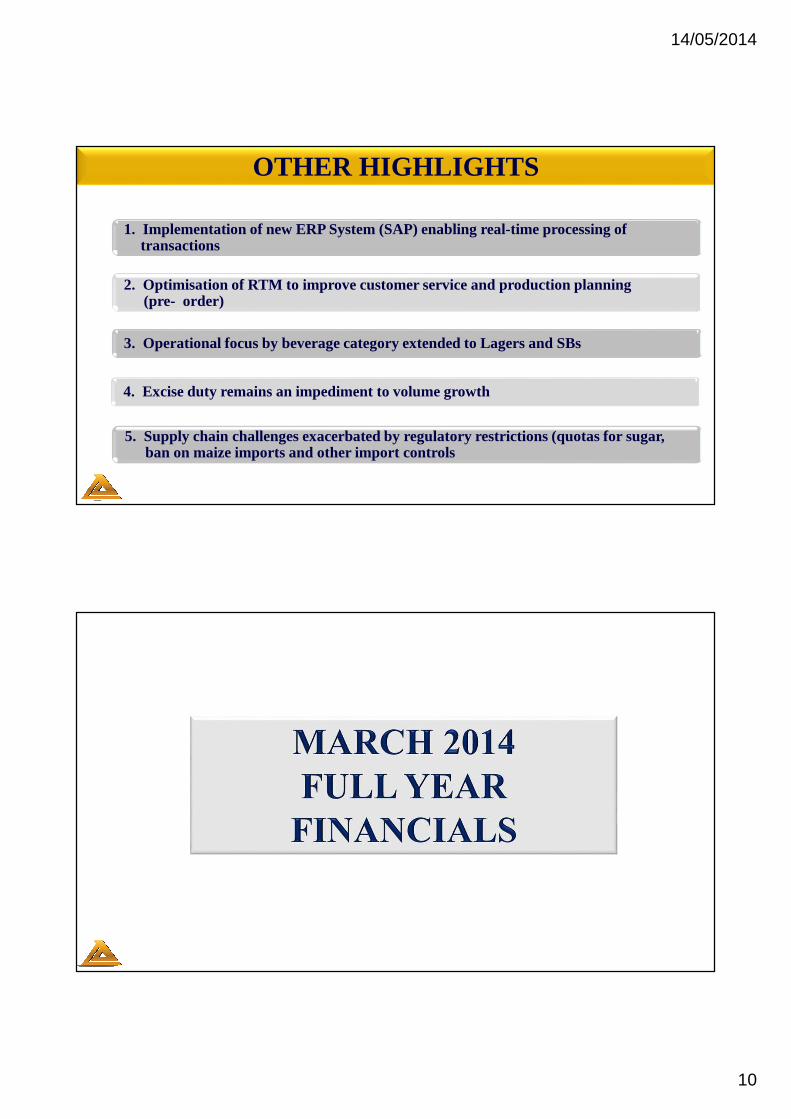
OTHER HIGHLIGHTS
2. Optimisation of RTM to improve customer service and production planning (pre- order)
3. Operational focus by beverage category extended to Lagers and SBs
4. Excise duty remains an impediment to volume growth
5. Supply chain challenges exacerbated by regulatory restrictions (quotas for sugar, ban on maize imports and other import controls
1. Implementation of new ERP System (SAP) enabling real-time processing of transactions

14/05/2014
11
AGENDA
1. FINANCIAL HIGHLIGHTS
2. FINANCIAL STATEMENTS
VOLUME PERFORMANCE SUMMARY
Category Actual Volume 000hl % Growth on Prior Year
1. BEVERAGES (HLS 000)1.1 Clear Beer1.2 Sorghum Beer1.3 Sparkling Beverages1.4 Maheu
1 6963 4421 590
175
(18)12(2)33
Total Excluding Associates 6 903 0.25
2. Plastic Tonnages 10 495 11
3. Malt Tonnages 32 639 (10)

14/05/2014
12
GROSS SALES
• Down 10% to $316 millionLAGER
• Down 2% to $225 millionSPARKLING BEVERAGES
• Up 24% to $146 millionCHIBUKU
• Up 35% to $15 millionALTERNATIVE BEVERAGES
(MAHEU )
FINANCIAL HIGHLIGHTS
REVENUEDeclined by 1% to $625,5 million (Turnover - $733,8m)
OPERATING MARGIN %
Up from 24.73% to 24.75%
EBIT
Down by 1% to $134,2 million

14/05/2014
13
FINANCIAL HIGHLIGHTS Cont…
EBITDA
Up by 2% to $165,2 million
ATTRIBUTABLE INCOME
Increased by 3% to $105,7 million
EARNINGS PER SHARE
Increased by 1% to 8,55 cents
DIVIDEND PER SHARE
Up 4% on prior year
Interim dividend paid per share – 1,30 cents
Final dividend proposed per share – 2,25 cents
STATEMENT OF COMPREHENSIVE INCOME FOR THE PERIOD
MARCH 2014 US$000’s
MARCH 2013 US$000’s
REVENUE 625 517 631 276
Operating income 134 184 134 989
Net finance expense 3 763 (574)
Share of associates profit 2 283 2 458
PROFIT BEFORE TAX 140 230 136 873
Taxation (33 037) (32 750)
TOTAL COMPREHENSIVE INCOME 107 193 104 123

14/05/2014
14
ANALYSIS OF ATTRIBUTABLE INCOME
2014US$000’s
2013US$000’s
Profit for the half year from operations attributable to:
Owners of the parent 105 664 102 472
Non-controlling interests 1 529 1 651
107 193 104 123
EARNINGS PER SHARE
MARCH 2014 MARCH 2013
From Operations
Normal EPS – Cents 8,55 8,49
Fully Diluted EPS - Cents 8,49 8,42
Dividend per share - Cents 3,55 3,4

14/05/2014
15
STATEMENT OF FINANCIAL POSITIONASSETS
2014US$000’s
2013US$000’s
Non-current assets
Property, plant and equipment 353 209 319 241
Investments, loans and trademarks 35 228 30 598
TOTAL NON-CURRENT ASSETS 388 437 349 839
CURRENT ASSETS
Inventories 100 153 93 012
Trade and other receivables 44 807 43 999
Cash and cash equivalents 86 489 75 088
TOTAL CURRENT ASSETS 231 449 212 099
TOTAL ASSETS 619 886 561 938
STATEMENT OF FINANCIAL POSITION Cont…
EQUITY AND LIABILITIES2014
US$000’s2013
US$000’sShare Capital 12 342 12 230Share Premium 28 982 24 049Reserves 336 974 276 921Dividend Payable 27 772 27 270Non-controlling Interests 8 309 6 780Shareholder’s equity 414 379 347 250
Long- term borrowings - 60 000Deferred taxation 35 769 30 740
35 769 90 740CURRENT LIABILITIESShort term borrowings 71 293 18 605Interest free liabilities 103 149 105 343TOTAL CURRENT LIABILITIES 169 738 123 948
TOTAL EQUITY AND LIABILITES 619 886 561 938

14/05/2014
16
CASH FLOW2014
US$000’s2013
US$000’s
Cash flow from operations 128 835 134 094
Net cash invested (67 653) (83 337)
Net funding 15 196 (3 517)
SHARE CAPITAL MOVEMENTS
Shares in Issue as at 31 March 20131 227 362 815
Share Options Exercised 14 201 900
Shares in Issue at 31 March 20141 241 564 715

14/05/2014
17
SZL
• Volumes up on prior year
• Revenue up 6% to $100m
• Challenge is to manage productivities and supply chain to protect margins
• Market share in cordials stable
• Gains in juice drinks market share
AFDIS
• To localise production of ciders this year
• Registering good growth on volume and profitability
ASSOCIATES

14/05/2014
18
THANK YOU