Embed Size (px)
Citation preview

1 • DELIVERING THE CIRCULAR ECONOMY – A TOOLKIT FOR POLICYMAKERS - SELECTION OF KEY EXHIBITS
DELIVERING THE CIRCULAR ECONOMYA TOOLKIT FOR POLICYMAKERS
SELECTION OF KEY EXHIBITS

DISCLAIMER
This document contains key exhibits from the report Delivering the circular economy: a toolkit for policymakers.
The report has been produced by a team from the Ellen MacArthur Foundation, which takes full responsibility for the report’s contents and conclusions. While the key contributors and contributors listed in the acknowledgements provided significant input to the development of this report, their participation does not necessarily equate to endorsement of the report’s contents or conclusions. The McKinsey Center for Business and Environment provided analytical support. NERA Economic Consulting provided support for the macroeconomic and policy analysis for Parts 2 and 3 of the report.
The report describes a methodology for circular economy policymaking. It also explores a range of policy options that Denmark – the country of the report’s pilot study – could choose to pursue. The report does not recommend any specific policy intervention to Denmark or to any other country.
PROJECT FUNDER

3 • DELIVERING THE CIRCULAR ECONOMY – A TOOLKIT FOR POLICYMAKERS - SELECTION OF KEY EXHIBITS
CIRCULAR ECONOMY AND TOOLKIT METHODOLOGY

4 • DELIVERING THE CIRCULAR ECONOMY – A TOOLKIT FOR POLICYMAKERS - SELECTION OF KEY EXHIBITS
Circular economy – an industrial system that is restorative and regenerative by design
1 Principle
Preserve and enhance natural capital by controlling finite stocks and balancing renewable resource flows ReSOLVE levers: regenerate, virtualise, exchange
Op:mise resource yields by circula:ng products, components and materials in use at the highest u:lity at all :mes in both technical and biological cycles ReSOLVE levers: regenerate, share, op;mise, loop
Foster system effec:veness by revealing and designing out nega:ve externali:es
2 Principle
3 Principle
Farming/collection 1
Biochemical feedstock
Regeneration
Extraction of biochemical feedstock2
Cascades
Collection
Parts manufacturer
Product manufacturer
Service provider
Collection
User
Biosphere Recycle
Refurbish/remanufacture
Reuse/redistribute
Maintain/prolong
6 2803 0006 9
Consumer
MINIMISE SYSTEMIC LEAKAGE AND NEGATIVE EXTERNALITIES
FINITE MATERIALSRENEWABLES
Biogas
Regenerate Substitute materials Virtualise RestoreRenewables flow management Stock management
Share
Preserve and enhance natural capital by controlling finite stocks and balancing renewable resource flowsReSOLVE levers: regenerate, virtualise, exchange
Optimise resource yields by circulating products, components and materials in use at the highest utility at all times in both technical and biological cyclesReSOLVE levers: regenerate, share, optimise, loop
Foster system effectiveness by revealing and designing out negative externalitiesAll ReSOLVE levers
flow Stock
PRINCIPLE 2
PRINCIPLE 1
PRINCIPLE 3
1 Hunting and fishing 2 Can take both post-harvest and post-consumer waste as an input SOURCE: Ellen MacArthur Foundation, SUN and McKinsey Center for Business and Environment, Growth Within: A Circular Economy Vision for a Competitive Europe (2015). Drawing from Braungart & McDonough, Cradle to Cradle (C2C).

5 • DELIVERING THE CIRCULAR ECONOMY – A TOOLKIT FOR POLICYMAKERS - SELECTION OF KEY EXHIBITS
• Shift to renewable energy and materials
• Reclaim, retain, and restore health of ecosys-tems
• Return recovered biological resources to the biosphere
• Share assets (e.g. cars, rooms, appliances)
• Reuse/secondhand
• Prolong life through maintenance, design for durability, upgradability, etc.
• Increase performance/efficiency of product
• Remove waste in production and supply chain
• Leverage big data, automation, remote sens-ing and steering
• Remanufacture products or components
• Recycle materials
• Digest anaerobically
• Extract biochemicals from organic waste
• Dematerialise directly (e.g. books, CDs, DVDs, travel)
• Dematerialise indirectly (e.g. online shop-ping)
• Replace old with advanced non-renewable ma-terials
• Apply new technologies (e.g. 3D printing)
• Choose new product/service (e.g. multimodal transport)
The ReSOLVE framework: six action areas for businesses and countries wanting to move towards the circular economy
SOURCE: Ellen MacArthur Foundation, SUN and McKinsey Center for Business and Environment, Growth Within: A Circular Economy Vision for a Competitive Europe (2015). Based on S. Heck, M. Rogers, P. Carroll, Resource Revolution (2015).
XCHANGE

6 • DELIVERING THE CIRCULAR ECONOMY – A TOOLKIT FOR POLICYMAKERS - SELECTION OF KEY EXHIBITS
Indicative prioritisation of ReSOLVE action areas for 20 sectors in Europe
ECONOMIC ACTIVITIES REGENERATE SHARE OPTIMISE LOOP VIRTUALISE EXCHANGE
Information & communication services, media and telecommunications
Scientific R&D, other professional, scientific & technical activities
Education
Human health and social work activities
Administrative & support services
Arts, entertainment and recreation
Financial and insurance activities
Legal & accounting head offices, consulting, architecture & engineering, TIC
Distributive trades (incl. wholesale and retail trade)
Manufacture of wood and paper products, and printing
Public administration and defence; compulsory social security
Real estate activities
Manufacturing of textiles, apparel, leather and related products
Construction
Manufacturing of transport equipment
Manufacturing of furniture
Water supply, waste & remediation
Manufacturing of elec. equipment, computer, electronic and optical products
Manufacturing of machinery and equipment
Manufacturing of rubber, plastics, basic and fabricated metal products
Transportation and storage
Agriculture, forestry and fishing
Manufacturing of food, beverages and tobacco products
Mining and quarrying
Electricity, gas, steam and air-conditioning supply
Manufacturing of coke, refined petroleum, chemicals products
Manufacturing of pharmaceuticals, medicinal chemical, botanical products
Accommodation and food service activities
SOURCE: Adapted from Ellen MacArthur Foundation, SUN and McKinsey Center for Business and Environment, Growth Within: A Circular Economy Vision for a Competitive Europe (2015).
High Middle Low

7 • DELIVERING THE CIRCULAR ECONOMY – A TOOLKIT FOR POLICYMAKERS - SELECTION OF KEY EXHIBITS
Estimated potential contribution of the circular economy to economic growth, job creation and reduction of greenhouse gas emissions
SOURCE: NL: TNO, Opportunities for a circular economy in the Netherlands (2013); EU (1): Ellen MacArthur Foundation, SUN and McKinsey Center for Business and Environment, Growth Within: A Circular Economy Vision for a Competitive Europe (2015); EU (2): Cambridge Econometrics / Biointelligence Service / EC, Study on modelling of the economic and environmental impacts of raw material consumption (2014); SWE: Club of Rome, The circular economy and benefits for Society (2015); UK: WRAP, Employment and the circular economy: job creation in a more resource efficient Britain (2014); FIN: SITRA, Assessing circular economy potential for Finland (2014); EU, built environment: TNO / EC, Assessment of scenarios and options towards a resource efficient Europe: an analysis for the European built environment (2013); SCO: Zero Waste Scotland, Circular economy evidence building programme: Remanufacturing study (2015); EU, waste management: Zero Waste Europe, EU circular economy package: Questioning the reasons for withdrawal (2015); CAN: Conference Board of Canada, Opportunities for Ontario’s Waste: Economic Impacts of Waste Diversion in North America (2014)
1 2030 scenario. 2 Full scenario; GDP impact equal to trade balance effect. 3 ‘Material efficiency scenario’; GDP impact equal to trade balance effect. 4 Net job creation from increased reuse, remanufacturing, recycling, bio-refining and servitisation. 5 Built environment. 6 Forestry, pulp and paper, machinery, equipment and electronics, built environment, food waste, P2P sharing. 7 Remanufacturing industry. 8 Ontario; Waste management and recycling industry. 9 Waste management and recycling industry; compiled from several reports, see http://ec.europa.eu/environment/circular-economy/index_en.htm, http://ec.europa.eu/smart-regulation/impact/planned_ia/docs/2014_env_005_waste_review_en.pdf
Ellen MacArthur Foundation, SUN and McKinsey Center for Business and Environment
Club of Rome
Club of Rome
TNO
Cambridge Econometrics, Biointelli-gence service
WRAP
EC, TNO
SITRA
Zero Waste Scotland
Conference Board of Canada
Zero Waste Europe
6.7
3.0
2.0
1.4
0.8
N/A
0.8
0.8
0.7
0.2
N/A
N/A
3.0
1.0
0.6
1.0
0.3
N/A
N/A
0.2
0.2
0.3
25.0
70.0
10.0
8.0
N/A
N/A
N/A
N/A
N/A
N/A
4.5
WH
OLE ECO
NO
MY
(MATER
IALS A
ND
EN
ERG
Y)
WH
OLE ECO
NO
MY
(MATER
IAL FO
CU
S)SELEC
TED SEC
TOR
S (M
ATERIA
L FOC
US)
GDP IMPACT NET EMPLOYMENT GHG EMISSION REDUCTION SOURCE
1
2
3
4
5
6
7
8
9

8 • DELIVERING THE CIRCULAR ECONOMY – A TOOLKIT FOR POLICYMAKERS - SELECTION OF KEY EXHIBITS
Step-by-step methodology
Select focus sectors
Map circular economy opportunities in each focus sector
Prioritise and detail circular economy opportunities
Quantify sector Impact
Identify barriers
Map sector-specific policy options
Quantify economy-wide impact
Map economy-wide policy options
Prioritise, package and sequence policy options
2.3.1
2.3.2
2.3.3
Engage businesses and other stakeholders
ALIGN ON STARTING POINT, AMBITION AND FOCUS
ASSESS SECTOR OPPORTUNITIES
ANALYSE ECONOMY-WIDE IMPLICATIONS
Baseline circularity level and policy landscape
Set ambition level
2.1 2.2 2.3
2.1.1
2.1.2
2.1.3
2.2.1
2.2.2
2.2.3
2.2.4
2.2.5
+8%
-42%
+55%
+14%
+84%
-34%
+36%
2.1 1.9
40 69
747 481
60% 53%
26% 14%
225 343
136 100
44 •
DE
LIV
ER
ING
TH
E C
IRC
ULA
R E
CO
NO
MY
– A
TO
OLK
IT F
OR
PO
LIC
YM
AK
ER
S
Figure 6: Circularity baselining in the Denmark pilot
SCOPE INDICATOR
RESOURCE PRODUCTIVITY
CIRCULAR ACTIVITIES
WASTE GENERATION
ENERGY AND GREENHOUSE GAS EMISSIONS
Resource productivity GDP EUR / kg domestic material consumption
Recycling rate, excluding major mineral waste & adjusted for trade2 tonnes recycled/tonnes treated (percent)
Eco-innovation index Index with 16 indicators (e.g. green investments, employment, patents)
Waste generated per GDP output, excluding major mineral waste tonnes recycled / ton treated (percent)
Municipal waste generated per capita3 kWh/kWh (percent)
GHG emissions per GDP output tonnes CO2e/EUR million
Share of renewable energy Percent of gross final energy consumption
1 2012 values if not stated otherwise 2 Recycling of domestically generated waste (incl. exported waste, excl. imported waste) 3 2013 data SOURCE: Resource Efficiency Scoreboard 2014 Highlights, European commission (2014); Eurostat; Statistics Denmark, Danish EPA
DENMARK1 EU-281
PT_n
ew_1
9.in
dd
4418
/06/
2015
11
:19
52 • DELIVERING THE CIRCULAR ECONOMY – A TOOLKIT FOR POLICYMAKERS
Figure 11: Results of sector prioritisation in Denmark pilot
NOTE: Only producing sectors (24% of national GVA) and hospitals (3.5% of national GVA) considered SOURCE: Statistics Denmark (2011 data); Danish Business Authority; Danish Environmental Protection Agency; Ellen MacArthur Foundation circular economy team
Producing sectors
Non-producing sector
Prioritised sectors
Size = Gross value added
Food and beverages
Construction
Machinery
Hospitals
Basic metals andfabricated products
Electronic products
Water supply, sewerage
Rubber and plastic products
Electricity, gas
Agriculture, forestry and fishing Pharmaceuticals
Mining and quarrying
ROLE IN NATIONAL ECONOMY
CIR
CU
LAR
ITY
PO
TEN
TIA
L
Packaging(not sized)
PT_new_19.indd 52 18/06/2015 11:19
ReSOLVE
58 •
DE
LIV
ER
ING
TH
E C
IRC
ULA
R E
CO
NO
MY
– A
TO
OLK
IT F
OR
PO
LIC
YM
AK
ER
S
• Use of biological elements in architecture (e.g. ‘living roofs’ that purify water) • Return of organic construction material to biosphere
• Sharing of floor space reducing demand for new buildings • Shared residential floor space (e.g. Airbnb, Couchsurfing, Hoffice)• Shared office space (e.g. Liquidspace) and increase of desk sharing policies
• Increased use of under-utilised buildings• Multi-purposing of offices and public buildings for better utilisation• Re-purposing of building interiors to increase lifetime of existing buildings
• Coordination of all stakeholders along value chain to reduce structural waste• Energy use optimisation through low-energy houses and smart homes
• Increased reuse and high-value recycling of building components and materials, enabled by • Designing buildings for disassembly• New business models (e.g. other owner of materials than property owner)• Building passports/signatures and reverse logistics ecosystems
Increased teleworking to reduce need for office floor space
Modular production off-site for rapid assembly on-site3D printing of building components
Figure 13: Qualitative assessment of potential of opportunities for the Construction & Real Estate sector in the Denmark pilot
SOURCE: Ellen MacArthur Foundation circular economy team
QUALITATIVE ASSESSMENT OF POTENTIAL
Low potential
High potential
Prioritised for further assessment
Indirectly included as enabler of key sector opportunities
XCHANGE
PT_n
ew_1
9.in
dd
5818
/06/
2015
11
:19
60 • DELIVERING THE CIRCULAR ECONOMY – A TOOLKIT FOR POLICYMAKERS
Figure 14: Schematic overview of sector-specific impact quantification
Circular scenario adoption rate, %
Business as usual scenario adoption rate, %
Net value created in sector
EUR million
Net value created in deep-dive sub-sector
EUR million
Scale up factor to full sector
%
Size of sector vs. deep-dive sub-sector
%
Scalability factor
(between 0 and 1)
Additional costs per activity
EUR per unit
Additional revenues and cost savings per activity
EUR per unit
Adoption rate%
Number of units in deep-dive sub-sector
Net value created per unit in deep-dive sub-sector
EUR per unit
SOURCE: Ellen MacArthur Foundation circular economy team
Additional sales
Price / value increase
Material / labour savings
Labour
Services
Materials / components
Energy
CapitalSector size
Deep-dive sub-sector size
A
B
2.2.4 Identify barriers
Objective: Understand the barriers standing in the way of the identified circular economy opportunities, in order to render policy options (Section 2.2.5) more targeted.
End product: Importance and description of barriers for each opportunity, structured by 15 types of barriers in four categories (economic, market failures, regulatory failures, social factors).
Once the circular economy opportunities have been prioritised, it is time to look at the barriers that stand in their way. The toolkit provides a framework to categorise these barriers and analyse their severity. Careful analysis of barriers forms the basis for the next step of arriving at targeted policy options.
The approach in this toolkit is to combine a standard analysis of market failures and regulatory failures with social factors and the economic concerns of business. The methodology refers to 15 types of barrier in four categories. It starts with the economic concerns of businesses that are assessing these opportunities: profitability, capital and technology. It includes the two ‘classic’ barrier categories from economic theory, market failures and regulatory failures, split into ten types, drawing heavily on the EU Impact
PT_new_19.indd 60 18/06/2015 11:19
100 • DELIVERING THE CIRCULAR ECONOMY – A TOOLKIT FOR POLICYMAKERS
BARRIERS
Value capture in cascading bio-refineries
Reduction of avoidable food waste
Industrialised production and 3D printing of building modules
Reuse and high value recycling of components and materials
Sharing and multi-purposing of buildings
Remanufac-turing and new business models
Increased recycling of plastic packaging
Bio-based packaging where beneficial
Performance models in procurement
Waste reduction and recycling in hospitals
Not profitable for businesses1 even if other barriers are overcome
Capital intensive and/or uncertain payback times
Technology not yet fully available at scale
Externalities (true costs) not fully refletcted in market prices
Insufficient public goods / infrastructure2 provided by the market or the state
Insufficient competition / markets leading to lower quantity and higher prices than is socially desirable
Imperfect information that negatively affects market decisions, such as asymmetric information
Split incentives (agency problem) when two parties to a transaction have different goals
Transaction costs such as the costs of finding and bargaining with customers or suppliers
Inadequately defined legal frameworks that govern areas such as the use of new technologies
Poorly defined targets and objectives which provide either insufficient or skewed direction to industry
Implementation and enforcement failures leading to the effects of regulations being diluted or altered
Unintended consequences of existing regulations that hamper circular practices
Capabilities and skills lacking either in-house or in the market at reasonable cost
Custom and habit: ingrained patterns of behaviour by consumers and businesses
1 At market prices excluding the full pricing of externalities such as greenhouse gas emissions, ecosystem degradation and resource depletion 2 Infrastructure defined as fundamental physical and organisational structures and facilities, such as transportation, communication, water and energy supplies and waste treatment
Figure 28: Barrier matrix for the ten prioritised opportunities in Denmark
Critical barrier (‘make or break’)
Very important barrier (to scale-up / acceleration of lever)
Important barrier (to scale-up / acceleration of lever)
Limited or no barrier
CIRCULAR ECONOMY OPPORTUNITIESEC
ON
OM
ICS
MA
RK
ET FAILU
RES
REG
ULA
TOR
Y
FAILU
RES
SOC
IAL
FAC
TOR
S
PT_new_19.indd 100 18/06/2015 11:19
62 • DELIVERING THE CIRCULAR ECONOMY – A TOOLKIT FOR POLICYMAKERS
BARRIERS Pub
lic
com
mun
icat
ion
cam
pai
gns
Pub
lic-
pri
vate
p
artn
ersh
ips
Ind
ustr
y co
llab
o-ra
tion
pla
tfor
ms
R&
D p
rog
r-am
mes
Fina
ncia
l sup
por
t to
bus
ines
s
Tech
nica
l su
pp
ort
to
bus
ines
s
Pub
lic p
rocu
re-
men
t ru
les
Pub
lic in
vest
-m
ent
in
infr
astr
uctu
re
Gov
ern-
men
t st
rate
gy
and
targ
ets
Pro
duc
t re
gul
atio
ns
Was
te r
egu-
lati
ons
Ind
ustr
y,
cons
umer
, co
mp
etit
ion
and
trad
e re
gul
atio
ns
Acc
ount
ing
, re
por
ting
fi
nanc
ial
reg
ulat
ions
VA
T o
r ex
cise
d
uty
red
ucti
ons
Not profitable1
Capital
Technology
Externalities
Insufficient public goods / infrastructure2
Insufficient competition / markets
Imperfect information
Split incentives (agency problem)
Transaction costs
Inadequately defined legal frameworks
Poorly defined targets and objectives
Implementation and enforcement failures
Unintended consequences
Capabilities and skills
Custom and habit
1 At market prices excluding the full pricing of externalities such as greenhouse gas emissions, ecosystem degradation and resource depletion 2 Infrastructure defined as fundamental physical and organizational structures and facilities, such as transportation, communication, water and energy supplies and waste treatment
Figure 16: Mapping policy interventions to barriers
High relevance
Medium relevance
Low relevance
Informa-tion & aware-ness
Collaboration platforms
ECO
NO
MIC
SM
AR
KET
FAILU
RES
REG
ULA
TOR
Y FA
ILUR
ESSO
CIA
L FA
CTO
RS
PT_new_19.indd 62 18/06/2015 11:19
80 •
DE
LIV
ER
ING
TH
E C
IRC
ULA
R E
CO
NO
MY
– A
TO
OLK
IT F
OR
PO
LIC
YM
AK
ER
S
Form public private partnerships to finance the deployment of mature bio-refining technologies
Reduce VAT on high value chemicals derived from waste feedstock
Stimulate the development of advanced, high-value bio-refining technologies by funding cross-institutional R&D clusters
Require municipalities to collect organic waste separately
Propose a minimum proportion of 2nd generation biofuels in the EU biofuel target
Provide a business advice service
Identify and communicate necessary changes to EU policy (or its national implementation) to address unintended consequence
Incorporate bio-refining into the government’s long-term strategic plans
Provide low-cost loans or loan guarantees for the deployment of mature bio-refining technologies
IMPA
CT
LOW
HIG
H
HIGH COST LOW
Require municipalities to send organic waste for one round of processing to extract high value compounds before it could be incinerated / used as fertiliser
Figure 22: Prioritisation of opportunities
SOURCE: Ellen MacArthur Foundation circular economy team; NERA Economic Consulting
PT_n
ew_1
9.in
dd
8018
/06/
2015
11
:19

9 • DELIVERING THE CIRCULAR ECONOMY – A TOOLKIT FOR POLICYMAKERS - SELECTION OF KEY EXHIBITS
Schematic overview of sector-specific impact quantification
Circular scenario adoption rate, %
Business as usual scenario adoption rate, %
Net value created in sector
EUR million
Net value created in deep-dive sub-sector
EUR million
Scale up factor to full sector
%
Size of sector vs. deep-dive sub-sector
%
Scalability factor
(between 0 and 1)
Additional costs per activity
EUR per unit
Additional revenues and cost savings per activity
EUR per unit
Adoption rate%
Number of units in deep-dive sub-sector
Net value created per unit in deep-dive sub-sector
EUR per unit
SOURCE: Ellen MacArthur Foundation
Additional sales
Price / value increase
Material / labour savings
Labour
Services
Materials / components
Energy
CapitalSector size
Deep-dive sub-sector size
A
B

10 • DELIVERING THE CIRCULAR ECONOMY – A TOOLKIT FOR POLICYMAKERS - SELECTION OF KEY EXHIBITS
POLICY INTERVENTION TYPES
EXAMPLES
EDUCATION, INFORMATION & AWARENESS
Integration of circular economy/systems thinking into school and university curricula
Public communication and information campaigns
COLLABORATION PLATFORMS
Public-private partnerships with businesses at national, regional and city level
Encouragement of voluntary industry collaboration platforms, encouraging value-chain and cross-sectoral initiatives and information sharing
R&D programmes in the fields of, for example, material sciences and biosystems
BUSINESS SUPPORT SCHEMES
Financial support to business, for example direct subsidies, provision of capital, financial guarantees
Technical support, advisory, training and demonstration of best practices to business
PUBLIC PROCUREMENT & INFRASTRUCTURE
Public procurement
Public investment in infrastructure
REGULATORY FRAMEWORKS
Government (sector) strategy and associated targets on resource productivity and circular economy
Product regulations, including design, extended warranties and product passports
Waste regulations, including collection and treatment standards and targets, the definition of waste, extended producer responsibility and take-back systems
Industry, consumer, competition and trade regulations, for example on food safety
Accounting, reporting and financial regulations including accounting for natural capital and resources, and the fiduciary duty of investors and managers
FISCAL FRAMEWORKS
VAT or excise duty reductions for circular products and services
Tax shift from labour to resources
Six policy intervention types with examples

11 • DELIVERING THE CIRCULAR ECONOMY – A TOOLKIT FOR POLICYMAKERS - SELECTION OF KEY EXHIBITS
Mapping policy interventions to barriers
Business support schemes
Public procurement & infrastructure
Regulatory frameworks
Fiscal frame-works
BARRIERS Publ
ic
com
mun
icat
ion
cam
paig
ns
Publ
ic- p
riva
te
part
ners
hips
Indu
stry
col
labo
-ra
tion
pla
tfor
ms
R&D
pro
gr-
amm
es
Fina
ncia
l sup
port
to
bus
ines
s
Tech
nica
l su
ppor
t to
bu
sine
ss
Publ
ic p
rocu
re-
men
t ru
les
Publ
ic in
vest
-m
ent
in
infr
astr
uctu
re
Gov
ern-
men
t st
rate
gy a
nd
targ
ets
Prod
uct
regu
lati
ons
Was
te re
gu-
lati
ons
Indu
stry
, co
nsum
er,
com
peti
tion
and
tr
ade
regu
lati
ons
Acc
ount
ing,
re
port
ing
fina
ncia
l re
gula
tion
s
VAT
or e
xcis
e du
ty re
duct
ions
Not profitable1
Capital
Technology
Externalities
Insufficient public goods / infrastructure2
Insufficient competition / markets
Imperfect information
Split incentives (agency problem)
Transaction costs
Inadequately defined legal frameworks
Poorly defined targets and objectives
Implementation and enforcement failures
Unintended consequences
Capabilities and skills
Custom and habit
1 At market prices excluding the full pricing of externalities such as greenhouse gas emissions, ecosystem degradation and resource depletion 2 Infrastructure defined as fundamental physical and organizational structures and facilities, such as transportation, communication, water and energy supplies and waste treatment
High relevance
Medium relevance
Low relevance
Informa-tion & aware-ness
Collaboration platforms
ECON
OM
ICS
MA
RK
ET FAILU
RES
REG
ULATO
RY FA
ILUR
ESSO
CIA
L FA
CTO
RS

12 • DELIVERING THE CIRCULAR ECONOMY – A TOOLKIT FOR POLICYMAKERS - SELECTION OF KEY EXHIBITS
POLICY OPTIONS TO ENABLE ECONOMY-WIDE TRANSITION
CLEAR DIRECTION
REALIGNED INCENTIVES
EDUCATION AND KNOWLEDGE BUILDING
SECTOR 1 SECTOR 2 SECTOR 3 SECTOR 4
POLICY OPTIONS TO ENABLE SECTOR-SPECIFIC TRANSITIONS1
How economy-wide circular economy policy might complement sector-specific policy
1 One policy package per circular economy opportunity. For definitions of policy types, see Figure 7. SOURCE: Ellen MacArthur Foundation. Adapted from Ellen MacArthur Foundation, SUN and McKinsey Center for Business and Environment, Growth Within: A Circular Economy Vision for a Competitive Europe (2015).

13 • DELIVERING THE CIRCULAR ECONOMY – A TOOLKIT FOR POLICYMAKERS - SELECTION OF KEY EXHIBITS
• Prepare implementation of policy packages to support 1-2 ‘quick win’ sector opportunities:
- Conduct further consultation with businesses and other stakeholders
- Conduct detailed policy cost-benefit and feasibility analysis
- Gather political support for policy intervention
• Investigate which economy-wide policy options and potential sector packages could be implemented at a later stage
• Implement selected ‘quick win’ opportunities; track progress and adapt implementation as needed
• Building on momentum of ‘quick wins’, prepare implementation of (and start implementing) 2-3 economy-wide policy options and potential sector packages
• Continue implementation, track progress and adapt implementation as needed
• Assess overall program success and determine next steps
SHORT TERM
MEDIUM TERM
LONG TERM
Example roadmap for packaging and implementing policy options

14 • DELIVERING THE CIRCULAR ECONOMY – A TOOLKIT FOR POLICYMAKERS - SELECTION OF KEY EXHIBITS
CASE STUDYDENMARK

15 • DELIVERING THE CIRCULAR ECONOMY – A TOOLKIT FOR POLICYMAKERS - SELECTION OF KEY EXHIBITS
Circularity baselining in the Denmark pilot
+8%
-42%
+55%
+14%
+84%
-34%
+36%
2.1 1.9
40 69
747 481
60% 53%
26% 14%
225 343
136 100
SCOPE INDICATOR
RESOURCE PRODUCTIVITY
CIRCULAR ACTIVITIES
WASTE GENERATION
ENERGY AND GREENHOUSE GAS EMISSIONS
Resource productivity GDP EUR / kg domestic material consumption
Recycling rate, excluding major mineral waste & adjusted for trade2 tonnes recycled/tonnes treated (percent)
Eco-innovation index Index with 16 indicators (e.g. green investments, employment, patents)
Waste generated per GDP output, excluding major mineral waste tonnes / EUR million
Municipal waste generated per capita3 tonnes / capita
GHG emissions per GDP output tonnes CO2e/EUR million
Share of renewable energy Percent of gross final energy consumption
1 2012 values if not stated otherwise 2 Recycling of domestically generated waste (incl. exported waste, excl. imported waste) 3 2013 data SOURCE: Resource Efficiency Scoreboard 2014 Highlights, European commission (2014); Eurostat; Statistics Denmark, Danish EPA
DENMARK1 EU-281

16 • DELIVERING THE CIRCULAR ECONOMY – A TOOLKIT FOR POLICYMAKERS - SELECTION OF KEY EXHIBITS
POLICY INTERVENTION TYPES
EXAMPLES OF EXISTING INTERVENTIONS EXAMPLES OF POSSIBLE ADDITIONAL INTERVENTIONS (AS OBSERVED AT START OF PROJECT AND NOT TAKING INTO ACCOUNT SUBSEQUENT ANALYSIS)
EDUCATION, INFORMATION & AWARENESS
• Consumer information campaigns, e.g. ‘Use more, waste less’ and ‘Stop Wasting Food’
• Systems thinking integrated in curricula• Further pilot projects to demonstrate circular economy
potential to businesses
COLLABORATION PLATFORMS
• Green Industrial Symbiosis programme• Four new partnerships (food, textile, construction and packaging) as part
of the Danish Waste Prevention Strategy• Rethink Resources, an innovation centre to support resource efficiency in
companies • ‘Genbyg Skive’ pilot project to re-use building materials to create business
opportunities and reduce waste
-
BUSINESS SUPPORT SCHEMES
• Fund for Green Business Development (EUR 27m 2013–2018) to support innovation and new business models
• Maabjerg Energy Concept (MEC) bio-refinery part funded by Innovation Fund Denmark (EUR 40m)
• Dutch ‘Green Deal’ inspired programme to provide on-demand support to companies in implementing circular economy opportunities
PUBLIC PROCUREMENT & INFRASTRUCTURE
• Government Strategy on Intelligent Public Procurement contains initiatives to support circular procurement practices
• Strategy on waste prevention also contains an initiative to develop guidelines for circular public procurement
• Guidelines on the circularity of materials and products integrated into public procurement policy
REGULATORY FRAMEWORKS
• Ambitious energy efficiency and GHG emissions targets, e.g. 40% GHG reduction by 2020 vs. 20% at EU level,
• Ambitious targets for recycling/incineration/landfill, updated every 6 years, e.g. recycle 50% of household waste by 2022
• Taskforce for increased resource efficiency to review existing regulations affecting circular economy practices
• New metrics introduced to measure economic performance, e.g. complements to GDP such as natural capital
• Engagement at EU level to adapt existing or introduce new regulations relevant to the circular economy, e.g. product policy
FISCAL FRAMEWORKS • Taxes on extraction and import of raw materials, vehicle registration and water supply
• High and incrementally increased taxes on incineration / landfill to promote recycling and waste prevention
• Highest energy taxes in Europe (70% above EU27) and CO2 taxes• Tax cuts designed to promote use of low-carbon energy
• Investigation into effects of tax shift from labour to resources
SOURCE: European Commission, Tax reforms in EU Member States 2013; IEA, Energy Policies of Denmark: 2011 review; Nordic Council of Ministers, The use of economic instruments in Nordic environmental policy 2010-2013; Danish legislative council, Waste management policy in Denmark, 2014; The Ex’Tax project, New era. New plan. Fiscal reforms for an inclusive, circular economy, 2014.
Policy landscape in the Denmark pilot

17 • DELIVERING THE CIRCULAR ECONOMY – A TOOLKIT FOR POLICYMAKERS - SELECTION OF KEY EXHIBITS
Results of sector prioritisation in Denmark pilot
NOTE: Only producing sectors (24% of national GVA) and hospitals (3.5% of national GVA) considered SOURCE: Statistics Denmark (2011 data); Danish Business Authority; Danish Environmental Protection Agency; Ellen MacArthur Foundation
Producing sectors
Non-producing sector
Prioritised sectors
Size = Gross value added
Food and beverages
Construction
Machinery
Hospitals
Basic metals andfabricated products
Electronic products
Water supply, sewerage
Rubber and plastic products
Electricity, gas
Agriculture, forestry and fishing Pharmaceuticals
Mining and quarrying
ROLE IN NATIONAL ECONOMY
CIR
CU
LAR
ITY
PO
TEN
TIA
L
Packaging(not sized)
18 • DELIVERING THE CIRCULAR ECONOMY – A TOOLKIT FOR POLICYMAKERS - SELECTION OF KEY EXHIBITS
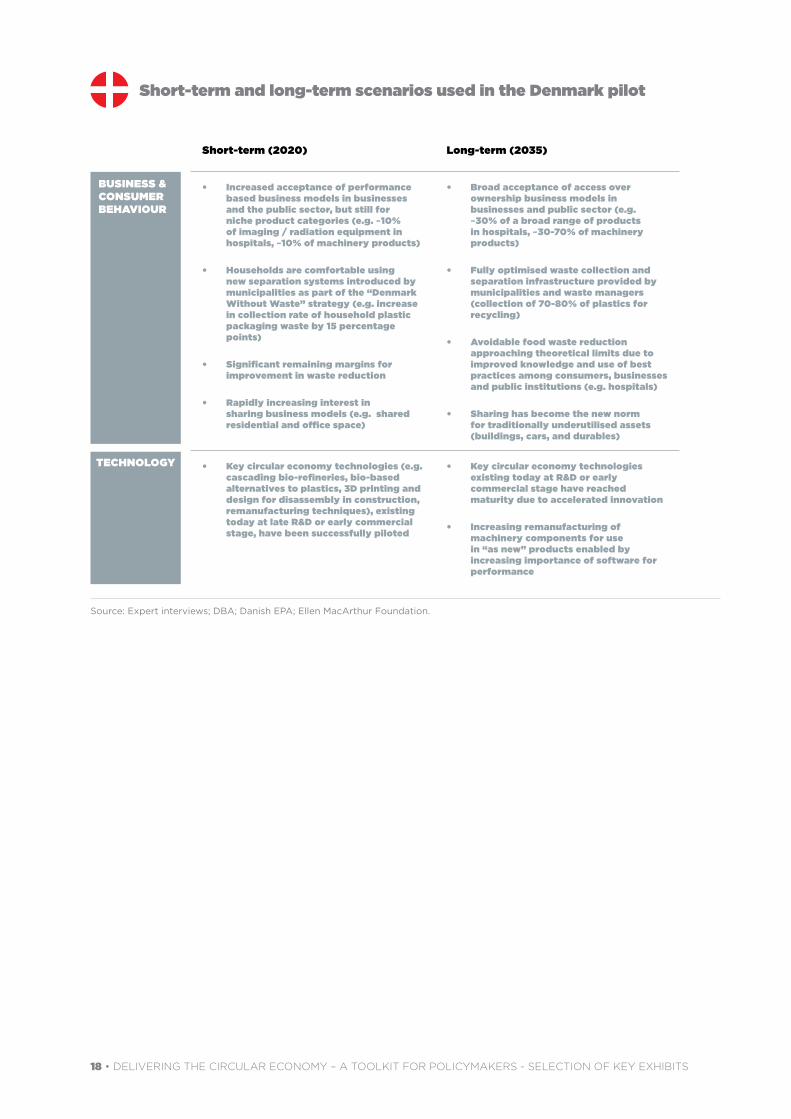
Short-term and long-term scenarios used in the Denmark pilot
Short-term (2020) Long-term (2035)
• Increased acceptance of performance based business models in businesses and the public sector, but still for niche product categories (e.g. ~10% of imaging / radiation equipment in hospitals, ~10% of machinery products)
• Households are comfortable using new separation systems introduced by municipalities as part of the “Denmark Without Waste” strategy (e.g. increase in collection rate of household plastic packaging waste by 15 percentage points)
• Significant remaining margins for improvement in waste reduction
• Rapidly increasing interest in sharing business models (e.g. shared residential and office space)
• Broad acceptance of access over ownership business models in businesses and public sector (e.g. ~30% of a broad range of products in hospitals, ~30-70% of machinery products)
• Fully optimised waste collection and separation infrastructure provided by municipalities and waste managers (collection of 70-80% of plastics for recycling)
• Avoidable food waste reduction approaching theoretical limits due to improved knowledge and use of best practices among consumers, businesses and public institutions (e.g. hospitals)
• Sharing has become the new norm for traditionally underutilised assets (buildings, cars, and durables)
• Key circular economy technologies (e.g. cascading bio-refineries, bio-based alternatives to plastics, 3D printing and design for disassembly in construction, remanufacturing techniques), existing today at late R&D or early commercial stage, have been successfully piloted
• Key circular economy technologies existing today at R&D or early commercial stage have reached maturity due to accelerated innovation
• Increasing remanufacturing of machinery components for use in “as new” products enabled by increasing importance of software for performance
Source: Expert interviews; DBA; Danish EPA; Ellen MacArthur Foundation.
BUSINESS & CONSUMER BEHAVIOUR
TECHNOLOGY

19 • DELIVERING THE CIRCULAR ECONOMY – A TOOLKIT FOR POLICYMAKERS - SELECTION OF KEY EXHIBITS
Qualitative opportunity prioritisation of focus sectors in the Denmark pilot
1 Assessment based on focus subsector, product category or material stream in each sector. Food & beverage: Waste/by-products from pork / dairy processing, residual biomass from agriculture, organic waste from households, retail & hospitality. Construction: New buildings. Machinery: Manufacturing of pumps and wind turbines. Packaging: Plastic packaging. Hospitals: Purchasing of goods. SOURCE: Ellen MacArthur Foundation
QUALITATIVE ASSESSMENT OF POTENTIAL IN DENMARK PILOT1
Low potential High potential
Prioritised for fur-ther assessment
Indirectly included or enabler of key sector opportunities
FOOD & BEV. CONSTRUCTION MACHINERY PACKAGING HOSPITALS
XCHANGE

20 • DELIVERING THE CIRCULAR ECONOMY – A TOOLKIT FOR POLICYMAKERS - SELECTION OF KEY EXHIBITS
Ten circular economy opportunities in five focus sectors
SOURCE: Ellen MacArthur Foundation
Value capture in cascading bio-refineries
Industrialised production and 3D printing of building modules
Increased recycling of plastic packaging
Bio-based packaging where beneficial
Performance models in procurement
Reduction of avoidable food waste
Reuse and high-value recycling of components and materials
Sharing and multi-purposing of buildings
Remanufacturing and new business models
Waste reduction and recycling
1
2
3
4
5
6
7
8
9
10
FOOD AND BEVERAGE
CONSTRUCTION AND REAL ESTATE
MACHINERY
PLASTIC PACKAGING
HOSPITALS

21 • DELIVERING THE CIRCULAR ECONOMY – A TOOLKIT FOR POLICYMAKERS - SELECTION OF KEY EXHIBITS
Illustrative status of circular economy in Denmark today and potential by 2035
• ~90% of organic waste in advanced AD and cascaded bio-refining
• 40–50 kg/capita avoidable food waste p.a.
• 15% of building materials and components reused; recycling with higher quality
• <1% waste in construction process
• Widespread building sharing
• 15–35% remanufacturing
• 10–15% performance contracts
• ~75% recycling
• Bio-based materials replacing petro-based plastics in selected products
• Avoidable waste designed out• >80% recycling (of non-toxic
waste)• 40% performance models
adoption for addressable equipment
• 100% renewables in electricity and heating
• Oil for heating and coal phased out
• Fossil fuels remain in e.g. transport
TRANSITION ECONOMY• Low-value circular flows (e.g.
recycling, AD)• Mix of renewable and non-re-
newable energy
CIRCULAR ECONOMY• High-value circular flows (e.g. reuse, reman,
cascaded value extraction for organics)• Circular business models (e.g. sharing, leasing)• Renewable energy
FOOD AND BEVERAGE
BUILT ENVIRONMENT
MACHINERY
PLASTIC PACKAGING
HOSPITALS
ENERGY (NOT FOCUS IN PILOT)
DENMARK (BASED ON SECTORS ABOVE)
• Near 100% of industrial organic waste valorised, but mainly in low-value applications (e.g. energy recovery, animal feed); ~3% of waste used in advanced AD, <1% cascaded bio-refining
• 80–90 kg/capita avoidable food waste p.a.
• 87% of construction & demolition waste recycled yet with low quality; <1% reuse
• 10–15% materials wasted during construction
• First sharing platforms (e.g. AirBnB)
• Very high recycling rates; <1% remanufacturing
• Lifetimes already (being) optimised using e.g. predictive maintenance
• <1% performance contracts
• ~30% recycling (rest incinerated)
• Plastic packaging largely petro-based
• High levels of waste
• 15–30% recycling
• Performance models only adopted for textiles
• >40% renewables in electricity
• 26% renewables in final energy consumption
2015
2035
SOURCE: Statistics Denmark; Eurostat; Danish Climate Policy Plan; expert interviews; Ellen MacArthur Foundation
LINEAR ECONOMY• Linear flows (landfill, incineration)• Efficiency; waste avoidance• Non-renewable energy
2015 2035

22 • DELIVERING THE CIRCULAR ECONOMY – A TOOLKIT FOR POLICYMAKERS - SELECTION OF KEY EXHIBITS
Economy-wide impact by 2035. Absolute and percentage change relative to the ‘business as usual’ scenario.
1 Employment impact modelled through conversion of labour bill to job equivalents via a wage curve approach (elasticity = 0.2). Percentage change is vs. 2013 total full-time employment (Source: Statistics Denmark) 2 Change in Global CO2 emissions vs. Denmark baseline 2035 emissions; other GHG emissions are not included. SOURCE: Ellen MacArthur Foundation; NERA Economic Consulting
0.8%
1.4% 0.6%
0.4% -2.5%
-6.9%-2.3
-0.87,300
13,3006.2
3.6
GDP EUR billion (2015 prices)
Employment1 Job equivalents
CO2 footprint2 Million tonnes of CO2
CON
SERVATIVE
AM
BITIOU
S
x% Percentage change 2035 vs. ‘business as usual’ scenario
Estimated potential impact of further transitioning to the circular economy in Denmark

23 • DELIVERING THE CIRCULAR ECONOMY – A TOOLKIT FOR POLICYMAKERS - SELECTION OF KEY EXHIBITS
Figure 27 shows a breakdown of these results along the seven quantified circular economy opportunities. Three circular economy opportunities have not been quantified. The economic impacts of the two packaging opportunities and the opportunity related to waste reduction and recycling in hospitals have not been quantified as it is expected that their magnitude would be limited when compared to the full Danish economy.
Figure 27: Breakdown of potential economic impact by quantified opportunity
1 Average between conservative and ambitious scenario. This sector-specific impact does not include indirect effects, e.g. on supply chains, that are captured in the economy-wide CGE modelling. 2 Including scaling from machinery sector (including pumps, wind turbines and other machinery products) to adjacent manufacturing sectors (electronic products, basic metals and fabricated products, other manufacturing, mining and quarrying) SOURCE: Ellen MacArthur Foundation
CIRCULAR ECONOMY OPPORTUNITY
ESTIMATED ANNUAL VALUE CREATED BY 20351
Industrialised production and 3D printing of building modules
Value capture in cascading bio-refineries
Remanufacturing and new business models2
Sharing and multi-purposing of buildings
Reuse and high-value recycling of components and materials
Reduction of avoidable food waste
Performance models in procurement
Total
33%
17%
17%
16%
7%
7%
3%
100%
Breakdown of potential economic impact by quantified opportunity

24 • DELIVERING THE CIRCULAR ECONOMY – A TOOLKIT FOR POLICYMAKERS - SELECTION OF KEY EXHIBITS
BARRIERS
Value capture in cascading bio-refineries
Reduction of avoidable food waste
Industrialised production and 3D printing of building modules
Reuse and high value recycling of components and materials
Sharing and multi-purposing of buildings
Remanufac-turing and new business models
Increased recycling of plastic packaging
Bio-based packaging where beneficial
Performance models in procurement
Waste reduction and recycling in hospitals
Not profitable for businesses1 even if other barriers are overcome
Capital intensive and/or uncertain payback times
Technology not yet fully available at scale
Externalities (true costs) not fully refletcted in market prices
Insufficient public goods / infrastructure2 provided by the market or the state
Insufficient competition / markets leading to lower quantity and higher prices than is socially desirable
Imperfect information that negatively affects market decisions, such as asymmetric information
Split incentives (agency problem) when two parties to a transaction have different goals
Transaction costs such as the costs of finding and bargaining with customers or suppliers
Inadequately defined legal frameworks that govern areas such as the use of new technologies
Poorly defined targets and objectives which provide either insufficient or skewed direction to industry
Implementation and enforcement failures leading to the effects of regulations being diluted or altered
Unintended consequences of existing regulations that hamper circular practices
Capabilities and skills lacking either in-house or in the market at reasonable cost
Custom and habit: ingrained patterns of behaviour by consumers and businesses
1 At market prices excluding the full pricing of externalities such as greenhouse gas emissions, ecosystem degradation and resource depletion 2 Infrastructure defined as fundamental physical and organisational structures and facilities, such as transportation, communication, water and energy supplies and waste treatment
Barrier matrix for the ten prioritised opportunities in Denmark
Critical barrier (‘make or break’)
Very important barrier (to scale-up / acceleration of lever)
Important barrier (to scale-up / acceleration of lever)
Limited or no barrier
CIRCULAR ECONOMY OPPORTUNITIES
ECON
OM
ICS
MA
RK
ET FAILU
RES
REG
ULATO
RY FA
ILUR
ESSO
CIA
L FA
CTO
RS

25 • DELIVERING THE CIRCULAR ECONOMY – A TOOLKIT FOR POLICYMAKERS - SELECTION OF KEY EXHIBITS
Prioritisation of policy options – ‘Value capture in cascading bio-refineries’
Form public private partnerships to finance the deployment of mature bio-refining technologies
Reduce VAT on high value chemicals derived from waste feedstock
Stimulate the development of advanced, high-value bio-refining technologies by funding cross-institutional R&D clusters
Require municipalities to collect organic waste separately
Propose a minimum proportion of 2nd generation biofuels in the EU biofuel target
Provide a business advice service
Identify and communicate necessary changes to EU policy (or its national implementation) to address unintended consequence
Incorporate bio-refining into the government’s long-term strategic plans
Provide low-cost loans or loan guarantees for the deployment of mature bio-refining technologies
IMPA
CT
LOW
HIG
H
HIGH COST LOW
Require municipalities to send organic waste for one round of processing to extract high value compounds before it could be incinerated / used as fertiliser
SOURCE: Ellen MacArthur Foundation; NERA Economic Consulting