Embed Size (px)
Citation preview

Grant agreement no:
608571
Project acronym:
SUCCESS
Project full title:
Industrial steam generation with 100% carbon capture and insignificant efficiency penalty - scale-up
of oxygen carrier for chemical-looping combustion using environmentally sustainable materials
Collaborative project
Theme:
FP7 – ENERGY.2013.5.1.1
Deliverable D5.14
Report on scale-up of CLC
to 1 MW fuel power
Due delivery date: 2017-02-28
Actual delivery date: 2017-03-31
Lead beneficiary:
Partner no. 8 – Technische Universität Darmstadt (TUD)
Dissemination level:
Public (PU)

2
DELIVERABLE 5.2
Report on scale-up of CLC to 1 MW fuel power
SUCCESS - Industrial steam generation with 100% carbon capture and insignificant efficien-cy penalty - scale-up of oxygen carrier for chem-ical-looping combustion using Environmentally sustainable materials
Keywords: CLC pilot plant, design optimization
Work package: 5 – Performance of oxygen car-riers from tonne scale production on CLC pilot units up to 1 MW fuel power
Involved partners: TUD Dissemination level: Restricted (RE)
Objective TUD will perform and evaluate two comprehensive test campaigns in 3-shift mode operation. The pilot plant will be operated with up to 1 MW gas power in the fuel reactor using one selected oxy-gen carrier produced at tonne scale in WP3. In the first test campaign, the behaviour of the oxygen carrier will be investigated. Mechanical stability, reactivity and long-term behaviour will be deter-mined. In the second test campaign, the process will be optimized regarding the operating condi-tions, e.g. temperature in air reactor and fuel reactor or circulating mass flow between both reac-tors. In order to support preparation of test campaigns and data evaluation from testing, a process simulation model for the 1 MWth pilot plant will be set up using Aspen Plus software. Justification for delayed submission: The slight deviation of one month can be explained by the delayed delivery of the oxygen carrier material. The above described test campaigns as well as the evaluation of data have been per-formed with greatest possible commitment to avoid further delay.

3
Table of Contents
1 Introduction ..................................................................................................................................... 4
2 Experimental setup ......................................................................................................................... 4
2.1 Configuration of the pilot plant ............................................................................................... 4
2.2 Oxygen carrier ......................................................................................................................... 5
2.3 Natural gas............................................................................................................................... 6
2.4 Evaluation parameters ............................................................................................................ 7
3 Results and discussion ..................................................................................................................... 8
3.1 Pressure and temperature profiles ....................................................................................... 10
3.2 Fuel conversion and air/fuel ratio ......................................................................................... 11
3.3 Performance of the POC (Post Oxidation Chamber) ............................................................. 12
3.4 Solid analyses and oxygen carrier circulation ....................................................................... 13
3.5 Comparison of results with results from 120 kWth unit (Vienna).......................................... 17
4 Conclusions .................................................................................................................................... 18
5 References ..................................................................................................................................... 19

4
1 Introduction The 1 MWth CLC pilot plant at TUD was originally designed to utilize solids fuels [1]. The operation
with gaseous fuels has other requirements, e.g. a significantly higher oxygen carrier circulation rate
or a higher reactivity of the oxygen carrier with natural gas/methane. To meet up with these re-
quirements the pilot plant design has to be optimized to reach high methane conversion. Since the
pilot plant is fully refractory lined, larger modifications of the reactor setup, e.g. enlargement of the
reactor diameters, are not feasible within the given time and cost frame. Hence, appropriate adapta-
tions have been made to optimize the operation of CLC of the 1 MWth pilot plant.
The most important results of CLC tests at 1 MWth scale using the developed material “C28” are pre-
sented in this work. Evaluation parameters are defined and calculated. Furthermore, the perfor-
mance of the post oxidation chamber (POC) is presented as well as information about evolution of
solids. Results are compared with those from other CLC units that have been operated within the
SUCCESS project.
2 Experimental setup
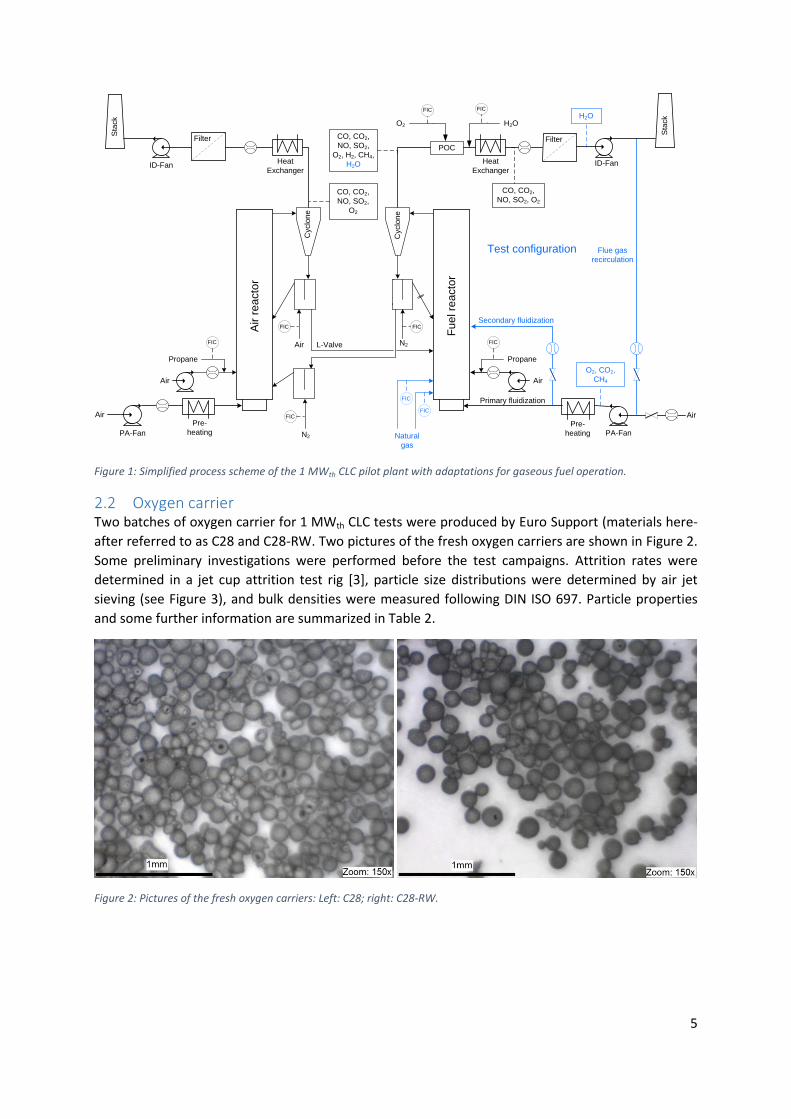
2.1 Configuration of the pilot plant The test configuration is shown in Figure 1. The main modifications or additional components com-
pared to former tests [2] are the following
Natural gas supply
Flue gas recirculation
Secondary fluidization
Pneumatic sorbents conveying system (not depicted in Figure 1)
Additionally, two moisture measurements were installed downstream the fuel reactor (downstream
the cyclone and downstream post oxidation chamber). This enables an appropriate evaluation of the
results since the steam content of the fuel reactor off gas is relatively high during CLC with natural
gas. The main dimensions and design specifications of the 1 MWth CLC pilot plant are given in Table 1.
Table 1: Main dimensions and design specifications of the 1 MWth CLC pilot plant
Description Unit Air reactor Fuel reactor
Diameter m 0.59 0.40 Height m 8.66 11.35 Fuel power kWth - 500…1000 Temperatures °C 950…1050 850…950 Superficial gas velocity m s-1 3…5 4…6 Fluidization agent - Air Recirculated flue gas Specific Inventory kg MWth
-1 50…200 50…200
5
Figure 1: Simplified process scheme of the 1 MWth CLC pilot plant with adaptations for gaseous fuel operation.
2.2 Oxygen carrier Two batches of oxygen carrier for 1 MWth CLC tests were produced by Euro Support (materials here-
after referred to as C28 and C28-RW. Two pictures of the fresh oxygen carriers are shown in Figure 2.
Some preliminary investigations were performed before the test campaigns. Attrition rates were
determined in a jet cup attrition test rig [3], particle size distributions were determined by air jet
sieving (see Figure 3), and bulk densities were measured following DIN ISO 697. Particle properties
and some further information are summarized in Table 2.
Figure 2: Pictures of the fresh oxygen carriers: Left: C28; right: C28-RW.
PA-Fan
ID-Fan
Filter
Sta
ck
ID-Fan
Pre-
heating
Air r
ea
cto
r
Fu
el re
acto
r
Heat
Exchanger
Heat
Exchanger
PA-Fan
Sta
ck
CO, CO2,
NO, SO2,
O2, H2, CH4,
H2O
CO, CO2,
NO, SO2,
O2
Cyclo
ne
Cyclo
ne
POC
O2
Air N2
Air
Natural
gas
Air
Secondary fluidization
Air
Propane
FIC
Filter
FIC FIC
L-Valve
Pre-
heating
FIC
Propane
FIC
Air
Flue gas
recirculation
FIC
FIC
FIC
FIC
H2O
O2, CO2,
CH4
Primary fluidization
Test configuration
CO, CO2,
NO, SO2, O2
H2O
N2

6
Figure 3: Left: Attrition test of fresh C28 and C28-RW. Right: Particle size distributions of fresh samples.
The total available mass of fresh oxygen carrier (C28 and C28-RW) was 2.2 tons. The physical proper-
ties of both batches are almost identical except for the attrition index. The measured attrition was
significantly higher for C28-RW. However, the material has shown an increasing mechanical strength
during CLC experiments in other units. Ilmenite was selected as back-up material in the case that the
C28 materials were used up relatively quickly (preliminary investigations on the material properties
were done according to the above described methods).
Table 2: Oxygen carrier properties
Properties Unit C28 C28-RW Ilmenite
Other nomenclature in the project - C28-902 C28-902-RW - Received mass (fresh OC) kg 1600 600 - Bulk density kg/m3 1356 1300 2533 dp50 µm 134 143 154 Sauter diameter µm 123 125 139 Attrition index wt.-%/h 2.8 7.2 0.4 Fusion temperature °C 1494 - 1549
2.3 Natural gas The composition of the natural gas is shown in Table 3. The amount of methane is lower and the
amount of ethane is significantly higher compared to other test campaigns (e.g. Vienna, cf. [4]).
Hence, some evaluation parameters were adjusted accordingly (cf. section 2.4).
Table 3: Composition of natural gas [5]
Component Unit Value
CH4 Vol.-% 92.62 C2H6 Vol.-% 4.77 C3H8 Vol.-% 0.36 CO2 Vol.-% 1.42 N2 / others Vol.-% 0.83 LHV kWh/m3 10.22
0
1
2
3
4
5
6
7
0 20 40 60
Att
riti
on
[w
t.-%
]
Time [min]
C28
C28-RW
2.8 wt.-%/h
7.2 wt.-%/h
0
0.1
0.2
0.3
0.4
0.5
0.6
Fra
cti
on
[-]
Particle diameter [μm]
C28 C28-RW
7
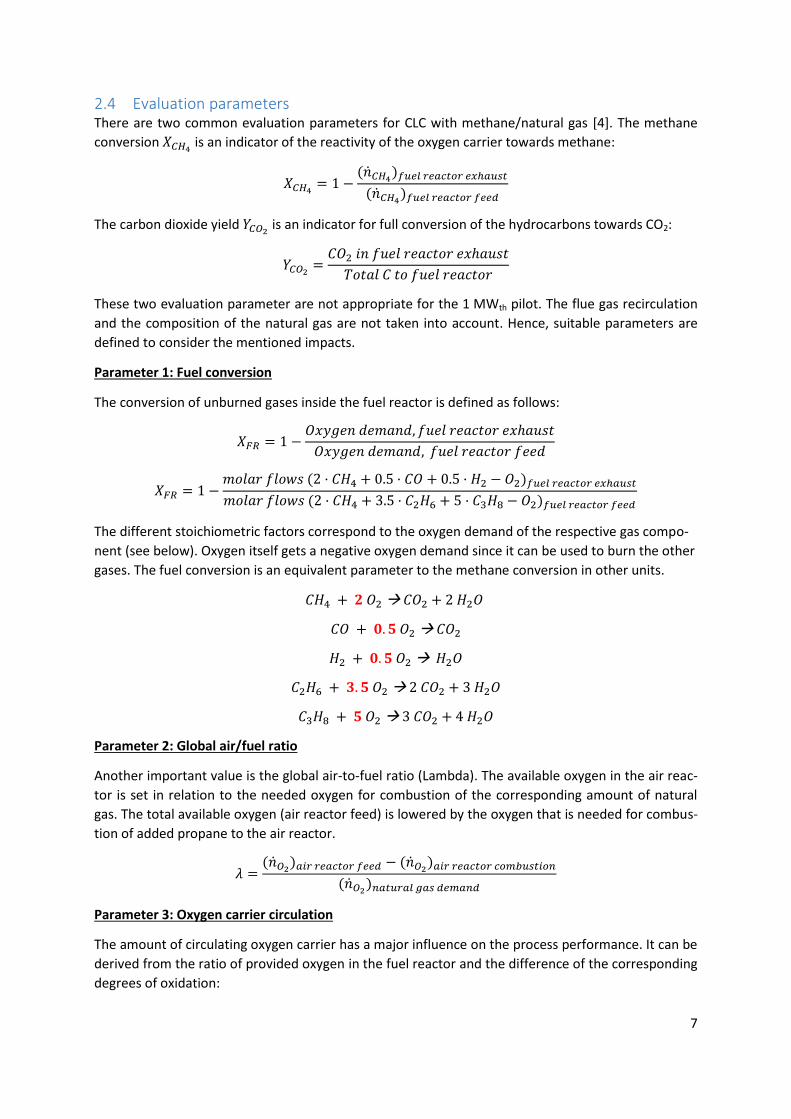
2.4 Evaluation parameters There are two common evaluation parameters for CLC with methane/natural gas [4]. The methane
conversion 𝑋𝐶𝐻4 is an indicator of the reactivity of the oxygen carrier towards methane:
𝑋𝐶𝐻4= 1 −
(�̇�𝐶𝐻4)𝑓𝑢𝑒𝑙 𝑟𝑒𝑎𝑐𝑡𝑜𝑟 𝑒𝑥ℎ𝑎𝑢𝑠𝑡
(�̇�𝐶𝐻4)𝑓𝑢𝑒𝑙 𝑟𝑒𝑎𝑐𝑡𝑜𝑟 𝑓𝑒𝑒𝑑
The carbon dioxide yield 𝑌𝐶𝑂2 is an indicator for full conversion of the hydrocarbons towards CO2:
𝑌𝐶𝑂2=
𝐶𝑂2 𝑖𝑛 𝑓𝑢𝑒𝑙 𝑟𝑒𝑎𝑐𝑡𝑜𝑟 𝑒𝑥ℎ𝑎𝑢𝑠𝑡
𝑇𝑜𝑡𝑎𝑙 𝐶 𝑡𝑜 𝑓𝑢𝑒𝑙 𝑟𝑒𝑎𝑐𝑡𝑜𝑟
These two evaluation parameter are not appropriate for the 1 MWth pilot. The flue gas recirculation
and the composition of the natural gas are not taken into account. Hence, suitable parameters are
defined to consider the mentioned impacts.
Parameter 1: Fuel conversion
The conversion of unburned gases inside the fuel reactor is defined as follows:
𝑋𝐹𝑅 = 1 −𝑂𝑥𝑦𝑔𝑒𝑛 𝑑𝑒𝑚𝑎𝑛𝑑, 𝑓𝑢𝑒𝑙 𝑟𝑒𝑎𝑐𝑡𝑜𝑟 𝑒𝑥ℎ𝑎𝑢𝑠𝑡
𝑂𝑥𝑦𝑔𝑒𝑛 𝑑𝑒𝑚𝑎𝑛𝑑, 𝑓𝑢𝑒𝑙 𝑟𝑒𝑎𝑐𝑡𝑜𝑟 𝑓𝑒𝑒𝑑
𝑋𝐹𝑅 = 1 −𝑚𝑜𝑙𝑎𝑟 𝑓𝑙𝑜𝑤𝑠 (2 · 𝐶𝐻4 + 0.5 · 𝐶𝑂 + 0.5 · 𝐻2 − 𝑂2)𝑓𝑢𝑒𝑙 𝑟𝑒𝑎𝑐𝑡𝑜𝑟 𝑒𝑥ℎ𝑎𝑢𝑠𝑡
𝑚𝑜𝑙𝑎𝑟 𝑓𝑙𝑜𝑤𝑠 (2 · 𝐶𝐻4 + 3.5 · 𝐶2𝐻6 + 5 · 𝐶3𝐻8 − 𝑂2)𝑓𝑢𝑒𝑙 𝑟𝑒𝑎𝑐𝑡𝑜𝑟 𝑓𝑒𝑒𝑑
The different stoichiometric factors correspond to the oxygen demand of the respective gas compo-
nent (see below). Oxygen itself gets a negative oxygen demand since it can be used to burn the other
gases. The fuel conversion is an equivalent parameter to the methane conversion in other units.
𝐶𝐻4 + 𝟐 𝑂2 𝐶𝑂2 + 2 𝐻2𝑂
𝐶𝑂 + 𝟎. 𝟓 𝑂2 𝐶𝑂2
𝐻2 + 𝟎. 𝟓 𝑂2 𝐻2𝑂
𝐶2𝐻6 + 𝟑. 𝟓 𝑂2 2 𝐶𝑂2 + 3 𝐻2𝑂
𝐶3𝐻8 + 𝟓 𝑂2 3 𝐶𝑂2 + 4 𝐻2𝑂
Parameter 2: Global air/fuel ratio
Another important value is the global air-to-fuel ratio (Lambda). The available oxygen in the air reac-
tor is set in relation to the needed oxygen for combustion of the corresponding amount of natural
gas. The total available oxygen (air reactor feed) is lowered by the oxygen that is needed for combus-
tion of added propane to the air reactor.
𝜆 =(�̇�𝑂2
)𝑎𝑖𝑟 𝑟𝑒𝑎𝑐𝑡𝑜𝑟 𝑓𝑒𝑒𝑑 − (�̇�𝑂2)𝑎𝑖𝑟 𝑟𝑒𝑎𝑐𝑡𝑜𝑟 𝑐𝑜𝑚𝑏𝑢𝑠𝑡𝑖𝑜𝑛
(�̇�𝑂2)𝑛𝑎𝑡𝑢𝑟𝑎𝑙 𝑔𝑎𝑠 𝑑𝑒𝑚𝑎𝑛𝑑
Parameter 3: Oxygen carrier circulation
The amount of circulating oxygen carrier has a major influence on the process performance. It can be
derived from the ratio of provided oxygen in the fuel reactor and the difference of the corresponding
degrees of oxidation:

8
𝑂𝐶𝑐𝑖𝑟𝑐 =𝑂𝑥𝑦𝑔𝑒𝑛 𝑑𝑒𝑚𝑎𝑛𝑑 𝑓𝑢𝑒𝑙 𝑟𝑒𝑎𝑐𝑡𝑜𝑟(𝑓𝑒𝑒𝑑 − 𝑒𝑥ℎ𝑎𝑢𝑠𝑡)
𝛥 𝑚𝑎𝑠𝑠/𝑜𝑥𝑖𝑑𝑖𝑧𝑒𝑑 𝑚𝑎𝑠𝑠(𝐴𝑅 − 𝐹𝑅)
An Aspen plus simulation model was set up prior to the test campaigns. In this software, all compo-
nents like gases and solids need to be defined to calculate heat and mass balances of all unit opera-
tions. There was no detailed information available about the oxygen carrier properties, and the oxy-
gen carrier was not included in the Aspen plus data bases. This can be explained by the fact that this
oxygen carrier material was developed and produced specifically for the SUCCESS project. Thus, it
was decided to calculate the aforementioned evaluation parameters using MATLAB. The above men-
tioned parameters were defined and calculated.
3 Results and discussion An overview of the CLC tests in 1 MWth scale is given in Table 4. Results were gathered in two test
campaigns. The 1 MWth pilot was operated in 3-shift-mode (24 h/day) during the entire periods.
In the first test campaign, fresh C28 and C28-RW were used as oxygen carriers. The pilot was heated
according to the standard start-up procedure (see Figure 4). Air reactor and fuel reactor were heated
by combustion of propane as well as by the combustion of natural gas (only fuel reactor) to a tem-
perature of ~ 1000 °C. The fresh oxygen carrier C28 was already used up at the end of the start-up
process (“C28 used up”, cf. Figure 4). Some oxygen carrier material that was not separated from gas-
es in the cyclones was found in the heat exchangers. This material with low amount of fines and fresh
C28-RW were used as make-up material for the next ~3 days (between markings “C28 used up” and
“C28-RW used up”). One first CLC test was performed (see Figure 4: “First test” with recirculated flue
gas). This was the first time that this pilot plant was operated in CLC mode with gaseous fuel and/or
recirculation of flue gas. The post oxidation chamber (including oxygen injection and water quench)
was successfully tested.
Table 4: Overview about test campaigns.
Description Campaign C1 Campaign C2
Material Fresh C28 and C28-RW Re-used C28 (from C2a), fresh Ilmenite
Calendar week 50/2016 3/2017
Total duration [h] 130 100
CLC operation [h] 60 20
Relevant CLC period for evaluation [h]
50 16
Particularities 50 h stable operation, 6 h reference point, autothermal operation
Transition from C28 to Ilmenite
Sampling of solids FR, AR, Filters (FR, AR) FR, AR, Filters (FR, AR)
Further use of solid samples
Calculation of solids circulation, attrition, evolution of material
-
Some adjustments were made, e.g. CO2 was used for dedusting the fuel reactor filter. Afterwards,
50 h stable CLC operation were performed (cf. Figure 4). Recirculated flue gas was used for the fluidi-
zation of the fuel reactor during the whole period. Major operational changes (e.g. parameter varia-
tions) were not possible. This can be explained by different reasons, e.g. by the coupling concept that

9
requires equal solid fluxes from air reactor to fuel reactor and vice versa to achieve stable operation.
Furthermore, a high solids circulation rate is essential for operation with the selected oxygen carrier
materials. Thus, the velocity of both reactors was at the upper limit of the design specification (cf.
also Table 1). Samples were taken from fuel and air reactors to investigate the evolution of the mate-
rial and the solids circulation. Two operational periods are highlighted in Figure 4: During a “6 h ref-
erence point” only incremental adjustments were made. “Autothermal operation” without co-firing
of propane was reached for a half an hour. After 4-5 days of continuous operation, no further fresh
oxygen carrier was available (“C28-RW used up”). Thus, it was decided to terminate campaign C1 to
have enough oxygen carrier material available for the following test campaign. The pilot plant was
shut down according to the standard procedure. During inspection of fuel reactor, air reactor, cou-
pling elements and post oxidation chamber subsequent to campaign C1, no agglomeration of oxygen
carrier particles or damages were found.
Figure 4: Overview about campaign C1 (Materials: Fresh C28 and fresh C28-RW).
The main objective of campaign C2 was the investigation of operation with an oxygen carrier mixture
of C28 and ilmenite. The pilot was heated according to the standard start-up procedure. The pilot
was operated at comparable conditions to the “6h reference point” (cf. Figure 4). Material from the
FR filter from campaign C1 was used as makeup because it contained a comparatively high amount
(~ 70 %) of coarse particles with a size larger than 63 µm.
After ~10 h of operation, no further C28 oxygen carrier was available. Ilmenite was used as make-up
material from that moment. The conversion of natural gas was reduced due to that measure (cf. also
section 3.1). Thus, the recirculated flue gas for the fluidization of the fuel reactor was partially substi-
tuted by air, leading to combustion of some natural and partial CLC conditions. It was tried to get CLC
with this oxygen carrier run at higher temperatures in a last test, but the conversion of natural gas
was low in this period (“Trying to get CLC run (high temperature)”). The pilot was shut down. Some
minor deposits of material in the post oxidation chamber were detected during inspection.
0
200
400
600
800
1000
1200
2016-12-13 2016-12-14 2016-12-15 2016-12-16 2016-12-17 2016-12-18 2016-12-19
T air reactor [°C]
T fuel reactor [°C]
„First test“ withrecirculated flue gas
„Autothermal operation“
6 h „reference point“ (steady-state)
50 h „stable CLC operation“
C28 used up C28-RW used up

10
Figure 5: Overview about campaign C2 (Materials: Re-used C28 from campaign C1 and fresh ilmenite).
3.1 Pressure and temperature profiles The pressure profiles along the reactor heights of air reactor and fuel reactor are shown in Figure 6
and the related temperature profiles are shown in Figure 7. The pressure profiles show a typical
shape of a circulating fluidized bed reactor. The estimated height of the dense phase is in the range
of 2 m (air reactor) or 1 m (fuel reactor).
Figure 6: Pressure profiles of air reactor (left) and fuel reactor (right) referred to outlet pressure during 6 h reference point (C1).
The temperature profiles along the heights of the reactors are rather constant except of the lowest
temperature measurement of the fuel reactor (cf. Figure 7). This can be explained by a cooling effect
as a result of the fluidization (thermocouple is located directly next to a nozzle). All other tempera-
0
200
400
600
800
1000
1200
2017-01-19 2017-01-20 2017-01-21 2017-01-22 2017-01-23 2017-01-24
T air reactor [°C]
T fuel reactor [°C]
16 h CLC operation withused C28 and ilmenite
Start of ilmenite feed
Trying to get CLC run(high temperature)
6 h ilmenite feed(lower performance)
0
2000
4000
6000
8000
10000
0 10 20 30
Reacto
r h
eig
ht
[mm
]
Pressure [mbar]
0
2000
4000
6000
8000
10000
0 20 40 60
Reacto
r h
eig
ht
[mm
]
Pressure [mbar]

11
tures are between 970 °C (FR) and 1040 °C (AR) corresponding to a maximum overall temperature
difference of ~ 70 K. This comparatively low value can be explained by the high solids circulation rate.
Figure 7: Temperature profiles of air reactor (left) and fuel reactor (right) during 6 h reference point (C1).
3.2 Fuel conversion and air/fuel ratio The gas conversion inside the fuel reactor during campaign C1 (50 h stable CLC operation) is shown in
the Figures below. Some minor dependencies of the gas conversion on the air/fuel ratio and the fuel
power of the fuel reactor can be found. A higher air/fuel ratio lead to slightly higher gas conversion
and a higher fuel feed to the fuel reactor lead to slightly lower gas conversion in the fuel reactor (cf.
Figure 8). This operational behaviour is in accordance with other units (cf. section 3.5). However,
both values are only slightly changed during 1 MWth tests and therefore the mentioned effects are
rather small.
Figure 8: Air-to-fuel ratio (lambda), fuel conversion and fuel power during C1, 50 h stable CLC operation.
The gas conversion of the fuel reactor as well as the air/fuel ratio and the thermal power of the fuel
reactor during operation with used C28 to and ilmenite are shown in Figure 9. The conversion of gas-
0
2000
4000
6000
8000
10000
900 950 1000 1050 1100
Re
ac
tor
he
igh
t [m
m]
Temperature [ C]
0
2000
4000
6000
8000
10000
800 850 900 950 1000R
ea
cto
r h
eig
ht
[mm
]
Temperature [ C]
5 10 15 20 25 30 35 40 45 500
0.2
0.4
0.6
0.8
1
1.2
1.4
1.6Evalutation parameter
time [h]
La
mb
da
[-]
, X
FR
[-]
, P
ow
er
[MW
]
Lambda
Fuel conversion
Power
„Autothermal operation“
6 h „reference point“ (steady-state)

12
es in the fuel reactor decreases shortly after the start of ilmenite feed. This effect can clearly be
traced back to the change of make-up material because all other values (e.g. air/fuel ratio, fuel pow-
er, temperatures) are rather constant during the whole time period. It can be explained by two main
factors, namely the lower reactivity of ilmenite with methane compared to C28 and the negligible
CLOU effect of this natural ore.
Figure 9: Air-to-fuel ratio (lambda), fuel conversion and fuel power during C2, 16 h CLC operation with used C28 and ilmen-ite.
3.3 Performance of the POC (Post Oxidation Chamber) The 1 MWth pilot plant is the only test facility in the SUCCESS project with a post oxidation chamber.
The simplified flow sheet is shown in Figure 10. Pure oxygen was introduced to the post oxidation
chamber (POC), and the hot flue gas was cooled directly downstream by a water injection. Almost full
conversion of gases like CH4, CO and H2 was achieved in the POC for the whole test duration. The
performance of the POC was important for the process because flue gas was used for fluidization of
the fuel reactor and high amounts of unburned gases should be avoided.
Figure 10: Top: Simplified process scheme of post oxidation and related gas measurements; bottom: Principle of oxygen injection and water quench.
2 4 6 8 10 12 14 160
0.2
0.4
0.6
0.8
1
1.2
1.4
1.6Evalutation parameter
time [h]
La
mb
da
[-]
, X
FR
[-]
, P
ow
er
[MW
]
Lambda
Fuel conversion
PowerStart of ilmenite feed
ID-FanHeat
Exchanger
PA-Fan
Sta
ck
CO, CO2,
NO, SO2,
O2, H2, CH4,
H2O
POC
O2
Air
Filter
Pre-
heating
FIC
Flue gas
recirculation
FIC
H2O
O2, CO2,
CH4
CO, CO2,
NO, SO2, O2
H2O
O2 injection
H2O injection
Fuel ReactorHeat
Exchanger

13
Operational parameter during the “6 h reference point” (C1) are summarized in Table 5. The dry con-
centrations of methane at the fuel reactor cyclone and downstream the post oxidation chamber are
6.64 and 0.06 Vol.-% (dry). This means that 99 % of the unconverted methane from the fuel reactor
was converted in the post oxidation chamber. During first tests (cf. Figure 4, “First tests with recircu-
lated flue gas”) it was found that the post oxidation chamber should be operated at temperatures
above 900 - 950 °C to achieve sufficient methane conversion.
Table 5: Operation parameter of the post oxidation chamber during 6 h reference point (C1).
Description Unit FR cyclone Downstream POC
CH4 concentration Vol.-% (dry) 6.64 0.06 CO concentration Vol.-% (dry) 0.37 0.66 O2 concentration Vol.-% (dry) 0.00 1.23 CO2 concentration Vol.-% (dry) 54.2 55.1 H2O concentration Vol.-% (wet) 54.1 58.5
Temperature °C 849 986 O2 injection Nm3/h 35.1 - H2O injection l h-1 47.3 - CH4 conversion % 99.0 -
3.4 Solid analyses and oxygen carrier circulation 27 samples were taken from fuel and air reactors and flue gas filters to investigate the evolution of
the material and the solids circulation. The Sauter diameter of 12 samples that were taken during C1
(50 h stable CLC operation) are shown in Figure 11. The corresponding Sauter diameter of fresh C28
is represented by the dashed line. Particle size distributions were determined by air jet sieving. It is
apparent that the Sauter diameter is constant during the whole time period. This result is consistent
with the fact that almost no agglomerations of material were found during the inspection of the pilot
plant after CLC tests. Furthermore, there is no significant difference in the Sauter diameters from
samples of fuel and air reactors at the same time. This means that there was almost no segregation
of the material.
Solid samples were oxidized at 1100 °C (4 h) in a muffle furnace. The mass ratio of the sample mass
and the mass of the oxidized sample as well as the corresponding differences between mass ratios of
air reactor are shown in Figure 12. The ratio of mass to oxidized mass decreases over time for sam-
ples of air reactor and fuel reactor. This means that the degree of oxidation decreases over time. The
difference of the mass ratio increases simultaneously. However the described effect is rather low in
comparison of an assumed error of ~ 0.1-0.2 percentage points of the difference of the mass ratio.
Further analysis like scanning electron microscopy would be required in order to determine the evo-
lution of the oxygen carrier samples over time.

14
Figure 11: Evolution of Sauter diameters of solid samples from air reactor (left) and fuel reactor (right). Samples were taken during C1, 50 h stable CLC operation. The initial diameter (C28) is shown as dashed line.
Figure 12: Evolution of the ratio between mass of samples and corresponding mass of oxidized samples of air reactor (left, top) and fuel reactor(left, bottom); right: Difference between mass ratios (all samples are taken during C1, 50h stable CLC operation).
It is possible to estimate the solids circulation by the ratio of provided oxygen in the fuel reactor and
the difference of the corresponding degrees of oxidation determined by regression line (cf. Fig-
ure 12). The solids circulation during campaign C1 (50 h stable CLC operation) is shown in Figure 13.
The mean value of the solids circulation is 14 tons h-1 corresponding to 17 tons h-1 MW-1. The peaks
at ~ 25 h or 42 h (“autothermal operation”) can be either explained by higher solids circulation or by
error propagation of the difference of the mass ratio of AR and FR samples. Furthermore, no solid
samples are available at these peaks of the solids circulation leading to additional difficulties of eval-
uation. Nevertheless, the solids circulation was significantly higher than in former tests [2]. This was
0
50
100
150
200
0 15 30 45 60
Sa
ute
r d
iam
ete
r [µ
m]
Time [h]
Sauter diameter AR
0
50
100
150
200
0 15 30 45 60
Sa
ute
r d
iam
ete
r [µ
m]
Time [h]
Sauter diameter FR
98.0%
98.2%
98.4%
98.6%
98.8%
99.0%
0 15 30 45 60
AR
ma
ss
/oxid
ize
dm
as
s
Time [h]
96.6%
96.8%
97.0%
97.2%
97.4%
97.6%
0 15 30 45 60
FR
ma
ss
/oxid
ize
dm
as
s
Time [h]
y = 5E-05x + 0.0105
0.6%
0.8%
1.0%
1.2%
1.4%
1.6%
0 15 30 45 60
Δm
as
s/o
xid
ize
dm
as
s
Time [h]

15
mainly enabled by a larger cross sectional area of the L-valve. The refractory lining of this part was
renewed before CLC tests and its cross sectional area was increased by 70 %.
Figure 13: Solids circulation during C1, 50h stable CLC operation.
Attrition was determined in a jet cup attrition test rig [3] and from the fine fraction of samples from
the fabric filters. The attrition behaviour of samples from fuel reactor and air reactor are compared
to those of fresh C28 and C28-RW (cf. Figure 14). It is apparent that the attrition indices of the solid
samples (0.4 or 0.5 wt.-% h-1) are significantly lower than those of the fresh material (2.8 or 7.2 wt.-
% h-1). The increase of mechanical strength during hot CLC conditions was also reported from other
units.
Figure 14: Jet cup attrition: Left: Attrition behaviour of fresh C28 and C28-RW. Right: Attrition behaviour of two samples (AR and FR) taken during C1, 50 h stable CLC operation; 33 h indicate the number of hours of this 50 h period.
The attrition rates were additionally determined during CLC operation based on the fraction of fines
collected by the fabric filters. The sizes 40 µm and 63 µm were selected as cut-off diameters, since
suitable sieves are available. The attrition rates are defined by the attrited mass in a certain time
5 10 15 20 25 30 35 40 45 500
0.2
0.4
0.6
0.8
1
1.2
1.4
1.6
1.8
2x 10
4 Solids circulation
time [h]
ma
ss flo
w [kg
h-1
]
Solids circulation
„Autothermal operation“
6 h „reference point“ (steady-state)
0
1
2
3
4
5
6
7
0 20 40 60
Att
riti
on
[w
t.-%
]
Time [min]
C28
C28-RW
2.8 wt.-%/h
7.2 wt.-%/h
0
1
2
3
4
5
6
7
0 20 40 60
Att
riti
on
[w
t.-%
]
Time [min]
33h (AR)
33h (FR)
0.4 (AR) and 0.5 wt.-%/h (FR)
16
divided by the total solids inventory (1000 kg for 1 MWth tests considered). Corresponding values are
summarized in Table 6. The lifetime of the oxygen carrier is the reciprocal value of the attrition rate.
The determined attrition of the material was in the range of 0.2 - 0.4 wt.-% h-1. This corresponds to a
particle lifetime of ~ 500 h. It can be reasonably assumed that the refractory lining of the 1 MWth unit
had a great impact of the attrition rate because attrition of this material was lower in other units
made from stainless steel. Furthermore, high gas velocities (e.g. in the transitions between risers and
cyclones) could also induce comparatively high attrition rates. Further investigations could be done in
the manufacturing and treatment of the material to improve the mechanical strength.
Table 6: Attrition data from hot* and cold
** tests (C1, 50 h stable CLC operation).
*Determined by fines collected by the bag
filters of fuel reactor and air reactor. **
Average attrition index determined by jet cup attrition tests of solid samples (cf. Figure 11).
Description Unit Filter FR Filter AR Total
Attrition 63 (particles < 63 µm) wt.-% h-1 0.20 0.18 0.38 Attrition 40 (particles < 40 µm) wt.-% h-1 0.10 0.09 0.19 Carrier lifetime (Attrition 63) h 263* Carrier lifetime (Attrition 40) h 524*
Attrition index (Cold attrition) wt.-% h-1 0.45** Carrier lifetime (Cold attrition) h 222**
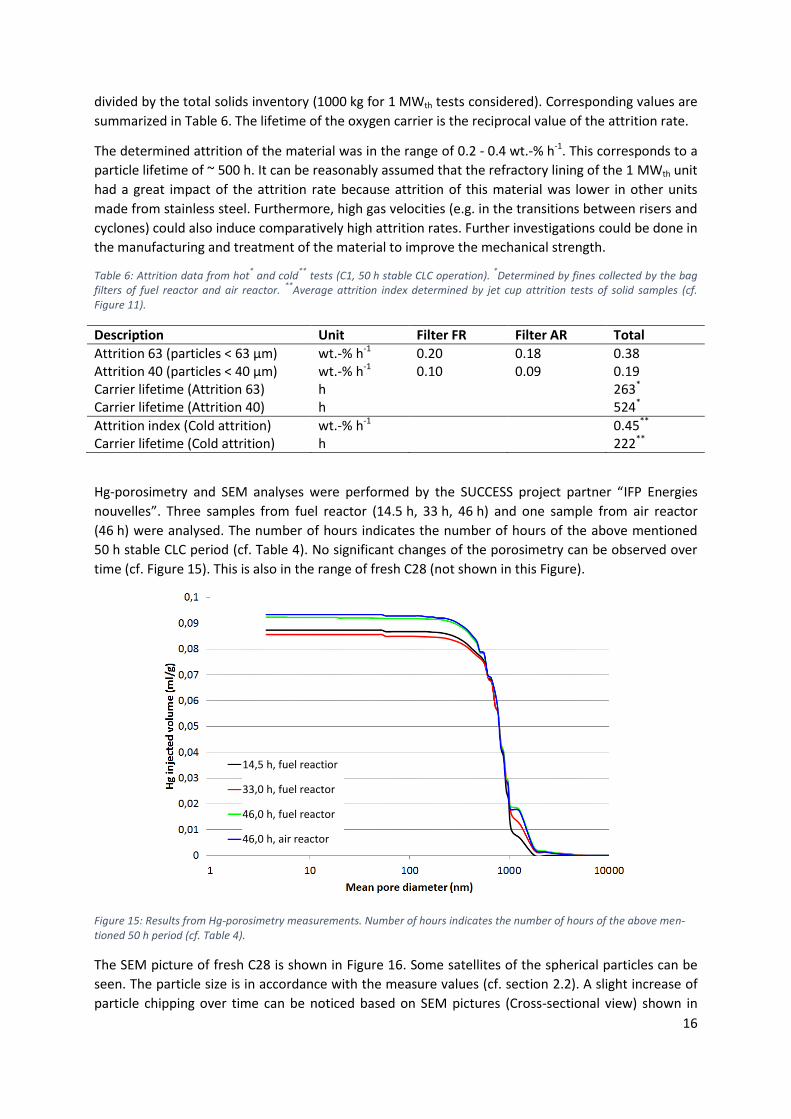
Hg-porosimetry and SEM analyses were performed by the SUCCESS project partner “IFP Energies
nouvelles”. Three samples from fuel reactor (14.5 h, 33 h, 46 h) and one sample from air reactor
(46 h) were analysed. The number of hours indicates the number of hours of the above mentioned
50 h stable CLC period (cf. Table 4). No significant changes of the porosimetry can be observed over
time (cf. Figure 15). This is also in the range of fresh C28 (not shown in this Figure).
Figure 15: Results from Hg-porosimetry measurements. Number of hours indicates the number of hours of the above men-tioned 50 h period (cf. Table 4).
The SEM picture of fresh C28 is shown in Figure 16. Some satellites of the spherical particles can be
seen. The particle size is in accordance with the measure values (cf. section 2.2). A slight increase of
particle chipping over time can be noticed based on SEM pictures (Cross-sectional view) shown in
14,5 h, fuel reactior
33,0 h, fuel reactor
46,0 h, fuel reactor
46,0 h, air reactor

17
Figure 17. This can be explained by the high mechanical stress due to the refractory lined reactors
and coupling elements as described above.
Figure 16: SEM picture of fresh C28.
Figure 17: Cross-sectional view of four solid samples: a) Sample after 14.5 h from fuel reactor; b) after 33 h, FR; c) after 46 h, FR; d) after 46 h, AR. Number of hours indicates the number of hours of the above mentioned 50 h period (cf. Table 4).
3.5 Comparison of results with results from 120 kWth unit (Vienna) The most important data that were collected during the “6 h reference point” are summarized in
Table 7. Data from the 120 kWth unit from Vienna are shown for comparison reason. In general, data
from the 1 MWth pilot are in accordance with data from the other unit. The higher conversion of nat-
a) b)
c) d)

18
ural gas of the 120 kWth unit (almost full conversion instead of 75 %) can be explained by different
reasons. Higher specific inventory of the fuel reactor and higher air/fuel ratio are the main reasons.
Table 7: Comparison of some operational conditions and results from operation of the 1 MWth pilot (Darmstadt) and the 120 kWth pilot at Vienna.
Description Unit 1 MWth (TUD) 120 kWth (TUV) 6h reference Full conversion
FR temperature °C 970 955 FR fuel power kW 780 60 FR inventory kg MW-1 65 278 FR gas velocity m s-1 6.1 2.3
AR temperature °C 1030 955 AR inventory kg MW-1 63 107 AR gas velocity m s-1 4.9 8.6
X (CH4/FR) - 0.75 0.98 λ (global) - 1.1 1.8 Solids circulation kg h-1 MW-1 17300 64200 CH4 concentration Vol.-% (wet) 13 100
Further positive factors are the high methane concentration in the fuel reactor (100 instead of
13 Vol.-% (wet)) or the higher solids circulation. Higher solids circulation lead to a higher oxygen car-
rier-to-fuel ration and the CLOU effect can be used to a greater extent. The comparison of data is
also shown graphically in Figure 18. Red circles represent the operating conditions of the 1 MWth
unit.
Figure 18: Comparison of gas conversion and air/fuel ratio of the 1 MWth unit with data from the 120 kWth unit at Vienna. Red circles represent the operating conditions of the 1 MWth unit.
4 Conclusions Stable CLC conditions were reached for more than 50 h during campaign C1 with the oxygen carriers
C28 and C28-RW. These results are the first results of gaseous fuel CLC at 1 MWth scale. The gas con-
version in the fuel reactor was in the range of 80 %. The pilot was operated autothermally for a short
period of time. The flue gas recirculation worked excellently, and the specific inventory was slightly
increased by the usage of the secondary fluidization. The obtained results are in accordance with
tests in other CLC units using the same oxygen carrier material. Pure oxygen was introduced to the
70
80
90
100
1 1.25 1.5 1.75 2
met
han
e co
nve
rsio
n, C
O2
yie
ld [
%]
lambda [-]
XCH4
YCO2
XCH4YCO2
50
60
70
80
90
100
0 100 200 300
met
han
e co
nve
rsio
n, C
O2
yie
ld [
%]
specific FR inventory [kg/MW]
XCH4
YCO2
XCH4YCO2

19
post oxidation chamber (POC), and the hot flue gas was directly cooled downstream by a water injec-
tion. Almost full conversion of gases like CH4, CO and H2 was achieved in the POC for the whole test
duration. Samples were taken from fuel and air reactors to investigate the evolution of the material
and the solids circulation. Attrition was determined from the fine fraction of samples from the fabric
filters and in a cold attrition test rig. The determined attrition of the material was in the range of
0.2 wt.-%/h. The performance with a mixture of ilmenite and C28/C28-RW was significantly lower
compared to operation with only C28 (see campaign C2). This was explained by the lower reactivity
of ilmenite with methane and the negligible CLOU effect.
5 References [1] Jochen Ströhle, Matthias Orth, Bernd Epple, Design and operation of a 1 MWth chemical looping
plant, Applied Energy, 113, 2014, 1490-1495, 03062619, 10.1016/j.apenergy.2013.09.008.
[2] Peter Ohlemüller, Jan-Peter Busch, Michael Reitz, Jochen Ströhle, Bernd Epple, Chemical-Looping Combustion of Hard Coal: Autothermal Operation of a 1 MWth Pilot Plant, Journal of Energy Resources Technology, 138 (4), 2016, 042203, 0195-0738, 10.1115/1.4032357.
[3] Magnus Rydén, Patrick Moldenhauer, Simon Lindqvist, Tobias Mattisson, Anders Lyngfelt, Measuring attrition resistance of oxygen carrier particles for chemical looping combustion with a customized jet cup, Powder Technology, 256, 2014, 75-86, 00325910, 10.1016/j.powtec.2014.01.085.
[4] Karl Mayer, Stefan Penthor, Tobias Pröll, Hermann Hofbauer, The different demands of oxygen carriers on the reactor system of a CLC plant – Results of oxygen carrier testing in a 120kWth pilot plant, Applied Energy, 157, 2015, 323-329, 03062619, 10.1016/j.apenergy.2015.07.053.
[5] E Netz Südhessen, http://www.e-netz-suedhessen.de/privatkunden/weitere-dienstleistungen/brennwerte-und-gasanalyse.html, 01.02.2017.