Embed Size (px)
Citation preview

Grant Agreement nº.SCS8-GA-2009-234061
Coordination and support action (Coordinating)
FP7-TRANSPORT SST.2008.3.1.4. Urban delivery systems
Project acronym: TURBLOG_ww
Project title: Transferability of urban logistics concepts and practices from a
world wide perspective
Deliverable 1
A worldwide overview on urban logistic
interventions and data collection techniques
Due date of deliverable: 31st March 2010
Submission date:
Start date of project: October 2009 Duration: 24 months
TIS.pt – Consultores em Transportes, Inovação e Sistemas, S.A.
Version 1.0
Project co-funded by the European Commission within the Seventh Framework Programme
Dissemination Level
PU Public X
PP Restricted to other programme participants (including the Commission Services)
RE Restricted to a group specified by the consortium (including the Commission Services)
CO Confidential, only for members of the consortium (including the Commission Services)

Deliverable 1 - A worldwide overview on urban logistic interventions and data collection techniques ii
Foreword
This TURBLOG Deliverable 1 was produced by ITS Leeds (Paul Timms) and received
contributions from the following members of the consortium:
Marcelo Cintra do Amaral (BHTRANS)
Camila Bandeira (TIS.BR)
Cesar Barrientos (PTL-UNI)
Geraldo Abranches Mota Batista (BHTRANS)
Daniela Carvalho (TIS.PT)
Nathaly Dasburg-Tromp (NEA)
Ana Elias (TIS.PT)
Ana Gama (TIS.PT)
Cesar Lama (PTL-UNI)
Rosário Macário (TIS.PT)
Mônica Magda Mendes (BHTRANS)
Fernando de Oliveira Pessoa (BHTRANS)
Victor Plaza (PTL-UNI)
Maria Rodrigues (TIS.PT)
Fatma Saçli (NEA)
This document is set to be Public (PU), and should be referenced as:
TURBLOG (2010) Transferability of urban logistics concepts and practices from a world
wide perspective. Deliverable 1: “A worldwide overview on urban logistic interventions
and data collection techniques”. , The project is coordinated by Prof. Rosário Macário, TIS.pt - Consultores em Transportes,
Inovação e Sistemas, S.A. (TIS.PT) and the consortium is composed by:
TIS.PT, Consultores em Transportes, Inovação e Sistemas, SA (Portugal)
NEA transport research and training (The Netherlands)
UNIVLeeds – Institute of Transport Studies (United Kingdom)
Inovamais, SA (Portugal)
BHTRANS - Empresa de Transportes e Trânsito de Belo Horizonte S.A (Brazil)
PTL-UNI - Plataforma Logistica de Transporte, Logistica y Movilidad Urbana (Peru)
TIS.BR (Brazil)

Deliverable 1 - A worldwide overview on urban logistic interventions and data collection techniques iii
QUALITY CONTROL INFORMATION:
Version Date Description
0.1 23/02/2010 Draft version of TURBLOG D1 for partners comments
0.2 29/03/2010 Final version TURBLOG D1 for partners comments
0.3 31/3/2010 Final version of TURBLOG D1 after partners comments
0.4 20/4/2010 Final version TURBLOG D1 for quality control
Final 1.0 17/5/2010 Submission of TURBLOG D1 final version to the EC

Deliverable 1 - A worldwide overview on urban logistic interventions and data collection techniques iv
TABLE OF CONTENTS
INDEX OF BOXES ............................................................................................. VIII
LIST OF ACRONYMS ........................................................................................ VIII
EXECUTIVE SUMMARY .......................................................................................... 1
1 INTRODUCTION............................................................................................ 5
1.1 Overview ................................................................................................ 5
1.2 Problems relevant to urban freight ................................................................ 6
1.3 Structure of Deliverable .............................................................................. 9
2 PRIORITY GIVEN TO URBAN LOGISTICS IN POLICY DOCUMENTS ................................ 10
2.1 EU Transport policy ................................................................................. 10
2.2 Asia ..................................................................................................... 12 2.2.1 Japan ............................................................................................. 12 2.2.2 China ............................................................................................. 13 2.2.3 South Korea ..................................................................................... 14 2.2.4 India .............................................................................................. 14
2.3 London (UK), Paris (France) and Auckland (NZ)................................................ 15
3 INTERVENTIONS FOR LOADING/UNLOADING ....................................................... 17
3.1 overview .............................................................................................. 17
3.2 On-street loading bays.............................................................................. 17 3.2.1 Overview......................................................................................... 17 3.2.2 Example from Japan: Akihabara ............................................................ 17 3.2.3 Loading Requirements: Examples from USA and Canada ............................... 18 3.2.4 Example from Brazil: Belo Horizonte ....................................................... 18
3.3 Time regulations on vehicle loading/unloading ................................................ 20 3.3.1 Overview......................................................................................... 20 3.3.2 Examples: Groningen (Netherlands) and Perth (Australia) ............................. 20
3.4 Night deliveries ...................................................................................... 23 3.4.1 Overview......................................................................................... 23 3.4.2 Examples from Dublin (Ireland) and Barcelona (Spain) ................................. 23 ............................................................................................................... 24
4 INTEGRATION WITHIN COMPREHENSIVE URBAN TRANSPORT AND LAND USE PLANNING ... 26
4.1 overview .............................................................................................. 26

Deliverable 1 - A worldwide overview on urban logistic interventions and data collection techniques v
4.2 Signing ................................................................................................. 26 4.2.1 Overview......................................................................................... 26 4.2.2 Examples from USA and Canada ............................................................. 27
4.3 Lorry routes........................................................................................... 28 4.3.1 Overview......................................................................................... 28 4.3.2 Example from Ploiesti (Romania) ........................................................... 28
4.4 Urban freight information and maps ............................................................. 30 4.4.1 Overview......................................................................................... 30 4.4.2 Examples from New York City (USA) and Vancouver (Canada)......................... 30
4.5 Urban Consolidation Centres ...................................................................... 33 4.5.1 Definitions of UCCs (Urban Consolidation Centres) ...................................... 33 4.5.2 Examples: Bristol (UK) and Santiago (Chile) .............................................. 34 4.5.3 Example of Urban Consolidation Centre in Burkina Faso, Africa ...................... 36
4.6 ―Last mile‖ solutions................................................................................ 37 4.6.1 Overview......................................................................................... 37 4.6.2 Example from Brazil: Supermarket delivery and online shopping ..................... 39
4.7 Vehicle weight and size regulations .............................................................. 40 4.7.1 Overview......................................................................................... 40 4.7.2 Examples from Manila (Philippines) and Seoul (South Korea) .......................... 41
4.8 Environmental zones ................................................................................ 41 4.8.1 Key aspects of EZs Practice in current EZs in Europe ................................... 41 4.8.2 Planned and existing Environmental Zones in European cities and regions ......... 43
4.9 Lorry lanes ............................................................................................ 45 4.9.1 Overview......................................................................................... 45 4.9.2 Example: Norwich (UK) ....................................................................... 45
4.10 Road charging systems ........................................................................... 47 4.10.1 Examples from Europe ..................................................................... 47 4.10.2 Electronic road pricing, Singapore ....................................................... 48
4.11 Alternative Modes ................................................................................ 49 4.11.1 Alternative modes in Europe .............................................................. 49 4.11.2 Non-Motorised modes in Brazil............................................................ 52
5 BUSINESS ARRANGEMENTS ............................................................................ 54
5.1 Definitions of Regulation, Governance and Government ..................................... 54
5.2 Public-private partnerships – lessons learnt within START ................................... 55
5.3 Public-private partnerships and Private Associations: examples from France, Sweden and Japan ..................................................................................................... 56
6 TECHNOLOGY ........................................................................................... 60
6.1 OVERVIEW ............................................................................................. 60
6.2 SMARTFREIGHT concept ............................................................................ 60

Deliverable 1 - A worldwide overview on urban logistic interventions and data collection techniques vi
6.3 Vehicle and Fuel Technology ...................................................................... 61 6.3.1 Overview: Environmentally-friendly vehicles ............................................. 61 6.3.2 Examples from Germany and Utrecht (the Netherlands) ............................... 62 6.3.3 Examples from Asia ............................................................................ 65
7 POLICY PACKAGES ...................................................................................... 67
7.1 Overview .............................................................................................. 67
7.2 Urban freight policies in London .................................................................. 67
7.3 Paris, France ......................................................................................... 69
7.4 São Paulo, Brazil ..................................................................................... 75
7.5 Masdar City, Abu Dhabi, United Arab Emirates ................................................ 78
8 DATA COLLECTION ..................................................................................... 80
8.1 overview .............................................................................................. 80
8.2 Urban freight data collection efforts ............................................................ 80
8.3 Methodologies and approaches in freight data collection .................................... 82
8.4 Urban freight transport indicators ............................................................... 83
8.5 Country summary of urban freight data collection in Europe ............................... 84
8.6 Data collection in Asia .............................................................................. 90 8.6.1 Overview of urban freight data collection in Asia ....................................... 90 8.6.2 Specific urban freight data collected ...................................................... 91
8.7 Overview of urban freight data collection for North America ............................... 95 8.7.1 United States ................................................................................... 95 8.7.2 Canada ........................................................................................... 97
8.8 Overview of urban freight data collection for Australia and New Zealand ............... 98 8.8.1 Australia ......................................................................................... 98 8.8.2 New Zealand ................................................................................... 100
8.9 Data collection in Africa .......................................................................... 101 8.9.1 General ......................................................................................... 101 8.9.2 South Africa .................................................................................... 102
9 CONCLUDING REMARKS ............................................................................... 104
REFERENCES.................................................................................................. 107

Deliverable 1 - A worldwide overview on urban logistic interventions and data collection techniques vii
INDEX OF TABLES
Table 1: Hours of operation in the city of Perth ....................................................... 22
Table 2: Planned and Existing Environmental Zones in European Cities and Regions ........... 43
Table 3: Days on which different number plates are permitted (São Paulo) ..................... 77
INDEX OF FIGURES
Figure 1: Main actors, relations and effects in urban freight transport ............................. 7
Figure 2: Freight performance measures for Auckland City, New Zealand ........................ 16
Figure 3: Loading requirements in a selection of USA and Canadian cities ....................... 18
Figure 4: Loading and unloading restrictions in Belo Horizonte, Brazil. Source: BHTRANS ..... 19
Figure 5: On street parking zones for the city of Perth (Australia) ................................. 22
Figure 6: Night Delivery in Barcelona (Spain) ........................................................... 24
Figure 7: New York City Truck Route Map (USA) ....................................................... 31
Figure 8: Truck route map for Vancouver (Canada) ................................................... 32
Figure 9: Abertis Logistics Park, Santiago ............................................................... 35
Figure 10: Bobo Dioulasso market (Burkina Faso) ...................................................... 36
Figure 11: Common supply chains in last mile operations ............................................ 39
Figure 12: Pão de Açúcar delivery van ................................................................... 40
Figure 13: Electronic road pricing in Singapore ........................................................ 48
Figure 14: Bicycle and human-powered urban freight transport .................................... 52
Figure 15: Horse-drawn urban freight transport (Brazil) ............................................. 53
Figure 16: Bread delivery by bicycle in Cairo (Africa) ................................................ 53
Figure 17: The SMARTFREIGHT concept.................................................................. 61
Figure 18: Electric commercial vehicle in London ..................................................... 69
Figure 19: Old signs in Paris................................................................................ 70
Figure 20: Delivery in Paris ................................................................................ 71
Figure 21: Zoning system in Paris ......................................................................... 72
Figure 22: Logistic plan for Paris .......................................................................... 73

Deliverable 1 - A worldwide overview on urban logistic interventions and data collection techniques viii
Figure 23: Chronopost vehicle in Paris ................................................................... 74
Figure 24: RER train in Paris ............................................................................... 74
Figure 25: São Paulo ZMRC (Zone of Maximum Restriction of Circulation) ........................ 76
Figure 26: Classification of truck loads (São Paulo) ................................................... 77
Figure 27: Freight motorcyclist and motorcycle lane (São Paulo) .................................. 78
Figure 28: 2getthere vehicle ............................................................................... 79
Figure 29: Framework for Tokyo Metropolitan Region Freight Survey.............................. 92
Figure 30: Use of probe vehicles for collecting data .................................................. 94
Figure 31: Example of data statistics from the AFDB ................................................ 102
INDEX OF BOXES Box 1: ―Spontaneously concentrated urban area‖ of Gamarra, Lima (Peru) ........................ 8
Box 2: City Centre Distribution, Groningen (The Netherlands) ...................................... 21
Box 3: Night delivery in Barcelona (Spain) .............................................................. 24
Box 4: Night delivery in Dublin (Ireland) ................................................................ 25
Box 5: Examples of signs from USA and Canada ........................................................ 27
Box 6: Freight partnership, planning, routeing, signing in Ploiesti (Romania) .................... 29
Box 7: Consolidation centre in Bristol (UK) ............................................................. 34
Box 8: Reducing of emissions by environmental zone in Prague (Czech Republic)............... 44
Box 9: Priority access for clean goods vehicles/Norwich (UK) ....................................... 46
Box 10: Hajtás Pajtás Bicycle Courier Service (Hungary) ............................................. 49
Box 11: La Petite Reine, Paris (France) .................................................................. 50
Box 12: Cargotram, Zurich (Switzerland) ................................................................ 51
Box 13: Development of partnership with logistic operators in La Rochelle (France) ........... 57
Box 14: Sustainable SME logistic for the food industry in Malmö (Sweden) ....................... 58
Box 15: Joint Distribution System, Fukuoka City (Japan) ............................................. 59
Box 16: CNG-Vehicles for parcel delivery used by DHL in Germany ................................ 63
Box 17: Cargohopper, Utrecht (The Netherlands) ..................................................... 64

Deliverable 1 - A worldwide overview on urban logistic interventions and data collection techniques ix
List of Acronyms
AFDB: African Development Bank
CAI: Clean Air Initiative
CNG: Compressed Natural Gas
DfT: Department for Transport (UK)
EC: European Commission
EFV: Environmentally-Friendly Vehicle
ELTIS: European Local Transport information Service
ETC: Electronic Toll Collection
EU: European Union
EZ: Environmental Zone
FAF: Freight Analysis Framework
FDMS: Freight Distribution Management System
FHWA: Federal Highway Administration (USA)
FQP: Freight Quality Partnership
FRT: Freight Rapid Transit
GDP: Gross Domestic Product
GLA: Greater London Authority
GPS: Global Positioning System
HGV: Heavy Goods Vehicle
ICT: Information and Communication Technologies
ITS: Intelligent Transport System
LGV: Light Goods Vehicle
LSDP: London Sustainable Distribution Partnership
LPG: Liquid Petroleum gas
NOx: Nitrogen Oxides
OECD: Organisation for Economic Cooperation and Development
PDP: Plan de Déplacement de Paris
PPP: Public-Private Partnerships
PRT: Personal Rapid Transit
RER: Réseau Express Régional (Paris)

Deliverable 1 - A worldwide overview on urban logistic interventions and data collection techniques x
List of Acronyms
RPS: Road Pricing Scheme
RSP: Respirable Suspended Particulate(s)
RZ: Restricted Zone (Singapore)
SME: Small or Medium sized Enterprise
TfL: Transport for London
TMFS: Tokyo Metropolitan Region Freight Survey
UCC: Urban Consolidation Centre
UGM: Urban Goods Movement
UTMS: Urban Traffic Management System
VER: Vias Estruturais Restritas (São Paulo)
VICS: Vehicle Information and Communication System
WUWM: World Union of Wholesale Markets
ZERCA: Special Zone of Restricted Circulation (São Paulo)
ZMRC: Zona de Máxima Restrição de Circulaçâo (Saõ Paulo)

1 Deliverable 1 - A worldwide overview on urban logistic interventions and data collection techniques
EXECUTIVE SUMMARY
This deliverable provides a worldwide snapshot of urban freight interventions and data collection
techniques, providing a platform for further development of the TURBLOG_ww project. The material in
the deliverable is taken from five Regional Reports produced by the project:
- Regional Report EU
- Regional Report Brazil
- Regional Report Hispano-American countries
- Regional Report Asia
- Regional Report Rest of the World (covering Australia, New Zealand, Canada, United States and
Africa)
The general approach has been to take generic summaries of particular types of intervention, data
collection techniques, transport policies, etc and to supplement these summaries with examples that have
been fully elaborated in the Regional Reports (trying to achieve balance between different parts of the
world in the process). Since all of these reports were substantial in their own right, with each covering a
broad range of information, it is clear that a large amount of pruning has been required in order to
provide a manageable report of approximately 100 pages that is attractive to the reader. In general, there
has been a preference for including descriptions of interventions that are accompanied by (informative)
photos, diagrams and maps, thus averting the risk of providing long sequences of pages of dense-looking
text.
Two general points are made at the outset in Chapter 1. Firstly, it is important stress that this deliverable
is consciously making no attempt to make any assessments or judgements about different practices in
urban freight planning: such assessment will be made at a later stage in the project. It follows that, in
general, information about specific interventions are presented ―as given‖ (frequently by those who have
been involved in the interventions), without any attempt to assess the relative merits of the intervention.
Secondly, given the above-mentioned aim of producing a manageable report of approximately 100 pages
that is attractive to the reader, it is clearly not feasible to try to provide a comprehensive textual
summary of all urban freight practice around the world. Rather, the purpose of the deliverable is to give
an indication of how examples of such practice are implemented in differing locations, providing a full set
of references by which the interested reader can find out more information.
Chapter 1 also presents an overview of generic problems associated with urban freight, and it is
mentioned that the five Regional Reports describe a number of problems that are specific to the areas

2 Deliverable 1 - A worldwide overview on urban logistic interventions and data collection techniques
they cover. Chapter 1 provides an example from the Gamarra district of Lima (Peru) of such a specific
case.
Chapter 2 examines the priority given to urban logistics in policy documents. A general observation has
been made by many authors is that urban freight does not attract as much attention as urban passenger
transport in policy documents. However, it is also frequently mentioned that improvements in this
situation (though only in certain locations) have occurred over the past ten years. The five Regional
Reports give a large amount of detail on these issues. Chapter 2 provides some examples and/or analysis
of urban freight policy, taken from the Regional Reports, on three levels of policy-making (transnational,
national and city levels): recent policies devised by the European Union (EU); summaries of urban freight
policies in four Asian Countries (Japan, China, South Korea and India), focussing mainly on national
policies; and information on city-level policy-making, describing changes in such policy-making for London
and Paris, and listing freight performance measures provided in the Auckland City Freight Strategy (New
Zealand).
Chapter 3 considers interventions for loading/unloading. The classification of different measures follows
closely on the classification given in the BESTUFS Good Practice Guide on Urban Freight Transport
(BESTUFS, 2007), considering the following types if intervention: On-street loading bays; Time regulations
on vehicle loading/unloading; and Night deliveries. Short generic overviews on these interventions are
made, followed by a number of specific examples: Akhibara (Japan) and Belo Horizonte (Brazil) (on-
street loading bays); loading requirements in a selection of USA and Canadian cities; Groningen
(Netherlands) and Perth (Australia) (time regulations on vehicle loading/unloading); and Barcelona
(Spain) and Dublin (Ireland) (night deliveries).
Chapter 4 describes emerging (actualised) concepts as to how freight distribution and collection can be
integrated within comprehensive urban transport and land use planning. Once again, the classification of
interventions is based upon the BESTUFS Good Practice Guide on Urban Freight Transport (though adding
an extra category for alternative modes): signing; lorry routes; urban freight information and maps; urban
consolidation centres; ―last mile‖ solutions; vehicle weight and size regulations; environmental zones;
lorry lanes; road charging systems; and alternative modes. Following a short generic overview of each type
of intervention, examples are given for: USA and Canada (signing); Ploiesti (Romania) (lorry routes); New
York City (USA) and Vancouver (Canada) (freight maps); Bristol (UK), Santiago (Chile) and Bobo-
Dioulasso (Burkina Faso) (urban consolidation centres); Pão de Açúcar supermarket chain (Brazil) (last
mile solutions); Manila (Philippines) and Seoul (South Korea) (vehicle weight restrictions); Prague (Czech
Republic) (environmental zone); Norwich (UK) (lorry lanes); Norwegian cities, London (UK) and
Singapore (road pricing); Budapest (Hungary) (bicycle freight), Paris (France) (electric bicycles), Zurich
(Switzerland) (use of trams) and small towns in Brazil (non-motorised freight transport).
3 Deliverable 1 - A worldwide overview on urban logistic interventions and data collection techniques
Chapter 5 looks at urban logistics from a business point of view, concerning public-private partnerships
and private associations of businesses. When considering these issues, it is important, in order to avoid
confusion, to be clear about definitions for regulation, governance and government, and so definitions of
these terms are given. Chapter 5 gives some summary conclusions about public-private partnerships from
the START project and examples of public-private partnerships and private associations from La Rochelle
(France), Malmö (Sweden) and Fukuoka City (Japan).
Chapter 6 provides information about new technological developments of relevance to urban freight. A
summary of the SMARTFREIGHT concept is given, involving use of Information and Communication
Technologies (ICT) in urban freight. An overview is then provided of relevant fuel and vehicle technology.
Examples are given of use of CNG-vehicles for parcel delivery by DHL in Germany, and about the
Cargohopper in Utrecht (Netherlands). Short overviews are provided of developments in Asia involving old
vehicle bans and other interventions to promote greener vehicles, from Calcutta (India), Guangzhou
(China) and Hong Kong (China).
Chapter 7 starts by providing an overview of the need for bundling policy measures for urban freight
together into policy packages, so that the ―weak‖ aspects of individual measures can be compensated by
the ―strong‖ aspects of a complementary measure. A general comment can be made that, whilst the
descriptions provided in the previous chapters of the deliverable portray a wide variety of different types
of intervention, there is little evidence to suggest that many of these interventions have been planned as
elements in coherent ―urban transport policy packages‖. Exceptions to this observation exist, and
examples of such policy packages are given in Chapter 7, concerning London (UK), Paris (France), São
Paulo (Brazil) and Masdar City (Abu Dhabi). However, it would appear that much more effort still needs to
be made by responsible transport planning agencies for including urban freight in comprehensive transport
plans.
Chapter 8 provides information about data collection for urban freight planning. It starts with an overview
of issues involved with data collection for urban freight, taken from the Green Logistics project. It then
supplies information on: methodologies and approaches in freight data collection; urban freight transport
indicators; and summaries of urban freight data collection in Europe, Asia, North America, Australia, New
Zealand and Africa. This information is taken from the Regional Reports for the EU, Asia and the Rest of
the World, describing ―standard‖ approaches to collecting data for urban freight as well as ―state-of-the-
art‖ approaches‖. The Regional Reports from Brazil and Hispano-America also feature material about data
collection, though in general the techniques are less well developed than those described in Chapter 8. As
mentioned above, urban freight has traditionally not been given the same level of importance as urban
passenger transport in urban policy-making. Associated with this lack of importance, there has generally
been a lack of systematic data collection required for the planning of urban freight and the assessment of
particular interventions. One of the aims of the TURBLOG project is to help rectify this situation, and

4 Deliverable 1 - A worldwide overview on urban logistic interventions and data collection techniques
hence a major part of this deliverable has been dedicated to the issue of data collection: Chapter 8 is
consequently one of the deliverable‘s two longest chapters.
Finally, Chapter 9 provides a number of concluding remarks. One such conclusion is that, due to the lack
of importance attached to urban freight, there is a resulting lack of publicly-available information about
interventions, so that the task of compiling Regional Reports describing such interventions has typically
been challenging (particularly in the case of the Hispano-American Regional Report). The one obvious
exception to this comment concerns the situation in Europe. In the EU Regional Report it was remarked
that one of the most significant features distinguishing the development or urban freight transport
policy/interventions in the EU from other parts of the world has been the growing availability of
information on EU policy/interventions: in fact the main challenge in compiling the EU Regional Report
was to make manageable selection of examples of interventions from the vast amount of information
available. Whilst national authorities have in certain cases contributed to this growth in information, the
main driving factor has been the EU, and in particular various research projects funded under the various
Framework Programmes. Such projects have created a situation whereby a vast amount of information is
publicly available, typically through the internet, on relevant developments in Europe. It is hoped that
similar initiatives will be carried out in future in other parts of the world. As a final comment about
Europe, though, it is important to point out that it is misleading to see Europe as a homogenous block:
there is clearly a wide divergence in factors (economic, historical, political, cultural) between different
parts of Europe and these differences will inevitably have a significant impact on urban freight transport
policy. In terms of information availability, there is a clear distinction between North-West Europe
(particularly the Netherlands, France, UK and Germany) and other parts of Europe. An attempt has been
made in this deliverable to provide ―intra-European‖ balance as well as the balance between world
regions mentioned above.
A further conclusion given in Chapter 9 concerns the transfer of appropriate technology. Whilst one
emphasis of the deliverable has been put upon ―high-tech‖ solutions, it is important not to forget ―low-
tech‖ solutions. This issue is particularly apparent in Chapter 4, which includes examples of non-motorised
and low-energy modes for urban freight, which have increased recently in popularity due to environmental
and (lack of) energy concerns. Whilst such modes are being investigated and implemented in wealthy
countries, much can be learnt from the experience of their use in poorer countries (or poorer parts of
countries, as in Brazil).

5 Deliverable 1 - A worldwide overview on urban logistic interventions and data collection techniques
1 INTRODUCTION
1.1 OVERVIEW
This deliverable provides a worldwide snapshot of urban freight interventions and data collection
techniques, providing a platform for further development of the TURBLOG_ww project. The material in
the deliverable is taken from five Regional Reports produced by the project:
- Regional Report EU
- Regional Report Brazil
- Regional Report Hispano-American countries
- Regional Report Asia
- Regional Report Rest of the World (covering Australia, New Zealand, Canada, United States and
Africa)
Two points need to be made at the outset. Firstly, it is important stress that this deliverable is
consciously making no attempt to make any assessments or judgements about different practices in urban
freight planning: such assessment will be made at a later stage in the project. It follows that, in general,
information about specific interventions are presented ―as given‖ (frequently by those who have been
involved in the interventions), without any attempt to assess the relative merits of the intervention.
Secondly, the aim of the deliverable is to provide a manageable report of approximately 100 pages that is
attractive to the reader, so that much of the space is taken up by photos, maps and diagrams. Given this
brief, it is clearly not feasible to try to provide a comprehensive textual summary of all urban freight
practice around the world. Rather, the purpose of the deliverable is to give an indication of examples of
such practice, along with some definitions which help classify different types of intervention. In general,
these definitions are taken from BESTUFS project, which has provided a high standard for the gathering
and dissemination of information related to urban freight (though mainly restricted to Europe).
One obvious important factor in this endeavour has been the availability of information. In the EU
Regional Report it was remarked that one of the most significant features distinguishing the development
or urban freight transport policy/interventions in the EU from other parts of the world has been the
growing availability of information on EU policy/interventions. Whilst national authorities have in certain
cases contributed to this growth, the main driving factor has been the EU, and in particular various
research projects funded under the various Framework Programmes. Such projects have created a
situation whereby a vast amount of information is publicly available, typically through the internet, on
relevant developments in Europe. It is hoped that similar initiatives will be carried out in future in other
parts of the world.

6 Deliverable 1 - A worldwide overview on urban logistic interventions and data collection techniques
1.2 PROBLEMS RELEVANT TO URBAN FREIGHT
According to the BESTUFS Good Practice Guide on Urban Freight Transport (BESTUFS, 2007a) ―existing
freight transport systems in urban areas create a variety of negative economic, environmental and social
impacts. These include:
Economic impacts: congestion, inefficiency, and resource waste;
Environmental impacts: pollutant emissions including the primary greenhouse gas carbon dioxide,
the use of non-renewable fossil-fuel, land and aggregates, and waste products such as tyres, oil
and other materials;
Social impacts: the physical consequences of pollutant emissions on public health (death, illness,
hazards, etc), the injuries and death resulting from traffic accidents, noise, visual intrusion, and
other quality of life issues (including the loss of Greenfield sites and open spaces in urban areas as
a result of transport infrastructure developments)‖.
Furthermore, ―goods vehicle operators and drivers face a range of difficulties when carrying out freight
operations in urban areas. These include:
Traffic flow/congestion issues caused by traffic levels, traffic incidents, inadequate road
infrastructure, and poor driver behaviour;
Transport policy-related problems including, for example, vehicle access restrictions based on
time and/or size/weight of vehicle and bus lanes;
Parking and loading/unloading problems including loading/unloading regulations, fines, lack of
unloading space, and handling problems;
Customer/receiver-related problems including queuing to make deliveries and collections,
difficulty in finding the receiver, collection and delivery times requested by customers and
receivers‖.
An illustration of the complexity associated with urban freight is provided in Figure 1.

7 Deliverable 1 - A worldwide overview on urban logistic interventions and data collection techniques
Figure 1: Main actors, relations and effects in urban freight transport
Source: Transman Consulting (BESTUFS, 2008b)
These problems could be said to be generic, existing everywhere in the world. Examples of problems for
specific regions and countries are given in the five Regional Reports listed above. One such example from
Gamarra in Lima (Peru) is described in Box1.
8 Deliverable 1 - A worldwide overview on urban logistic interventions and data collection techniques
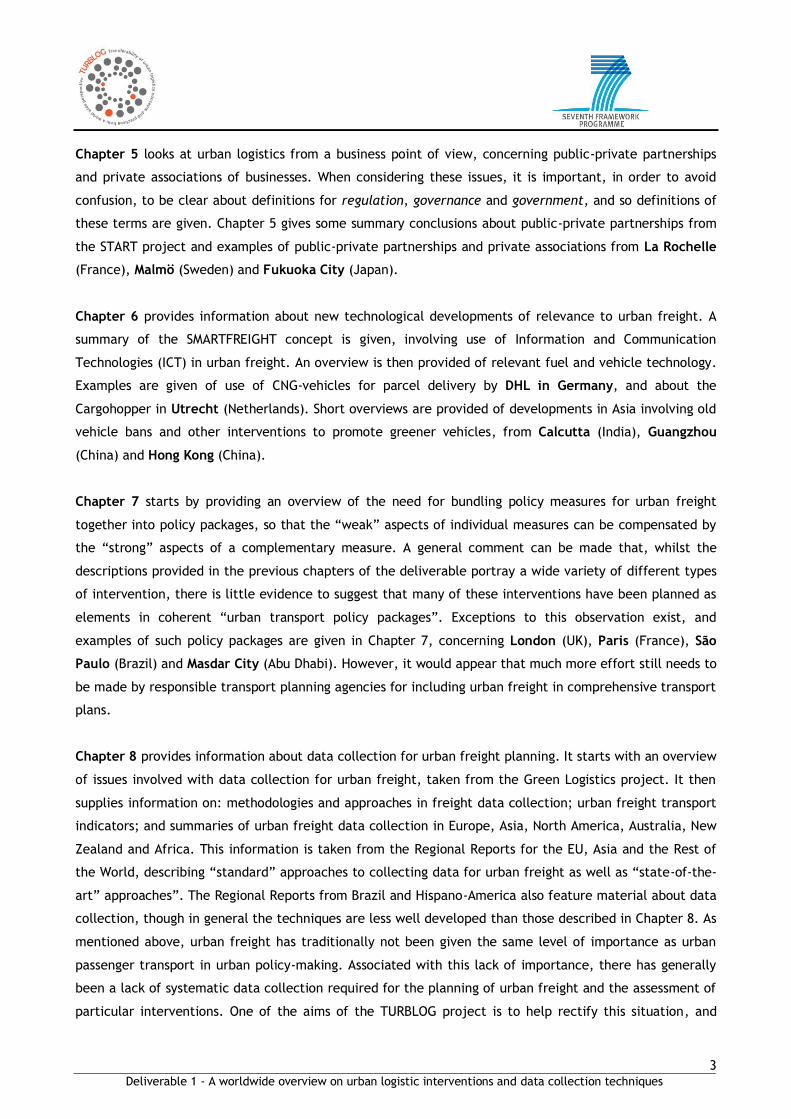
Box 1: “Spontaneously concentrated urban area” of Gamarra, Lima (Peru)
.
Characterization: The Gamarra area is the most important "Spontaneously Concentrated Urban Area" in Lima. Occupying 60 ha, there are 10 thousand micro-enterprises working in the area, involving 17 thousand stores in 144 shopping centers. (see map). Gamarra is the largest urban shopping area in Peru. Yearly sales are approximately $800 million. The market price per square meter in the galleries is $14,000. The owners of the micro-enterprises are mostly from Andean migrant origin. A Lima University survey has concluded that 74% of buyers of Lima have preference to buy clothes on Gamarra. 60 thousand people work in Gamarra, and in periods of marketing campaigns there are more than 250,000 visitors, leading to an estimated 3m2 per person circulating in the local streets. Streets are regulated as pedestrian ways. (see photo)
Currently, access to Centro Gamarra is a serious problem for shoppers and visitors. As can be seen in the photo, the massive concentration of people leads to heavy congestion in a radius of 500 meters around the area. In relation to urban logistics, some steps have already been taken to (partially) solve these problems. These steps have been taken with the cooperation and coordination between: a) the Municipality, who have implemented regulations restricting times for loading and unloading to between 20 hr at night to 10 hours in the morning; b) owners of establishments that organize their supplies; c) 400 hand carters who transport the goods from trucks to establishments. Carters are socially organized. The waste issue is partially solved. However, what is not solved is the transfer of merchandise by buyers from stores, exacerbating the high congestion in the area. Gamarra Centre needs further intervention on urban logistics.
9 Deliverable 1 - A worldwide overview on urban logistic interventions and data collection techniques
1.3 STRUCTURE OF DELIVERABLE
The deliverable has the following chapters:
Chapter 2 examines the priority given to urban logistics in policy documents.
Chapter 3 considers interventions for loading/unloading. The classification of different measures follows
closely on the classification given in the BESTUFS Good Practice Guide on Urban Freight Transport
(BESTUFS, 2007), considering the following types if intervention: On-street loading bays; Time regulations
on vehicle loading/unloading; and Night deliveries.
Chapter 4 describes emerging (actualised) concepts as to how freight distribution and collection can be
integrated within comprehensive urban transport and land use planning. Once again, the classification of
interventions is based upon the BESTUFS Good Practice Guide on Urban Freight Transport (though adding
an extra category for alternative modes): signing; lorry routes; urban freight information and maps; urban
consolidation centres; ―last mile‖ solutions; vehicle weight and size regulations; environmental zones;
lorry lanes; road charging systems; and alternative modes.
Chapter 5 considers issues associated with business arrangements, focusing upon public-private
partnerships and private associations.
Chapter 6 considers technological developments of relevance to urban freight, covering: Information and
Communication Technologies (ICT) for urban goods transport; and vehicle and fuel technology.
Chapter 7 provides a number of examples where the measures described above have been consciously
aggregated to form policy packages.
Chapter 8 provides information about data collection for urban freight planning. It starts with an overview
of issues involved with data collection for urban freight, taken from the Green Logistics project (Allen and
Brown, 2008). It then supplies information on: methodologies and approaches in freight data collection;
urban freight transport indicators; and summaries of urban freight data collection in Europe, Asia, North
America, Australia, New Zealand and Africa.
Finally, Chapter 9 provides a number of concluding remarks.

10 Deliverable 1 - A worldwide overview on urban logistic interventions and data collection techniques
2 PRIORITY GIVEN TO URBAN LOGISTICS IN POLICY DOCUMENTS
A general observation made by many authors is that urban freight does not attract as much attention as
urban passenger transport in policy documents. However, it is also frequently mentioned that
improvements in this situation (though only in certain locations) have occurred over the past ten years.
The five Regional reports give a large amount of detail on these issues. The current chapter provides some
examples and/or analysis of urban freight policy, taken from the Regional Reports, on three levels of
policy-making (transnational, national and city levels): Section 2.1 highlights recent policies devised by
the European Union (EU); Section 2.2 gives summaries of urban freight policies in four Asian Countries
(Japan, China, South Korea and India), focussing mainly on national policies; and Section 2.3 provides
information on city-level policy-making, describing changes in such policy-making for London and Paris,
and listing freight performance measures provided in the Auckland City Freight Strategy (New Zealand).
2.1 EU TRANSPORT POLICY
For subsidiarity reasons, the EU is not responsible for urban transport. However, it is generally recognised
that urban transport has continental-wide impacts. This situation is reflected well in the European
Commission (EC‘s) recent communication ―A sustainable future for transport: Towards an integrated,
technology-led and user friendly system‖ (CEC, 2009a), which refers to urban transport as follows:
“The urban challenge. For subsidiarity reasons, the EU role in regulating urban transport is
limited. On the other hand, most transport starts and ends in cities and interconnection and
standardisation issues do not stop at city limits. Cooperation at EU level can help urban authorities
in making their transport systems more sustainable. There are a range of activities and fields
where the EU can set examples and continue to promote and support demonstration projects and
the exchange of best practices, notably through the 7th Framework Programme and Cohesion
Policy programmes. Moreover, the EU can provide a framework in which it will be easier for local
authorities to take measures.‖
The main EC document concerning urban transport is the Green Paper ―Towards a new culture for urban
mobility” (CEC, 2007a). With respect to freight transport, the Green Paper stated the following:
―Freight logistics has an urban dimension. In view of stakeholders, any urban mobility policy must
cover both passenger and freight transport. Distribution in urban areas requires efficient
interfaces between long-haul transport and short distance distribution to the final destination.
Smaller, efficient and clean vehicles could be used for local distribution. Negative impacts of long
distance freight transport passing through urban areas should be reduced through planning and
technical measures.
The "service economy" leads to new demands for road space. There is evidence that 40% of all
vehicles other than passenger cars are service-related (vehicles for removals, maintenance

11 Deliverable 1 - A worldwide overview on urban logistic interventions and data collection techniques
services, small deliveries, etc.). Courier services often use motor-cycles or mopeds. Consolidated
distribution in urban areas and zones with access regulations is possible but requires efficient
planning of the routes to avoid empty runs or unnecessary driving and parking. The development
of these solutions requires the involvement of all stakeholders.
Urban freight distribution could be better integrated within local policy-making and institutional
settings. Public passenger transport is usually supervised by the competent administrative body
while freight transport distribution is normally a task for the private sector. Local authorities need
to consider all urban logistics related to passenger and freight transport together as a single
logistics system.‖
A subsequent EC communication ―The EU's freight transport agenda: Boosting the efficiency, integration
and sustainability of freight transport in Europe‖ (CEC, 2007b), echoed the Green Paper excerpt given
above, as does the EC communication ―Freight Transport Logistics Action Plan‖ (CEC, 2007c) made a
number of commitments for urban freight:
The Commission will encourage the exchange of experiences of representatives of urban areas to help
establish a set of recommendations, best practices, indicators or standards for urban transport
logistics, including freight deliveries and delivery vehicles. Deadline: Urban Transport Action Plan in
2008.
Make recommendations of commonly agreed benchmarks or performance indicators to measure
efficiency and sustainability of delivery and terminals and, more generally, in urban transport logistics
and planning. Deadline: 2011.
Reinforce the freight part of CIVITAS towards better co-ordination, or integration, between passenger
and freight transport, between interurban (long distance) and urban transport logistics. This can lead
to an integrated ―CIVITAS Freight‖. Deadline: 2010.
Furthermore, the EC´s recent ―Action Plan on Urban Mobility‖ (CEC, 2009b) includes the following ―Action
19‖ concerning urban freight transport:
―The Commission intends to provide help on how to optimise urban logistics efficiency, including
on improving the links between long-distance, inter-urban and urban freight transport, aiming to
ensure efficient ‗last mile‘ delivery. It will focus on how to better incorporate freight transport in
local policies and plans and how to better manage and monitor transport flows. As part of its
preparations, the Commission will organise a conference on urban freight transport in 2010. At the
conference, the implementation of the urban initiatives in the Freight Logistics Action Plan will
also be assessed.‖
In summary, the main difficulty for the EU with respect to urban freight policy concerns the fact that it is
―urban‖, and for subsidiarity reasons the EU needs to be careful as to how it intervenes in any type of city

12 Deliverable 1 - A worldwide overview on urban logistic interventions and data collection techniques
policy-making. However, as the above excerpts show, the EU (or at least the European Commission) is
keen to play a positive role in facilitating city authorities to improve their policies on urban freight
transport.
2.2 ASIA
2.2.1 JAPAN
The Comprehensive Program of Logistics Policies of the Japanese Ministry of International Trade and
Industry dating back to 1997 involves urban freight as well as intercity and international freight transport.
The three priorities identified in this Programme are a) improvement of infrastructure; b) promoting
deregulation; and c) development of sophisticated logistics systems (ITS) (van Duin, 1999).
The Japanese government also decided to periodically review this programme‘s outcomes and published
the first and second follow-up reports in 1998 and 1999 (Visser, et al. 1999). As described by Visser et al.
(1999), specific policy measures related to urban freight in the Japanese national policy were as follows:
investments in improving the infrastructure to reduce the time and cost for goods transportation
based on the principle that beneficiaries should pay for part of the capital;
further support to private enterprises by providing subsidies to logistics related
facilities/equipment;
to promote improvement and to strengthen the functions of the logistics business in urban areas
and joint collection and delivery points where the sorting of goods for final consumers in
metropolitan areas is carried out;
to develop logistics facilities in the vicinity of major highway interchanges, industrial areas, and
seaside industrial zones;
to utilise the rail system for waste transport and as a feeder for international transport;
to promote deregulation in the logistics field;
voluntary co-operation, such as joint collection and delivery points in urban areas; facilities for
disposal of goods towards buildings in metropolitan areas; facilities for joint collection and
delivery in business district; stopping facilities for on-road collection and delivery; and setting up
delivery boxes;
to support the development of an advanced logistics system;
the development and standardisation of the Intelligent Transport System (ITS);
providing road traffic information through bringing the Vehicle Information Communication System
(VICS) into nation-wide use;
introduction of Electronic Toll Collection (ETC) system at tollgates;
a shift from own-transport by private companies towards transport by professional carriers.

13 Deliverable 1 - A worldwide overview on urban logistic interventions and data collection techniques
2.2.2 CHINA
An overview of the City Logistics approach in China, as provided by the study of Qui (2005) places city
logistics in a policy context. In China, volume of freight transportation showed a growth trend of 6 times
over the past 25 years against lack of integrated logistics and transportation infrastructure. At the
institutional level, seven ministries are involved in the transportation and logistics industry.
According to Qui, problems and challenges of city logistics were as follows:
operational performance of freight transport network remains at low level;
environmental and energy consumption problem are under continuous tension;
urban traffic congestion and parking is an issue;
freight transport related information is not transparent and sufficient;
the segment of urban freight delivery market features disaggregation and lack of economies of
scale effect.
Out of these, some special issues were specified:
public sectors play an active role and many master planning or programs have been schemed by
different level of governments;
facilities planning have been paid much attention in the beginning phase;
the practice of city logistics in China is beyond city level, also related to freight corridors,
regional and national level;
industry oriented standpoint is emphasised.
Within a policy framework, it is clear that city logistics fall under the responsibility of municipalities.
However, at the national level, there is some broader policy framework set by logistics activities in
general. That is, ‗‘Guidance to developing advanced logistics industry in China‘‘ which was first initiated
in 2001 and renewed in 2004. Additionally, a national logistics industry steering council was established.
At the regional level important nodes in logistics and transportation network and freight corridors are
defined in provincial jurisdiction. However, lack of efficient negotiation mechanism between different
jurisdictions should be noted. At the city level, more than 30 cities (in addition to more than 20 provinces)
have released their own planning and programs at the strategic and operational levels. A planning horizon
was set for short term (5 years) and long term (15-20 years) in which the following steps would be
foreseen:
a) defining strategies and objectives;
b) identifying problems;
c) generating possible alternatives;
d) evaluating alternatives;
e) selecting satisfying alternatives.
14 Deliverable 1 - A worldwide overview on urban logistic interventions and data collection techniques
Products of city logistics planning, as a result, would be a) logistics and transportation infrastructure; b)
information infrastructure and c) policy measures.
2.2.3 SOUTH KOREA
South Korea has had some attempts to incorporate Urban Freight Transportation Planning into its public
administration system since the mid-1990s. Seven South Korean metropolises, including Seoul, were
expected to develop their own Urban Freight Transportation Planning under the Freight Distribution
Promotion Law. In this respect, a manual/guideline was prepared for the cities to follow (Lee and Lee,
2004). A journal article was written (Lee, 2005) at the Department of Urban Transportation of Seoul
Development Institute assessing the use of this manual. As a result, counter-measures were proposed in
coping with the limitations of this manual. Lee and Lee (2005) define these counter-measures as follows:
1) formation of the freight planning based on similarly categorised cities and establishment of the
planning and survey implemented based on it;
2) implementation of the separate regular freight survey supervised by the Ministry of Construction and
Transportation (MOT) and organisation of the wider area control system;
3) reinvestigation of the freight planning of the central and local government;
4) consideration of the freight vehicle management or the freight-operation related planning. Further
information regarding the applicability of this manual and how the seven metropolises have handled
their Urban Freight Transportation Planning is not available.
2.2.4 INDIA
India has devoted a small section to freight policy in its ‗National urban transport policy‘1 (year not
stated). Crucial starting point in this document is timely and smooth movement of freight in the urban
areas while making optimum use of the transport infrastructure. Among the suggestions, using off-peak
passenger travel times to move freight is a time honoured and tested practice. Many cities have already
earmarked late night hours for the movement of freight and restricted the entry of heavy vehicles into
cities during day time. Further, several cities have by-passes that enable through traffic to go around the
city and not add traffic to city. These practices are sound and would be encouraged in all cities. For this
purpose, cities would be encouraged to build by-passes, through innovative and viable public-private-
partnerships. Similarly, facilities for the parking of freight vehicles outside city limits, such as truck
terminals, would also be encouraged through public-private-partnerships. Proposals for such facilities
would be considered under the National Urban Renewal Mission (year not stated, pp.14-15).
1 Indian National Urban Transport Policy. Available at http://www.urbanindia.nic.in/programme/ut/TransportPolicy.pdf

15 Deliverable 1 - A worldwide overview on urban logistic interventions and data collection techniques
2.3 LONDON (UK), PARIS (FRANCE) AND AUCKLAND (NZ)
London and Paris
Providing examples of improvements in city policy-making in Europe (for some cities at least), Browne et
al (2007) state with respect to the particular cases of London and Paris:
―In the past, in both London and Paris, urban freight considerations have received little attention and
have been poorly integrated into other transport policies. This situation has improved substantially in the
last five years. In London, the establishment of the post of Mayor, together with the formation of the
Greater London Authority (GLA) and the role played by Transport for London (TfL) has resulted in freight
transport issues receiving far greater attention than previously. The Mayor‘s Transport Strategy (MTS)
explicitly addresses freight transport in the capital (Mayor of London 2001). The Mayor and TfL have
created a Freight Transport Unit and established the London Sustainable Distribution Partnership (LSDP),
which has been used as a forum to consult a wide range of stakeholders about freight issues and potential
solutions. Stakeholders include the London boroughs, distribution companies, trade associations and other
public bodies in order to ensure that economic and environmental needs are addressed.
The city of Paris affirmed the importance of freight in its transport and street management policies of
2002. As in London, the Mayor of Paris is attempting to reconcile the two objectives of supporting the
efficient movement of freight transport and limiting its negative impacts. Freight transport has been long
neglected in the management of urban space and the policies of mobility in Paris. However, in 2002,
freight was directly addressed as part of the development of the new transport policy ‗Plan de
Déplacement de Paris‘ (PDP). The PDP is a Statutory Plan. As a result of freight transport, work as part of
the PDP dialogue was started with various stakeholders including the distribution companies and other
commercial organizations involved. This consultation process is a new development – freight companies
had not previously been involved in the discussion and design of transport strategies and policy measures.‖
Auckland
Auckland has developed the Auckland City Freight Strategy (Upton, 2008) to promote and support freight
and commercial transport initiatives that are a benefit for the local, national and international business.
The aim of the strategy is to maximize the safe and efficient movement of goods, whilst minimising
adverse impacts on the environment and community. Figure 2 summarises the performance measures
identified by Auckland City that are required to meet the objectives of their freight strategy.

16 Deliverable 1 - A worldwide overview on urban logistic interventions and data collection techniques
Figure 2: Freight performance measures for Auckland City, New Zealand
Source: Upton (2008)

17 Deliverable 1 - A worldwide overview on urban logistic interventions and data collection techniques
3 INTERVENTIONS FOR LOADING/UNLOADING
3.1 OVERVIEW
Chapter 3 provides information about interventions concerning loading and unloading. In general, these
interventions will be a mixture of regulatory and physical measures. Particular sections of the chapter are
devoted to the following specific types of intervention:
On-street loading bays (3.2)
Time regulations on vehicle loading/unloading (3.3)
Night deliveries (3.4)
3.2 ON-STREET LOADING BAYS
3.2.1 OVERVIEW
From BESTUFS Good Practice Guide on Urban Freight Transport (BESTUFS, 2007)
On-street loading bays can be provided by urban authorities in locations that generate goods vehicle trips
but do not have suitable off-street loading facilities – such as business districts and retail areas. They
provide dedicated space for goods vehicles to load and unload. Loading bays can either be unrestricted
(allow goods vehicle loading and unloading at all times) or can have time regulations applied to them.
They can be designed for one or several goods vehicles and should take account of the size of vehicles
that are likely to use them. They are most useful when there is competition for kerbside space between
goods vehicles and other road users. They can reduce traffic congestion.
3.2.2 EXAMPLE FROM JAPAN: AKIHABARA
Transportation Demand Management Experiment, Akihabara (Japan)
An experiment on transportation demand management in Akihabara in 2004 had 5 components, among
which was ‗‘setting shared space for loading and unloading‘‘. This experiment aimed to reduce the
number of freight vehicles and shorten parking time. Loading and unloading spaces were created, both on-
road and off-road, and parking duration was set at 30 minutes by regulating parking meters. As a result of
these measures, the number of vehicles decreased by 60% in the experimental area and parking time by
vehicle decreased by about 30%. This experiment was run by the Council for City Development, whose
members were local government, freight companies and scholars (Sakano, 2005).

18 Deliverable 1 - A worldwide overview on urban logistic interventions and data collection techniques
3.2.3 LOADING REQUIREMENTS: EXAMPLES FROM USA AND CANADA
Figure 3 provides a summary of the thresholds to trigger loading requirements for multi-unit residential,
general commercial, commercial office, and industrial land uses in selected USA and Canadian cities.
Figure 3: Loading requirements in a selection of USA and Canadian cities
Source: City of Toronto (2009)
3.2.4 EXAMPLE FROM BRAZIL: BELO HORIZONTE
In Belo Horizonte, the main role of government for urban logistics has been the definition of the local
operation of on-street loading and unloading, and the restriction of movement by types of vehicle at
particular times and locations. There are three types of reserved loading/unloading areas:
a) Area of loading and unloading reserved solely for the purpose of loading or unloading, with use
permitted to any citizen;

19 Deliverable 1 - A worldwide overview on urban logistic interventions and data collection techniques
b) Area of loading and unloading for articles of value, reserved exclusively for loading or unloading of
specified vehicles transporting money, securities or documents of financial institutions and banks;
c) Area of loading and unloading for construction reserved solely for the purpose of loading or
unloading of construction materials in buildings.
Figure 4: Loading and unloading restrictions in Belo Horizonte, Brazil. Source: BHTRANS

20 Deliverable 1 - A worldwide overview on urban logistic interventions and data collection techniques
3.3 TIME REGULATIONS ON VEHICLE LOADING/UNLOADING
3.3.1 OVERVIEW
From BESTUFS Good Practice Guide on Urban Freight Transport (BESTUFS, 2007)
Time regulations can be imposed on goods vehicles in a particular road or urban area in two ways:
Time regulations on vehicle access
Time regulations on vehicle loading
Access time regulations
Access time regulations for urban goods transport are the most important and most commonly used
instrument used by urban planners to influence urban goods transport. Access time regulations can be
used to prevent vehicles from entering a road or area at particular times of day. They can be imposed on
all road vehicles or just on goods vehicles (they can also be imposed only on goods vehicles of a certain
size or weight). These regulations are usually imposed on roads or areas that are very sensitive to road
traffic. Examples include:
Pedestrianised shopping areas – often all vehicles are banned during the main shopping hours;
Residential streets – goods vehicles above a certain weight or size are sometimes banned from a
road or urban area at night to prevent disturbance, or during the day near to a school to prevent
accidents;
Entire urban areas – weekend bans are imposed on goods vehicles in some European towns and
cities. Night bans have been imposed on half of French cities with more than 100,000 inhabitants.
Loading time regulations
Loading and unloading time regulations may be applied to the kerbside. These restrict the times at which
vehicles can stop at the kerbside for loading and unloading activities. These restrictions must balance the
needs to use the space for loading and unloading and other activities such as parking.
Good kerbside management can enable better use of restricted space and limit congestion in the
area;
Details of the regulations are usually displayed on well sited traffic signs;
The regulations should be consistent and meet the requirements of local businesses.
3.3.2 EXAMPLES: GRONINGEN (NETHERLANDS) AND PERTH (AUSTRALIA)
Box 2 describes the City Centre Distribution Scheme in Groningen (the Netherlands) which illustrates the
use of time-windows. This is followed by an example from Perth, Australia.

21 Deliverable 1 - A worldwide overview on urban logistic interventions and data collection techniques
City Centre Distribution, Groningen, The Netherlands
To find a solution for the heavy traffic and environmental problems the City of Groningen decided to control the freight deliveries into the city centre with the help of several measures, e.g. special time-windows for distribution.
BACKGROUND & OBJECTIVES Being the largest city in the north of the Netherlands, Groningen is
a regional economic centre with 175,000 inhabitants. A lot of inner-city problems like traffic problems and connected with this environmental problems lead to a decrease of quality of life. One reason is the commuting situation in the greater area of
Groningen. Half of the people who work in Groningen live in the outskirts or in the regional area. About that deliveries into the city centre have caused an additionally traffic volume with the
consequence of a high noise level and air pollution. Results from a former Traffic Circulation Plan from 1977 weren‘t very satisfactorily because the relevant economic key-players were not involved and therefore especially shop owners in the centre were
very unsatisfied with this new policy. After a reestablishment of conversation between the official authorities and transport companies, a new approach called ―City Centre Better‖ was tried
in 1994. In this project all the main players have been involved from the beginning on, so that the project process could be influenced by as many parties as possible who are involved in this problem. It should guarantee an efficient and economical solution
especially for the transport companies and a satisfactorily answer regarding the environmental problems and the quality of life from the view of the cities‘ authorities.
IMPLEMENTATION The Municipality of Groningen initiated the project in close co-operation with representatives of the local business and several market parties. An experiment for a better accessibility of the city centre for transport services was introduced. For two distribution
companies delivering goods from the outskirts into the city centre it was allowed to make their deliveries outside the time window all the day. Therefore, the companies gained a better efficiency
and the local authorities a better living and environmental situation.
In consequence of this experiment an ―Advisory Commission for distribution issues‖ has been set up by the City Council to supervise the test. This was the basis for a successful PPP. In
1998, the project became a new direction towards more structural policy. The new additionally measurements have been the permission for 3.5 tonnes trucks to use the bus lanes and cross sections during the defined time windows. Nowadays the foreseen
transport companies for the delivery of the city centre rises up to three distributors whereas even three more are under discussion. The partners committed themselves to bring input and way of
solution into the pilot project. But there is no financial commitment between the involved partners. The philosophy has been that both partners benefit from this partnership. The following measures have been the result of the contractual PPP:
Enlargement of the pedestrian area
Time-windows for distribution in the car-free areas between
5-11 a.m. and 6-8 p.m.
CONCLUSIONS The research activity in Groningen has shown the positive reaction
from all parties and positive results (i.e. no problems with flow public transport, less transport time in the inner city area). On the one hand, the deliveries became more efficient and more
economical for the transport operators. On the other hand, the environmental situation and the quality of life has become better. In the future a further improvement of the policy of co-operation will be continued. It should be aimed to support this policy and
project by additional technical applications like the usage of more environmental vehicles or maybe a concept of underground logistics.
AUTHOR: Armin Schmauss
CONTACT: Marijke Kramer
Box 2: City Centre Distribution, Groningen (The Netherlands)
Source: http://www.eltis.org/study_sheet.phtml?study_id=1827&lang1=en (posted 11/09/2008)

22 Deliverable 1 - A worldwide overview on urban logistic interventions and data collection techniques
Perth, Australia For the purposes of on-street parking management, the City of Perth area is divided into a number of
zones, as shown in Figure 5, with each zone having a unique hierarchy of priority for the allocation of
scarce kerb-side space. Hours of operation for each zone are shown in Table 1. It is recognised that
isolated pockets could exist within each zone that may have different requirements to those outlined in
this policy and these could be considered by the Council.
Figure 5: On street parking zones for the city of Perth (Australia)
Table 1: Hours of operation in the city of Perth
Location Hours of operation
Central Zone
8a.m-6p.m (Monday-Saturday)
12-6p.m (Sunday)
Northern Zone
8a.m-6p.m (Monday-Saturday)
12-6p.m (Sunday)
Western and Eastern: Commercial zones 8a.m-6p.m (Monday-Saturday)
Western and Eastern: Residential zones 8a.m-6p.m (Monday-Friday)
Parking outside these times will have no restrictions except where the signage shows differently.

23 Deliverable 1 - A worldwide overview on urban logistic interventions and data collection techniques
3.4 NIGHT DELIVERIES
3.4.1 OVERVIEW
From BESTUFS Good Practice Guide on Urban Freight Transport (BESTUFS, 2007).
Inner-city night delivery is the delivery to retailers and shops in the inner city area during the night hours
when the city usually is quiet and inactive. Typical times are between 22:00 and 06:00. In several cities
such as Barcelona or Dublin, successful experiences with trials on night delivery are made replacing a
(higher) number of vehicles operating during day time by a (fewer) number of vehicles operating during
night time.
In most European cities there are night time regulations with some notable exceptions such as Paris. Two
types of night-time regulations may be introduced:
Time regulations on deliveries and collections to and from a particular building (e.g. a retail
outlet, office or factory);
Regulations on goods vehicle movement in a part or the whole of an urban area.
There may be a number of consequences for freight transport companies due to not allowing night time
activities:
More vehicles may be required to make deliveries in a shorter delivery window;
Deliveries may have to be made in periods of greater congestion (reducing vehicle and driver
productivity and increasing fuel consumption);
Journey times may be slower and less reliable;
The supply chain may be less efficient;
Total supply chain costs may be increased.
Points to consider in relation to night time delivery regulations:
Restrictive night-time regulations can result in an increase in total costs within the supply chain.
By being allowed to make night-time deliveries, some companies can improve the efficiency of
their operations and improve sales;
Night time delivery regulations should mainly focus on noise issues;
Well defined noise standards for night time operations could bring significant benefits to local
residents increasing the acceptance of night time transport operations.
3.4.2 EXAMPLES FROM DUBLIN (IRELAND) AND BARCELONA (SPAIN)
Box 3 and
Box 4 give examples of night delivery in Barcelona (Spain) and Dublin (Ireland).

24 Deliverable 1 - A worldwide overview on urban logistic interventions and data collection techniques
Night delivery in Barcelona (Spain)
Barcelona (Spain)
On two streets trials were carried out on night delivery using noise reduced vehicles and loading equipment. The trucks were equipped with a carpeted floor, the lifting system works with a low-noise pneumatic technology and the carriers to transport goods have low-noise rubber wheels.
http://www.miraclesproject.org/
IMPLEMENTATION Within Barcelona, two night delivery trials were carried out
concentrating the delivery processes between 23:00 and 24:00 in the night and between 5:00 and 6:00 in the morning. 40 t trucks were delivering to grocery stores directly during the night instead
of going to a regional distribution centre. The equipment used was noise adapted, both for the truck as well as the loading and unloading utilities (fork lift, lifting ramp etc.). Furthermore, all staff were asked not to speak loudly and to turn off the radio and
other noise making devices. As a result the trial was successful in terms of noise intrusion and from the commercial point of view. Noise measurements done by the police stated that the noise level
for the loading and unloading was in line with regulations. Furthermore, about 7 trucks (vans) could be replaced during day time allowing 2 large trucks to enter the city during the night time. The approach was a collaboration between the Barcelona
Municipality Road and Traffic Department SVP, and Mercadona, a chain of supermarkets, and member of AECOC, the Spanish suppliers and retailers association.
CONCLUSIONS The Municipality‘s Mobility Commission has now extended the collaboration with Mercadona, the operator, to three other
supermarket locations with view to reduce daytime congestion and the associated costs of lost time, higher noise and polluting emissions, and wasted fuel. More information on this initiative on
the NICHES website: www.niches-transport.org
AUTHOR Marcel Huschebeck
CONTACT POLIS
DOCUMENTS FactSheetNightDelivery_ES_.pdf (22 kByte)
Box 3: Night delivery in Barcelona (Spain)
Source: http://www.eltis.org/study_sheet.phtml?study_id=1285&lang1=en (posted 24/01/2007)
Figure 6: Night Delivery in Barcelona (Spain)
Source: BESTUFS (2008b)

25 Deliverable 1 - A worldwide overview on urban logistic interventions and data collection techniques
Night delivery in Dublin (Ireland)
Dublin (Ireland)
A night delivery scheme for inner-city delivery was developed to relieve the Dublin inner city area from goods transport. The programme involves Dublin City Council, the Dublin City Centre Business Association, major distributors and retail chains, and property developers
BACKGROUND & OBJECTIVES A detailed analysis of the delivery processes and vehicle structure in the inner city area of Dublin was made. The survey aimed to
identify a logistics regime and configuration that justifies the use of urban delivery centres and eco-friendly vehicles offering a more sustainable solution for managing freight deliveries in the
historic Dublin city centre.
The survey resulted in the development and demonstration of different scenarios to relieve the Dublin inner city area from goods transport. The scenarios considered were:
Scenario 1: External consolidation at an Urban Distribution Centre;
Scenario 2: Platforms for ―Last Mile‖ deliveries;
Scenario 3: City Centre Access Control;
Scenario 4: Eco-Friendly Vehicles and Ancillaries.
Within scenario 4, a night delivery scheme for inner-city delivery was developed, being one of several measures to be demonstrated in Dublin. Scenario 4 was driven by the need to minimise noise for
night deliveries. Alternative fuel options were examined, concluding that:
Electric vehicle and hybrid electric vehicles could not be
recommended on grounds of practicality and cost;
Experiences with CNG trials by Dublin Bus were disappointing;
Bio diesel does not give lower noise or emissions on the
street;
Low noise diesel propelled vehicles and ancillaries are the most realistic options;
LPG propelled trucks are regarded as realistic clean fuel option for day time.
IMPLEMENTATION Within the follow up demonstration ―silent‖ HGV and low noise
ancillaries were employed considering the results from the Dutch Piek programme on reducing noise levels in the evening and the night, of supply traffic and loading and unloading activities in
residential areas. The aim was to achieve a target level of 65 dB(A). The extra costs related to the modified equipment including roll cages, electric refrigeration, silent tail gate etc.
could not exceed Euro 8000. The demonstration was successful in the way that modified low-noise diesel vehicles and ancillaries were identified as a realistic option for night deliveries.
CONCLUSIONS Following the survey and demonstration a follow-up programme was initiated with the aim to bring low noise, low cost products and systems to the market that can facilitate more sustainable
night distribution and that will comply with the acoustic norms to be set by Dublin City Council (by 2008) in accord with the EC directive on noise.
An important objective is to develop modified low noise ancillaries that can be fabricated by Irish based companies who should see this as an opportunity to respond to a changing
marketplace.
More information on this initiative on the NICHES website: www.niches-transport.org
AUTHOR Marcel Huschebeck
CONTACT POLIS
DOCUMENTS FactSheetNightDelivery_Irl_.pdf (19 kByte)
Box 4: Night delivery in Dublin (Ireland)
Source: http://www.eltis.org/study_sheet.phtml?study_id=1286&lang1=en (posted 24/01/2007)

26 Deliverable 1 - A worldwide overview on urban logistic interventions and data collection techniques
4 INTEGRATION WITHIN COMPREHENSIVE URBAN TRANSPORT AND LAND USE PLANNING
4.1 OVERVIEW This chapter describes emerging (actualised) concepts as to how freight distribution and collection can be
integrated within comprehensive urban transport and land use planning. Sections dealing with specific
implementations are as follows:
Signing (4.2)
Lorry routes (4.3)
Urban freight information and maps (4.4)
Urban consolidation centres (4.5)
―Last mile‖ solutions (4.6)
Vehicle weight and size regulations (4.7)
Environmental zones (4.8)
Lorry lanes (4.9)
Road charging systems (4.10)
Alternative modes (4.11)
4.2 SIGNING
4.2.1 OVERVIEW
From BESTUFS Good Practice Guide on Urban Freight Transport (BESTUFS, 2007)
Clear and accurate road signs should be used by urban authorities to explain routeings and regulations to
goods vehicle drivers in urban areas.
1. Road signs should be used to:
Warn drivers about roads that may be inappropriate for their vehicle (e.g. narrow streets);
Inform drivers about regulations on roads (e.g. vehicle weight, size, and time regulations);
Inform drivers about on-street parking and loading regulations;
Direct drivers on advisory lorry routes;
Direct drivers to lorry parks and key industrial areas;

27 Deliverable 1 - A worldwide overview on urban logistic interventions and data collection techniques
2. Urban authorities should ensure that:
The road signs convey the correct information;
The most up-to-date version of the road sign is being used;
The signs are easy to see and read and are in good condition;
There are sufficient signs with parking and loading information (so that drivers do not need to
walk a long way to read the sign);
3. Urban authorities can work with owners and tenants in industrial zones to introduce new or improved
information boards;
4. Variable message signs can be used to convey real-time information.
4.2.2 EXAMPLES FROM USA AND CANADA
Box 5 provides examples of signing for truck routes, load zones, time limit regulations, and weight
restrictions from USA and Canada.
Box 5: Examples of signs from USA and Canada
USA Examples Recommended Truck Route signage from the study ―Truck Route Management and Community Impact Reduction Study Implementation Update Report‖
Load zone signs: Commercial Vehicle Load Zone, with a time limit of 30minutes, metered (on the left) Truck-Only Load Zone, with a time limit of 30minutes, unmetered (on the right)
Canada Examples Loading zone sign (on the left) Gross vehicle weight restriction (on the right)

28 Deliverable 1 - A worldwide overview on urban logistic interventions and data collection techniques
4.3 LORRY ROUTES
4.3.1 OVERVIEW
From BESTUFS Good Practice Guide on Urban Freight Transport (BESTUFS, 2007) Advisory or statutory lorry routes can be used by the urban authorities to prevent goods vehicle drivers
using unsuitable or sensitive routes. Whilst advisory lorry routes require little or no enforcement,
statutory routes (which prohibit lorries from using non-designated routes) require enforcement, and are
therefore more complex and expensive to implement and manage.
1. Different types of lorry route that can be considered include:
Strategic route – a route using major roads for longer distance journeys between key locations or
within major urban areas;
Zone distributor route – roads that link strategic lorry routes and which provide a route from a
major road to a particular location or area;
Local access route – a route providing suitable access to a particular location;
2. Factors to take into account in selecting suitable lorry routes include:
Routes should contain all major roads in the area and links between them;
The routes should serve sites that are major generators of freight;
Roads used for lorry routes need to:
- Be well maintained;
- Be sufficiently wide to accommodate heavy good vehicles;
- Involve no sharp bends and turns;
- Have sufficient overhead clearance;
- Have bridges capable of taking the weight or heavy goods vehicles;
Steep hills and sensitive land use areas (e.g. residential, high pedestrian activity etc.) should be
avoided;
All planning authorities with responsibilities for roads in the urban area and the freight transport
industry should be involved in the selection of proposed routes;
Clear and sufficient road signs and the dissemination of printed and electronic maps will be
critical to successful introduction of the route;
4.3.2 EXAMPLE FROM PLOIESTI (ROMANIA)
Box 6 gives an example from Ploiesti (Romania) of planning, routeing and signing.

29 Deliverable 1 - A worldwide overview on urban logistic interventions and data collection techniques
Freight partnership, planning, routeing, signing/Ploiesti (Romania)
Ploiesti (Romania)
City Logistics Strategic Plan is the first step in order to restrict the heavy transport and setting up the alternative routes for delivery of the goods.
OBJECTIVES / INNOVATIVE ASPECTS Creating some discharging crossing stations (North and
West terminals)
Reducing the traffic congestion inside the city
-Optimizing the transport network
All transport modes correlation
The co-operative approach of stakeholders
The public-private partnership.
THE MEASURE In Ploiesti the reasons for designing the City Logistics
Strategic Scheme are:
No policy regarding freight transport
Big pollution and congestion because of un- rationalised
freight transport
No investments for logistic facilities
No efforts to put together the actors
In this context, the next following steps will be:
Tender procedure for elaborating the City Logistics
Strategic Plan (conditions of contract and services
delivery contract for the strategic scheme design )
Elaboration of a City Logistics Strategic Plan (Rules and
measures for organizing the traffic)
Feasibility Study elaboration (it results technical
solutions: Defining of freight routes and Defining Freight
signing and financial assessment )
Consulting the transporters and the businessmen in order
to establish the technical solution
Promotion activities
IMPLEMENTATION STATUS Measure implementation requires the following actions:
elaboration of city logistics strategic plan
design of a northbound area dedicated to distribution of
merchandises for population
design of a westbound area, dedicated to services for
b2b
freight routes defined
freight signing defined
establish a freight forum
RESULTS Freight routes defined and signed.
Increased efficiency of goods distribution
Reduce the traffic congestion
Reduce pollution and noise due to the introduction of clean vehicles
AUTHOR Simona Munteanu
CONTACT Simona Munteanu
In cooperation with:
Box 6: Freight partnership, planning, routeing, signing in Ploiesti (Romania)
Source: http://www.eltis.org/study_sheet.phtml?study_id=2284&lang1=en (Posted 24/11/2006)

30 Deliverable 1 - A worldwide overview on urban logistic interventions and data collection techniques
4.4 URBAN FREIGHT INFORMATION AND MAPS
4.4.1 OVERVIEW
From BESTUFS Good Practice Guide on Urban Freight Transport (BESTUFS, 2007)
Urban authorities can provide much valuable information to freight transport companies and drivers.
Methods include the provision of maps and the use of real-time information.
Maps
1. Maps can show:
Lorry routes (both to the urban area and within it);
Information about weight, size, time access, loading regulations, loading bays and lorry lanes;
Key buildings and locations such as industrial estates;
Lorry parks;
Sensitive areas to be avoided;
2. Maps can be produced in paper and electronic form. They can be distributed by:
Local trading companies;
Freight transport companies;
Freight trade associations;
Motoring associations;
Urban authorities;
3. Some urban authorities have produced entire freight atlases of their areas for goods vehicle drivers.
Real-time information
1. Web based information on traffic problems and road works can be made available.
2. This can be linked to GIS mapping systems to make identifying relevant information as easy as possible
(for example the London Traffic Alerts Service provided by Transport for London).
3. Information boards at lorry parks can be used to provide:
Essential local information;
Contact information for local help and assistance;
Printed maps.
4.4.2 EXAMPLES FROM NEW YORK CITY (USA) AND VANCOUVER (CANADA)
Figure 7 and Figure 8 show truck route maps for New York City (USA) and Vancouver (Canada).

31
Deliverable 1 - A worldwide overview on urban logistic interventions and data collection techniques
Figure 7: New York City Truck Route Map (USA)
Source: www.nyc.gov/trucks

32
Deliverable 1 - A worldwide overview on urban logistic interventions and data collection techniques
Figure 8: Truck route map for Vancouver (Canada)
Source: http://vancouver.ca/engsvcs/transport/traffic/pdf/english_map.pdf
33 Deliverable 1 - A worldwide overview on urban logistic interventions and data collection techniques
4.5 URBAN CONSOLIDATION CENTRES
4.5.1 DEFINITIONS OF UCCS (URBAN CONSOLIDATION CENTRES)
From BESTUFS Good Practice Guide on Urban Freight Transport (BESTUFS, 2007)
1. The phrase Urban Consolidation Centres (UCCs) has had many different meanings;
2. Different terminology has been used over time and between countries;
3. Definitions are often vague or ambiguous;
4. Descriptions used include:
Public distribution depot;
Central goods sorting point;
Urban transhipment centre;
Shared-user urban transhipment depot;
Freight platforms;
Co-operative delivery system;
Consolidation centre (sometimes specific, e.g. retail, construction);
Urban distribution centre;
City logistics (or city logistik) schemes;
Logistics centre;
Pick-up/drop-off location;
Off-site logistics support centre;
Freight village;
5. It is often difficult to identify the boundary between UCCs and other similar schemes, such as:
Express parcels hubs;
Collection points for home deliveries;
Intermodal terminals;
Retailer distribution centres;
6. The concept has focussed on:
Communal (shared user) operations;
Break bulk;
Transhipment from larger to smaller vehicles;
7. Today, a UCC is best described as:
―A logistics facility situated in relatively close proximity to the geographic area that it serves (be that a
city centre, an entire town or a specific site such as a shopping centre), to which many logistics
companies deliver goods destined for the area, from which consolidated deliveries are carried out within
that area, in which a range of other value-added logistics and retail services can be provided.‖

34 Deliverable 1 - A worldwide overview on urban logistic interventions and data collection techniques
4.5.2 EXAMPLES: BRISTOL (UK) AND SANTIAGO (CHILE)
Examples of urban consolidation centres are given in Box 7 (Bristol, UK) and Error! Reference source not found. (Santiago, Chile)
Consolidation centre in Bristol Taken from in START Final Report (START, 2008) Close collaboration with developers Bristol City Council in partnership with supply chain experts DHL Exel have been successfully operating a consolidation centre since May 2004 with the aim of helping to reduce pollution and congestion in central Bristol. Streamlining deliveries and cutting the number of delivery vehicles travelling into Broadmead has helped achieve this, whilst at the same time providing an improved delivery service to retailers. The scheme focuses on Bristol‘s core retail area Broadmead, which has over 300 stores and is undergoing a major expansion to increase retail floor space by 40%. The City Council and DHL have worked closely with the developers of the Broadmead expansion to integrate the consolidation scheme in to the new development to be known as Cabot Circus, which opened in September 2008. Key issues included ensuring retailer participation and the commercial structure. The scheme now serves 72 retailer units. Retailers also have waste and packaging material collected which has meant an increase in recycling of cardboard and plastic. The scheme has expanded its geographical coverage to serve a number of stores in neighbouring shopping streets. These are sister stores of those in Broadmead and ensures that the maximum consolidation benefit is being gained. New retailers joining the scheme bring increased inertia for moving towards a more sustainable business model whilst continuing to deliver positive transport and environmental benefits. It is also possible to further promote value added services to retailers such as remote stock warehousing and pre-retailing, together with reverse flows of packaging/waste for recycling/disposal, which helps prevent vehicle under utilisation. Recruiting retailers is an on-going organic process, which is constantly being reviewed by DHL Exel and the City Council with the aim of increasing the number of retailers using the service. However retailer recruitment always needs to be assessed on the basis of transport, environment & cost benefits.
Box 7: Consolidation centre in Bristol (UK)

35 Deliverable 1 - A worldwide overview on urban logistic interventions and data collection techniques
Abertis Logistics Park, Santiago, Chile
Abertis Logistics Park Santiago, in the Metropolitan Region of Santiago, is the first integrated logistics park
in Chile. This project brings together several key factors such as location, design, services and capacity for
growth. In addition, the Abertis Logistics Park Santiago will generate over 5,000 direct jobs and 10,000
indirect jobs. The first 20,000 square meter distribution centre is scheduled to open in the first half of
2010. Investment will take place gradually over the next eight to ten years.
This is the first park opened by the Abertis Logística company outside Europe and follows the same model
of the entire network of parks that the company operates in Spain and Portugal, that meet the highest
standards in terms of construction quality, functionality and sustainability. Abertis Logistics Park Santiago
is located in the Pudahuel, occupying a total area of 63.3 hectares of land, where 335,000 m² of rental
warehouses and 15,000 m² of service areas will be built (for a wide variety of services including offices,
restaurants and rest areas for lorry parking.2
Figure 9: Abertis Logistics Park, Santiago
2 http://www.abertislogistica.com/eng/oferta/pdfs/park_santiago/park_santiago.pdf

36 Deliverable 1 - A worldwide overview on urban logistic interventions and data collection techniques
4.5.3 EXAMPLE OF URBAN CONSOLIDATION CENTRE IN BURKINA FASO, AFRICA
In the city of Bobo-Dioulasso (Burkina Faso), the Central Market (Figure 10) is the main redistribution
centre for food and manufactured goods, with 15 multipurpose markets and 8 specialised markets.
Figure 10: Bobo Dioulasso market (Burkina Faso)
Source: http://pt.wikipedia.org/wiki/Bobo_Dioulasso and http://upload.wikimedia.org/wikipedia/commons/c/c6/BoboDioulasso-Market.JPG
37 Deliverable 1 - A worldwide overview on urban logistic interventions and data collection techniques
The Kikasso Cira wholesale market, which is about two kilometres from the Central Market shown in Figure
10, specializes in fruit and root crops, although its main function is to redistribute goods to the capital of
Burkina Faso, to towns in the neighbouring countries of Mali and, above all, Niger. Fruit and root crops
for local consumption are taken by cart to the sheds of the sub-wholesalers at the Central Market, from
where they are taken by rickshaw or cart to the neighbourhood markets.
The town centre of Bobo-Dioulasso (Burkina Faso) is a kind of huge commercial and administrative
complex. It is the location of virtually all the warehouses of the local produce wholesalers (mainly cereals)
and importers (food and manufactured goods), most of the municipal government offices and public
services, the head offices of large corporations, banks, and the hospital. The warehouses and parking
places for heavy goods vehicles (HGVs) occupy a substantial part of the area and extend over onto public
land. Three unregulated freight centres have been set up where large trucks from the neighbouring
countries of Côte d‟Ivoire, Mali and Togo park, while waiting for orders, after having unloaded their
freight alongside the premises of the licensees and trading companies. There is also a great deal of
movement between this commercial centre and the railway station, which is less than one kilometre
away, and particularly between the bonded warehouses and the private warehouses linked to the
rail/road freight system.
Rickshaws, and, above all, carts, carry all these goods over very short distances: from the trucks to the
warehouses, and from the warehouses to the informal truck warehouses and the stores of the market
traders, and finally from the railway station to the shops and traders in the town centre.
The traders organize the storage of the containers in the railway yard and then use carts to transport the
goods to their shops. It is not uncommon to see an endless procession of carts (including many two-
wheelers) making their way in single line from the station to the shops carrying tonnes of bundles of
second-hand clothes from these containers, causing incredible traffic jams just at peak traffic time around
the market.
4.6 “LAST MILE” SOLUTIONS
4.6.1 OVERVIEW
From BESTUFS Good Practice Guide on Urban Freight Transport (BESTUFS, 2007)
Defining last mile solutions
As described in BESTUFS Good Practice Guide on Urban Freight Transport (2007), ―Last mile solutions‖
(also often referred to ―home deliveries‖) are the logistics element of the fulfilment process within
consumer e-commerce transactions (both business-to-consumer and consumer-to-consumer - B2C and
C2C), other remote purchases from mail order, direct selling and television shopping companies, and
deliveries from retail outlets.
1. Deliveries may be made to:

38 Deliverable 1 - A worldwide overview on urban logistic interventions and data collection techniques
The customer‘s home;
The customer‘s place of employment;
Reception/delivery boxes;
Collection points;
Locker banks;
2. Most deliveries are of:
Parcels and small packages (e.g. books, CDs, clothing and footwear, jewellery, etc);
Large items (e.g. furniture, white goods, other large electrical appliances);
Food;
3. Whilst most deliveries are made by one person, larger items may require two person delivery crews.
Compared to ―traditional‖ distribution channels there are two fundamental characteristics of ―last mile‖
approaches: most approaches cut out the middleman and instead rely on direct business contact with
consumers; but, more importantly, involve developing a supply chain that allows each consumer to order a
personalized product. Shortening the supply chain and providing value added services to the customer can
have a substantial impact on product quality and price.
New selling channels and their associated logistics systems have significant implications on:
Order picking - traditionally carried out by the customers in the store, retail outlet is now done by
the retailer (results in a paradigm change from a collection system to a delivery system);
New business relationships (logistics is becoming the main interface between retailer and
customer);
New delivery structures (the consignment size decreases from bulk shipments to individual
packages);
And have resulted in an increase in the fragmentation of orders and deliveries.

39 Deliverable 1 - A worldwide overview on urban logistic interventions and data collection techniques
Figure 11: Common supply chains in last mile operations
Source: BESTUFS (2007)
4.6.2 EXAMPLE FROM BRAZIL: SUPERMARKET DELIVERY AND ONLINE SHOPPING
Pão de Açúcar Group was the first Brazilian supermarket retailer operating on the internet with the
release of Pão de Açúcar Delivery in 1993, expanding its presence on the internet with extra.com, for sale
of non-food, in 2001. A case study carried out by Godoy and Rodrigues (2006) describes how, after a
purchase is made, there is a process involving: the verification of each delivery address; an allocation of
orders per region and vehicle transport capacity; and the construction of a sequence of deliveries to be
made (leading to vehicle routeing). Each vehicle has a capacity of 1,600 kg, optimizing the time for
loading and unloading of goods. Furthermore, each vehicle is equipped with a refrigerator, so that the
temperature of perishable items can be kept low.
Pão de Açúcar Delivery offers more than 15 thousand items (with photos and nutritional information) for
home delivery, or in the location that the customer prefers. It currently operates in five state capitals
(São Paulo, Rio de Janeiro, Brasília, Curitiba, Fortaleza) and in other cities within the State of São Paulo
(Osasco, Barueri and others). The price of delivery in São Paulo is r$ 11.90 (equivalent to 4.75€) with
discounts being offered for regular deliveries according to the values of purchase: purchases greater than
R$ 750.00 (300€) are delivered for free.
Purchases completed before 13:59 are delivered on the following (working) day and purchases after 14:00
are delivered two days later (though the time may vary depending on overall demand).

40 Deliverable 1 - A worldwide overview on urban logistic interventions and data collection techniques
Figure 12: Pão de Açúcar delivery van
The main criticism of the service is still the perception of additional price compared to the store price.
However, an assessment carried out by the Brazilian Consumer Association of consumer (Pro Teste),
released in 2008, compared the store price and the internet price of a basket of a hundred items of
market-leading brands for nine supermarket networks. Out of the nine networks, in six cases the
difference between the internet price and store price was more attractive (from an internet point of
view) than it had been in the previous year (2007). For example, in Rio de Janeiro, the basket was 5%
cheaper in 2008 if purchased from the Pão de Açúcar internet site than if purchased at the Pão de Açúcar
store: in 2007, the difference was only 1%.
4.7 VEHICLE WEIGHT AND SIZE REGULATIONS
4.7.1 OVERVIEW
From BESTUFS Good Practice Guide on Urban Freight Transport (BESTUFS, 2007)
Regulations are frequently put in place by urban authorities for safety and environmental reasons to
prevent vehicles above a certain weight, size (length or width), or number of axles from using either a
particular road or a particular area (i.e. several connected roads). Reasons for introducing this type of
regulation include:
A narrow road;
A weak bridge;
A low bridge;
41 Deliverable 1 - A worldwide overview on urban logistic interventions and data collection techniques
Overhanging buildings;
To improve the amenities of local residents.
Regulations often exempt vehicles that need to access the road or area to make a delivery. Weight, size
and time regulations often conflict with those of other municipalities. A careful consideration should be
given to harmonisation.
4.7.2 EXAMPLES FROM MANILA (PHILIPPINES) AND SEOUL (SOUTH KOREA)
Manila (Philippines)
The truck restriction policy in Metro Manila, which was introduced in 1978 to ease traffic congestion,
prohibits trucks with gross weights of more than 4.5 tons to travel along eleven primary arterial roads.
Large trucks are prohibited from using the most heavily used arterial road EDSA from 6 am to 9 pm and ten
other major roads from 6-9 am and 5-9 pm during weekdays except holidays. Alternate routes, which
radiate from and to the port of Manila, are provided to be used by trucks at all times while the restriction
is in effect (Castro and Kuse, 2005).
Seoul (South Korea)
In Seoul, all trucks over 2.5 tons were banned since 1979 from circulating within the central area during
working hours to help relieve congestion. There are complex rules allowing some access on designated
routes, but the general objective is to push truck arrivals and departures into the night when traffic
volume is relatively light (Castro and Kuse, 2005).
4.8 ENVIRONMENTAL ZONES
The following two subsections contain overviews of environmental zones in Europe:
Key aspects of EZs Practice in current EZs in Europe (4.8.1)
Planned and existing Environmental Zones in European cities and regions (4.8.2)
4.8.1 KEY ASPECTS OF EZS PRACTICE IN CURRENT EZS IN EUROPE
From BESTUFS Policy and Research Recommendations IV (BESTUFS, 2008a)
Objectives of the EZ
The objective of an EZ is to improve environmental standards in the area in which the EZ is implemented.
The main environmental goal is to reduce vehicle pollutant emissions and thereby improve air quality
(helping to reduce fatalities and health problems caused by poor air quality). In addition EZs can also help
to improve other environmental standards by reducing traffic noise, and improving road safety.

42 Deliverable 1 - A worldwide overview on urban logistic interventions and data collection techniques
Geographical area covered by the EZ
Range from small, historic city centres (e.g. the city centre of Bologna which is 3.2 km2) to entire cities
(e.g. virtually all of Greater London – which is approximately 1580 km2). The vast majority of existing EZs
are located in urban areas (as this is where air quality levels tend to be worst), but there are examples of
EZs on motorways in Italy and Austria.
Times at which the EZ is in force
Of the EZs already implemented all, with the exception of some of the Italian schemes, operate 24 hours a
day, 365 days a year. Some of Italian schemes are only in force for certain hours per day during winter
months.
Vehicles included in the EZ restrictions
All current EZ schemes cover heavy goods vehicles over 3.5 tonnes. All EZs, with the exception of the
Dutch schemes, also include buses and coaches. The London EZ will also include vans over 1.205 tonnes
(unladen) and minibuses with over 8 seats from 2010. The German EZs cover all vehicles except
motorcycles. The Italian schemes include all vehicles.
Emissions standards required by the EZ
Goods vehicle emissions standards required by EZs are based on Euro engine standards. Most current EZs
require goods vehicle to meet Euro 2 standards, but some (including London) require Euro 3 standards.
Some schemes permit older vehicles to be retrofitted in order to meet the required emissions standards,
while others do not. Many Italian schemes require Euro 2 standards for diesel engines and Euro 1 for petrol
engines.
Enforcement approaches used in the EZ
Some current EZs use manual enforcement, while others use automated systems. Manual systems typically
involve vehicles having to register and then stickers having to be displayed on windscreens that are
manually checked by police. Automated systems make use of fixed and mobile camera-based ANPR
(automatic number plate recognition) and number plate checking with the relevant national vehicle
registration body.
Fines imposed on noncompliant vehicles entering the EZ
Range from 40 € (and one point in the national traffic penalty register) in Germany to £1000 in London
(approximately 1250 €).

43 Deliverable 1 - A worldwide overview on urban logistic interventions and data collection techniques
4.8.2 PLANNED AND EXISTING ENVIRONMENTAL ZONES IN EUROPEAN CITIES AND REGIONS
Table 2 shows information from ―BESTUFS Policy and Research Recommendations IV‖ (BESTUFS, 2008a)
about environmental zones in Europe.
Table 2: Planned and Existing Environmental Zones in European Cities and Regions
Countries Planned and Existing Environmental Zones in European Cities and Regions
Austria One scheme on the A12 motorway started in 2007.
Denmark EZs planned to start in five cities (Aarhus, Aalborg, Copenhagen, Frederiksberg
and Odense) in September 2010.
Germany EZs have already begun operating in 12 cities in 2008 (Cologne, Dortmund,
Berlin, Hannover, Leonberg, Ilsfeld, Ludwigsburg, Pleidelsheim, Schwäbisch-
Gmünd, Mannheim, Tübingen and Stuttgart). EZs are planned to start in another
10-20 German cities between late 2008 and 2010.
Italy EZs have already been implemented on the A22 motorway, in Bologna, and in
towns and cities in the following regions (during winter months and specified
hours per day): Emilia-Romagna, Lombardia, Piemonte, Veneto, and Bolzano.
The Netherlands EZs have already begun operating in 9 cities in 2007 and 2008. Another 8 cities
are planning to introduce EZs in 2008 and 2009.
Norway EZs are planned in Bergen, Oslo and Trondheim in 2009 and 2010.
Spain An EZ is planned to start in Madrid in 2008 as part of the Air Quality Strategy.
Sweden EZs have been implemented in Stockholm, Gothenburg, Lund and Malmo.
UK An EZ has been implemented in London in 2008.
Box 8 provides a specific example from Prague, Czech Republic.

44 Deliverable 1 - A worldwide overview on urban logistic interventions and data collection techniques
Reducing of emissions by environmental zone in Prague, Czech Republic
Prague (Czech Republic)
In Prague a decrease of carbon dioxide emission of 1,650 tonnes per year and a decrease of emission of PM 10, NOx, noise and energy consumption was achieved by the environmental zone which bans vehicles with a weight of more than 3.5 tonnes from the city centre and those with a weight of more than 6 tonnes from the centre‟s surroundings.
BACKGROUND & OBJECTIVES Between 1990 and 2003 the number of registered vehicles in
Prague almost doubled and the volumes of traffic more than
doubled. Furthermore, Due to the introduction of fees for heavy goods vehicles in neighbourhood countries of Germany
and Austria increasing freight transport was observed within
the Czech Republic, including many city centre areas such as Prague. Faced with these problems, the main aims of the
Prague local government was a reduction of emissions, noise
and energy consumption within the city, an increasing acceptance for clean vehicles and a more attractive city
centre promotion.
IMPLEMENTATION The environmental zone in Prague operates via a permit
system for access in the city centre for heavy vehicles and buses over 3.5 tonnes and in the surroundings areas for
vehicles over 6 tonnes. Drivers who wish to carry out goods
delivery or building works within the zone area can apply for permits, which are issued on the basis of vehicle weight and
legitimacy of access to the controlled zone. The
differentiation in weight limits between zones was introduced
to ensure widespread support for scheme implementation. The Institute of Transportation Engineering of the City of
Prague, the police, inhabitants and fleet operators are all
involved in the implementation and operation of the environmental zone. The police are responsible for
enforcement within the zone; they carry out random checks
for infringement of entry and award fines to those who do not comply with entry requirements. Traffic signs at entry roads
indicate the environmental zone. Traffic signs at entry roads
indicate the environmental zone.
BENEFITS Compliance levels in the new part of the environmental zone were estimated at roughly 50 %. The heavy vehicle traffic was
reduced up to 85% by this measure on the busiest routes, e.g.
caused by shifting on appropriate routes like the city ring road.
CONCLUSIONS Public acceptance was not really a problem in Prague,
especially for inhabitants affected by the negative effects of traffic. There was less support from transport companies
operating heavy vehicles within the city. However, Prague
overcame this by adopting a participatory approach to the
design and implementation of the scheme. Heavy haulage operators with businesses located within the zone respected
the regulations and in many cases sought solutions by using
lighter, compliant vehicles, one of the key objectives of the scheme.
The Prague environmental zone was successful in reducing
heavy-vehicle traffic flow, and managed to achieve a shift to
lighter, less-polluting vehicles. However, fleet renewal can often take time and it is therefore important that zone rules
are set at an appropriate level: if too weak, there may not be
enough pressure on operators; if too stringent, operators may be driven out of business.
A 50 % compliance rate has been reported for the Prague
environmental zone. The compliance rate, and effectiveness of the measure, could be increased through the use of more
stringent enforcement methods (such as cameras), which
would increase the operating costs.
More information about transferability:
http://reports.eea.europa.eu
More about environmental zones in Europe:
http://www.trendsetter-europe.org
Source: EEA, Technical Report No. 2/2008, Chapter 7
AUTHOR Alexander Pesch
CONTACT Paulina Eriksson
Box 8: Reducing of emissions by environmental zone in Prague (Czech Republic)
Source: http://www.eltis.org/study_sheet.phtml?study_id=1828&lang1=en (posted 01/04/2008)

45 Deliverable 1 - A worldwide overview on urban logistic interventions and data collection techniques
4.9 LORRY LANES
4.9.1 OVERVIEW
From BESTUFS Good Practice Guide on Urban Freight Transport (BESTUFS, 2007)
1. Road lanes designated for lorry use could help to reduce delay and improve journey time reliability.
The following options exist:
Dedicated lorry lane - lane only for goods vehicles Bus and lorry lane (also called ―no-car‖ lanes);
High occupancy vehicle lane – lane for buses, goods vehicles and cars with a specified number of
occupants;
Bus lanes – which may be used by goods vehicles for unloading in specific locations but not for
travel (e.g. the ―Lincoln‖ delivery bays implemented in bus lanes in Paris);
2. Issues to consider in thinking about the use of lorry lanes include:
Dedicated lorry lanes are often used on hills (known as Crawler lanes) and to direct lorries to
industrial areas avoiding sensitive areas;
―No-car‖ lanes can provide a viable alternative to a bus only lane in situations where bus usage is
insufficient to justify an exclusive bus lane;
Lanes available to all goods vehicles are easier to enforce, compared with those available to
selected types or sizes of vehicles, but may result in too many vehicles using the lane to improve
journey times and reliability;
In designing lanes that permit a mix of vehicles to use them, urban planners need to establish how
well these vehicles will interact with each other on the section of proposed road.
4.9.2 EXAMPLE: NORWICH (UK)
Box 9 provides an example of a shared bus/lorry lane for Norwich (UK).

46 Deliverable 1 - A worldwide overview on urban logistic interventions and data collection techniques
Priority access for clean goods vehicles/Norwich (United Kingdom)
Norwich (United Kingdom)
Goods vehicles which meet pre-determined clean vehicle standards would be allowed to use priority bus lanes in Norwich. This work package was a means to demonstrate the effectiveness of opening up facilities to assist goods operators who respect cleaner urban transport principles.
OBJECTIVES / INNOVATIVE ASPECTS Allow sharing of priority collective transport priority lanes to freight operators who respect cleaner urban transport
principles
Increase the proportion of urban goods vehicle transport, which meets pre-determined emission control
standards
Work in partnership with goods operators who respect clean urban transport principles in order to facilitate
their journeys in the Norwich area and mitigate the
negative effects of urban freight transport on other
network users
THE MEASURE Goods vehicles which meet pre-determined clean vehicle
standards would be allowed to use transport priority lanes.
One demonstration project was implemented covering a
proportion of the priority lanes in the urban area, with the aim of demonstrating their effectiveness in assisting operators
who respect clean urban transport principles.
IMPLEMENTATION STATUS A study of existing bus lanes in Norwich was undertaken to determine the most suitable lanes for HGVs to use. Methods
for enforcing the proposals and stakeholder views were
examined. As a result of this study the proposals were
amended to allow only HGVs associated with the Norwich Freight Consolidation Centre to use the most appropriate bus
lanes for its operation. This allowed greater control over the
number and behaviour of HGVs using the bus lanes and made the measure easier to enforce. Consolidation centre vehicle
drivers were given training on how to drive when in the bus
lane. The vehicles had specific liveries to identify that they
could use the bus lanes.
The scheme has been implemented for a one year experimental period with monitoring being undertaken during
this period.
RESULTS The key results were as follows:
The width of existing bus lanes was a barrier to
implementing the measure, and revised objectives were developed so that only consolidation centre vehicles
could use the bus lanes
Number of HGVs using the bus lanes is about 1 per day, and is due to the number of customers currently using
the consolidation centre. The number is expected to
increase as the consolidation centre gains more
customers
There was some stakeholder opposition to the measure
Monitoring shows a peak hour journey saving of 2 to 4 minutes per trip in an overall average journey of 25
minutes. This equates to small savings in emissions and
fuel consumption. There was little benefit from using
the bus lane at off-peak times
AUTHOR AND CONTACT Gavin Broad
DOCUMENTS 10-3 10-4 10-5bNorwich.pdf (794 kByte)
Box 9: Priority access for clean goods vehicles/Norwich (UK)
Source: http://www.eltis.org/study_sheet.phtml?study_id=2447&lang1=en (Posted: 21/4/2009)
47 Deliverable 1 - A worldwide overview on urban logistic interventions and data collection techniques
4.10 ROAD CHARGING SYSTEMS
4.10.1 EXAMPLES FROM EUROPE
From BESTUFS Good Practice Guide on Urban Freight Transport (BESTUFS, 2007)
Several examples of urban road pricing schemes exist in European cities. The best known examples are
infrastructure charging schemes for single tunnels or bridges, e.g. the Öresund Bridge or the Warnow
Tunnel in Rostock. One of the first successful examples of urban pricing is from the city of Trondheim. A
very successful recent example is the London congestion charging scheme. Three main objectives are
often followed in urban pricing schemes:
1. To cover construction and maintenance costs of urban infrastructure;
2. To influence the transport demand for inner city transport processes;
3. To charge external costs from transport processes.
Example of urban road pricing: Tolls in Norwegian cities
Toll systems were introduced in Trondheim in 1983 and Oslo and Bergen in 1986.
The tolls were intended to provide funding for road improvement rather than manage traffic
levels;
The schemes are operated by private companies partially owned by the city councils;
The toll for vehicles under 3.5 tonnes is 1.5 – 2 euro and 3.5 - 4 euro for vehicles over 3.5 tonnes.
Example of urban road pricing: Congestion charging scheme in London
A congestion charging scheme was introduced in central London in February 2003. It is operated
on behalf of the urban authority by a private company;
The priority of this scheme is to reduce traffic congestion and the related environmental impacts.
Any surplus revenues generated are invested in transport in London;
Drivers entering the charging zone were initially charged £5 (approx 7.50€) a day to drive within
the zone between 07.00 and 18.00 on Mondays to Fridays. This was increased to £8 (approx. 12€)
in 2005. Goods vehicles pay the same daily charge as other vehicles;
Exemptions and special tariffs are available for licensed taxis, vehicles carrying disabled persons,
emergency service vehicles, motorbikes, and alternatively-fuelled and electrically-powered
vehicles that attain strict emission standards;
The charge can be paid for one day, one week, one month or one year by telephone, post,
internet or at retail outlets;
Drivers are not required to display a licence – but their vehicle‘s registration number is entered on
a database;
Number plates of vehicles entering or circulating within the charging zone are observed by a
network of 700 fixed and mobile cameras. These numbers are then checked against the database;

48 Deliverable 1 - A worldwide overview on urban logistic interventions and data collection techniques
If the keeper of a vehicle observed in the zone but not shown on the database has not paid the
charge by the next day they receive a penalty charge of £50 - £150 (approx. 75 - 225 €);
Since the scheme was introduced traffic volume entering the zone has fallen by 18%, delays are
estimated to have reduced by 30%, and there has been a broadly neutral impact on overall
business performance in the zone.
4.10.2 ELECTRONIC ROAD PRICING, SINGAPORE
The original road pricing scheme, known as the Area Licensing Scheme, was introduced in Singapore3 in
the Restricted Zone (RZ) in 1975. The scheme was subsequently extended to major expressways with the
Road Pricing Scheme (RPS). In September 1998, the ERP system replaced the manual system for the RZ
and expressways. In September 1999, ERP was extended to some of our key arterial roads beyond the RZ.
Figure 13: Electronic road pricing in Singapore
3 Land Transport Authority, Singapore. ‗‘Electronic Road Pricing in Singapore‘‘. Available at: http://www.lta.gov.sg/motoring_matters/index_motoring_erp.htm

49 Deliverable 1 - A worldwide overview on urban logistic interventions and data collection techniques
4.11 ALTERNATIVE MODES
4.11.1 ALTERNATIVE MODES IN EUROPE
Various examples of use of ―alternative modes‖ for carrying urban freight in Europe are given in the EU
Regional Report. Box 10, Box 11 and Box 12 show three of these examples, concerning: a bicycle courier
service in Budapest; electric bicycles in Paris; and the Cargotram from Zurich.
Hajtás Pajtás Bicycle Courier Service : from a SME to a leading actor in Sustainable Mobility (Hungary)
Budapest (Hungary)
The Hajtás Pajtás bicycle courier company started its operations in 1993 as a three-person enterprise. After a decade of operations it has grown into one of market leaders for local parcel and mail delivery. With a staff of 160 people it frees the congested capital from 100 cars, saving an estimated 150 tons of CO2 emissions annually. The company takes a leading role in promoting biking in the capital and is one of the organizers of the Critical Mass annual biking demonstrations - attracting more than 80,000 people in 2008. What‟s more, the company was awarded with the “Business Ethics Prize” in 2007 for the socially and environmentally outstanding business conduct.
BACKGROUND & OBJECTIVES The Hajtás Pajtás bicycle courier company was established as
a low-budget family enterprise, based on the ideas seen in
some Western European countries. The beginning was very difficult, primarily due to difficulties in developing a customer
base and the practically non-existent culture of cycling
mobility in Budapest. However, after years of hard work the
company has evolved into a mid-sized enterprise of great visibility. Although with the increase of size business hierarchy
and management systems had to be increased, the ―old‖
values still apply: to show a viable alternative to motorized transport and to keep business ethics on first place.
IMPLEMENTATION Hajtás Pajtás is not the cheapest courier service in town, but
in terms of quality it is at the top. Service is very fast
(unaffected by traffic jams), the personnel tends to be young and motivated (e.g. students) and every delivery can be
tracked back in all details through a sophisticated delivery
database. With a staff of 160 people the couriers cycle an estimated of 2 million kms a year.
A courier typically covers 60-70 km‘s a day, and personnel preferences (e.g. distances, working hours or terrain) are
always considered when assigning a delivery to a courier. 10%
of delivery staff are women - and candidates are accepted
even when there is no hiring. Contrary to public opinion, from 365 days only 20-25 days have ―really bad weather‖ - and
surprisingly the market demand is even higher in winter than
in summer.
Although it is not easy to be a courier in the congested city of
Budapest with a very limited biking infrastructure, accidents are very few (less than a dozen / year) and minor (healing
within 8 days). The original grassroots philosophy is still a
main guiding principle in pursuing corporate social responsibility. Unlike the competitors, the company employs
all its staff directly, declares the full salary for taxes and
provides full health insurance and pension contribution. Hajtás Pajtás has its own music band and sports club. Office
workers can rest 10 minutes every hour in a resting corner.
70% of office waste is recycled.
Hajtás Pajtás took a very active role in organising the annual Critical Mass biking demonstrations - contributing to a
breakthrough of the acceptance of biking in Budapest in
recent years.
CONCLUSIONS All in all, Hajtás Pajtás provides a real example that business
sustainability can very much be in line with social and
environmental values. Hajtás Pajtás has been one of the key
stakeholders in the past decade that were at the forefront of promoting biking as an alternative to motorized transport.
AUTHOR Gabor Heves
CONTACT Károly Sinka
Box 10: Hajtás Pajtás Bicycle Courier Service (Hungary)
Source: http://www.eltis.org/study_sheet.phtml?study_id=1971&lang1=en (posted 30/07/2008)
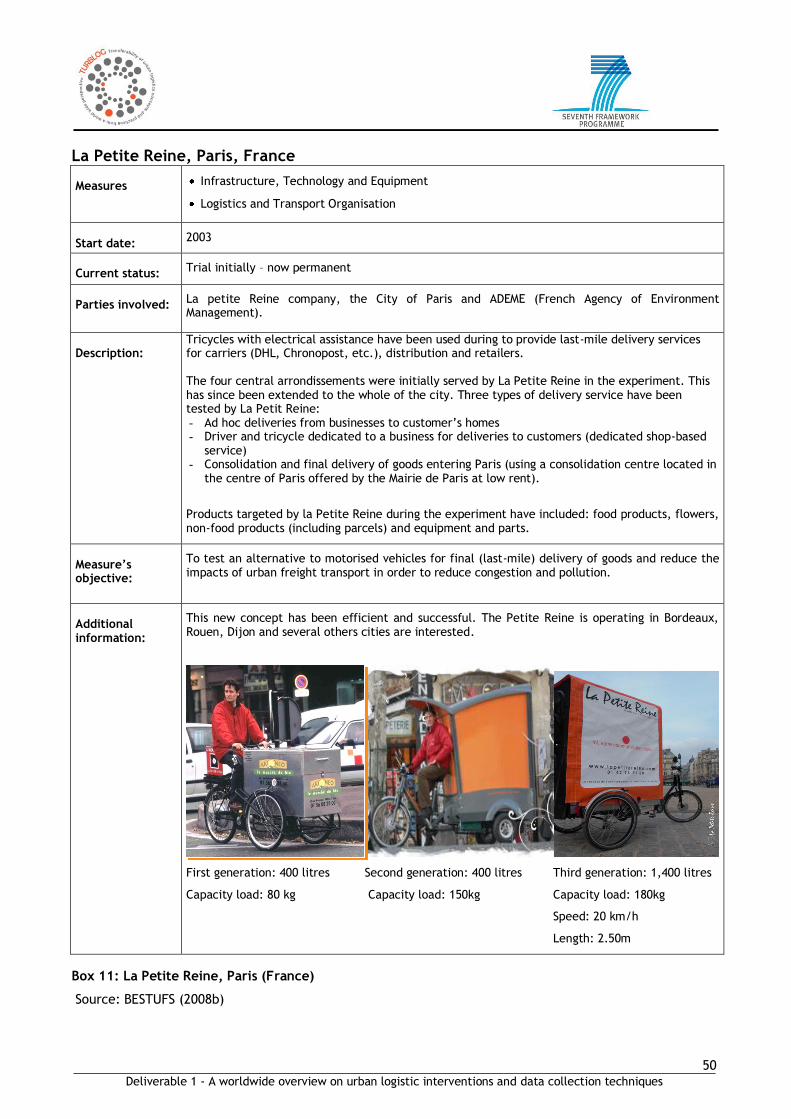
50 Deliverable 1 - A worldwide overview on urban logistic interventions and data collection techniques
La Petite Reine, Paris, France Measures Infrastructure, Technology and Equipment
Logistics and Transport Organisation
Start date:
2003
Current status:
Trial initially – now permanent
Parties involved:
La petite Reine company, the City of Paris and ADEME (French Agency of Environment Management).
Description:
Tricycles with electrical assistance have been used during to provide last-mile delivery services for carriers (DHL, Chronopost, etc.), distribution and retailers. The four central arrondissements were initially served by La Petite Reine in the experiment. This has since been extended to the whole of the city. Three types of delivery service have been tested by La Petit Reine: - Ad hoc deliveries from businesses to customer‘s homes - Driver and tricycle dedicated to a business for deliveries to customers (dedicated shop-based
service) - Consolidation and final delivery of goods entering Paris (using a consolidation centre located in
the centre of Paris offered by the Mairie de Paris at low rent).
Products targeted by la Petite Reine during the experiment have included: food products, flowers, non-food products (including parcels) and equipment and parts.
Measure‟s objective:
To test an alternative to motorised vehicles for final (last-mile) delivery of goods and reduce the impacts of urban freight transport in order to reduce congestion and pollution.
Additional information:
This new concept has been efficient and successful. The Petite Reine is operating in Bordeaux, Rouen, Dijon and several others cities are interested.
First generation: 400 litres Second generation: 400 litres Third generation: 1,400 litres
Capacity load: 80 kg Capacity load: 150kg Capacity load: 180kg
Speed: 20 km/h
Length: 2.50m
Box 11: La Petite Reine, Paris (France)
Source: BESTUFS (2008b)

51 Deliverable 1 - A worldwide overview on urban logistic interventions and data collection techniques
Cargotram, Zurich, Switzerland
Measures: Infrastructure, Technology and Equipment
Logistics and Transport Organisation
Accompanying measures
Start date:
Cargotram since 2003 and since 2005 E-Tram (additional service, collection of electronic waste and equipment).
Current status:
Operational
Parties involved:
The municipal public waste disposal and recycling company Zurich (ERZ - Entsorgung und Recycling Zürich) - together with the Public transport operator of Zurich (VBZ).
Description:
ERZ (Entsorgung und Recycling Zürich) is the city waste disposal service. In Zurich, items too bulky for the waste collection vehicle can be collected at a charge, or left for free at one of the two ERZ yards.
Zurich has an extensive tram network serving most neighbourhoods. There are also some suitable sidings not used by regular services. ERZ approached the tram company, VBZ, with the revolutionary idea of using this infrastructure to collect bulky waste in the neighbourhoods, so making disposal much more straightforward for residents. The idea was met with enthusiasm and Cargotram was born.
Measure‟s objective:
The main objective has been to reduce the negative effects from waste collection by trucks such as noise and exhaust emissions. Therefore the replacement of district collections by truck and the optimisation of the performance in waste collection processes close to the customers‘ home and the transport by tram to the recycling area have been aimed at.
Additional information:
For stakeholders the benefits are less traffic and high acceptance from the population.
For service providers the marketing effect and image (winner of innovation award).
For the public the comfortable disposal possibilities for bulky goods free of charge.
The main success factors have been the good planning and communication, the good co-operation of service providers, high acceptance.
The project is transferable to other cities.
Source: http://www.vbz.ch/vbz_opencms/opencms/vbz/deutsch/Dienstleistungen/Cargotram
Box 12: Cargotram, Zurich (Switzerland)
Source: BESTUFS (2008b)

52 Deliverable 1 - A worldwide overview on urban logistic interventions and data collection techniques
4.11.2 Non-Motorised modes in Brazil
In general in Brazil, bicycles, human-powered vehicles and animals are not used as cargo vehicles in the
major cities, though there are exceptions. Rather, such modes can be seen more in the smaller towns,
where they are used for specific services such as collection of papers and recycled materials (―reverse
logistics‖). Figure 14 and Figure 15 present examples of these modes.
http://blog.ta.org.br/2009/01/12/ideias-soltas/ http://pedaleiro.com.br/wp-
content/uploads/2007/08/bike-carga2.jpg
http://www1.folha.uol.com.br/revista/images/rf2704200812.jpg; http://ipt.olhares.com/data/big/93/933936.jpg
Figure 14: Bicycle and human-powered urban freight transport

53 Deliverable 1 - A worldwide overview on urban logistic interventions and data collection techniques
Figure 15: Horse-drawn urban freight transport (Brazil)
Source: http://farm2.static.flickr.com/1338/1458635961_5365c1d5ee_b.jpg
Variations of these non-motorised modes are found throughout Africa and Asia, where they frequently
provide ―last mile solutions‖ for the distribution of goods from the main markets to neighbourhood
markets, stores and the final consumer. For example, Figure 16 shows the delivery of bread by bicycle in
Cairo (Africa)
Figure 16: Bread delivery by bicycle in Cairo (Africa)

54 Deliverable 1 - A worldwide overview on urban logistic interventions and data collection techniques
5 BUSINESS ARRANGEMENTS
This chapter looks at urban logistics from a business point of view, concerning public-private partnerships
and private associations of businesses. When considering these issues, it is important, in order to avoid
confusion, to be clear about definitions for regulation, governance and government: Section 5.1 gives
definitions of these terms. Section 5.2 gives some summary conclusions about public-private partnerships
from the START project (START, 2008), whilst Section 5.3 gives examples of public-private partnerships
and private associations from La Rochelle (France), Malmö (Sweden) and Fukuoka City (Japan).
5.1 DEFINITIONS OF REGULATION, GOVERNANCE AND GOVERNMENT
Regulation
Regulation means the control of individual or corporative (private or public) behavior by authoritative
rules put in force by a government, through its institutions that have several differentiated functions.
Regulations can also exist without being defined or imposed by government. Often we find in logistics
what is called of self-regulation, that is norms imposed by the industry through mechanism of trade
association, norms, etc. State regulation is often justified by market failure that means always state
intervention to ensure welfare, assuming markets are unable to reach similar levels of benefits for the
society. So, regulation is neither government nor governance.
Governance
Governance is the act or mission of governing, meaning management of resources, generation of revenues
and added value, etc. It constitutes a process of management and leadership, an exercise of power for
which the main success factor is the existence of obedience towards the governing structures. There is
also a more philosophical definition of governance that connotes the term with democratic government of
high public participation. We will not pursue this line of thought since it seems to be inadequate to urban
logistics. Governance exists in private and public endeavor. When it is exercised by public representatives
(that is bodies whose legitimacy comes from elections) that is Public Governance and depending on
institutional design governance can be exerted at different institutions and levels (e.g. federal, national,
regional, municipal, etc).
Government
Governance is exerted by a government. That is the organization (or institution), or agency through which
authority is exercised, processes are controlled and managed. The term is normally used for cases of
public sovereignty. However, with rigour the term can also be used within private organizations, although
here the common designation is board of directors. The government can be structured in several
hierarchical layers of administration and governance as expressed above. These layers can be spread
among different functional structures.

55 Deliverable 1 - A worldwide overview on urban logistic interventions and data collection techniques
5.2 PUBLIC-PRIVATE PARTNERSHIPS – LESSONS LEARNT WITHIN START From the START Final Report (START, 2008).
Close collaboration between public and private partners such as the city politicians, the council, transport
companies and local businesses form the basis of START. To emphasise the importance of collaboration,
Local freight networks have been established in every START city. The main findings when it comes to
collaboration and networking within the freight transport field are, perhaps not surprisingly, rather
consistent across countries, and they allow for a consolidation of lessons learnt. The lessons learnt are
based on the experiences and knowledge of the START partners on setting up, developing and running
Local freight networks, the outcomes from the workshops and the evaluation.
How to encourage the private sector to be involved?
The private sector should be encouraged to participate more in the cities´ work with urban freight. This
could be done through the following:
• Direct personal contacts
To work with a network that as much as possible consists of the same persons is an advantage. It
makes people feel more involved and there is a consistency in the work.
• Wider dissemination of benefits
To disseminate to all players in the logistic chain that there are advantages in collaborating with
other stakeholders. Special emphasis on the financial benefits is necessary to gain interest from
many haulage companies and retailers.
• Provision of „quick win‟ solutions
The Local freight networks in START have tried to give quick feedback to the suggestions raised
within the networks. The participants feel that their engagement and collaboration really have an
effect. Implementation of extra loading zones is a good example of ‗quick win‘ solutions.
• Appealing to a sense of corporate social responsibility
To get to an improved transport situation in the cities, all parties involved must contribute.
• Implementation of incentives
When it comes to the implementation of access restrictions or other regulations, all parties do not
always agree. However, if the private sector has been involved in the discussions and if information
has been provided early to the business it is easier for the city to gain acceptance and
understanding for the regulations. Ultimately this can lead to an actual obedience of the
restrictions which facilitate the control. Last but not least, the best acceptance of restrictions is

56 Deliverable 1 - A worldwide overview on urban logistic interventions and data collection techniques
reached when they are combined with incentives, preferably also those developed in cooperation
with the transport business.
Advantages of public-private cooperation
The involvement of the private sector is crucial for the success of freight networks if the best outcome is
to be achieved. They are stakeholders, having knowledge of the local area and the relevant experience to
identify problems, advise potential outcomes and suggest changes or alternative initiatives. They have the
contacts and networks in place to be able to communicate changes, influence the speed of change and
provide links to potential new participants.
Other advantages are:
• Dissemination source to stakeholders‘ own contact network;
• Reliable and direct information;
• Identification of problems and creating solutions;
• Mutual understanding;
• Encouraging long-term relationships and building trust.
5.3 PUBLIC-PRIVATE PARTNERSHIPS AND PRIVATE ASSOCIATIONS: EXAMPLES FROM FRANCE, SWEDEN AND JAPAN
This section provides information on three case studies with respect to public-private partnerships and
private associations concerning urban freight:
Development of partnership with logistic operators / La Rochelle (France);
Sustainable SME logistic for the food industry – Malmö (Sweden);
Joint Distribution System, Fukuoka City (Japan).

57 Deliverable 1 - A worldwide overview on urban logistic interventions and data collection techniques
Development of partnership with logistic operators/La Rochelle (France)
La Rochelle (France)
First attempts have been made with different actors in order to make them aware of the necessary evolutions in goods distribution. These actions have to be emphasized at a large scale for all the categories of actors, which is now made possible by Elcidis project.
OBJECTIVES / INNOVATIVE ASPECTS This set of tasks aims to encourage all actors in city logistics, from
the individual to shops owners to participate actively in the optimisation of city logistics activities in all the supply chains involved in these domains.
The most innovative aspect will be the participation and the set up and validation of a methodology to involve partners. This will
also lead to a better knowledge of basic parameters in goods distribution.
THE MEASURE Actions will be quite varied in their format. The main thrust will
focus on the following:
All traders from retailers to hyper market managers need to be motivated to use the system for themselves or their customers;
Specific incentive measures for craftsmen, SMEs mainly working in town will be elaborated to convince them to invest in clean vehicles (for example negotiate special
discount prices with local car vendors);
Private goods carriers will be encouraged to use clean vehicles (see WP1) and helped to coordinate their
deliveries;
Specific agreements with carriers will be set for clean goods distribution modifying several behaviours from
delivery hours, up to at most coordination between them (Goods quality agreement).
IMPLEMENTATION STATUS To achieve this actions, the activities will be based on deep
cooperation with all the involved partners in order to identify clearly the behaviour and requirements of the different categories of actors (working groups) and to define possible incentives or rules for goods distribution for each (global coherence and set up
planning will be in 10.1)
This will lead to the development of a specific marketing and communication planning in which various documents will be
produced, like leaflets, and other documents for promoting the goods distribution system.
Another activity will lead to the launching of a freight forum to demonstrate, explain and encourage best practices.
Results will be analysed and evaluated.
RESULTS SUCCESS will contribute to:
foster the cooperation between logistics operators in CdA La Rochelle;
increase the use of clean vehicles for goods distribution
and
improve the behaviour during delivering.
AUTHOR Milena Perpelea
CONTACT Milena Perpelea
In cooperation with:
Box 13: Development of partnership with logistic operators in La Rochelle (France)
Source: http://www.eltis.org/study_sheet.phtml?study_id=2299&lang1=en (posted 26/07/2007)

58 Deliverable 1 - A worldwide overview on urban logistic interventions and data collection techniques
Sustainable SME logistic for the food industry - Malmö/Sweden
Malmö (Sweden)
A common food logistic system have been developed linking 40 - 50 food producers with 5 purchasers in the region. The project which is first of its kind in Europe is planned to be owned and operated by the partners involved and aims at developing a cost and environmentally efficient regional shared transport system. Photo credit: Klaus Post
OBJECTIVES / INNOVATIVE ASPECTS The measure are to develop one common food logistics system
dedicated to linking 40-50 food producers in the region with 5 purchasers in Malmö in order to develop a cost efficient and environmentally efficient regional shared transport system. The
project is the first of its kind in Europe in which modern IT technology is used to create a professional market place dedicated to the regional food industry, and which is owned and operated by the partners involved.
THE MEASURE The City of Malmö will develop an open source logistics system which will enable businesses in the city to order products directly from producers/suppliers in the region and get these delivered in
an economically and environmentally efficient way. An IT based logistics tool containing seasonal planner, ordering and confirmation and logistics co-ordination system will be developed.
A training programme will be developed and implemented for all businesses included in the system to ensure the smooth operation of the logistics system. The logistics operator will convert/change 5 vehicles to operate on cleaner fuels
Some of the actions are: • Advanced analysis of current supply and demand and
development potential and product flow analysis • Development of regional IT based logistics tool containing seasonal planner, ordering and confirmation and logistics co-ordination system.
• Development and implementation of training programme for all business included in the system to ensure the smooth operation of the logistics system.
• Specific support with quality management and time management to meet the demands for efficient logistics.
IMPLEMENTATION STATUS The web based solution is programmed and connections have been established with several farmers and business within the system. Several producers have adopted the system which was officially
released in late summer 2008.
RESULTS The measure implementation was delayed and many relevant indicators were therefore difficult to assess. Scenario projections showed that substantial reductions in CO2 emissions are likely
if/when the system reaches a critical mass. 7 out of 10 stakeholders believed that the idea of a virtual market place has potential. Less than 1 out of 10 respondents believed that the idea
had no potential at all. Both awareness levels and acceptance levels were reasonably high, pointing to some potential, but also it suggested that more efforts should have been made when it came to ―selling the idea‖ through information, communication
and marketing.
AUTHOR Trevor Graham
CONTACT Trevor Graham
DOCUMENTS Full Evaluation Report - Sustainable SME logistic for the food industry [en] (386 kByte)
Box 14: Sustainable SME logistic for the food industry in Malmö (Sweden)
Source: http://www.eltis.org/study_sheet.phtml?study_id=2459&lang1=en (posted: 21/4/2009)

59 Deliverable 1 - A worldwide overview on urban logistic interventions and data collection techniques
Joint Distribution System, Fukuoka City4
In order to alleviate traffic congestion and improve the environment, a joint distribution system started in
1978 in the Tenjin district of Fukuoka City by 29 freight carriers under the supervision of Regional
Transport Office of the Ministry of Transport. In 1994, 36 companies have established the Tenjin District
Joint Distribution Company Ltd for promoting the systems. It distributes the goods from member carriers
to each receiver and also collects goods from customers at the district and unloads them at the
distribution centre. There was also truck only parking lots for the ease of loading and unloading although
not dedicated for the JDS. The Regional Transport Office provides a platform for discussing related things
and coordinate many stakeholders including shippers, freight carriers, residents and administration who
are involved in this system.
Box 15: Joint Distribution System, Fukuoka City (Japan)
4 Joint distribution system in Fukuoka City. Available at: http://www.bestufs.net/cgi-bin/projectdb/project_db.pl?init=shwprodescr&id=114

60 Deliverable 1 - A worldwide overview on urban logistic interventions and data collection techniques
6 TECHNOLOGY
6.1 OVERVIEW
This chapter provides information about new technological developments of relevance to urban freight.
Section 6.2 provides a summary of the SMARTFREIGHT concept, involving use of Information and
Communication Technologies (ICT) in urban freight. Section 6.3 provides an overview of relevant fuel and
vehicle technology, giving examples of interventions from Germany, the Netherlands and Asia.
6.2 SMARTFREIGHT CONCEPT From the SMARTFREIGHT newsletter of June, 2008.
http://www.smartfreight.info/newsletter.htm
SMARTFREIGHT aims at specifying, implementing and evaluating ICT solutions that integrate closely urban
traffic management systems with freight management systems in urban areas. Bi-directional wireless
communication with individual vehicles will be addressed, opening new possibilities for further
cooperation between intelligent vehicles and traffic management. The participation of different
stakeholders implementing the SMARTFREIGHT solutions is one of the key aspects of the project. A
Reference Group of local experts from the test cities, together with European colleagues representing
transport and city authorities, logistics companies and consultants will provide input and monitor the
project progress. This cooperation among different actors will accelerate the future implementation of
the SMARTFREIGHT concept. With this idea in mind, the project is prepared to spread its results among a
wider audience. The European Commission and the SMARTFREIGHT partners are looking forward to see the
concept implemented in many regions in Europe for the sake of sustainable urban mobility supported by
intelligent freight transport systems.
Why Smartfreight?
Freight transport has a central role for the business and life of a city, having as well an impact on
environment, traffic congestion and safety. Still, commercial traffic has never been given much attention
in the transport planning process. Today it is not possible to take traffic management measures towards
individual freight vehicles based on information about the current traffic situation; traffic management
systems do not serve those organising freight transport in the city; there is a lack of coordination of the
activities carried out by several distributors companies and it is difficult to predict their access to limited
resources like loading and unloading areas. SMARTFREIGHT wants to make urban freight transport more
efficient, environmentally friendly and safe by developing and evaluating Information and Communication
Technology (ICT) solutions, for a better coordination between Urban Traffic Management Systems (UTMS)
and Freight Distribution Management Systems (FDMS).
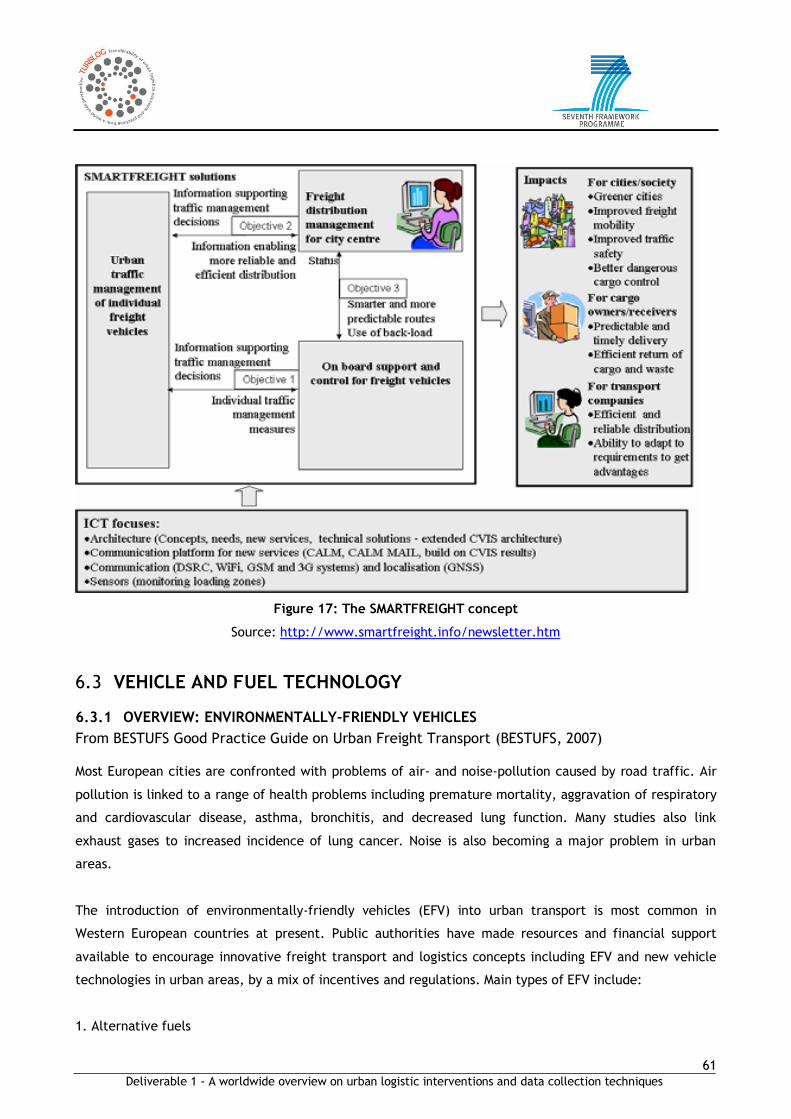
61 Deliverable 1 - A worldwide overview on urban logistic interventions and data collection techniques
Figure 17: The SMARTFREIGHT concept
Source: http://www.smartfreight.info/newsletter.htm
6.3 VEHICLE AND FUEL TECHNOLOGY
6.3.1 OVERVIEW: ENVIRONMENTALLY-FRIENDLY VEHICLES
From BESTUFS Good Practice Guide on Urban Freight Transport (BESTUFS, 2007) Most European cities are confronted with problems of air- and noise-pollution caused by road traffic. Air
pollution is linked to a range of health problems including premature mortality, aggravation of respiratory
and cardiovascular disease, asthma, bronchitis, and decreased lung function. Many studies also link
exhaust gases to increased incidence of lung cancer. Noise is also becoming a major problem in urban
areas.
The introduction of environmentally-friendly vehicles (EFV) into urban transport is most common in
Western European countries at present. Public authorities have made resources and financial support
available to encourage innovative freight transport and logistics concepts including EFV and new vehicle
technologies in urban areas, by a mix of incentives and regulations. Main types of EFV include:
1. Alternative fuels
62 Deliverable 1 - A worldwide overview on urban logistic interventions and data collection techniques
Including LPG, CNG, Bio-Fuels and Hydrogen-based technology;
Technologies and fuels already exist but significant market penetration has yet to be achieved;
2. Diesel and petrol
Euro engine emissions standards for goods vehicles are helping to significantly reduce emissions;
Particulate traps can be fitted to vehicles to capture particulates before they enter the
atmosphere;
3. Electric and hybrid vehicles
Electric vehicles are especially suitable to reduce noise emissions and produce no exhaust
emissions.
The promotion and usage of EFV in urban freight transport has been encouraged by several urban
authorities and national governments. Many municipal and national activities have started to encourage
the use of EFV in urban freight transport. National programmes like the PIEK-programme or the French
―National Programme on Goods in Cities‖ have evidenced that national programmes and support measures
can lead to successful results.
6.3.2 EXAMPLES FROM GERMANY AND UTRECHT (THE NETHERLANDS)
Box 16 provides information about CNG-Vehicles for parcel delivery used by DHL in Germany, whilst
Box 17 provides information about the Cargohopper in Utrecht (Netherlands).

63 Deliverable 1 - A worldwide overview on urban logistic interventions and data collection techniques
CNG-Vehicles for parcel delivery used by DHL in Germany
e.g. Berlin, Bremen, Dresden, Stuttgart (Germany)
DHL operates 170 EEV (Environmentally Enhanced Vehicles) for parcel delivery in 19 German cities. In Germany about 2.8 Million parcels are delivered by DHL (the logistic brand of Deutsche Post AG) every day. In 2007 it operates 6,500 specific delivery vehicles with optimized box body. Since 2005 CNG delivery vehicles with the highest environmental standard EEV were introduced in cities with high environmental impacts, caused e.g. by road traffic.
BACKGROUND & OBJECTIVES Until 2003 all diesel driven vehicles had been improved to the standard EURO III, as usual in the market. Because it is seen as a duty to reduce the emissions (e.g. nitrogen
oxides, noise, PM,...) in high polluted cities DHL was searching for opportunities for further improvements.
IMPLEMENTATION After a test with normal MB Sprinter vans, driven by CNG, in Regensburg in 1999, DHL looked for CNG-driven vehicles for parcel delivery with bigger box bodies because the payload of the vans
was too low. In 2004 after a tendering for such vehicles Iveco was commissioned to produce the first 50 vehicles of the type Iveco Daily 50 C11 G which were put into operation in Berlin, Bremen, Düsseldorf, Stuttgart, Regensburg and Munich .
The decision for the cities based on valuation of infrastructure, e.g. network of petrol stations offering CNG, overstepping of maximum PM emission and economic advantages. Such advantages
are e.g. longer operating permissions in the delivery districts. In some districts exist tight restrictions e.g. strict noise control. Referring to such advantages the delivery process can be optimized and becomes more economic. Compared to normal vans
the bigger box bodies resulted in a rise in payload of about 40%. The number of operating vehicles and of tours decreased. Good experiences consequently led to an extension in operated vehicles
to 170 in 2006. The vehicles are operated in the following 19 locations: Bremen (12), Hamburg (8), Hannover (8), Berlin (20), Dresden (8), Leipzig (8), Dortmund (6), Düsseldorf (12), Duisburg (8), Essen (6),
Bonn (4), Frankfurt am Main (7), Mainz (7), Stuttgart (30), Augsburg (5), Nürnberg (5), München (6), Regensburg (5), Würzburg (5).
COSTS AND EFFECTS The usage of CNG vehicles results in reductions of about 1.6
tonnes nitrogen oxides and approx. 150 kg PM per year, furthermore significant noise reductions compared to diesel vehicles are observed. Because of low operational performance
(approx. 10 000 km p.a.) and the small number of vehicles, only about 40 % of the extra costs can be compensated by fuel costs savings and user benefits increased weight (5.2 t for CNG vehicles compared with 3.4 t for diesel vehicles) caused by heavy steel gas
tanks result in a challenge for the organisation of operation. Vehicles with this weight demand a driver‘s licence C1 or class 3 and a digital tachograph in addition. So availability of drivers is
limited.
CONCLUSIONS With the implementation of the CNG-driven parcel delivery vehicles in Germany the emissions were reduced in the delivery districts compared with the EURO-III diesel vehicles. Due to higher
initial costs and low mileage in parcel delivery operation of CNG vehicles requires additional economic benefits for CNG vehicles to be granted by the cities. Although not generally noticed, there are
programmes helping to realize such benefits, e.g. within the EU project „PARFUM― (part of the ―LIFE‖ program) in Bremen an environmentally friendly loading area with special permissions for EEV-vehicles was created. EEV is actually the most strict standard
for vehicles emissions, complied by the new DHL CNG-vehicles.
AUTHOR Alexander Pesch
CONTACT Peter Sonnabend
Box 16: CNG-Vehicles for parcel delivery used by DHL in Germany
Source :http://www.eltis.org/study_sheet.phtml?study_id=1629&lang1=en (20/10/2009)

64 Deliverable 1 - A worldwide overview on urban logistic interventions and data collection techniques
Cargohopper (Utrecht, Netherlands)
On the 22th of April (2009) Cargohopper was officially introduced by the Dutch Minister of Environment Mrs.
Jacqueline Cramer. Cargohopper is a vehicle that is able to tow 3 metric tonnes in a linear line by means of a 48 Volt
28 hp electric engine. Its max speed is 20 kilometres an hour but that is more than enough as it is only driving in the
inner city of Utrecht and does not make more mileage than 60 kilometres max daily. The three trailers are steered on
both axles which gives it a great manoeuvrability.
Driving on green power, Cargohopper is designed for the delivery of packages (not for pallets) and is able to do the
work of 5 to 8 regular (European sized) vans as there are Mercedes-Benz Sprinter and so on. It can do that because
Cargohopper is more than a nice looking little train, it is a complete logistic system. The three containers you see, are
in fact separate boxes that can be put on and off the undercarriages by means of a forklift. 8 of those boxes fit on a
European sized trailer of 13.60 meters. The boxes are preloaded outside the city in the Cargohoppers Distribution
Centre and towed to the boarder of the inner city by means of a regular truck. There we have a transhipment point
where the boxes are put on the Cargohopper and rolled into the pedestrian zone: from there the deliveries to the
shops start. That is very effective, Cargohopper never leaves its ‗natural habitat‘, and the reloading is done within 10
minutes. So it is almost always ready to roll.
Box 17: Cargohopper, Utrecht (The Netherlands)
Source: http://www.cargohopper.com/index.php

65 Deliverable 1 - A worldwide overview on urban logistic interventions and data collection techniques
6.3.3 EXAMPLES FROM ASIA
India
Old Vehicle Ban, Calcutta5
The state government of West Bengal in India ordered in 2005 all commercial vehicles manufactured
before 1990 off the roads of the Calcutta Metropolitan Area unless they convert to liquefied petroleum gas
(LPG) or compressed natural gas (CNG) by the end of the year. Transport department officials say more
than 50,000 vehicles—of which 30,000 are trucks and vans—will have to be taken off the roads after the
ban comes into effect.
Plan to ban two-stroke diesel carriers from city, Calcutta6
The environment department sought in 2008 to ban three-wheeler goods carriers that run on diesel,
which, according to the studies, emit the highest number of suspended particulate matter. And their
emission levels are even higher because of overloading, which are arguably the worst polluters among the
city's automobile population. Earlier, the environment department sought to completely ban petrol-driven
two-stroke auto-rickshaws in the Calcutta Metropolitan Area (KMA) from December 2008. But there was no
word on phasing out diesel-run three-wheeler goods vans then.
China
Less purchase tax on cleaner vehicles7
High emission cars and trucks are 28% of all the vehicles in China. However, they are responsible for 75%
of emission pollutants. Chinese government aims to gradually push the removal of about 18 mln high
emission vehicles from the roads after October 1, 2009. In January 2009, China halved the purchase tax on
smaller, cleaner cars with engine capacities below 1.6 litres to 5 percent until the end of this year. During
January-May 2009, sales of domestic passenger cars with engine capacities below 1.6 litres accounted for
nearly 70 percent of total sales, believed to be a result of the policy.
Green Truck Programme, Guangzhou8
SmartWay Green Truck Program is a World Bank pilot project in the city of Guangzhou near Hong Kong, an
area which in recent years has become one of China's most prosperous provinces, and a centre of
manufacturing and trade. The trucks will be equipped with SmartWay-verified technologies, including
advanced aerodynamics and improved tire systems. Training for the fleet operators to learn fuel-saving
5 West Bengal Bans Pre-1990 Commercial Vehicles from Calcutta, News from The Telegraph (17 May 2005). Available at: http://www.greencarcongress.com/2005/05/west_bengal_ban.html
and http://www.cleanairnet.org/caiasia/1412/article-60069.html 6 India Times. 2008. ―Plan to ban two-stroke diesel carriers from city (Calcutta)‘‘. Available at:
http://timesofindia.indiatimes.com/Kolkata_/Plan_to_ban_two-stroke_diesel_carriers_from_city_/articleshow/3782337.cms 7 China Daily. 2009. ―Higher polluting vehicles face higher taxes‖. Available at: http://www.chinadaily.com.cn/bizchina/2009-09/08/content_8665303.htm 8 Clean Air initiative Guangzhou pilot project Smartway Trucks. Available at: http://www.cleanairnet.org/caiasia/1412/article-73546.html

66 Deliverable 1 - A worldwide overview on urban logistic interventions and data collection techniques
driving techniques also will be provided as part of the pilot project. A report on the fuel savings and
emissions reduction capabilities of the applied technologies and driver strategies will be available at the
end of 2009.
Hong Kong, China
Grants for eco friendly commercial vehicles9
In order to improve air quality, since 1 April 2007, time limited one-off
rant incentive scheme to vehicle owners to replace their pre-Euro and
Euro I commercial vehicles by Euro IV type of vehicles. It is forecasted
that if all pre-Euro and Euro I vehicles are replaced with Euro VI models
significant improvements in roadside air quality would be realised,
more specifically:
Vehicle emissions of RSP and NOx will reduce by 74% and 38%
respectively;
Territory-wide emissions of RSP and NOx will reduce by 18% and 10%
respectively.
9 ELTIS (European Local Transport Information Service) ‗‘Grant incentive scheme to purchase eco-friendly commercial vehicles, Hong Kong, PR China‘‘. Available at:
http://www.eltis.org/study_sheet.phtml?study_id=1532&lang1=en

67 Deliverable 1 - A worldwide overview on urban logistic interventions and data collection techniques
7 POLICY PACKAGES
7.1 OVERVIEW
The TRKC Policy Brochure ―Urban Freight and Logistics‖ (Stantchev and Whiteing, 2006) makes the
following general comments about the importance of policy packaging:
―The adoption of best practice methods offers the most promising opportunities for urban logistics
operations to become both more efficient and more environmentally sustainable. Such best
practice methods include:
the use of more environmentally-friendly alternatives to current urban freight transport
practices through improved fuel efficiency and the use of alternative fuel vehicles;
the use of information and communication technologies (such as RFID and vehicle routing
software);
the possibility to improve deliveries to urban areas through the use of urban distribution
networks and consolidation depots.
Full benefits are unlikely to be achieved, however, when such proposals are put into practice in
isolation, it may well be more sensible to consider them as a wider package of measures. This
topic has therefore been explored in the light of the need for integrated solutions, which pull the
above-mentioned policy measures together and help eliminate the obstacles to achieving more
effective and sustainable urban freight transport and logistics practices. Roles and responsibilities
of the various actors and stakeholders have also been considered as an additional element of
analysis.‖
1
In general, it would appear that insufficient attention is currently paid to including urban freight
interventions in policy packages. Examples contrary to this observation are given in the next sections.
7.2 URBAN FREIGHT POLICIES IN LONDON
By Jacques Leonardi, University of Westminster
From SUGAR Newsletter, January 2009
http://sugarlogistics.eu/index.php?option=com_docman&task=cat_view&gid=50&Itemid=55
Transport initiatives impacting freight transport in London are:
• London Freight Plan;
• Loading/unloading code of practice;
• Construction consolidation centre;

68 Deliverable 1 - A worldwide overview on urban logistic interventions and data collection techniques
• London Congestion Charging Scheme;
• Low Emission Zone (LEZ);
• London Lorry Control Scheme;
• Freight Quality Partnerships;
• Waterborne transport schemes;
• Rail transport schemes;
• Freight Operator Recognition Scheme (FORS);
• Delivery and Servicing Plans (DSP);
• Construction Logistics Plans;
• Freight Information Portal.
FORS
Transport for London recognises and rewards good practice through the Freight Operator Recognition
Scheme.
London Freight Plan
The London Freight Plan will coordinate the role of freight in line with London's growth.
(www.tfl.gov.uk/microsites/freight/ ).
Freight Quality Partnerships
Transport for London supports a number of Freight Quality Partnerships (FQPs). These voluntary
partnerships offer a solid framework for people to work together to develop solutions for freight transport
issues. FQP members come from a wide variety of backgrounds and represent a range of interests. These
include:
• Freight industry - private sector suppliers and public sector utilities (both contracted out and in-house
fleets);
• Freight customers - public and private;
• Local authorities - councillors and borough officers;
• Lobbyists - cycling, environmental, local community groups, trade bodies.
Source: http://www.londonsfqps.co.uk
London Lorry Control Scheme
This scheme governs the movement of HGVs of more than 18 tonnes throughout London at night and
weekends. Restrictions are in place on the use of heavy goods vehicles to help minimise noise pollution in
residential areas during unsocial hours through restricted use of these roads.
Loading and unloading rules
Yellow lines on the street allow a parking duration varying for each borough for vans and lorries in London.
There is mostly an unlimited time for loading and unloading in the morning from 6:30 to 11:00, then a

69 Deliverable 1 - A worldwide overview on urban logistic interventions and data collection techniques
limitation of 20 to 40 minutes applies. On major roads, the red routes system applies, with no stopping
(double red: at any time; single red: at certain time). Dedicated loading bays are set by boroughs. Fines
were increasing in recent years, from £80 to £100 penalty for drivers in case of unloading at wrong places
or times. There is a strict enforcement of the unloading rules in London.
Electric commercial vehicles
Electric commercial vehicles are already available - there are two British manufacturers of electric vans
and HGVs with a range of models on the market. More than 500 of these vehicles have been produced in
recent years with many other older vehicles still operating. The Mayor wants to work with fleet users and
companies to expand the use of electric vehicles in business fleets. Over 200,000 commercial vehicles
operate in central London representing a massive market for conversion. The Mayor has committed to
deliver 25,000 charge points across the Capital by 2015.
(www.london.gov.uk/electricvehicles/commercial)
Figure 18: Electric commercial vehicle in London
7.3 PARIS, FRANCE
(Adapted from presentation made by Herve Levifve, City of Paris Transport Departement, at the World
Union of Wholesale Markets (WUWM) Conference, 23-25 September, 2009)
http://www.rungisinternational.com/documents/en/entretiens2009/session2/3.Levifve_EN.pdf

70 Deliverable 1 - A worldwide overview on urban logistic interventions and data collection techniques
The City of Paris new freight programme has the following elements:
Reviewing and adapting municipal regulations affecting traffic, delivery and pickup;
Improving use of delivery bays;
Accommodating logistical requirements in city planning documents.
Reviewing and adapting municipal regulations affecting traffic, delivery and pickup The previous situation was outdated, with highly complex, poorly enforced regulations, and a lack of
regional level harmonisation of local regulations (see Error! Reference source not found.). The challenge
as to create simplifying legislation for better understanding and better enforcement.
Figure 19: Old signs in Paris
Actions taken by 01/01/2007 involved:
Only vehicles under 29 sq. metres allowed between 07:00 and 22:00 (day);
Only vehicles under 43 sq. metres allowed between 22:00 and 07:00 (night);
Only clean vehicles between 17:00 and 22:00 (pollution peak period).
Subsequent actions include:
Scrapping derogations concerning oversize vehicles (lorries carrying cars, etc);

71 Deliverable 1 - A worldwide overview on urban logistic interventions and data collection techniques
Regulating night deliveries according to noise impacts;
Enhancing air quality indicators in legislation.
Improving use of delivery bays
1. Better delivery bay positioning in street system (June 2005). Adapting delivery bay positioning to local
logistical requirements;
2. Quicker rotations on delivery bays (January 2007). Bay use limited to 30 minutes per delivery;
3. Access to bays limited to professional users (vans and lorries) (January 2007). Restricted bay use will
be enforced experimentally along the bus lanes for 3 years before extension to the general street
system.
Figure 20: Delivery in Paris
Accommodating logistical requirements in city planning documents
1. Paris land-use plan (Plan local d’urbanisme) (June 2006) had the following elements relevant to
urban logistics:
Identifying areas for logistical uses in city masterplan. All areas accessible by road, rail or
waterway (shown in orange in Figure 21);
Private delivery facilities required for major freight generators (stores above 500 sq.metres,
offices above 2500 sq.metres, hotels above 150 rooms).

72 Deliverable 1 - A worldwide overview on urban logistic interventions and data collection techniques
Figure 21: Zoning system in Paris
2. Paris mobility plan (Plan de déplacements de Paris). Goods transport fully integrated into city
mobility plan (see Figure 22).

73 Deliverable 1 - A worldwide overview on urban logistic interventions and data collection techniques
Figure 22: Logistic plan for Paris
Further specific initiatives
PETITE REINE: final delivery by electric cycle project (May 2003), as described in Chapter 4;
CHRONOPOST: express freight clean delivery project (June 2005) (see Figure 23);
MONOPRIX supermarket clean delivery project (November 2007);
Current research project: Using subway and tramway infrastructure for goods transport to high
commercial density districts in Paris (see Figure 24).

74 Deliverable 1 - A worldwide overview on urban logistic interventions and data collection techniques
Figure 23: Chronopost vehicle in Paris
Figure 24: RER train in Paris

75 Deliverable 1 - A worldwide overview on urban logistic interventions and data collection techniques
7.4 SÃO PAULO, BRAZIL
São Paulo is the largest city of Brazil and is the one that has implemented most restrictions on movement
and operation of cargo vehicles. The central area of São Paulo is shown in Figure 25. Starting in 2007,
Decree No. 48338/2007, which established standards for the number of trucks in specific areas, as well as
for the operation of loading and unloading of large establishments, the policies implemented in the city
include:
Routes with restrictions to truck traffic: Vias Estruturais Restritas (VER). These routes, marked
blue in Figure 25 and comprising roads such as highways or artery roads, tunnels, viaducts and bridges,
have truck traffic restrictions at times determined by local regulations.
Zones with restricted hours for truck traffic:
o Zona de Máxima Restrição de Circulação (ZMRC). This zone, coloured yellow in Figure 25:
São Paulo ZMRC (Zone of Maximum Restriction of Circulation) and with an area of
24.5 square kilometers, comprises the part of the city with the main commercial centers and
services. In the ZMRC, time-based restrictions are set on trucks Monday to Friday from 05:00 to
21:00, and Saturday from 10:00 to 14:00;
o Special Zone of Restricted Circulation (ZERCA). This zone comprises roads or stretches of
road that are predominantly residential, with a need to restrict truck traffic in order to ensure
the safety and traffic flow.
Night Delivery Stimulus. It is estimated that the overnight delivery of goods, despite increasing the
labor costs, may increase productivity by 50% per vehicle, thus allowing a reduction on the final price
of shipping. The benefits for logistics operators are:
o the route without bottlenecks;
o freedom of movement and parking;
o better performance for higher speed and lower fleet utilization.
Operators that have already adopted overnight deliveries have seen advantages such as the increase
productivity and better working conditions for the driver. However, they have also seen interference
in some operations such as transport of e-commerce and express shipments.

76
Deliverable 1 - A worldwide overview on urban logistic interventions and data collection techniques
Figure 25: São Paulo ZMRC (Zone of Maximum Restriction of Circulation)

77 Deliverable 1 - A worldwide overview on urban logistic interventions and data collection techniques
Urban Vehicle Load – VUC Figure 26 illustrates the
classification of different truck loads. According to this
classification, the VUC is the smallest truck, which is
most suitable for urban areas. The VUC are released
from the restrictions imposed by ZMRC and ZERCA (see
above) but are forbidden in structural restricted routes.
Number Plates: In 2009, the city of São Paulo amended
the legislation by setting up a scheme for the rotation
of trucks based upon their number plates. The main
objective was to transfer truck traffic to the night and
early morning. The rotation system determines which
trucks will be restricted in movement within the zone
enclosed by the Vias do Mini Anel Viário (the black ring
in Figure 25) except on the day indicated in Figure 26
and Table 3.
Figure 26: Classification of truck loads (São Paulo)
Table 3: Days on which different number plates are permitted (São Paulo)
Day of the week
Monday Tuesday Wednesday Thursday Friday
Final digit on number plate
1 and 2 3 and 4 5 and 6 7 and 8 9 and 0
The restriction does not apply to some types of trucks such as the fire department, perishable foodstuffs,
essential public services, postal and garbage collection.
Motofrete Regulation
Motofrete is the service delivery and collection of small loads by motorcycles through the city of São
Paulo. Currently, motorcycles account for about 10% of vehicles operating in the city. The municipality of
São Paulo has been taking steps to ensure higher levels of safety for motorcyclists and motofretistas. In
addition it has created a dedicated motorcycle lane for bikes on Sumaré Avenue (see Figure 27), which
may be extended to other roads.

78 Deliverable 1 - A worldwide overview on urban logistic interventions and data collection techniques
Figure 27: Freight motorcyclist and motorcycle lane (São Paulo)
Source: www.rfmundialexpress.com.br/moto_frete.html
oglobo.globo.com/.../21/21_MVG_sp_corredor23.jpg
7.5 MASDAR CITY, ABU DHABI, UNITED ARAB EMIRATES
Masdar City10 will be world‘s first carbon neutral, zero-waste to landfill, car-free city powered entirely by
alternative energy sources. This city (currently in its first phase of construction) will be built on more
than six square kilometres and will grow eventually to 1,500 businesses, 40,000 residents and 50,000
commuters.
Masdar will consider developing a logistic centre at the edge of Masdar City that will act as the receiving
centre for inbound and outbound goods, and distribute these to residents via energy-efficient means. One
of these means will be the Freight Rapid Transit system (FRT).
There will be no fossil fuel cars within Masdar City. The city will be a pedestrian-friendly environment. A
dedicated guide way in the undercroft, an artificial basement created by raising the pedestrian level, will
accommodate the FRT and the Personal Rapid Transit system (PRT), which people can use for longer
journeys.
10 For more information on the Masdar city: see www.masdarcity.com

79 Deliverable 1 - A worldwide overview on urban logistic interventions and data collection techniques
The FRT system is capable of making 5,000 trips per day carrying the loads and deliveries for residents,
stores and hotels. The flatbed vehicles can carry two pallets, with a maximum total payload of 1,600kg.
Figure 28: 2getthere vehicle
Source: http://www.2getthere.eu (vehicle model of the Personal Rapid Transit system)
The FRT will be entirely powered by renewable energy. The vehicle will be equipped with Lithium-
Phosphate batteries, allowing a range of approximately 60 kilometers on a 1.5 hour charge. The vehicle
will be recharged at specific freight stations, avoiding the necessity of additional parking space. The
stations feature angled berths, allowing all vehicles independent entry and exit.
2getthere was selected as the supplier for the first phase of Masdar City, providing the link to the Masdar
Institute of Science and Technology (MIST) by means of 8 PRT, 2 VIP (leather interior) and 3 FRT vehicles.
In this phase the network will be approximately 1.2 kilometers long and feature 5 stations (2 for
passengers, 3 for freight).

80 Deliverable 1 - A worldwide overview on urban logistic interventions and data collection techniques
8 DATA COLLECTION
8.1 OVERVIEW
This chapter presents a discussion of generic issues concerned with urban freight data collection (in 8.2),
taken from the Green Logistics project (Allen and Brown, 2008), which is followed by:
Methodologies and approaches in freight data collection (8.3)
Urban freight transport indicators (8.4)
A European country summary of urban freight data collection (8.5)
An overview of data collection in Asia (8.6)
An overview of data collection in North America (8.7)
An overview of data collection in Australia and New Zealand (8.8)
An overview of data collection in Africa (8.9)
It will be seen that much use is made in the early sections of the chapter of the BESTUFS Deliverable 3.1
―Urban freight data collection - synthesis report‖ (BESTUFS, 2006). This deliverable is highly
comprehensive, including large amount of detail with respect to current practice in Europe (and
elsewhere) on data collection for urban freight.
8.2 URBAN FREIGHT DATA COLLECTION EFFORTS
From ―Review of Survey Techniques Used in Urban Freight Studies‖ (Allen and Browne, 2008)
Many urban policy makers are reliant on vehicle traffic counts to form opinions and determine policy
approaches for urban freight transport on a day-to-day basis. This provides little insight into factors
including:
the goods and service flows that such vehicle activity supports;
the specific purpose of these vehicle trips;
the establishments that are generating the demand for these trips and their goods and service
requirements;
the supply chain decisions that results in these trips happening in these vehicles, at these times
and days;
the routes taken by these vehicles;
the types of trip patterns performed (e.g. multi-drop as opposed to single drop);
details about the loading, unloading and parking activities associated with these trips.
81 Deliverable 1 - A worldwide overview on urban logistic interventions and data collection techniques
Urban freight transport is made up of numerous activities and parties, resulting in a complex subject area
to study in order to obtain an understanding of such issues.
One of the major complications of studying freight as opposed to passenger transport is that it comprises
both i) goods and services that are produced and consumed in an urban system and ii) transport vehicle
activity that supports the flow of these goods and services. In a small number of cases, goods and services
will travel on the same vehicle from the point of production to the point of consumption but usually goods
and services are associated with several different vehicle trips, and vice versa, goods vehicles are used to
carry a wide range of different goods and service. Although much urban freight transport research is
focused on vehicle activity (as it is vehicles that cause traffic and environmental impacts), it is important
to bear in mind that the demand for urban freight transport activity is derived from the demand for goods
and service flows.
In many urban freight transport studies that attempt to go beyond vehicle traffic counts, the focus is
limited to goods vehicle activity (and sometimes this is further limited to either just core goods delivery
trips, or core goods delivery and collection trips, ignoring ancillary goods delivery trips, goods transfers
between establishments, money delivery and collection trips, waste collection trips and other collection
trips for reverse goods flows). However, urban freight transport also includes vehicle trips made in order
to carry out a wide range of servicing tasks (concerned with issues such as public utilities,
telecommunications, cleaning services, equipment maintenance, and electrical and plumbing services).
These service tasks are carried out in a range of vehicle types from motorcycles and cars to light and
heavy goods vehicles. Relatively few urban freight studies have concerned themselves with the study of
these service activities and the associated vehicle activity.
National surveys of freight transport operations are conducted in many countries (such as the Continuing
Survey of Road Goods Transport in Britain, and commodity flow studies in the USA). Although these
surveys do collect data about urban freight activities in the urban area they are usually not very useful for
gaining a better understanding of freight transport in particular urban areas for several reasons: i) the
sample size in any particular urban area is likely to be small, ii) it is often difficult to disaggregate the
data from the overall dataset, and iii) the type of data collected in these surveys does not provide the
detailed information often required for urban freight analysis. Therefore, specific data collection
exercises are usually required to gain the necessary insight into urban freight transport.
In terms of the availability of previous urban freight data efforts, it is worth noting that despite the fact
that relatively little such data has been collected (in relation to personal travel and traffic data in
general), this data is normally not publicly available for use in other studies. This is due to the fact that
the data is not archived in a single location, and ownership and confidentiality issues surrounding the data
are often complex. The majority of the urban freight transport data collection efforts that have taken

82 Deliverable 1 - A worldwide overview on urban logistic interventions and data collection techniques
place have been funded by the public sector (including local, regional and national government
departments, research bodies and other public sector agencies). However these bodies often commission
the work from consultants and/or academics and do not usually retain the data at the end of the study.
The only output that is often available from such work is usually a report or paper which only provides
summary statistics and results. In some cases, especially for older studies even such reports are difficult
to locate and in some cases copies no longer seem to exist.
As Ogden (1992) has noted it is not possible to make definitive comments about the data needs when
studying urban freight transport. These will vary depending on the issue/s concerned, the planning and
policy framework in which the issue arises, established practice in data collection, and the availability of
previously collected data.
8.3 METHODOLOGIES AND APPROACHES IN FREIGHT DATA COLLECTION
From ―Urban freight data collection - synthesis report‖ (BESTUFS, 2006).
The information provided by freight data experts [to BESTUFS] has indicated the breadth of different
techniques that are currently being used to collect urban freight data. These techniques include:
Interviews with freight transport company manager;
Interviews with receivers;
Interviews with shippers;
Roadside interviews with drivers;
Group discussions (including discussions with drivers, representatives from a single supply chain,
representatives from different supply chains);
Questionnaires sent to freight transport company managers/drivers;
Questionnaires sent to receivers;
Questionnaires sent to shippers;
Accompanied trips with goods vehicle drivers;
Parking and loading activity surveys (i.e. observation surveys);
Parking and loading infrastructure/inventory surveys;
Traffic counts (manual and automatic);
Data collection using new technology including:
Use of satellite tracking data containing goods vehicle activity;
Use of roadside camera data (including automated number plate recognition (ANPR) data);
Use of weigh-in-motion (WIM) technology to measure axle weight of a moving vehicle;

83 Deliverable 1 - A worldwide overview on urban logistic interventions and data collection techniques
Obviously the technique used to collect data will be influenced by the type of data that is being collected
and the use to which it is being put (for instance data used to provide a quick snap-shot of an existing
situation is likely to be collected using a different methodology and sampling approach to data used as an
input to a freight model).
Both face-to-face, postal and electronic questionnaires have been carried out. Interviews have been
conducted face-to-face and by telephone. In the case of detailed interviews, these are often carried out
face-to-face because the topics and questions can be both lengthy and complicated.
Large-scale national freight surveys in the European countries surveyed tend to make use of postal
questionnaires. These surveys usually have high response rates due to the fact that they are often
statutory surveys. In addition, these surveys usually have a well developed and refined methodology and
sampling approach – this is a reflection of the time over which the survey has been taking place and the
resources available to carry it out.
Interviews and group discussion techniques tend to be more widely used in one-off or occasional data
collection exercises that take place in a specific urban area. This is due to the cost of these approaches in
a national survey. Data collection exercises in a specific urban area tend to also make use of all the other
techniques listed above.
As a result of budgetary and time constraints, sample sizes for one-off data collection exercises in specific
towns and cities are often small and not statistically representative. This makes the comparison of data
over time and between different urban areas very difficult.
New technology offers the possibility to collect significant quantities of urban freight data at relatively
low cost (compared with previous techniques). However consideration of such techniques to collect urban
freight data raises many questions about: (i) its legality (for instance the use of roadside cameras to
record vehicle details is not currently allowed in Germany), (ii) the need to supplement this data with
other data as these new technologies do not necessarily provide all the data that would have been
collected in a traditional survey, and (iii) the co-operation and agreement needed between the public and
private sector to share this data.
8.4 URBAN FREIGHT TRANSPORT INDICATORS
From ―Urban freight data collection - synthesis report‖ (BESTUFS, 2006).

84 Deliverable 1 - A worldwide overview on urban logistic interventions and data collection techniques
Respondents [to the BESTUFS survey] were asked to provide details of indicators used by governments or
researchers to measure the performance of urban freight transport in their countries. They were also
asked to include details of any urban freight transport indicators that they thought would be useful even
if they were not aware of the indicator being used currently.
The responses suggest that there are few indicators that are currently in use by national, regional or local
governments in the surveyed countries to monitor the performance of urban freight transport. The most
commonly used indicators are related to road freight and include: goods vehicle trips, and goods vehicle
kilometres (usually based on traffic count data). However, even these indicators are not available in many
European urban areas.
Other indicators that are commonly used by governments to measure and monitor freight transport at a
national level include: tonnes lifted (by road and other modes), and tonnes moved (i.e. tonne-kilometres
by road and other modes). However these indicators are often not available at an urban scale.
Other national freight transport indicators used by governments in one or more European countries
include:
Freight Intensity (of heavy goods vehicles - tonne-kilometres / GDP);
Lorry traffic intensity (of heavy goods vehicles - vehicle kilometres / GDP);
Energy intensity (Fuel consumed per tonne-kilometre);
Average length of haul;
Loading factor;
Empty running.
None of the indicators listed above has been calculated for urban freight transport (with the exception of
average length of haul, lading factor and empty running in London, produced from data disaggregated
from the national survey). This is due to the data requirements of doing so, and a lack of consideration of
freight indicators at the urban scale by all tiers of government.
8.5 COUNTRY SUMMARY OF URBAN FREIGHT DATA COLLECTION IN EUROPE
From ―Urban freight data collection - synthesis report‖ (BESTUFS, 2006).

85 Deliverable 1 - A worldwide overview on urban logistic interventions and data collection techniques
Belgium
Most freight data collections in Belgium are executed at regional or national scale. Most freight data
collections are rather general and don‘t treat specific urban issues. The most important reasons why
there is a lack of data collection efforts for urban freight data are:
• Little interest;
• Too expensive;
• Poor (limited) experience of authorities.
Urban data can potentially be extracted from national datasets but this can be difficult depending on the
type of data. The interest in urban freight transport is recently growing, but probably urban freight will
continue to be treated as a matter of minor importance. Specific urban freight related data collections
have taken place in Ghent, Brussels and Liege.
France
The various kinds of Urban Goods Movement (UGM) data collected in France are:
• Large occasional surveys specific to UGM and national surveys to the total supply chains;
• Small ―one shot‖ surveys carried out by local authorities on the occasion of local experiments;
• Counts of heavy vehicles (―cordon‖ surveys are more and more seldom);
• Continuous and period surveys carried out nationally, but not specialised in the urban area;
• Private data almost in the trade field;
• A periodic light vehicle (LGV) and continuous HGV surveys are carried out, but not specifically
for UGM;
• Census and register data (such as economic, fleet and land use data used in modelling).
The main work on data collection in France focussing solely on urban freight took place twelve years ago.
These involved occasional specific surveys carried out by the transport ministry in three specific cities
(Bordeaux, Dijon and Marseilles). These have usually been conducted on a one-off basis using a similar
methodology (establishment and driver surveys) in order to improve the knowledge on this field
practically unknown before the 1990‘s and also to feed a model. It was a significant contribution to the
quantitative review of urban freight knowledge and assisted in making urban planning decision. It was
thus possible to build a model and software used by more than twenty cities in their master plans. In
addition, there have been a few one-off surveys of freight transport operations at an urban level as part
of research projects and local developments. However, a lot of cities don't feel still very much involved in
the urban goods movement best practices. The specific urban goods transport surveys are expensive and
difficult to bring into play. In the last five years, only small local surveys were carried out, and, because
of lack of funds, the global urban freight data collections are not yet foreseen. Several surveys are
nevertheless planned for the two next years:

86 Deliverable 1 - A worldwide overview on urban logistic interventions and data collection techniques
• on the occasion of a study on the flows generated by the craftsman activity, a survey will
provide invaluable results;
• a study will prepare shortly the schedule of a foreseen large specific survey (what
administration mode, what scope of the survey, etc). A pilot survey will be carried out in order to
test its feasibility, in order to update the results of the large UGM specific surveys.
Studies carried out as part of the implementation of Freight Platforms and Mobility Master Plans can also
be important sources of urban freight transport. National freight data is collected but is of little use at
the urban scale since only trips of more than 50 km are included.
Germany
The majority of freight transport and traffic data is related to and reported at a national scale. Regional
transport aspects are less taken in consideration. It does not distinguish between urban and non-urban
freight respectively commercial transport, because it does not recognize geographical references.
However, it is possible to disaggregate some urban freight data from these sources as useful input-figures
for modelling urban transport. Freight transport on waterways and air does not rate in planning of urban
goods transport. There is insufficient availability of official data about the inbound-infrastructure of the
airports, of the transportation supply and demand on inland waterways, of air goods traffic, of energy
consumption, and at the transportation prices of all carriers. The only data collection work in Germany
that focuses solely on urban freight is the responsibility of towns or regions. There is no centralised
governmental co-ordination, but federal financial promotion of researching activities assisting in making
an urban planning decision for goods transport and commercial traffic in towns and overcrowded
agglomeration areas. These studies have usually been conducted on a one-off basis as part of a review of
urban freight strategy. Most of these urban freight data collection exercises took place during the 1990s.
Locations in which such collection took place include: Frankfurt am Main, München, Stuttgart, Darmstadt,
Dusseldorf, Bielefeld, Köln, Dortmund, Bonn, Bremen, Braunschweig/Salzgitter and Hannover. Overall,
the availability of urban freight data is unsatisfactory. Quantity and quality of available urban freight are
not covering the data requirements of individual planning and modelling strategies. The best data (urban
and elsewhere) is held by private companies and is not made generally available by them. There are no
plans for expansion in urban freight data collection in Germany, at a national governmental level. The
official statistics are seen as providing data supply which covers the most significant requirements. The
existing data deficits are known and will be eliminated if this can be done without major cost
implications.
Hungary
There has been little urban freight transport data collection in Hungary. The only freight transport survey
in Hungary took place in the first half of the 1980s.This involved a sample of approximately 3500
companies/units that were surveyed about their monthly/yearly in-and outbound good flows by

87 Deliverable 1 - A worldwide overview on urban logistic interventions and data collection techniques
goods/commodity categories and transport modes. The data was used in a national freight flow model
which was developed on a mainframe computer. There have been no specific freight transport surveys in
urban areas in Hungary yet. Only goods vehicles origin-destination surveys have taken place to date. The
last such OD survey took place in Budapest in 1994. The national government has no responsibility for
UGM data collection, and seems to have no intention to encourage urban freight data collection at
present. Municipal authorities would be responsible for urban freight data collection but are not currently
doing so. There is little reason to think that urban freight data collection will improve in Hungary in the
next five years.
Italy
Italy Studies and analyses of freight transport in urban areas in Italy are not currently very well
developed. Only a few studies at the urban level have taken place in recent years and there is no
coordination among the different administrations or groups involved in these studies. This is probably due
to the lack of an institutional body in charge of studying, co-ordinating studies on these phenomena and
summarizing data collected at local level. Cities in which urban freight studies have taken place include:
Rome, Milan, and cities in the Emilia Romagna region. Moreover, data collected from different public or
private administrations, such as ISTAT or Ministry of Infrastructure and Transport, that could be used in
studies and analyses of local phenomena, are not always useful to this aim because of the very big scale
used (e.g. OD matrix at province level and not at local level) or because considering some aspects of
phenomena (e.g. in ISTAT study on transport of freight no vehicles with a load under 3,5 t are surveyed),
only. Data availability at local level is often linked to the enforcement of regulatory tools, as in case of
PGTU (General Plan of Transport), and information are limited to basic data, mainly traffic counts.
Unfortunately, ―shedding light ―on private cars sometimes meant ―casting shadows‖ on urban freight
data; indeed commercial vehicles were usually tackled as a part of the overall amount of traffic, paying
no attention to the mobility patterns typical of this mode. However, thanks to pilot studies and recent
implementations, the knowledge on such phenomena is improved in recent years and will improve in
future.
Netherlands
The national statistical agency CBS, as well as other producers of information in this area produce a very
limited amount of information about urban freight transport. Urban authorities have a certain interest in
urban freight transport, because of a mixture of legal requirements, economic policy,
infrastructure/traffic management, environmental policy and accident management. However, the data
that is currently being collected may not be as complete as is needed to base such policies on. Most urban
authorities in the Netherlands do not tend to carry out surveys of goods vehicle operations. They stick to
infrastructure policies instead of developing a proper accessibility policy for both passenger and freight
transport. One of the reasons for this lack of interest is that the subject is not given enough priority by

88 Deliverable 1 - A worldwide overview on urban logistic interventions and data collection techniques
politics. This is rather logical, given the fact that local government is in a process of restructuring and
rethinking its tasks and obligations towards society. In addition, there have been a few one-off surveys of
freight transport operations at an urban level as part of research projects and local developments. The
most important development has been the Connekt MG-11 project started in 2002 which aims to optimize
a previously developed method of collecting data about urban freight transport, leading to ―delivery
profiles‖ for specific shopping areas in Amsterdam, Rotterdam and Utrecht. One cannot really speak of an
improvement of urban freight data collection in the Netherlands over the past few years, especially not
after the closure of the Platform on City Logistics (PSD). There are no plans for expansion in urban freight
data collection in the Netherlands at a national level at present.
Portugal
Relatively little has been done concerning data collection about urban freight in Portugal in the last
decade. Although there is more statistical information available now on traffic and transport, there is still
little information accessible related specifically to urban freight. The information that is currently
collected is still the statistical information on general goods transport, like statistics about the amounts
of goods moved by each mode of transport, etc. Some public institutions have been collecting freight data
at the national level for some years. The collection of freight data at regional level is more recent and
consequently it hasn‘t yet been reviewed in most of the cases. From these regional studies, it is possible
to extract information at urban level. At the local level, the capital of Portugal (Lisbon) is collecting data
in order to solve specific problems related to urban goods distribution. There are also some municipalities
like Porto, Evora and Lagos that have collected freight data in order to achieve some specific solutions
(occasional collection). However, But these are one-off projects and data collection exercises with
information not likely to be revised in the future. Other important sources of urban freight data include
the studies that support the implementation of Freight Platforms and the Master Plans of Mobility.
Spain
Urban freight distribution is not considered a relevant issue by the Spanish local authorities. Even though
all the medium and large cities have some kind of traffic plan, traffic counts or models, goods vehicles
are only included in them as part of the general traffic flow, without any insight on the kind of vehicle,
the goods delivered or the routes followed. While passenger traffic models are built based on data
provided by surveys, shippers and carriers are extremely reluctant to provide any information on their
logistic aspects, their route plans or their delivery practices. Lacking this complex information, local
authorities are only able to address urban freight issues in a ―short-sighted‖ way, providing load zones
when requested by receivers or discussing accessibility permits with carriers associations, but without
having a general knowledge about freight movement in the urban area. The studies addressing urban
freight in Spanish cities are normally incomplete and seldom updated and, with the exception of
Barcelona, few cities are engaged in obtaining detailed urban freight information. Limited data collection

89 Deliverable 1 - A worldwide overview on urban logistic interventions and data collection techniques
has been carried out in Vigo (survey about double parking), Malaga (survey about deliveries to the city
centre as feasibility for an urban distribution centre) and Granada (assessment of the delivery pattern in
its central area to determine of loading zones was sufficient) and Seville. Coruña is working on an
initiative for collecting urban freight data. The industry does not consider urban freight distribution as a
specific sub-sector. There are no lists of the companies whose business falls directly into urban deliveries.
Nationwide carriers are not able to distinguish the fraction of their overall costs which corresponds to
urban deliveries. National freight data is collected but is of little assistance at the urban scale since this
data may correspond to ―through‖ traffic. There is data available for heavy vehicles at a national level,
but these are not allowed to enter cities.
Sweden
The national government is responsible for collecting urban freight data in Sweden. In addition, some
one-off surveys are carried out by urban authorities. The most important urban freight data collection
exercises in the country is Nätra - a sample investigation focused on a stratified sample of the 175,000
workplaces in Stockholm County was carried out in 1998. For each workplace selected, information was
obtained regarding all movements by the selected vehicle (heavy lorry, light lorry or car) during one day.
A commodity flow survey (shipment based, not vehicle based) was carried out in 2001 This survey
provided data on the movement of goods in Sweden with Swedish and foreign recipients/consignors. It
provided information on type of commodities shipped, their value, weight, and mode of transportation, as
well as the origin and destination of shipments. A new shipment based survey will be carried out in the
next five years. No new vehicle-based freight data collection has been carried out since 1998.
Switzerland
The main organisations collecting freight data in Switzerland are:
• Federal Office for Statistics (Bundesamt für Statistik BFS);
• Federal Office for Spatial Planning (Bundesamt für Raumentwicklung ARE);
• Municipal Authorities for regional and urban data collection.
Most of the relevant data is collected as part of national surveys. One-off urban freight data collection
exercises have taken place in Basel, Berne, Lausanne and Zurich. These urban data collection exercises
included surveys and traffic counts. In the last five years, data from traffic counts have improved in
Switzerland. However, routeing data from goods vehicles operators has worsened over this time period.
United Kingdom
The UK Department for Transport (DfT) coordinates several on-going surveys of freight data in the UK.
However, these surveys take place at a national rather than a specifically urban level. But some urban
freight data can be disaggregated from these national surveys. The most relevant DfT freight data
publications (such as the Continuing Survey of Road Goods Transport, and the Company Van Survey) are

90 Deliverable 1 - A worldwide overview on urban logistic interventions and data collection techniques
published on an annual basis. However, data collection takes place all year round. Another important
source of urban freight data are road traffic counts carried out by the Statistics Traffic division in the DfT
and in local authorities. Most urban authorities in the UK do not tend to carry out surveys of goods vehicle
operations. Transport for London has been making efforts to compile data about freight transport in
London. However TfL does not collect all the data itself. Some is extracted and provided from national
surveys by DfT. In addition, there have been a few one-off surveys of freight transport operations at an
urban level as part of research projects and local developments. These have taken place in Reading,
Newton Abbot, Ealing and Bexleyheath high streets (both in London), Norwich, Winchester, Colchester,
Birmingham and Basingstoke. Overall, urban freight data collection has improved in the UK over the last
five years at both the national and urban level. There are no plans for expansion in urban freight data
collection in the UK at a national level at present.
8.6 DATA COLLECTION IN ASIA
8.6.1 OVERVIEW OF URBAN FREIGHT DATA COLLECTION IN ASIA
Data collection in Asia usually takes place on a national basis, generally by the national bureau of
statistics. Some institutions, such as the World Bank and the Asian Development Bank (ADB) gather data
from different Asian countries using these national statistics. For example, the ADB produces an annual
statistical data book called ―Key Indicators for Asia and the Pacific‖. It presents the latest available
economic, financial, social and environmental indicators for regional members of ADB, with the support of
the national central banks, bureau of statistics and ministries (for example: ministries of transport,
national planning and/or economic development).
However, these freight data are mainly on a national level and not on an urban or regional level. Several
medium and large cities have some kind of general traffic plan or traffic counts. Nevertheless, the
quantity and coverage of data focusing specifically on urban freight distribution is either not available or
to a smaller extent than freight data at a national level. This is due to the fact that urban freight
distribution is not given a high priority when it comes to obtaining detailed freight information.
Also more priority is given to urban passenger transport data collection than urban freight transportation.
Contrary to the studies about passenger transport, the relationships between urban goods movement and
land use are not considered as a major topic. Local authorities in most Asian countries focus traditionally
on passenger transport data collection rather than freight data.
Another reason for the limited amount of urban freight information is the lack of sufficient financial
resources for the continuous collection of urban freight data. This is for example the case in India. Urban
transport systems in most Indian cities suffer from major constraints as insufficient financial resources,

91 Deliverable 1 - A worldwide overview on urban logistic interventions and data collection techniques
inefficient regulatory frameworks, poor allocation of road space, inadequate traffic management systems
and institutional weaknesses11. Also much of the urban freight data is held by private companies and
generally are not made public.
8.6.2 SPECIFIC URBAN FREIGHT DATA COLLECTED
The quantity and coverage of the available urban freight data in most Asian cities is very limited and/or
outdated. However, there are a few regional freight distribution surveys available in countries, like
Japan, Thailand and Indonesia.
The data on freight movements in these specific countries have been collected through surveys12, Global
Positioning Systems (GPS) and even through video image data obtained for example from surveillance
cameras. Public-private-partnerships (PPP) were also used to gather private company information that is
normally difficult to access. PPP can play a significant role in the acceptability of cooperative
organization.
Several universities and other research institutions and companies use this information in their specific
models. Some of the results of these models are presented in the International Conference of City
Logistics that takes place once every two years. A few examples of Asian freight data collection exercises
presented during this conference have concerned Japan, Thailand and Indonesia, as now presented.
Japan
For the study on company efforts to address logistics-related environmental issues, a mail survey was
carried out. The questionnaires were sent to a total of 2,310 manufacturers, wholesalers and retailers
listed on the Tokyo Stock Exchange. The average rate of response was 7.5%. To supplement this data,
follow-up interviews were also conducted.
To determine the efforts of Japanese companies to make distribution and transportation efficient through
horizontal and vertical cooperation, a survey was sent to different shippers and carriers. The survey was
conducted by the Kanto Bureau of Economy, Trade and Industry. The survey consisted of mail inquiries
and interviews. The list consisted of companies which were already cooperating with others, as well as
companies that were planning to begin such cooperation. 222 questionnaires were returned, for a
response rate of 43%.
11 Source: Urban Mobility India (http://urbanmobilityindia.org) 12 Through depth-interviews and questionnaires filled in via internet or hard copies.

92 Deliverable 1 - A worldwide overview on urban logistic interventions and data collection techniques
The Transport Planning Commission carries out a decennial urban freight survey (1972, 1982, 1994 and
2004) in the Tokyo Metropolitan Region called the Tokyo Metropolitan Region Freight Survey (TMFS). This
survey is mainly a mail survey. Interviews with large companies are also carried out. Error! Reference
ource not found. presents the framework of this large survey:
Figure 29: Framework for Tokyo Metropolitan Region Freight Survey
Source: Modelling Logistics Location Choice & Truck Route Choice Behaviour by Tokyo Metropolitan Region
Freight Survey, T. Hyodo.
The rate of response in 2004 was of 25%. The results of this survey are used in different studies. Two of
them are:
The study on modelling logistics location choice and truck route choice behaviour. For this study,
data from the TMFS was used. For the location choice, the results of the questions to
establishments were used. For the truck route choice, the results of the large truck route survey
(questionnaire to freight company drivers) were analysed;
The study on delivery distribution in the Tokyo Metropolitan Region (TMR). In this study the local
flow of goods in five different districts was analysed: Kawagoe, Machida, Yokosuka, Funabashi and
Chuo Ward (Ginza). The data was collected using part of the results of the TMFS and other
methods:
I. Actual state of deliveries
Street parking survey: count through observations of cars that have driven around the parked
delivery trucks (car type, parking location, parking conditions, parking start and finish time,
park with or without unloading and influence to traffic congestion);
Follow-up tracing survey on goods conveyance from/to the delivery vehicle through
observations (delivery vehicle type, parking location, parking start and finish time,
destination of goods conveyance, influence to pedestrian by goods conveyance and reason for
choosing parking location);

93 Deliverable 1 - A worldwide overview on urban logistic interventions and data collection techniques
Business survey: questionnaires and interviews of business establishments in the area
(business activity, characteristics of business location, presence of loading space, main
delivery hours and frequency, weight of goods, possibility of changing delivery time and
carrier, other comments);
II. Local traffic condition
Survey on the number of car traffic and pedestrians passing by;
III. State of transport infrastructure
Road space conditions using maps;
IV. Players on town development
Questionnaires and interviews with people in the delivery business;
Questionnaires and interviews with bus employers and drivers;
Questionnaires and interviews with people coming into town.
For the experiment on co-operative parcel pick-up system using the internet in the central business
district in Tokyo (Ohtemachi), a PPP (between government officials, carriers and shippers) was used to
ensure participation. The data was collected through questionnaires (shippers) and interviews (carriers).
In Japan it is also possible to collect data using the traffic information system of VICS (Vehicle Information
and Communication Systems). This system provides traffic information for instance on travel times,
congestion queue length, traffic accidents and parking. It covers about 70% of trunk roads in urban areas.
Data collection can also be performed using Probe vehicles (Kyoto University). Probe vehicle data
complements the lack of data on the VICS network. This system can provide real-time and historical
vehicle data. The following figure presents how this system works:

94 Deliverable 1 - A worldwide overview on urban logistic interventions and data collection techniques
Figure 30: Use of probe vehicles for collecting data
Source: Data collection for modelling, evaluating and benchmarking city logistics schemes, E. Tanaguchi.
Intensive development of urban models and surveys has been carried out over the past few years in
Japan. This country might be the best examples with regard to research on urban distribution in Asia. In
the densely populated areas, the problems caused by demand exceeding supply are leading to traffic
infrastructure congestion (given the prevailing urban spatial scarcity in Japan) and increasing
environmental concern. The importance of these stakes has directed research and initiatives towards the
development of modelling tools in order to assess measures suitable for solving these problems.
In Japan, the promotion of new data and real-time information-processing technologies in order to feed
probabilistic vehicle routing and scheduling and dynamic traffic simulation models is considered as being
very promising. A large number of information systems are considered: Advanced Traffic Information
Service (ATIS), Super Smart Vehicle System (SSVS), Advanced Traffic Management Systems (ATMS) and
Advanced Vehicle Control System (AVCS). They are described as communication and information systems
linked to automatic control process using embedded data processing. The objective is to improve
transport efficiency by optimizing total loading, shortening the loading/unloading duration and increasing
the safety of freight transport chains. ITS enables automatic data collection on the routes by using, for
example, global positioning system (GPS) or electronic data-collection badges. These techniques, in
particular, permit the real-time estimation of useful trip duration in order to feed traffic management

95 Deliverable 1 - A worldwide overview on urban logistic interventions and data collection techniques
tools available to the communities13. According to Japanese studies, these technical developments
should give significant impetus to the cooperative approach.
Thailand
For the study on the evaluation of logistics performance (logistics costs, service quality, reliability and
security) for freight mode choice at an intermodal terminal in Thailand, a concept field survey was
examined through 7 depth interviews. After these interviews the preliminary framework and
questionnaires for shippers, carriers, terminal operators, logistics service providers and public agencies
were adapted. The rate of response was 47.2%.
In Bangkok, for the study on the effects of a cooperative delivery system, Bangkok‘s Traffic Data was
used. For this study, data on travel time (zone-to-zone) and vehicle operation costs were used for three
test case scenarios.
Indonesia (Java)
For the study on the impacts of network improvement in urban areas on inter-regional freight transport,
road data from the Inter-urban Road Management Systems (IRMS) and Indonesian toll road operator PT
Jasa Marga were used. The Department of Communications and a semi-private railways company PT KAI
were asked to deliver railway data. Data on port information and other sea network data was gathered
through the Directorate General of Sea Communication (DGSC).
8.7 OVERVIEW OF URBAN FREIGHT DATA COLLECTION FOR NORTH
AMERICA
8.7.1 UNITED STATES
The Federal Highway Administration (FHWA) provides high-quality information to serve Government,
industry, and the public, by promoting public understanding. Standards and policies are used to ensure
and maximize the quality, objectivity, utility, and integrity of its information. FHWA periodically reviews
quality issues and adjusts its programs and processes to ensure continuous quality improvement. Freight
Facts and Figures 2009 (FHWA, 2009) is a snapshot of the volume and value of freight flows in the
United States, provided by the FHWA, the physical network over which freight moves, the economic
conditions that generate freight movements, the industry that carries freight, and the safety, energy, and
environmental implications of freight transportation. This snapshot helps decision makers, planners, and
13 Source: Ambrosini, C. and Routhier, J. L. (2004) Objectives, Methods and Results of Surveys Carried out in the
Field of Urban Freight Transport: An International Comparison. Transport Reviews. 2004. vol. 24, n°1. pp. 57-77.

96 Deliverable 1 - A worldwide overview on urban logistic interventions and data collection techniques
the public understand the magnitude and importance of freight transportation in the economy. An
electronic version of this publication is available at www.ops.fhwa.dot.gov/freight .
Many of the tables and figures in this report are based on the Economic Census, which is conducted once
every five years. Until results of the 2007 Economic Census are released, the most recently published
complete set of data is for 2002.
Several of the tables and maps are based on the Freight Analysis Framework (FAF), version 2, which builds
on the Economic Census, to estimate all freight flows to, from, and within the United States except
shipments between foreign countries that are transported through the United States. The Freight
Analysis Framework (FAF) integrates data from a variety of sources to estimate commodity flows and
related freight transportation activity among states, regions, and major international gateways. FAF
version 2 (FAF2) provides estimates for 2002 and the most recent year plus forecasts through 2035. More
information can be found at www.ops.fhwa.dot.gov/freight/freight_analysis/faf .
There are several regional and local freight data initiatives from most of the metropolitan councils of the
country, resulting from freight mobility plans and studies which are most of the times included in major
transportation plans. The following examples show some of those studies.
Washington
In 2007, the Transport Planning Board of the Washington Council of Governments commissioned a regional
freight planning study for the metropolitan area. The study examined the state of freight movement in
the region, and identified ways to improve consideration of freight in the regional transportation planning
process.
Metropolitan Baltimore
The Baltimore Metropolitan Council‘s webpage (http://www.baltometro.org/transportation-
planning/freight-management-and-planning) has freight-related publications which include public
information items, intersection analyses, freight modeling efforts, and policy analyses. Freight-related
transportation links are also included on this page.
Atlanta, Georgia
The Atlanta Regional Commission has published two freight planning studies: Atlanta Regional Strategic
Truck Route Master Plan and the Atlanta Regional Freight Mobility Plan, which involved a major data
collection (more information in http://www.atlantaregional.com/).

97 Deliverable 1 - A worldwide overview on urban logistic interventions and data collection techniques
Denver, Colorado
In 2008, a study conducted by the Colorado Department of Transportation Research Branch, Freight data
synthesis, was designed to collect information on the freight data needed to support transportation
planning in Colorado. Following this study there is one upcoming Truck Origin-Destination survey.
This study is available in www.dot.state.co.us/publications/PDFFiles/freightsyn.pdf.
New York City
The Regional Transportation Plan (the Plan) is an integral part of the transportation planning process in
the ten-county New York Metropolitan Transportation Council (NYMTC) region. The Plan is a product of
extensive coordination and collaboration among member agencies, NYMTC‘s partners in the public and
private sectors, the general public, and other stakeholders. It lays out the region‘s transportation needs
and desires over the years 2010 to 2035, and covers the major aspects of transportation from a regional
perspective, including goods movements and special needs transportation. More information in
http://www.nymtc.org/rtp/ .
8.7.2 CANADA
The Transport Canada collects all the programs, policies and statistics related with freight transportation
in a national and regional level. This information can be accessed through the website
http://www.tc.gc.ca/ and also through the national statistics agency (http://www.statcan.gc.ca/). The
TRANS Committee, which includes the National Capital Commission, the Ministère des Transports du
Québec, the Ministry of Transportation of Ontario, Ville de Gatineau, the City of Ottawa, and the Société
de transport de l'Outaouais, has conducted the 1999/2000 Interprovincial Roadside Truck Survey
Report, as well as the National Capital Region Goods Movement Study (1991). These documents can be
consulted at http://www.ncr-trans-rcn.ca/.
The following information presents other examples of regional and local level initiatives related to urban
freight data collection in Canada.
Vancouver
TransLink is Metro Vancouver‘s regional transportation authority, that is responsible for regional transit,
cycling and commuting options as well as AirCare and Intelligent Transportation System programs. This
entity conducted in 1999 the Lower Mainland Truck Freight Study, which is a comprehensive study of
the trucking industry and goods movement in the Greater Vancouver/Fraser Valley Region. This study
incorporated a number of major data collection that resulted from surveys like the vehicle volume and
classification survey and the Regional Truck Activity Survey. This study is available in the Translink
website http://www.translink.ca/ .

98 Deliverable 1 - A worldwide overview on urban logistic interventions and data collection techniques
Edmonton
In the fall of 2001 Alberta Infrastructure/Transportation and the City of Edmonton undertook a
Commodity Flow Survey to study the movement of goods and services in the Edmonton Region. This
study was elaborated in order to provide planners information for planning the movement of goods and
services within the Edmonton Region. The survey gathered the following information: a) How much goods
and services that are being shipped and their destinations; b) How those goods and services reach their
destinations; c) What types of vehicles are being used, including multi and single-unit trucks, light trucks,
vans and cars; and d) What trips are made by delivery and service vehicles - including all the trips for
pick-ups and deliveries and for fueling, servicing, etc. It is possible to access the outputs of this survey
through the website
http://www.transportation.alberta.ca/2219.htm .
Calgary
Similar studies on the regional flow of road freight were undertaken for the City of Calgary. The External
Truck Survey was undertaken in 2000, to obtain information on the movement of goods to and from the
Calgary Region. This survey supplements a more extensive survey of commodity flow conducted within
Calgary and region, from 2000 October to 2001 January. The External Truck Survey Study, published in
2001, can be consulted at
http://www.calgary.ca/DocGallery/BU/trans_planning/forecasting/truck_survey.pdf .
8.8 OVERVIEW OF URBAN FREIGHT DATA COLLECTION FOR AUSTRALIA AND NEW ZEALAND
8.8.1 AUSTRALIA
Through the Australian Bureau of Statistics it is possible to access the findings of The
Freight Movement Survey (FMS) - Rail, Sea and Air (RSA), which is a fully enumerated annual survey
that collects information about domestic freight movements from rail and air freight operators.
Information collected by the Bureau of Transport Economics from port authorities is incorporated with the
information published from the survey. FMS - RSA publishes information on the origin, destination,
commodity type, weight and method of transportation (for more information visit
http://www.abs.gov.au/).
The Bureau of Infrastructure, Transport and Regional Economics (BITRE) of the Department of
Infrastructure, Transport, Regional Development and Local Government of the Australian Government
provides economic analysis, research and statistics on infrastructure, transport, regional development and
local government issues to inform both Australian Government policy development and wider community

99 Deliverable 1 - A worldwide overview on urban logistic interventions and data collection techniques
understanding. In its website there are several papers related with urban freight, although there is no
statistical data about this topic.
The Transport Data Centre (TDC) is the premier source of transport data for the New South Wales (NSW)
government. TDC's role is to assist those involved in transport and land use planning to make informed
decisions by providing reliable and up-to-date information on current and future travel patterns and
employment and population trends (http://www.transport.nsw.gov.au/). The Transport Data Centre
produces a range of publications, including quarterly bulletins, brochures, issues papers and detailed
reports.
The Freight Movements Model (FMM) is an improved platform for providing estimates of current and
future year road freight movements between all travel zones in the Greater Metropolitan Area, developed
by the Transport Data Centre. These estimates about truck and light commercial vehicle movements are
available on request to registered users.
In a regional level, the State Government Victoria Department of Infrastructure (DOI) elaborated the
Transport Demand Information Atlas for Victoria 2008, which aims to compile reliable and recent data
relating to key aspects of the passenger and freight tasks. It uses Census data, other data published by
the Australian Bureau of Statistics, survey data commissioned by DOT, and time use analysis by Melbourne
University economists. This document is available online through the website:
http://www.transport.vic.gov.au/DOI/Internet/planningprojects.nsf/ .
This document includes the main outputs of the Freight Movements Model for Metropolitan Melbourne,
which was based on a survey of vehicles movements made in 2007, and permitted to identify and
characterize the main freight movements intra, into and from Melbourne by types of services, goods and
vehicles. This database permits to estimate outputs such as a) the growth and distribution of demand for
commodity movements; b) the growth and distribution of commercial vehicle trips required to transport
the commodities; c) the impacts of supply chain changes (e.g. technologies, business policies and
processes) on the commodity and transport growth; and d) the need for transport infrastructure
improvements and their impact on commodity transport.
Austroads is an association of Australian and New Zealand road transport and traffic authorities that aim
to contribute to the achievement of improved Australian and New Zealand transport related outcomes. On
their website they have several studies concerning urban freight logistics and urban planning.
http://www.onlinepublications.austroads.com.au/ .
According the study ―Planning for freight in urban areas‖ (Austroads, 2003) the key data sets available to
transport planners can be divided into a number of data sources, such as:
Regular surveys: generally conducted by ABS or transport research consultants (private and
public), where results are published regularly;

100 Deliverable 1 - A worldwide overview on urban logistic interventions and data collection techniques
ad-hoc surveys: generally conducted by transport research consultants;
automatic data collection: weigh-in-motions and other counters and signal systems: collected by
State road agencies;
general activity and travel surveys;
freight industry association collected data;
land-use data sources: usually available from Local and State governments.
Only a small number of regular surveys which directly relate to freight are undertaken at the national or
regional level, namely:
ABS Freight Movement Survey (FMS) – vehicle and commodity movements, inter and intra-state;
FDF Management FreightInfo – has collected freight data on commodity flows by weight, type,
mode and economic sector between all statistical divisions in Australia for a number of years
since 1986/77;
ABS Survey of Motor Vehicle Use (SMVU) – triennial survey of vehicle fleet sizes and basis transport
tasks (e.g. tonnage, fuel usage and km travelled);
ABS Motor Vehicles in Australia (MVA) – annual survey of the number of registered vehicle by state
and territory.
Source: Planning for Freight in Urban Areas: AP-R228 (Austroads, 2003)
8.8.2 NEW ZEALAND
In 2008, the Ministry of Transport (MoT), the Ministry of Economic Development (MED) and Land Transport
New Zealand (now the NZ Transport Agency) commissioned the National Freight Demand Study. One of
the main goals of undertaken this study was to overcome the limited amount of data on the sector and to
provide the basis for future policies. This study collects information about freight movements such as the
movements for selected commodity groups, the patterns of movements for selected commodity groups,
movements by mode and the forecasts until the year of 2031. This study is available in the Ministry of
Transports‘ website http://www.transport.govt.nz/.
The Ministry of Transport also publishes The New Zealand Transport Statistics, which is an annual
document that reports against the data collected in the Transport Monitoring Indicator Framework (TMIF).
The Transport Monitoring Indicator Framework (TMIF) provides a national, and where possible regional,
framework for the monitoring of the New Zealand transport system, including indicators for
freight/transport industry, namely indicators for freight volume, road freight efficiency, and value of
freight and overseas merchandise trade.

101 Deliverable 1 - A worldwide overview on urban logistic interventions and data collection techniques
On a regional level, the Auckland Regional Council promoted the Auckland Regional Freight Strategy 2006,
which is the result of a collaborative effort with the freight industry and regional partners including the
local councils and Transit New Zealand (TNZ). This study indicates as a priority action the preparation of
the Freight Data Acquisition Plan, which contain the collection of traffic data on all modes and the
research into freight data generation.
8.9 DATA COLLECTION IN AFRICA
8.9.1 GENERAL
Data collection in Africa is usually performed on a national basis, generally by the national bureau of
statistics (e.g. Nigeria, Mozambique, etc). However this information is very scarce and rarely available or
updated.
There are a few entities that gather data and produce reports for several African countries, such as OECD,
World Bank and African Development Bank. The African Development Bank gathers data from different
African countries and produces several statistics publications, namely the ADB Statistics Pocket book 2009
prepared in the Economic and Social Statistics Division of the Statistics Department at the African
Development Bank. This publication presents economic and social data on regional member countries and
on the operational activities of the African Development Bank Group. It has the latest available economic,
financial, social and environmental indicators for regional members of ADB, with the support of the
national central banks, bureau of statistics and ministries (for example: ministries of transport, national
planning and/or economic development).
Most of the indicators shown in the publications are selected from other Bank publications: Compendium
of Statistics on Bank Group Operations, Gender, Poverty and Environmental Indicators on African
Countries and Selected Statistics on African Countries which contain more detailed information.
Error! Reference source not found. shows a snapshot from the report ―Selected Statistics on African
ountries 2008 Volume XXVII‖ where it is shown the type of freight data presented in the report.

102 Deliverable 1 - A worldwide overview on urban logistic interventions and data collection techniques
Figure 31: Example of data statistics from the AFDB
Source: African Development Bank document ―Selected Statistics on African Countries 2008 Volume XXVII‖
8.9.2 SOUTH AFRICA
South Africa presents a higher level of available information regarding freight logistics, compared with
the other African countries. The Council for Scientific and Industrial Research (CSIR), which is one of the
leading scientific and technology research, development and implementation organisations in Africa,
publishes every year since 2004 a report about The State of Logistics survey, that aims the provision of a
comprehensive overview of the state of logistics in South Africa, incorporating a macro-economic
perspective (top-down), an industry-level perspective (bottom-up), and a small business development
perspective. These reports are available online in http://www.csir.co.za/sol/ .
The Department of Transport also has road and rail freight transport statistics, available online for the
year 2001 that can be used as Key Performance Indicators.
http://www.transport.gov.za/library/docs/stats/2001/statistics.html#4 .
The Statistics South Africa (Stats SA) publishes quarterly a report called The Land Transport Survey, based
on the results from a monthly survey of the land transportation industry, covering passenger and freight
transportation by rail and road. This survey is based on a sample drawn from the 2009 Business Sampling
Frame (BSF) that contains businesses registered for value added tax (VAT). The Road Freight Survey is a
monthly survey covering a sample of private sector enterprises predominantly engaged in the conveyance
of goods for remuneration in South Africa. The results of the survey are used to compile National Accounts
aggregates (e.g. the Gross Domestic Product (GDP), and its components as well as private consumption
expenditure), which are used to monitor and develop government policy. These statistics are also used by
the private sector in analysis of comparative business and industry performance. This report is available
at
http://www.statssa.gov.za/publications/P7162/P7162September2009.pdf .
103 Deliverable 1 - A worldwide overview on urban logistic interventions and data collection techniques
According to the Integrated Transport Plan for the City of Cape Town 2006 to 2011, published in May
2009, the Western Cape Urban Freight Study, undertaken in 2006 by the Provincial Government of the
Western Cape, provides the best presently accessible data in respect of major freight movements in the
City of Cape Town.

104 Deliverable 1 - A worldwide overview on urban logistic interventions and data collection techniques
9 CONCLUDING REMARKS As stated at the start (in Chapter 1) this deliverable has provided a worldwide snapshot of urban freight
interventions and data collection techniques, providing a platform for further development of the
TURBLOG_ww project. The material in the deliverable has been taken from five Regional Reports
produced by the project:
- Regional Report EU
- Regional Report Brazil
- Regional Report Hispano-American countries
- Regional Report Asia
- Regional Report Rest of the World (covering Australia, New Zealand, Canada, United States and
Africa)
The general approach has been to take generic summaries of particular types of intervention, data
collection techniques, transport policies etc and to supplement these summaries with examples that have
been fully elaborated in the regional reports (trying to achieve balance between different parts of the
world in the process). Since all of these reports were substantial in their own right, each covering broad
range of information, it is clear that a large amount of pruning has been required in order to provide a
manageable report of approximately 100 pages that is attractive to the reader. In general, there has been
a preference for including descriptions of interventions that are accompanied by (informative) photos,
diagrams and maps, thus averting the risk of providing long sequences of pages of dense-looking text.
Clearly, one objective in compiling this deliverable has been the need to avoid repetition. A number of
factors are common in each of the regional reports and these will now be highlighted.
Urban freight has traditionally not been given the same level of importance as urban passenger transport
in urban policy-making. However, there are signs that this situation is changing (at least in certain cities)
and the results of such change are featured throughout the report. Associated with this lack of
importance, there has generally been a lack of systematic data collection required for the planning of
urban freight and the assessment of particular interventions. A major part of this deliverable has been
dedicated to the issue of data collection: Chapter 8, which deals with this issue, is one of the
deliverable‘s two longest chapters. In Chapter 8, material is presented from the Regional Reports for the
EU, Asia and the Rest of the World, describing ―standard‖ approaches to collecting data for urban freight
as well as ―state-of-the-art‖ approaches‖. The Regional Reports from Brazil and Hispano-America also
feature material about data collection, though in general the techniques are less well developed than
those described in Chapter 8.

105 Deliverable 1 - A worldwide overview on urban logistic interventions and data collection techniques
A further consequence of the lack of importance attached to urban freight is that there is a resulting lack
of publicly-available information about interventions, so that the task of compiling regional reports
describing such interventions has typically been challenging (particularly in the case of the Hispano-
American Regional Report). The one obvious exception to this comment concerns the situation in Europe.
In the EU Regional Report it was remarked that one of the most significant features distinguishing the
development or urban freight transport policy/interventions in the EU from other parts of the world has
been the growing availability of information on EU policy/interventions: in fact the main challenge in
compiling the EU Regional Report was to make manageable selection of examples of interventions from
the vast amount of information available. Whilst national authorities have in certain cases contributed to
this growth in information, the main driving factor has been the EU, and in particular various research
projects funded under the various Framework Programmes. Such projects have created a situation
whereby a vast amount of information is publicly available, typically through the internet, on relevant
developments in Europe. It is hoped that similar initiatives will be carried out in future in other parts of
the world. As a final comment about Europe, though, it is important to point out that it is misleading to
see Europe as a homogenous block: there is clearly a wide divergence in factors (economic, historical,
political, cultural) between different parts of Europe and these differences will inevitably have a
significant impact on urban freight transport policy. In terms of information availability, there is a clear
distinction between North-West Europe (particularly the Netherlands, France, UK and Germany) and other
parts of Europe. An attempt has been made in this deliverable to provide ―intra-European‖ balance as
well as the balance between world regions mentioned above.
As was mentioned in Chapter 1, it is important stress that this deliverable has consciously made no
attempt to make any assessments or judgements about different practices in urban freight planning: such
assessment will be made at a later stage in the project. It follows that, in general, information about
specific interventions are presented ―as given‖ (frequently by those who have been involved in the
interventions), without any attempt to assess the relative merits of the intervention. At the risk of
appearing to break this rule, two (very) general comments can be made about interventions. Firstly,
whilst an emphasis has (rightly) been put upon ―high-tech‖ solutions, it is important not to forget ―low-
tech‖ solutions. This issue is particularly apparent in Chapter 4, which has included examples of non-
motorised and low-energy modes for urban freight, which have increased recently in popularity due to
environmental and (lack of) energy concerns. Whilst such modes are being investigated and implemented
in wealthy countries, much can be learnt from the experience of their use in poorer countries (or poorer
parts of countries, as in Brazil).
The second general comment to make is that, whilst the descriptions provided in the deliverable portray
a wide variety of different types of intervention, there is little evidence to suggest that many of these
interventions have been planned as elements in coherent ―urban transport policy packages‖. Exceptions

106 Deliverable 1 - A worldwide overview on urban logistic interventions and data collection techniques
to this observation clearly exist, and examples of such policy packages have been given in Chapter 7
(concerning London, Paris, São Paulo and Masdar City). However, it would appear that much more effort
needs to be made by responsible transport planning agencies for including urban freight in comprehensive
transport plans.

107 Deliverable 1 - A worldwide overview on urban logistic interventions and data collection techniques
REFERENCES
Allen, J., and Browne, M. (2008) ―Review of Survey Techniques Used in Urban Freight Studies‖. Report
produced as part of the Green Logistics Project: Work Module 9 (Urban Freight Transport).
http://www.greenlogistics.org/SiteResources/16adc811-45bb-42f4-8fe8-
39930e2e8a30_Review%20of%20Survey%20Techniques%20_final_%20November%202008.pdf
Austroads (2003) ―Planning For Freight in Urban Areas: AP-R228‖. Publication No. AP-R228/03.
BESTUFS (2006) Deliverable D 3.1 BESTUFS Best Practice in data collection, modelling approaches and
application fields for urban commercial transport models I. Theme: Urban freight data collection -
synthesis report.
http://www.bestufs.net/download/BESTUFS_II/key_issuesII/BESTUFS_II_results_datacollection/BESTU
FS_II_data_collection_synthesis_report.pdf
BESTUFS (2007) Good Practice Guide on Urban Freight Transport.
http://www.bestufs.net/gp_guide.html
BESTUFS (2008a) Deliverable D 1.4 BESTUFS Policy and Research Recommendations IV. Environmental
Zones in European Cities, Accommodating the needs of passenger and freight transport in cities, and
BESTUFS Project Recommendations
http://www.bestufs.net/download/BESTUFS_II/key_issuesII/BESTUFS_Recommendations_IV.pdf
BESTUFS (2008b) Deliverable D5.2 Quantification of Urban Freight Transport Effects II
http://www.bestufs.net/bestufs2_quantific.html
Browne, M., Allen, J., Attlassy, M. (2007) Comparing freight transport strategies and measures in
London and Paris. International Journal of Logistics 10( 3) pp. 205-219
CAI-Asia (2006). Hong Kong: City Synthesis Report on Urban Air Quality Management. Published by the
Asian Development Bank. Available at: http://www.cleanairnet.org/caiasia/1412/csr/hongkong.pdf
Castro, J. T.and Kuse, H. (2005) Impacts of large truck restrictions in freight carrier operations in
Metro Manila. Available at:
http://www.easts.info/on-line/journal_06/2947.pdf
City of Toronto (2009) ―City of Toronto Loading Standards Review‖. MMM Group. Available at:
http://www.toronto.ca/zoning/pdf/loading_standards21may09.pdf ).

108 Deliverable 1 - A worldwide overview on urban logistic interventions and data collection techniques
Commission Of The European Communities (2007a) Green Paper ―Towards a new culture for urban
mobility” COM(2007) 551
Commission Of The European Communities (2007b) Communication from the Commission: ―The EU's
freight transport agenda: Boosting the efficiency, integration and sustainability of freight transport in
Europe‖ COM(2007) 606
Commission Of The European Communities (2007b) Communication from the Commission: ―Freight
Transport Logistics Action Plan‖ COM(2007) 607
Commission Of The European Communities (2009a) Communication from the Commission: ―A
sustainable future for transport: Towards an integrated, technology-led and user friendly system‖
COM(2009) 279/4
Commission Of The European Communities (2009b) Communication from the Commission to the
European Parliament, the Council, the European Economic and Social Committee and the Committee
of the Regions: ―Action Plan on Urban Mobility‖ COM(2009) 490/5
Federal Highway Administration (2009) ―Freight Facts and Figures 2009‖
http://ops.fhwa.dot.gov/freight/freight_analysis/nat_freight_stats/docs/09factsfigures/index.htm
Godoy, R.O.G., and Rodrigues, Ê.F. (2006) Planejamento das variáveis logísticas de decisão no
comércio eletrônico de alimentos. IN: Anais do XIII SIMPEP - Bauru, SP, Brasil, 6 a 8 de Novembro de
2006.
Lee, W. S. (2005) City Logistics Policy and Role of the Public Sector in Seoul. Abstract available at:
http://www.sdi.re.kr/eng/publication/journal_read.asp?page=13&gb=Journal%20Articles&r_gb=Journa
l%20Articles&no=1079
Lee, W.S. and Lee, K. H. (2004) A Study on Manual of Urban Freight Transportation Planning. Abstract
Available at:
http://www.sdi.re.kr/eng/publication/journal_read.asp?page=17&gb=Journal%20Articles&r_gb=Journa
l%20Articles&no=1030
Ogden, K. (1992) Urban Goods Movement: A Guide to Policy and Planning, Ashgate, Kent.
Qui, W. (2005). City Logistics Approach in China: An Overview. Presentation at the Fourth International
Conference on City Logistics, Langkawi, Malaysia, 12-14 July 2005. Available at:
http://citylogistics.org/CityLogistics2005/Presentation/Qiu.pdf
Sakano, N. (2005). Experiment report transportation demand management experiment in Akihabara
2004. Available at: http://www.citylogistics.org/CityLogistics2005/Presentation/Ikeda.pdf

109 Deliverable 1 - A worldwide overview on urban logistic interventions and data collection techniques
Stantchev, D., and Whiteing, A.E. (2006) Urban Freight Transport and Logistics: An overview of the
European research and policy. TRKC Policy Brochure. http://www.transport-
research.info/Upload/Documents/200608/20060831_105348_30339_Urban_freight.pdf
START ( 2008) START project Final Report: Future solutions for goods distribution. http://www.start-
project.org/download/final/START%20final%20Report.pdf
Upton, J. (2008) ―Best practice in freight transport operation‖. Prepared for Environment Canterbury
http://www.ecan.govt.nz/publications/General/BestPracticeFreightTransportOperations.pdf
Van Duin, R. H. R. (1999). ‗‘Urban freight transport: learning from the practices in two countries‖,
Paper presented at the International Conference ―Urban Transport and the Environment for the 21st
Century‖ (Rhodes, 8-10 September, 1999).
Visser, J., van Binsbergen, A. and Nemoto,T. (1999). ‗‘Urban Freight Transport Policy and Planning‘‘,
paper for First International symposium on city logistics Cairns, Australia. Available at:
http://www.rstrail.nl/FTAM/FTAM_papers/FTAM2/transportpolicy.pdf