Embed Size (px)
Citation preview
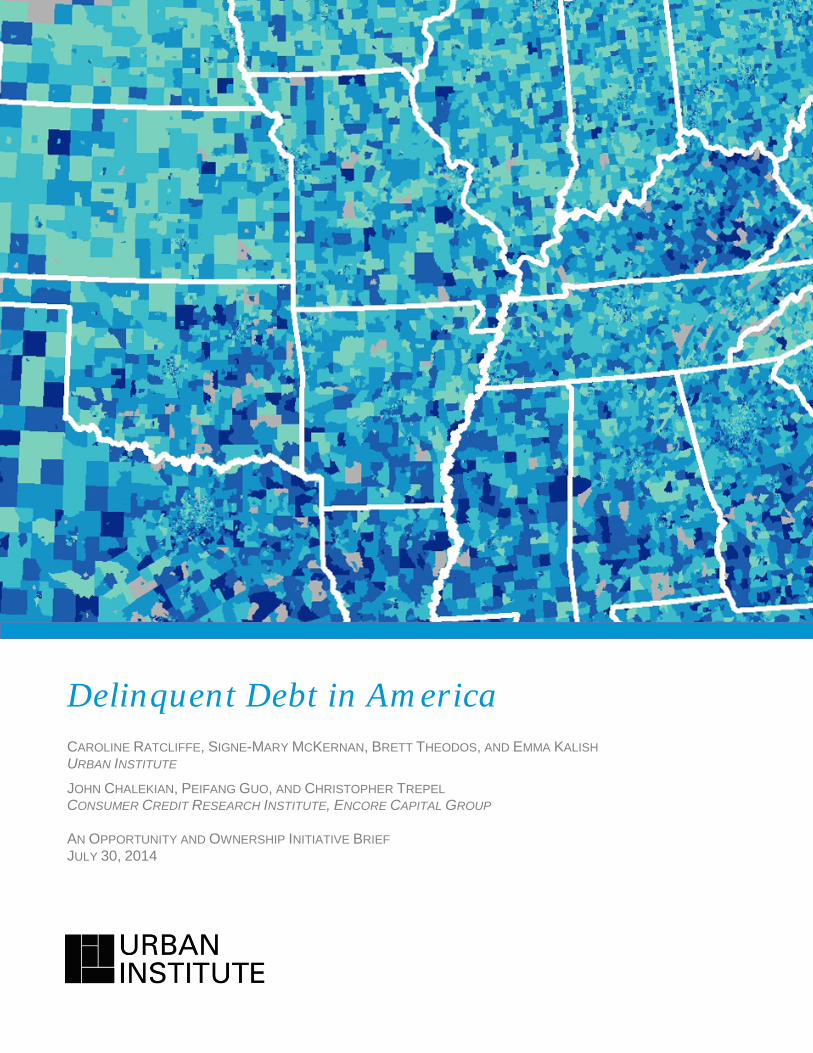
Delinquent Debt in America CAROLINE RATCLIFFE, SIGNE-MARY MCKERNAN, BRETT THEODOS, AND EMMA KALISH URBAN INSTITUTE
JOHN CHALEKIAN, PEIFANG GUO, AND CHRISTOPHER TREPEL CONSUMER CREDIT RESEARCH INSTITUTE, ENCORE CAPITAL GROUP AN OPPORTUNITY AND OWNERSHIP INITIATIVE BRIEF JULY 30, 2014
The authors thank TransUnion for providing both data and assistance with data interpretation, and Graham MacDonald for assistance with data analysis and methodology. We also thank Erika Poethig, Ellen Seidman, and participants at the Opportunity and Ownership seminar for their helpful comments.
About the Consumer Credit Research Institute
The Consumer Credit Research Institute (CCRI) is dedicated to understanding consumer financial decision making, especially within subprime credit and low- and moderate-income populations. Its research is interdisciplinary and focused on creating new insights to advance public policy, financial education, and commercial innovation. Additional information about the CCRI is available at encoreccri.org. The conclusions and views presented here are those of the authors and should not be attributed to Encore Capital Group, Midland Credit Management, or the Consumer Credit Research Institute.
About the Urban Institute
The nonprofit Urban Institute is dedicated to elevating the debate on social and economic policy. For nearly five decades, Urban scholars have conducted research and offered evidence-based solutions that improve lives and strengthen communities across a rapidly urbanizing world. Their objective research helps expand opportunities for all, reduce hardship among the most vulnerable, and strengthen the effectiveness of the public sector.
Support for research on consumer indebtedness was provided by the CCRI (Encore Capital Group). The Urban Institute receives philanthropic contributions from individuals, foundations, and corporations. This funding supports Urban’s research, outreach and engagement, and general operating activities. The Urban Institute also receives funding from federal, state, and local governments to conduct research, evaluate programs, and offer technical assistance.
Urban strives for the highest standards of integrity and quality in its research, analyses, and policy recommendations. Urban scholars believe that independence, rigor, and transparency are essential to upholding those values. Funders do not determine research findings or influence scholars’ conclusions. As an organization, the Urban Institute does not take positions on issues. Urban scholars and experts are independent and empowered to share their evidence-based views and recommendations shaped by research.
The views expressed are those of the authors and should not be attributed to the Urban Institute, its trustees, or its funders.
Delinquent Debt in America Consumers are a major factor in economies. Their spending habits are often used as a bellwether for public confidence in a country’s fiscal standing. A portion of US consumer spending is financed with debt—cumulatively $11.23 trillion in September 2013, down from $12.68 trillion in 2009 (Federal Reserve Bank of New York 2013).
Consumer debt is accumulated for different reasons and with different results. Productive debt—the kind that people take on when purchasing a home, financing a new business, and investing in education or skills training—can help families accumulate wealth and achieve upward mobility. Unproductive debt—the kind that people take on to meet basic needs and expenses, such as when an unforeseen job loss or medical crisis arises, or to purchase items that cannot be covered with current resources—does not have the same long-term benefits and is therefore riskier for families.
When families are unable to meet their payment obligations on either type of consumer debt, they risk moving from a healthy asset-accumulation cycle to a vicious debt cycle. Their credit history and scores can be adversely affected, their debt may go into collections, and they may ultimately lose property and future financial opportunities.
While the geographic distribution of income, home prices, and many other important economic factors has been researched extensively,1 delinquent debt has largely gone unexamined. This brief paints a geographic portrait of financially distressed consumers in the United States.2 The degree of financial distress across the United States, as measured by the percentage of people with debt past due and debt in collections, differs greatly by geographic location. The South has particularly high rates of financially distressed consumers, especially the percentage of consumers who have debt in collections. Understanding the spatial patterns of financial distress is a key step in understanding the underlying drivers of delinquent debt in America.
What Are Our Numbers Based On?
We use 2013 credit bureau data from TransUnion to measure how many Americans are reported as at least 30 days late on a non-mortgage bill payment—often called having debt past due. We also examine how many Americans have debt reported as in collections and the amount of this debt.
These credit bureau data describe people with credit files and do not represent the roughly 22 million US adults (9 percent of the population) with no credit file.3 Because adults without a credit file are more likely to be financially disadvantaged, our data underrepresent low-income consumers. Our analyses also exclude debts such as loans from friends or family, or loans outside the financial mainstream, such as payday or pawnshop loans.4 Our data do, however, include people who have any type of information reported to the credit bureau, even if it is only a report of debt in collections.5 For more information on our data and methodology, see the text box on page 8.
Who Has Debt Past Due?
Individual debt holdings are tied to access to credit. In other words, there must first be a supply of credit, and this supply is not extended to all consumers. In fact, many of the lowest income consumers cannot access traditional credit, like a credit card, so do not have the associated debt (McKay 2014; Turner, Walker, and Dusek 2009; Turner et al. 2006). Nonetheless, people with limited or no access to traditional
credit may still have delinquent debts. They may have an unpaid utility or medical bill, for example, that ends up in collections and results in a negative report on their credit file. They may also owe money to friends or family, or have loans outside the financial mainstream.
Roughly 1 out of 20 people with a credit file (5.3 percent) are at least 30 days late on a credit card or other non-mortgage account (e.g., automobile loan, student loan).6 In other words, they have debt that has been reported as past due to the credit bureau.7 While this is a minority of adults, debt past due is an indication of looming problems. For adults with other debts already in collections, the problem may be snowballing. Among people with debt past due, the average amount they need to pay to become current on that debt is $2,258.8
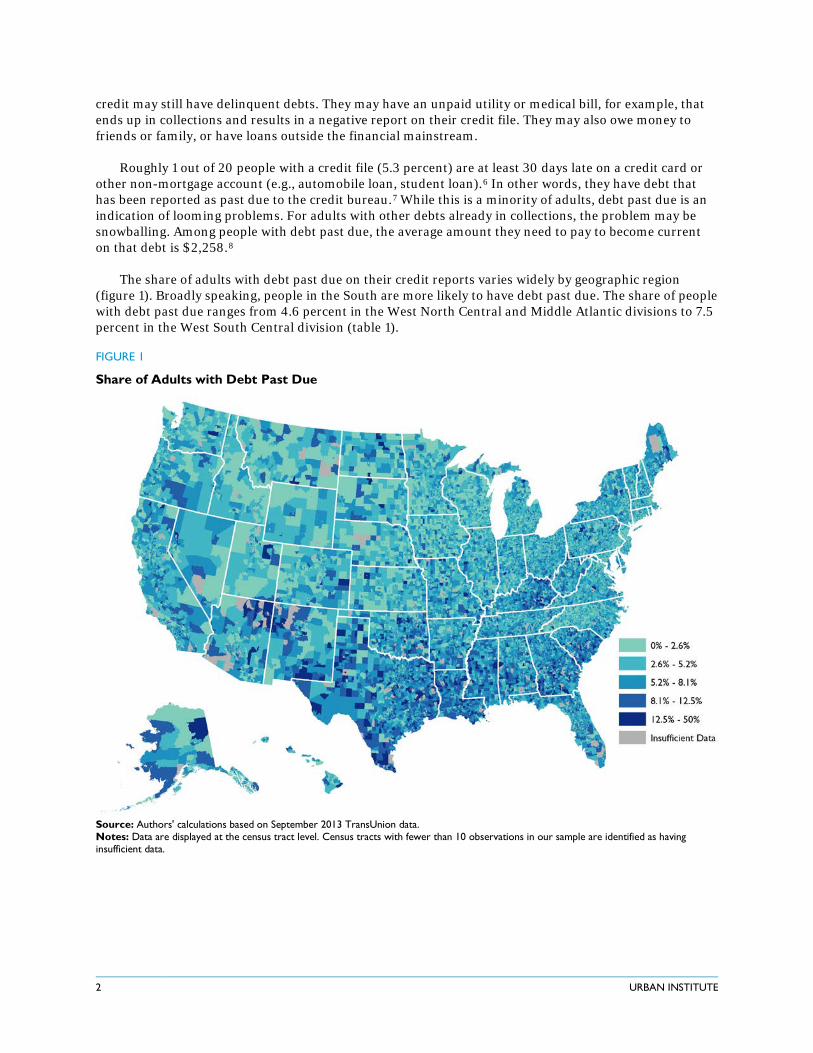
The share of adults with debt past due on their credit reports varies widely by geographic region (figure 1). Broadly speaking, people in the South are more likely to have debt past due. The share of people with debt past due ranges from 4.6 percent in the West North Central and Middle Atlantic divisions to 7.5 percent in the West South Central division (table 1).
FIGURE 1
Share of Adults with Debt Past Due
Source: Authors' calculations based on September 2013 TransUnion data. Notes: Data are displayed at the census tract level. Census tracts with fewer than 10 observations in our sample are identified as having insufficient data.
2 URBAN INSTITUTE
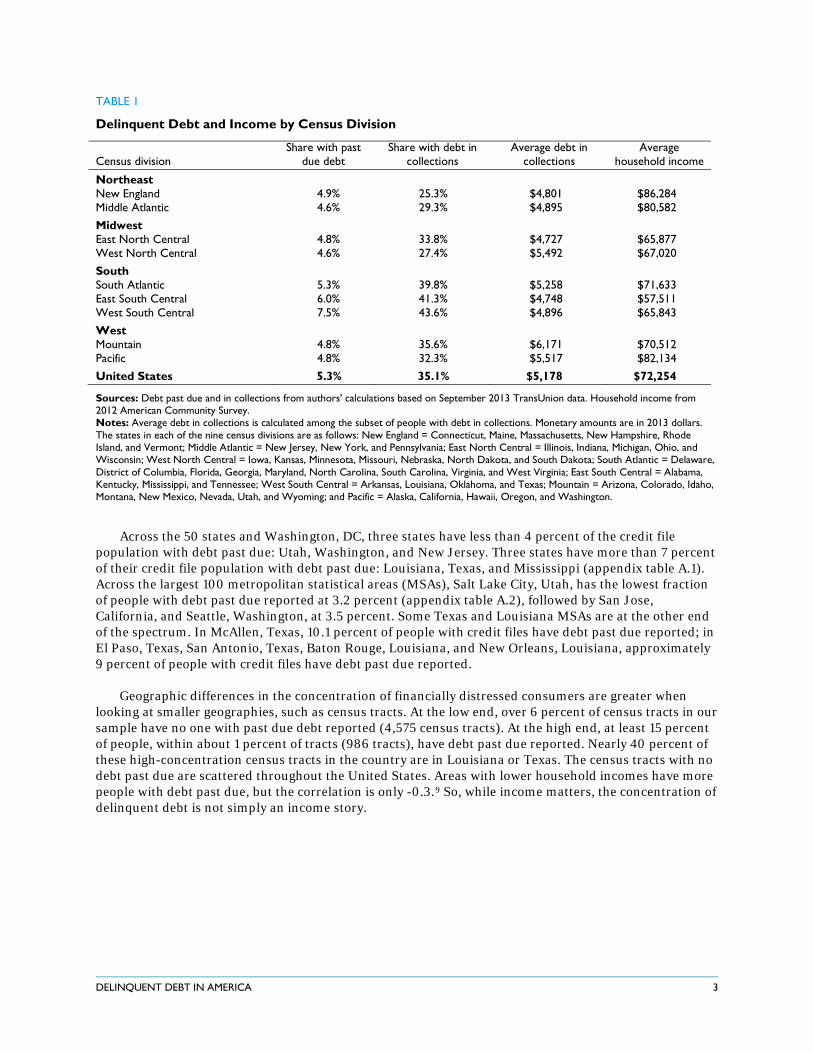
TABLE 1
Delinquent Debt and Income by Census Division
Census division Share with past
due debt Share with debt in
collections Average debt in
collections Average
household income
Northeast New England 4.9% 25.3% $4,801 $86,284
Middle Atlantic 4.6% 29.3% $4,895 $80,582 Midwest
East North Central 4.8% 33.8% $4,727 $65,877 West North Central 4.6% 27.4% $5,492 $67,020 South
South Atlantic 5.3% 39.8% $5,258 $71,633 East South Central 6.0% 41.3% $4,748 $57,511 West South Central 7.5% 43.6% $4,896 $65,843 West
Mountain 4.8% 35.6% $6,171 $70,512 Pacific 4.8% 32.3% $5,517 $82,134 United States 5.3% 35.1% $5,178 $72,254
Sources: Debt past due and in collections from authors' calculations based on September 2013 TransUnion data. Household income from 2012 American Community Survey. Notes: Average debt in collections is calculated among the subset of people with debt in collections. Monetary amounts are in 2013 dollars. The states in each of the nine census divisions are as follows: New England = Connecticut, Maine, Massachusetts, New Hampshire, Rhode Island, and Vermont; Middle Atlantic = New Jersey, New York, and Pennsylvania; East North Central = Illinois, Indiana, Michigan, Ohio, and Wisconsin; West North Central = Iowa, Kansas, Minnesota, Missouri, Nebraska, North Dakota, and South Dakota; South Atlantic = Delaware, District of Columbia, Florida, Georgia, Maryland, North Carolina, South Carolina, Virginia, and West Virginia; East South Central = Alabama, Kentucky, Mississippi, and Tennessee; West South Central = Arkansas, Louisiana, Oklahoma, and Texas; Mountain = Arizona, Colorado, Idaho, Montana, New Mexico, Nevada, Utah, and Wyoming; and Pacific = Alaska, California, Hawaii, Oregon, and Washington.
Across the 50 states and Washington, DC, three states have less than 4 percent of the credit file population with debt past due: Utah, Washington, and New Jersey. Three states have more than 7 percent of their credit file population with debt past due: Louisiana, Texas, and Mississippi (appendix table A.1). Across the largest 100 metropolitan statistical areas (MSAs), Salt Lake City, Utah, has the lowest fraction of people with debt past due reported at 3.2 percent (appendix table A.2), followed by San Jose, California, and Seattle, Washington, at 3.5 percent. Some Texas and Louisiana MSAs are at the other end of the spectrum. In McAllen, Texas, 10.1 percent of people with credit files have debt past due reported; in El Paso, Texas, San Antonio, Texas, Baton Rouge, Louisiana, and New Orleans, Louisiana, approximately 9 percent of people with credit files have debt past due reported.
Geographic differences in the concentration of financially distressed consumers are greater when looking at smaller geographies, such as census tracts. At the low end, over 6 percent of census tracts in our sample have no one with past due debt reported (4,575 census tracts). At the high end, at least 15 percent of people, within about 1 percent of tracts (986 tracts), have debt past due reported. Nearly 40 percent of these high-concentration census tracts in the country are in Louisiana or Texas. The census tracts with no debt past due are scattered throughout the United States. Areas with lower household incomes have more people with debt past due, but the correlation is only -0.3.9 So, while income matters, the concentration of delinquent debt is not simply an income story.
DELINQUENT DEBT IN AMERICA 3
Who Has Debt in Collections?
Financial distress is also signaled by debt in collections. Debt in collections originates from non-payment of a bill, and includes events such as failing to make payments on an outstanding credit card balance, not paying medical or utility bills, or even failing to pay a parking ticket. Importantly, a debt that is reported as in collections can remain on a person's credit report until the debt is seven years past due. Unlike debt past due, debt identified as in collections in our data has not necessarily been verified in the past 12 months. When consumers make payments on the debt, however, these should be reported by the collection agency to the credit bureau within 30 days of payment.10
An alarming 35 percent of people with credit files have debt in collections reported in these files. This percentage is nearly identical to results from a 2004 analysis of credit bureau data by the Federal Reserve, which found that 36.5 percent of people with credit reports had debt in collections reported in their files (Avery et al. 2004). Note that consumers themselves may not realize they have debt in collections. Some consumers report becoming aware of this debt only when they review their credit report (CFPB 2013). The amount of debt in collections varies widely by person, from less than $25 to more than $125,000. Among people with a report of debt in collections, the average amount owed is $5,178.
Compared with debt past due, a broader set of debts can enter collection status (e.g., medical bills, parking tickets, membership fees), and they can remain on a credit report for up to seven years. People with both types of delinquent debt (collections and past due) have higher average collections debt than those with only collections debt—$9,123 versus $4,641, respectively.11
Consumers with reported debt in collections are concentrated geographically, especially in the South (figure 2). Roughly 40 percent of people with credit files in the East South Central, West South Central, and South Atlantic divisions have debt in collections reported in their credit files (see table 1). New England has the lowest concentration of reported debt in collections, although it is still a substantial 25 percent.
Nevada, which was hard hit by the housing crisis, tops the list of past-due states: 47 percent of people with a credit file have reported debt in collections. The District of Columbia and an additional 12 states (11 in the South) are over the 40 percent mark: Alabama, Arkansas, Florida, Georgia, Kentucky, Louisiana, Mississippi, New Mexico, North Carolina, South Carolina, Texas, and West Virginia (appendix table A.1). At the low end are three Midwestern states— Minnesota, North Dakota, and South Dakota—which have a substantially lower, yet still considerable, 20 percent of people with reported debt in collections.
4 URBAN INSTITUTE
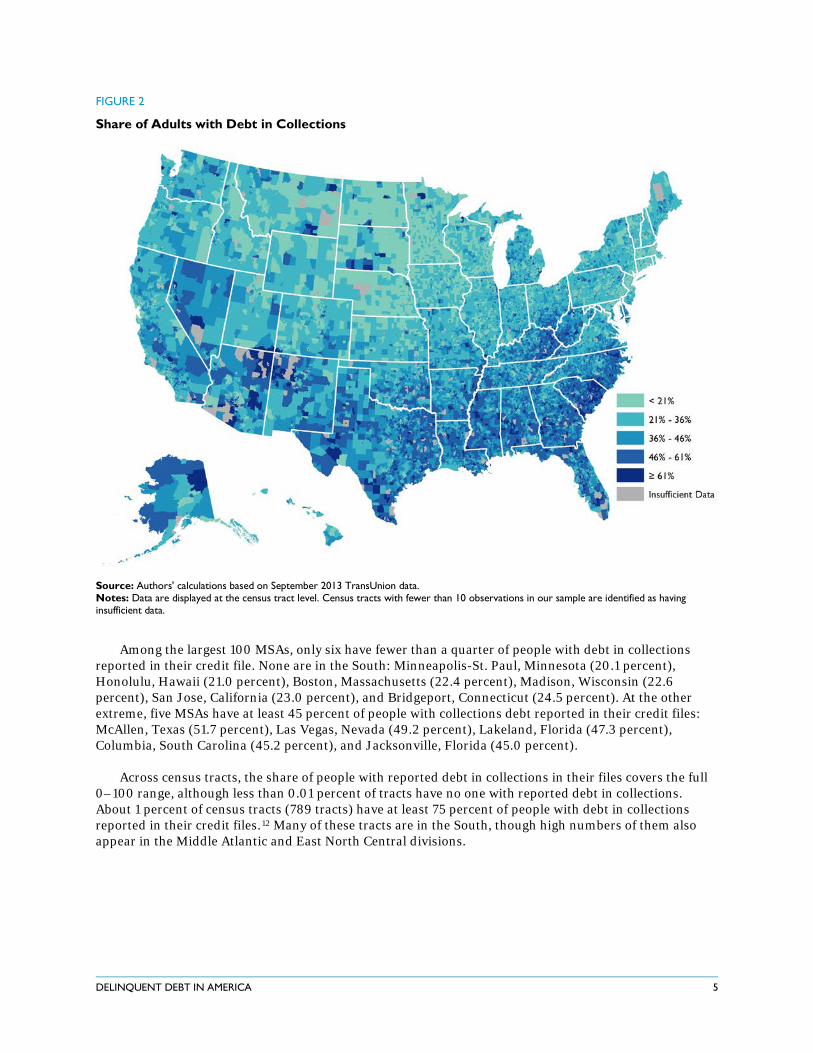
FIGURE 2
Share of Adults with Debt in Collections
Source: Authors' calculations based on September 2013 TransUnion data. Notes: Data are displayed at the census tract level. Census tracts with fewer than 10 observations in our sample are identified as having insufficient data.
Among the largest 100 MSAs, only six have fewer than a quarter of people with debt in collections reported in their credit file. None are in the South: Minneapolis-St. Paul, Minnesota (20.1 percent), Honolulu, Hawaii (21.0 percent), Boston, Massachusetts (22.4 percent), Madison, Wisconsin (22.6 percent), San Jose, California (23.0 percent), and Bridgeport, Connecticut (24.5 percent). At the other extreme, five MSAs have at least 45 percent of people with collections debt reported in their credit files: McAllen, Texas (51.7 percent), Las Vegas, Nevada (49.2 percent), Lakeland, Florida (47.3 percent), Columbia, South Carolina (45.2 percent), and Jacksonville, Florida (45.0 percent).
Across census tracts, the share of people with reported debt in collections in their files covers the full 0–100 range, although less than 0.01 percent of tracts have no one with reported debt in collections. About 1 percent of census tracts (789 tracts) have at least 75 percent of people with debt in collections reported in their credit files.12 Many of these tracts are in the South, though high numbers of them also appear in the Middle Atlantic and East North Central divisions.
DELINQUENT DEBT IN AMERICA 5
Is the Amount of Debt in Collections Concentrated?
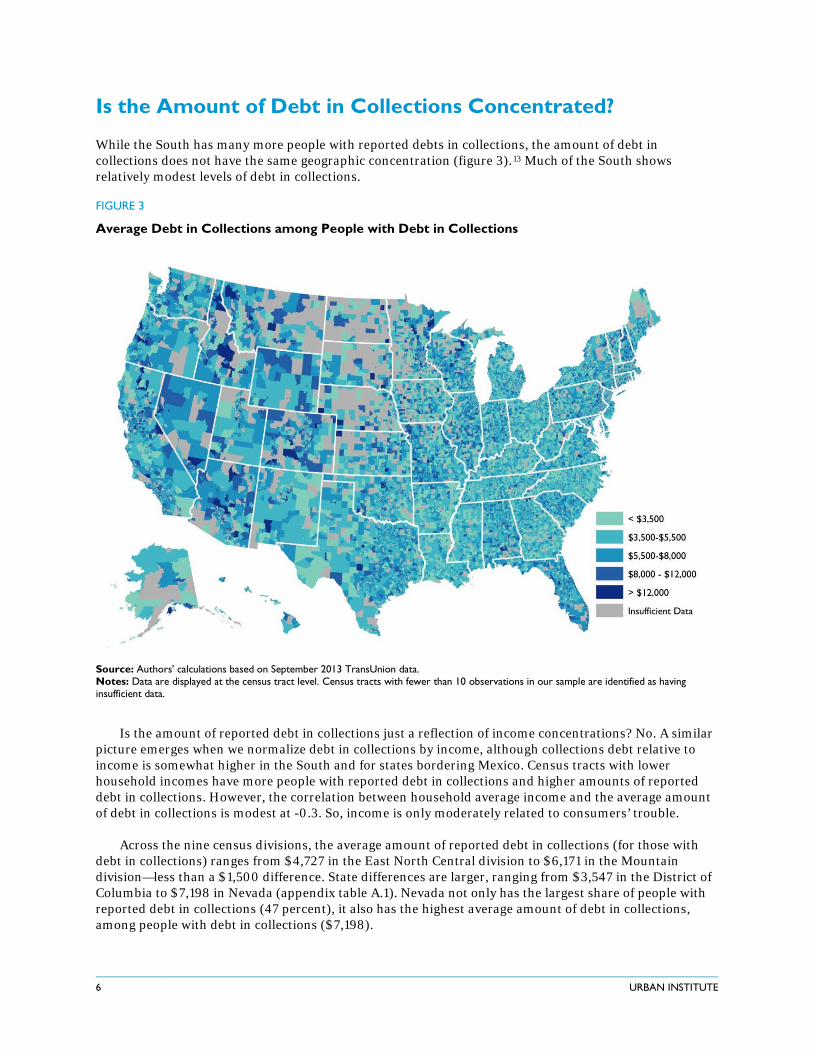
While the South has many more people with reported debts in collections, the amount of debt in collections does not have the same geographic concentration (figure 3).13 Much of the South shows relatively modest levels of debt in collections.
FIGURE 3
Average Debt in Collections among People with Debt in Collections
Source: Authors' calculations based on September 2013 TransUnion data. Notes: Data are displayed at the census tract level. Census tracts with fewer than 10 observations in our sample are identified as having insufficient data.
Is the amount of reported debt in collections just a reflection of income concentrations? No. A similar picture emerges when we normalize debt in collections by income, although collections debt relative to income is somewhat higher in the South and for states bordering Mexico. Census tracts with lower household incomes have more people with reported debt in collections and higher amounts of reported debt in collections. However, the correlation between household average income and the average amount of debt in collections is modest at -0.3. So, income is only moderately related to consumers’ trouble.
Across the nine census divisions, the average amount of reported debt in collections (for those with debt in collections) ranges from $4,727 in the East North Central division to $6,171 in the Mountain division—less than a $1,500 difference. State differences are larger, ranging from $3,547 in the District of Columbia to $7,198 in Nevada (appendix table A.1). Nevada not only has the largest share of people with reported debt in collections (47 percent), it also has the highest average amount of debt in collections, among people with debt in collections ($7,198).
6 URBAN INSTITUTE
Las Vegas, Nevada, is one of only four large MSAs (of the top 100) to have average reported debt in collections of over $7,000. The other three MSAs are in Florida: Deltona-Daytona Beach, Palm Bay, and Cape Coral. Four of the largest 100 MSAs have less than $4,000 in average reported debt in collections: Winston-Salem, North Carolina, Dayton, Ohio, Augusta, Georgia, and Grand Rapids, Michigan.
What Do These Findings Mean?
Financial distress is a daily challenge for millions of American consumers. Nearly 12 million adults—5.3 percent of Americans with a credit file—have non-mortgage debt reported past due, and they need to pay $2,258 on average to become current on that debt.14 Further, an alarming 77 million Americans—35 percent of adults with credit files—have debt in collections reported in their credit files,15 with an average debt amount of nearly $5,178.16 Debt reported past due, and in particular reported debt in collections, is more concentrated in the South.
In addition to creating difficulties today, delinquent debt can lower credit scores and result in serious future consequences. Credit report information is used to determine eligibility for jobs, access to rental housing and mortgages, insurance premiums, and access to (and the price of) credit in general (Federal Trade Commission 2013; Traub 2013).
High levels of delinquent debt and its associated consequences, such as limited access to traditional credit, can harm both families and the communities in which they live. This brief contributes to our understanding of financial distress in America by exploring the spatial patterns of delinquent debt in the United States. Future work will explore the drivers of financial distress and those factors influencing its spatial patterns.
DELINQUENT DEBT IN AMERICA 7
Data and Methodology
Data for this brief come primarily from TransUnion credit bureau records from September 2013. We use a random sample of 7 million individual-level records verified in the past 12 months, or a roughly 3 percent sample of the US adult population. They include only people with a credit file (thick or thin). These data allow us to investigate credit characteristics down to the census tract level.
The credit bureau data are supplemented with measures of mean household income and median home values from the American Community Survey (ACS). We use data from the 2012 ACS for analyses by census division and state. We use the 2008–12 five-year ACS estimates for the census tract–level analyses, to maintain sufficient sample size at small geographies. Methods and geography The map figures are created in ArcMap 10 using Jenks natural breaks and are based on census tract–level means. Census tracts are small statistical subdivisions that do not cross county lines and are designed to have approximately 4,000 residents, though the actual number varies widely. Census tract spatial size also varies widely, depending on population density. The 2010 census has just over 73,000 census tracts, and our sample has sufficient data (at least 10 individuals) in over 72,000 tracts. Table 1 presents sample means by census divisions, which are groupings of states that subdivide regions. Definitions • Debt past due is the total amount of non-mortgage debt that must be paid for the accountholder to be current on all non-
mortgage trades. Non-mortgage trades include the total balance of open trades, excluding mortgages, as well as trade lines that have been closed but not charged off into collections.a Non-mortgage trades can include credit cards, student loans, automobile loans, other installment loans, home equity lines of credit, and some utility bills.
• Debt in collections includes trade lines (e.g., credit cards) that were previously past due and have been closed and charged off. Debt in collections can also originate from unpaid bills (e.g., medical bill, utility bill, parking ticket, child support, membership fees) that are reported to the credit bureau. Debts in collection include these various forms of non-mortgage debt. While mortgage debt could result in collections activity, it is very rare.
Trimming Each component of total debt (mortgage trades, non-mortgage trades, and debt in collections) is trimmed at roughly 0.1 percent at the top of the distribution. We then remove individuals from each component if they are trimmed in any one component, creating a 0.25 percent trim off the total sample. Debt past due is trimmed separately, at 0.1 percent.
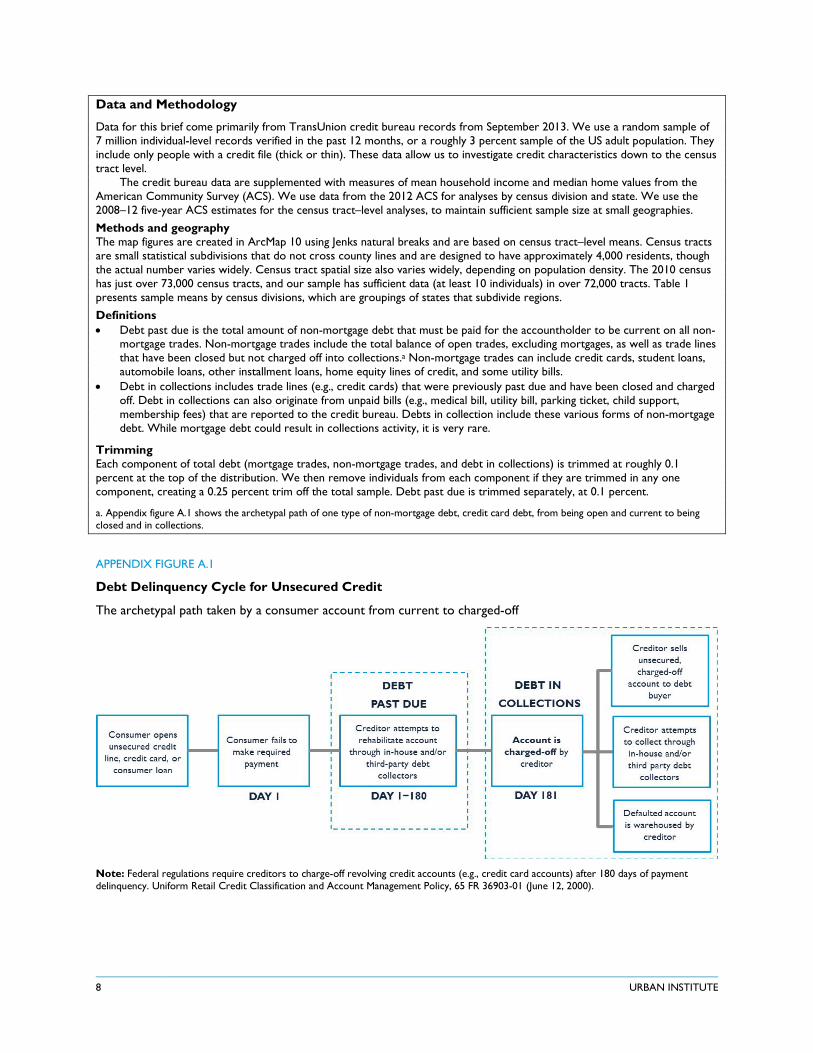
a. Appendix figure A.1 shows the archetypal path of one type of non-mortgage debt, credit card debt, from being open and current to being closed and in collections.
APPENDIX FIGURE A.1
Debt Delinquency Cycle for Unsecured Credit
The archetypal path taken by a consumer account from current to charged-off
Note: Federal regulations require creditors to charge-off revolving credit accounts (e.g., credit card accounts) after 180 days of payment delinquency. Uniform Retail Credit Classification and Account Management Policy, 65 FR 36903-01 (June 12, 2000).
8 URBAN INSTITUTE
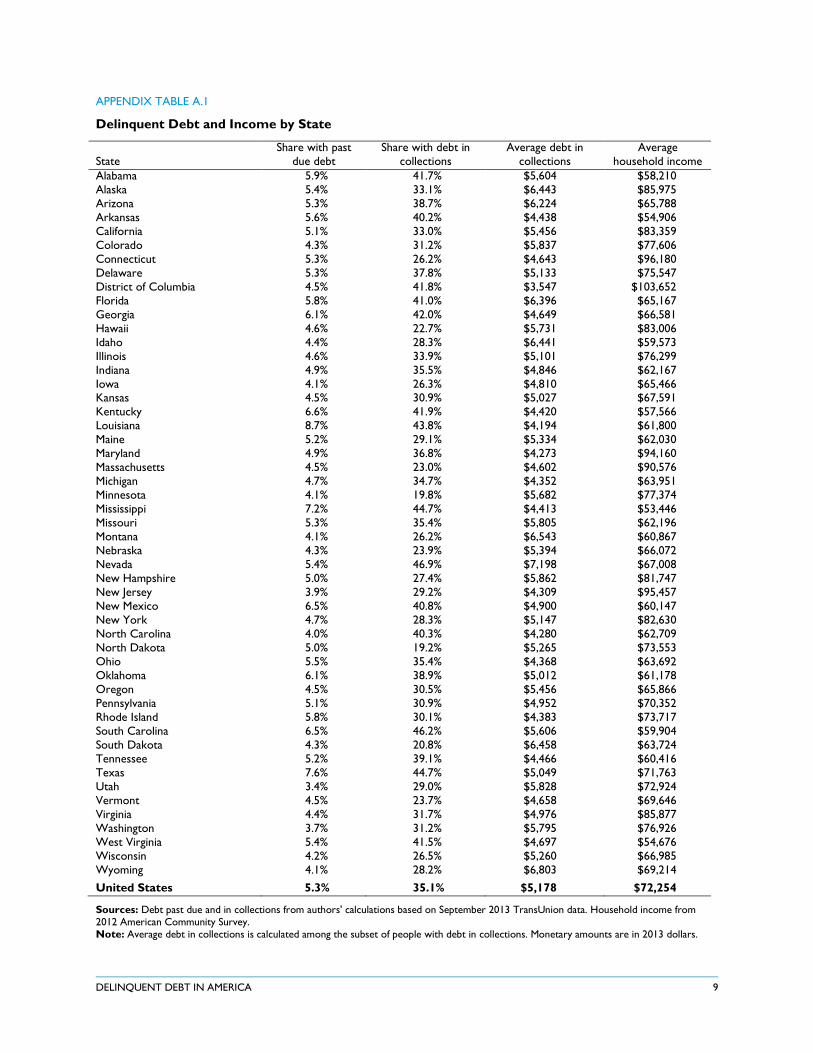
APPENDIX TABLE A.1
Delinquent Debt and Income by State
State Share with past
due debt Share with debt in
collections Average debt in
collections Average
household income Alabama 5.9% 41.7% $5,604 $58,210 Alaska 5.4% 33.1% $6,443 $85,975 Arizona 5.3% 38.7% $6,224 $65,788 Arkansas 5.6% 40.2% $4,438 $54,906 California 5.1% 33.0% $5,456 $83,359 Colorado 4.3% 31.2% $5,837 $77,606 Connecticut 5.3% 26.2% $4,643 $96,180 Delaware 5.3% 37.8% $5,133 $75,547 District of Columbia 4.5% 41.8% $3,547 $103,652 Florida 5.8% 41.0% $6,396 $65,167 Georgia 6.1% 42.0% $4,649 $66,581 Hawaii 4.6% 22.7% $5,731 $83,006 Idaho 4.4% 28.3% $6,441 $59,573 Illinois 4.6% 33.9% $5,101 $76,299 Indiana 4.9% 35.5% $4,846 $62,167 Iowa 4.1% 26.3% $4,810 $65,466 Kansas 4.5% 30.9% $5,027 $67,591 Kentucky 6.6% 41.9% $4,420 $57,566 Louisiana 8.7% 43.8% $4,194 $61,800 Maine 5.2% 29.1% $5,334 $62,030 Maryland 4.9% 36.8% $4,273 $94,160 Massachusetts 4.5% 23.0% $4,602 $90,576 Michigan 4.7% 34.7% $4,352 $63,951 Minnesota 4.1% 19.8% $5,682 $77,374 Mississippi 7.2% 44.7% $4,413 $53,446 Missouri 5.3% 35.4% $5,805 $62,196 Montana 4.1% 26.2% $6,543 $60,867 Nebraska 4.3% 23.9% $5,394 $66,072 Nevada 5.4% 46.9% $7,198 $67,008 New Hampshire 5.0% 27.4% $5,862 $81,747 New Jersey 3.9% 29.2% $4,309 $95,457 New Mexico 6.5% 40.8% $4,900 $60,147 New York 4.7% 28.3% $5,147 $82,630 North Carolina 4.0% 40.3% $4,280 $62,709 North Dakota 5.0% 19.2% $5,265 $73,553 Ohio 5.5% 35.4% $4,368 $63,692 Oklahoma 6.1% 38.9% $5,012 $61,178 Oregon 4.5% 30.5% $5,456 $65,866 Pennsylvania 5.1% 30.9% $4,952 $70,352 Rhode Island 5.8% 30.1% $4,383 $73,717 South Carolina 6.5% 46.2% $5,606 $59,904 South Dakota 4.3% 20.8% $6,458 $63,724 Tennessee 5.2% 39.1% $4,466 $60,416 Texas 7.6% 44.7% $5,049 $71,763 Utah 3.4% 29.0% $5,828 $72,924 Vermont 4.5% 23.7% $4,658 $69,646 Virginia 4.4% 31.7% $4,976 $85,877 Washington 3.7% 31.2% $5,795 $76,926 West Virginia 5.4% 41.5% $4,697 $54,676 Wisconsin 4.2% 26.5% $5,260 $66,985 Wyoming 4.1% 28.2% $6,803 $69,214 United States 5.3% 35.1% $5,178 $72,254
Sources: Debt past due and in collections from authors' calculations based on September 2013 TransUnion data. Household income from 2012 American Community Survey. Note: Average debt in collections is calculated among the subset of people with debt in collections. Monetary amounts are in 2013 dollars.
DELINQUENT DEBT IN AMERICA 9
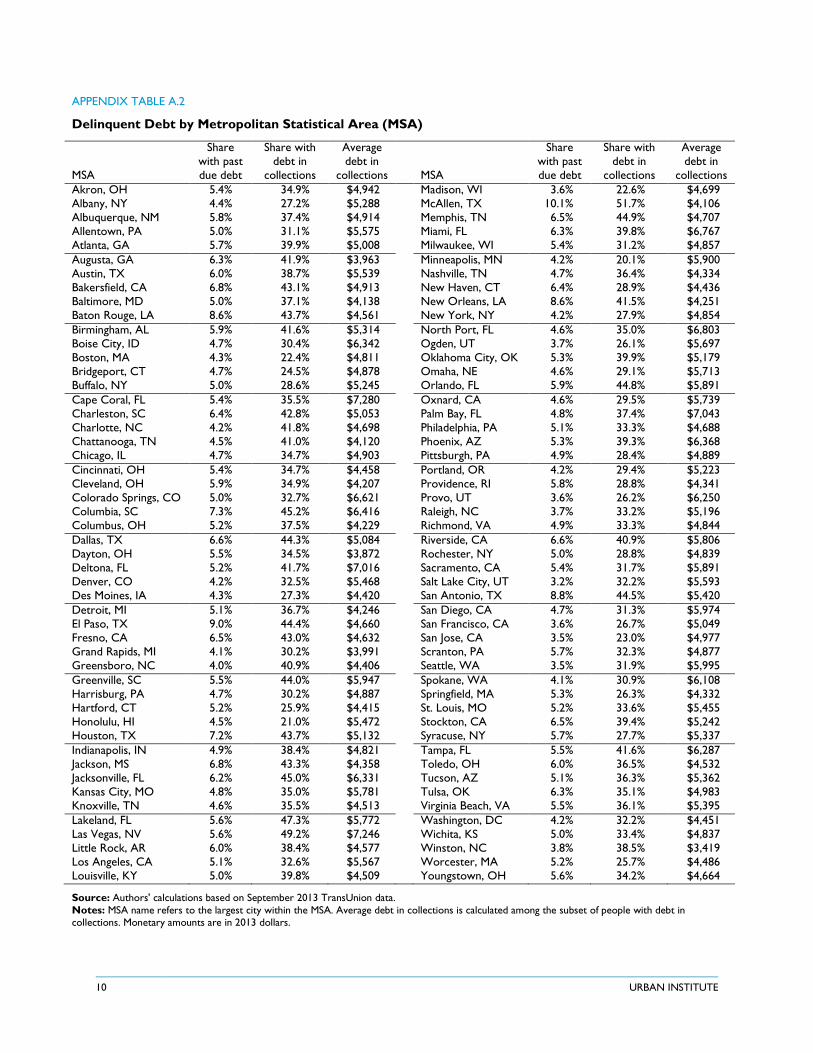
APPENDIX TABLE A.2
Delinquent Debt by Metropolitan Statistical Area (MSA)
MSA
Share with past due debt
Share with debt in
collections
Average debt in
collections
MSA
Share with past due debt
Share with debt in
collections
Average debt in
collections Akron, OH 5.4% 34.9% $4,942 Madison, WI 3.6% 22.6% $4,699 Albany, NY 4.4% 27.2% $5,288 McAllen, TX 10.1% 51.7% $4,106 Albuquerque, NM 5.8% 37.4% $4,914 Memphis, TN 6.5% 44.9% $4,707 Allentown, PA 5.0% 31.1% $5,575 Miami, FL 6.3% 39.8% $6,767 Atlanta, GA 5.7% 39.9% $5,008 Milwaukee, WI 5.4% 31.2% $4,857 Augusta, GA 6.3% 41.9% $3,963 Minneapolis, MN 4.2% 20.1% $5,900 Austin, TX 6.0% 38.7% $5,539 Nashville, TN 4.7% 36.4% $4,334 Bakersfield, CA 6.8% 43.1% $4,913 New Haven, CT 6.4% 28.9% $4,436 Baltimore, MD 5.0% 37.1% $4,138 New Orleans, LA 8.6% 41.5% $4,251 Baton Rouge, LA 8.6% 43.7% $4,561 New York, NY 4.2% 27.9% $4,854 Birmingham, AL 5.9% 41.6% $5,314 North Port, FL 4.6% 35.0% $6,803 Boise City, ID 4.7% 30.4% $6,342 Ogden, UT 3.7% 26.1% $5,697 Boston, MA 4.3% 22.4% $4,811 Oklahoma City, OK 5.3% 39.9% $5,179 Bridgeport, CT 4.7% 24.5% $4,878 Omaha, NE 4.6% 29.1% $5,713 Buffalo, NY 5.0% 28.6% $5,245 Orlando, FL 5.9% 44.8% $5,891 Cape Coral, FL 5.4% 35.5% $7,280 Oxnard, CA 4.6% 29.5% $5,739 Charleston, SC 6.4% 42.8% $5,053 Palm Bay, FL 4.8% 37.4% $7,043 Charlotte, NC 4.2% 41.8% $4,698 Philadelphia, PA 5.1% 33.3% $4,688 Chattanooga, TN 4.5% 41.0% $4,120 Phoenix, AZ 5.3% 39.3% $6,368 Chicago, IL 4.7% 34.7% $4,903 Pittsburgh, PA 4.9% 28.4% $4,889 Cincinnati, OH 5.4% 34.7% $4,458 Portland, OR 4.2% 29.4% $5,223 Cleveland, OH 5.9% 34.9% $4,207 Providence, RI 5.8% 28.8% $4,341 Colorado Springs, CO 5.0% 32.7% $6,621 Provo, UT 3.6% 26.2% $6,250 Columbia, SC 7.3% 45.2% $6,416 Raleigh, NC 3.7% 33.2% $5,196 Columbus, OH 5.2% 37.5% $4,229 Richmond, VA 4.9% 33.3% $4,844 Dallas, TX 6.6% 44.3% $5,084 Riverside, CA 6.6% 40.9% $5,806 Dayton, OH 5.5% 34.5% $3,872 Rochester, NY 5.0% 28.8% $4,839 Deltona, FL 5.2% 41.7% $7,016 Sacramento, CA 5.4% 31.7% $5,891 Denver, CO 4.2% 32.5% $5,468 Salt Lake City, UT 3.2% 32.2% $5,593 Des Moines, IA 4.3% 27.3% $4,420 San Antonio, TX 8.8% 44.5% $5,420 Detroit, MI 5.1% 36.7% $4,246 San Diego, CA 4.7% 31.3% $5,974 El Paso, TX 9.0% 44.4% $4,660 San Francisco, CA 3.6% 26.7% $5,049 Fresno, CA 6.5% 43.0% $4,632 San Jose, CA 3.5% 23.0% $4,977 Grand Rapids, MI 4.1% 30.2% $3,991 Scranton, PA 5.7% 32.3% $4,877 Greensboro, NC 4.0% 40.9% $4,406 Seattle, WA 3.5% 31.9% $5,995 Greenville, SC 5.5% 44.0% $5,947 Spokane, WA 4.1% 30.9% $6,108 Harrisburg, PA 4.7% 30.2% $4,887 Springfield, MA 5.3% 26.3% $4,332 Hartford, CT 5.2% 25.9% $4,415 St. Louis, MO 5.2% 33.6% $5,455 Honolulu, HI 4.5% 21.0% $5,472 Stockton, CA 6.5% 39.4% $5,242 Houston, TX 7.2% 43.7% $5,132 Syracuse, NY 5.7% 27.7% $5,337 Indianapolis, IN 4.9% 38.4% $4,821 Tampa, FL 5.5% 41.6% $6,287 Jackson, MS 6.8% 43.3% $4,358 Toledo, OH 6.0% 36.5% $4,532 Jacksonville, FL 6.2% 45.0% $6,331 Tucson, AZ 5.1% 36.3% $5,362 Kansas City, MO 4.8% 35.0% $5,781 Tulsa, OK 6.3% 35.1% $4,983 Knoxville, TN 4.6% 35.5% $4,513 Virginia Beach, VA 5.5% 36.1% $5,395 Lakeland, FL 5.6% 47.3% $5,772 Washington, DC 4.2% 32.2% $4,451 Las Vegas, NV 5.6% 49.2% $7,246 Wichita, KS 5.0% 33.4% $4,837 Little Rock, AR 6.0% 38.4% $4,577 Winston, NC 3.8% 38.5% $3,419 Los Angeles, CA 5.1% 32.6% $5,567 Worcester, MA 5.2% 25.7% $4,486 Louisville, KY 5.0% 39.8% $4,509 Youngstown, OH 5.6% 34.2% $4,664
Source: Authors' calculations based on September 2013 TransUnion data. Notes: MSA name refers to the largest city within the MSA. Average debt in collections is calculated among the subset of people with debt in collections. Monetary amounts are in 2013 dollars.
10 URBAN INSTITUTE
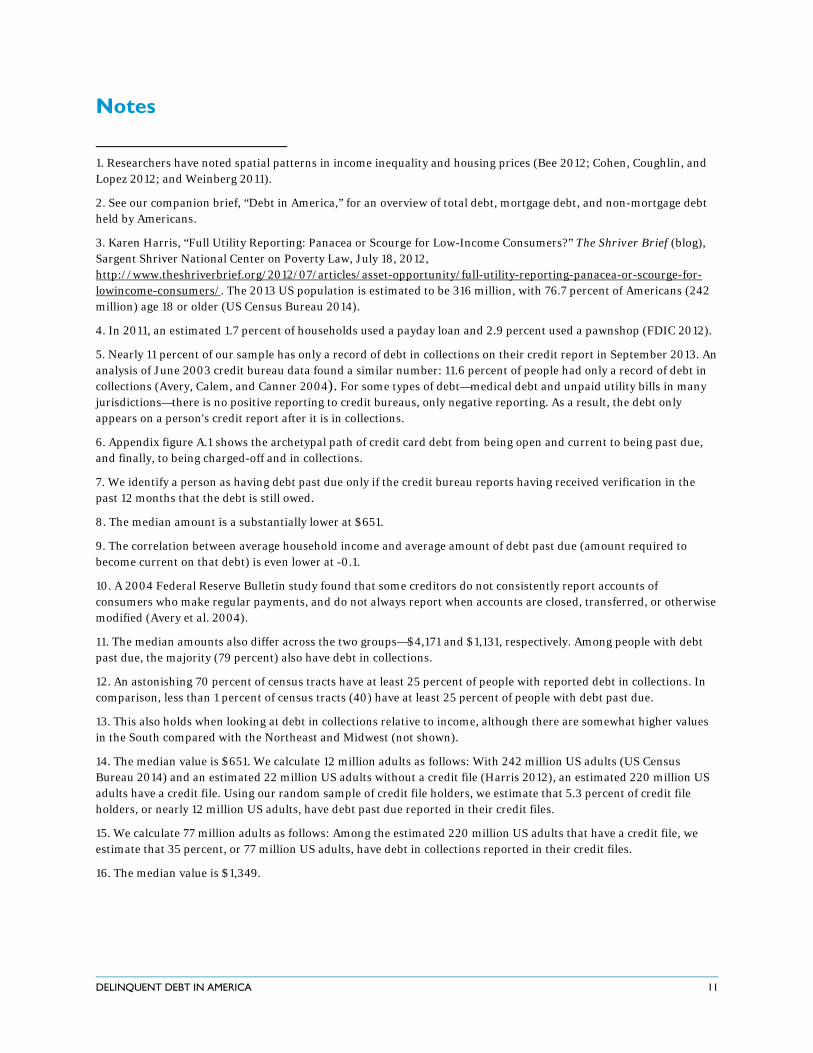
Notes
1. Researchers have noted spatial patterns in income inequality and housing prices (Bee 2012; Cohen, Coughlin, and Lopez 2012; and Weinberg 2011).
2. See our companion brief, “Debt in America,” for an overview of total debt, mortgage debt, and non-mortgage debt held by Americans.
3. Karen Harris, “Full Utility Reporting: Panacea or Scourge for Low-Income Consumers?” The Shriver Brief (blog), Sargent Shriver National Center on Poverty Law, July 18, 2012, http://www.theshriverbrief.org/2012/07/articles/asset-opportunity/full-utility-reporting-panacea-or-scourge-for-lowincome-consumers/. The 2013 US population is estimated to be 316 million, with 76.7 percent of Americans (242 million) age 18 or older (US Census Bureau 2014).
4. In 2011, an estimated 1.7 percent of households used a payday loan and 2.9 percent used a pawnshop (FDIC 2012).
5. Nearly 11 percent of our sample has only a record of debt in collections on their credit report in September 2013. An analysis of June 2003 credit bureau data found a similar number: 11.6 percent of people had only a record of debt in collections (Avery, Calem, and Canner 2004). For some types of debt—medical debt and unpaid utility bills in many jurisdictions—there is no positive reporting to credit bureaus, only negative reporting. As a result, the debt only appears on a person's credit report after it is in collections.
6. Appendix figure A.1 shows the archetypal path of credit card debt from being open and current to being past due, and finally, to being charged-off and in collections.
7. We identify a person as having debt past due only if the credit bureau reports having received verification in the past 12 months that the debt is still owed.
8. The median amount is a substantially lower at $651.
9. The correlation between average household income and average amount of debt past due (amount required to become current on that debt) is even lower at -0.1.
10. A 2004 Federal Reserve Bulletin study found that some creditors do not consistently report accounts of consumers who make regular payments, and do not always report when accounts are closed, transferred, or otherwise modified (Avery et al. 2004).
11. The median amounts also differ across the two groups—$4,171 and $1,131, respectively. Among people with debt past due, the majority (79 percent) also have debt in collections.
12. An astonishing 70 percent of census tracts have at least 25 percent of people with reported debt in collections. In comparison, less than 1 percent of census tracts (40) have at least 25 percent of people with debt past due.
13. This also holds when looking at debt in collections relative to income, although there are somewhat higher values in the South compared with the Northeast and Midwest (not shown).
14. The median value is $651. We calculate 12 million adults as follows: With 242 million US adults (US Census Bureau 2014) and an estimated 22 million US adults without a credit file (Harris 2012), an estimated 220 million US adults have a credit file. Using our random sample of credit file holders, we estimate that 5.3 percent of credit file holders, or nearly 12 million US adults, have debt past due reported in their credit files.
15. We calculate 77 million adults as follows: Among the estimated 220 million US adults that have a credit file, we estimate that 35 percent, or 77 million US adults, have debt in collections reported in their credit files.
16. The median value is $1,349.
DELINQUENT DEBT IN AMERICA 11
References
Avery, Robert B., Paul S. Calem, and Glenn B. Canner. 2004. “Credit Report Accuracy and Access to Credit.” Federal Reserve Bulletin.
Bee, Adam. 2012. “Household Income Inequality within US Counties: 2006–2010.” American Community Survey brief. Washington, DC: US Census Bureau.
Cohen, Jeffrey P., Cletus C. Coughlin, and David A. Lopez. 2012. “The Boom and Bust of U.S. Housing Prices from Various Geographic Perspectives.” Federal Reserve Bank of St. Louis.
Consumer Financial Protection Bureau. 2013. “CFPB Considers Debt Collection Rules.” Washington, DC.
Federal Deposit Insurance Corporation. 2012. “2011 FDIC National Survey of Unbanked and Underbanked Households.” Washington, DC.
Federal Reserve Bank of New York. 2013. “Quarterly Report on Household Debt and Credit.” Research and Statistics Group, Federal Reserve Bank of New York.
Federal Trade Commission. 2013. “How Credit Scores Affect the Price of Credit and Insurance.” Washington, DC.
McKay, Katherine Lucas. 2014. “Alternative Data Helps Families Build Credit and Wealth.” CFED Federal Policy Brief. Washington DC.
Traub, Amy. 2013. “Discredited: How Employment Credit Checks Keep Qualified Workers Out of a Job.” Demos.
Turner, Michael A., Alyssa Stewart Lee, Ann Schnare, Robin Barghese, and Patrick D. Walker. 2006. “Give Credit Where Credit Is Due.” Washington, DC: Brookings Institution.
Turner, Michael A., Patrick Walker, and Katrina Dusek. 2009. “New to Credit from Alternative Data.” PERC Results and Solutions.
US Census Bureau. 2014. American Community Survey Population Estimates. State and County Quickfacts.
Weinberg, Daniel H. 2011. “US Neighborhood Income Inequality in the 2005–2009 Period.” American Community Survey report. Washington, DC: US Census Bureau.
About the Authors
Caroline Ratcliffe (corresponding author) is a senior fellow in the Center on Labor, Human Services, and Population. Signe-Mary McKernan is a senior fellow in the Center on Labor, Human Services, and Population. Brett Theodos is a senior research associate with the Metropolitan Housing and Communities Policy Center at the Urban Institute. Emma Kalish is a research assistant in the Center on Labor, Human Services, and Population at the Urban Institute.
John Chalekian is vice president, credit risk and research, at Encore Capital Group. Peifang Guo is a lead statistical analyst at Encore Capital Group. Christopher Trepel (corresponding author) is senior vice president and chief scientific officer at Encore Capital Group and the founder and managing director of the Consumer Credit Research Institute.