Embed Size (px)
Citation preview

0 DELICA D:5 ‘ACTIVE GEAR’

1
1. FY2017 1Q Results
2. FY2017 1Q Results by Region
3. FY2017 Forecast
4. Initiatives for the Future
2
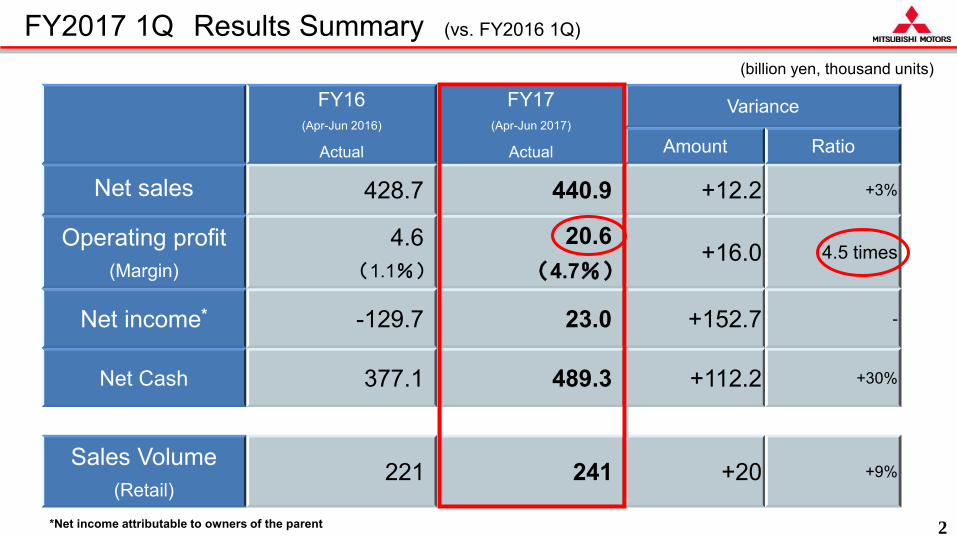
(billion yen, thousand units)
FY2017 1Q Results Summary (vs. FY2016 1Q)
FY16 (Apr-Jun 2016)
Actual
FY17 (Apr-Jun 2017)
Actual
Variance
Amount Ratio
Net sales 428.7 440.9 +12.2 +3%
Operating profit (Margin)
4.6 (1.1%)
20.6 (4.7%)
+16.0 4.5 times
Net income* -129.7 23.0 +152.7 -
Net Cash 377.1 489.3 +112.2 +30%
Sales Volume (Retail)
221 241 +20 +9%
*Net income attributable to owners of the parent

3
FY2017 1Q Analysis of Increase/Decrease of Operating Profit (vs. FY2016 1Q )
FY16 (Apr-Jun 2016)
Actual
46 +2.6
Forex Others Vol/Mix Sales expenses
Cost reductions,
etc.
(billion yen)
FY17 (Apr-Jun 2017)
Actual
Forex effect by main currency Forex rate(yen) Effect
(billion yen) FY16 1Q FY17 1Q
USD 111 111 0
EUR 125 122 -1.0
THB 3.09 3.27 -4.1
Others - - -2.4
Total - - -7.5
Vol/Mix by region Japan +3.0
ASEAN +5.3
North Asia +4.0
North America -1.2
Europe -4.0
Others -4.5
Total +2.6
4.6
20.6
+8.4 +18.0
- 7.5 - 5.5
Others
Cost on quality measures in market
+ 20.8
R&D and others -2.8
Total +18.0

4
Operating Profit Margin Changes ~Maintain a V shaped recovery trend~
-6.0
-4.0
-2.0
0.0
2.0
4.0
6.0
8.0
10.0
-60.0
-40.0
-20.0
0.0
20.0
40.0
60.0
80.0
100.0
18.6
39.8 43.6
36.4 58.4
80.0
- 31.6
- 36.2 4.6
28.3
36.7 2Q
1Q
2Q
1Q
4Q
3Q
3Q
4Q
FY2015 FY2016
(1,069.8)
(1,198.0)
(864.9)
(440.9) 5.5%
6.7%
-3.7%
3.5%
8.4
20.6
FY2017
4.7% (1,041.7)
1H Actual 2H Actual 1H Actual 2H Actual
(Operating profit: billion yen) (Margin: %)
( ) : Net sales (billion yen)
1Q Actual

5
FY2017 1Q Balance Sheet Summary
FY16 (end of Mar. 2017)
Actual
FY17 1Q (end of Jun. 2017)
Actual Variance
Total assets 1,484.4 1,444.1 -40.3
Cash and deposits 556.8 519.2 -37.6
Total liabilities 780.9 721.5 -59.4
Interest-bearing debt 15.6 29.9 +14.3
Total net assets 703.5 722.6 +19.1
Shareholders’ Equity (Equity ratio)
690.5 (46.5%)
704.1 (48.8%)
+13.6
Net Cash 541.2 489.3 -51.9
(billion yen)

6
1. FY2017 1Q Results
2. FY2017 1Q Results by Region
3. FY2017 Forecast
4. Initiatives for the Future
7
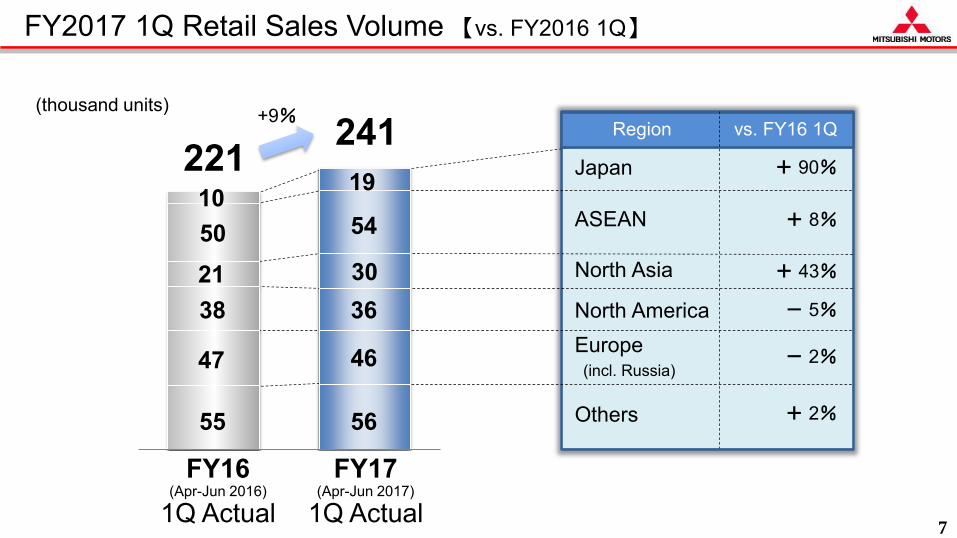
(thousand units)
221 241
+ 90%
- 5%
- 2%
+ 2%
10
38
47
50
55 56
46
36
54
19 + 8%
+ 43%
+9%
21 30
FY16 (Apr-Jun 2016)
1Q Actual
FY17 (Apr-Jun 2017)
1Q Actual
Others
North Asia
Europe North America
Japan
vs. FY16 1Q Region
ASEAN
(incl. Russia)
FY2017 1Q Retail Sales Volume 【vs. FY2016 1Q】

8
10
19
6
4
8
11 Outlander ‘ACTIVE GEAR’ ( Launched in July )
FY16 (Apr-Jun 2016)
Actual FY17
(Apr-Jun 2017)
Actual
Registered vehicles
Mini cars
Retail sales volume: 19,000 units
・ Volume substantially dropped due to improper fuel economy testing
・ Both registered vehicles and mini cars recovered to the FY2015 level
・ Accelerated brand rebuilding
FY2017 1Q Results by Region: Japan
TIV: 1,077 1,204 (+12%)
(+90%)
TIV : According to our research.
Retail sales volume(thousand units)

9
50 16
18
16
12
15
17
54
FY2017 1Q Results by Region: ASEAN
Thailand
Pajero Sport Philippines
Indonesia
Others
Retail sales volume: 54,000 units
Thailand: Economic recovery led to sales recovery
Philippines: Locally produced models expanded
Indonesia: New plant launched smoothly
Preparation in progress for new compact MPV TIV*: 543 550 (+1%)
(+8%)
*:Thailand + Phiilippines + Indonesia
Retail sales volume(thousand units)
6 4
FY16 (Apr-Jun 2016)
Actual FY17
(Apr-Jun 2017)
Actual

10
21 24
6
15
6
30
FY2017 1Q Results by Region: North Asia
China
Outlander
Taiwan etc. Retail sales volume:30,000 units
・China: Sales of Outlander remain strong
・Dealer network expansion accelerated
TIV*: 6.3 M 6.4 M (+2%) *:China
(+43%)
Retail sales volume(thousand units)
FY16 (Apr-Jun 2016)
Actual FY17
(Apr-Jun 2017)
Actual

11
38
27
11
25
11
36
FY2017 1Q Results by Region: North America
U.S.
Canada etc.
Outlander
Retail sales volume: 36,000 units
・ Strong Outlander sales
・ Aim to improve presence in the market
※Changed the regional division of Puerto Rico from “Others” to “North America” from FY2017. According to a this division, revised our figures in this slide.
TIV: 5.5 M 5.4 M (- 2%)
(- 5%)
Retail sales volume(thousand units)
FY16 (Apr-Jun 2016)
Actual FY17
(Apr-Jun 2017)
Actual

12
47
43
4
41
5
46
FY2017 1Q Results by Region: Europe
Western Europe etc.
Russia etc.
ASX
Retail sales volume: 46,000 units
・ In Western Europe Outlander sales declined
・ ASX and Mirage sales increased
・ Demand in Russia on a recovery trend 4.7 M 4.7 M (0%) TIV*:
*:EU + EFTA
(-2%)
Retail sales volume(thousand units)
FY16 (Apr-Jun 2016)
Actual FY17
(Apr-Jun 2017)
Actual

13
55
21
20
24
18
14 14
56
FY2017 1Q Results by Region: Other Regions
Australia/NZ
Latin America
Middle East/Africa
Triton
Retail sales volume: 56,000 units
Australia/NZ: Sales remain strong
Middle East/Africa: Continued sluggish demand
※Changed the regional division of Puerto Rico from “Others” to “North America” from FY2017. According to a this division, revised our figures in this slide.
1,627 1,654 (+2%) TIV*: *:Australia/NZ + Latin America + GCC
(+2%)
Retail sales volume(thousand units)
FY16 (Apr-Jun 2016)
Actual FY17
(Apr-Jun 2017)
Actual

14
1. FY2017 1Q Results
2. FY2017 1Q Results by Region
3. FY2017 Forecast
4. Initiatives for the Future

15
FY16 (Apr 2016-Mar 2017)
Actual
FY17 (Apr 2017-Mar 2018)
Forecast
Variance
Amount Ratio
Net sales 1,906.6 2,000.0 +93.4 +5%
Operating Profit (Margin)
5.1 (0.3%)
70.0 (3.5%)
+64.9 Approx. 14 times
Ordinary Profit 8.9 79.0 +70.1 Approx. 9 times
Net income* -198.5 68.0 +266.5 -
Sales Volume (Retail)
926 1,029 +103 +11%
‐No change from the previous announcement (May 9)‐
FY2017 Full-Year Forecast 【vs. FY2016 Actual】
(billion yen, thousand units)
*Net income attributable to owners of the Parent

16
FY2017 1Q Business performance summary
-4.5 12.2 14.9 16.0
31.0 18.6 4.6 20.6
-1.1%
2.8% 3.6%
3.9%
6.0%
3.7%
1.1%
4.7%
-2.0%
0.0%
2.0%
4.0%
6.0%
8.0%
FY101Q
FY111Q
FY121Q
FY131Q
FY141Q
FY151Q
FY161Q
FY171Q
-20.0
0.0
20.0
40.0
60.0
80.0
(Operating profit:billion yen) (Margin: %) FY10~16 Average
Operating Profit:13.3 billion yen OP Margin:3.0%
Ave: 3.0%
Historical performance(Operating profit / OP margin)
• Business administration practices (monthly PDCA cycle) in place • Create synergies in purchasing by implementing the benchmarking technique
Good start in achieving the plan
※
※:14FY 1Q FX tailwind in Euro and Thai Baht.

17
1. FY2017 1Q Results
2. FY2017 1Q Results by Region
3. FY2017 Forecast
4. Initiatives for the Future

18
Launch of New Products
New Small MPV Eclipse Cross

19
FY16 FY17 FY18 FY19
25.0
40.0
Alliance Update: Synergy effect
Cross Company Teams (CCT): 32 teams study synergy generation in various areas
Image of synergies (billion yen)

20
・Create a new shared warehouse for parts and accessories in Australia ・Undertake distribution and logistics jointly based on a new warehouse
Collaboration in sales finance services
Alliance Update: Sales Finance and Logistics
Collaboration in aftersales/logistics
・By obtaining cooperation from Nissan’s local sales finance subsidiaries, we will develop and provide wholesale and retail financial services for the MMC brand. We have just launched the services in Thailand, which is one of our key markets.
<Services launched> Australia :June~ Canada / New Zealand :July~
<New services to be launched> Thailand :25th July~

21
New Mid-Term Business Plan
Mid-Term Business Plan scheduled to be announced in Autumn
Increase sales volume to 1.25 million units and operating margin of at least 6% by FY2019
FY15 FY16 FY17 Plan
~FY19
(thousand units) Sales Volume (Retail)
25% UP 1,000
FY15 FY16 FY17 Plan
~FY19
6% or more
(%) Operating Profit Margin
6
0
21

22
Appendix

23
Net Sales FY16 1Q Actual
(’16/4-’16/6)
FY17 1Q Actual
(’17/4-’17/6) Variance
Total 428.7 440.9 +12.2
- Japan 45.7 75.4 +29.7
- ASEAN 78.7 106.6 +27.9
- North Asia 15.2 27.4 +12.2
- North America 77.4 69.8 -7.6
- Europe 106.7 74.7 -32.0
- Others 105.0 87.0 -18.0
Operating Profit FY16 1Q Actual
(’16/4-’16/6)
FY17 1Q Actual
(’17/4-’17/6) Variance
4.6 20.6 +16.0
-13.1 -7.5 +5.6
11.8 10.7 -1.1
0.4 4.6 +4.2
3.9 3.3 -0.6
-4.7 0.2 +4.9
6.3 9.3 +3.0
FY2017 1Q Regional Forecast (vs. FY2016 1Q)
(billion yen)
※Changed the regional division of Puerto Rico from “Others” to “North America” from FY2017. According to a this division, revised our figures in this slide.

24
FY16 1Q (Apr-Jun 2016)
Actual
FY17 1Q (Apr-Jun 2017)
Actual
FY17 (Apr 2017-Mar 2018)
Forecasts
Capital expenditure (YoY)
8.8 (-11%)
12.9 (+47%)
100.0 (+72%)
Depreciation (YoY)
11.8 (-9%)
11.1 (-6%)
53.0 (+15%)
R&D expense (YoY)
20.0 (+10%)
20.7 (+4%)
107.0 (+20%)
Capital expenditure / Depreciation / R&D expense
(billion yen)

25
48 32
47 43
80
44
100
42
106
144 148
18
161
23
165
179 188
206
109
255
134 315
389
71 54 57
72
208 214
83 85
+ 10 (+ 13%)
+ 4 (+ 3%)
+ 9 (+ 5%)
+ 74 (+ 23%)
+ 6 (+ 3%)
90 ※
FY2017 Sales Volume Forecast by Region (retail, vs. FY2016)
Japan North America Europe Asia Others FY17(Forecast)vs. FY16
(thousand units)
Registered Vehicles
Mini cars
U.S.
Canada & others
Western Europe
& others
Russia & others
ASEAN Latin America
Middle East & Africa
Australia & NZ
North Asia
※
FY17 Forecast
FY16 Actual
FY16 Actual
FY17 Forecast
FY17 Forecast
FY16 Actual
FY17 Forecast
FY16 Actual
FY17 Forecast
FY16 Actual
~ Sales volume increase mainly in ASEAN, North Asia and Japan ~
926
+ 103 (+ 11%)
1,029
Total
FY16 Actual
FY17 Forecast
※Changed the regional division of Puerto Rico from “Others” to “North America” from FY2017. According to a this division, revised our figures in this slide.

26
5.1
-5.0
Forex effect by main currency Forex rate(yen) Effect
(billion yen) FY16 FY17
USD 109 105 -8.0
EUR 119 115 -6.0
THB 3.12 3.05 +7.0
Others +2.0
Total - - -5.0
+6.0
70.0
+37.0
+39.0 -12.1
Sales Related Vol/Mix +21.0
Sales Expenses -15.0
Total +6.0
Others Increase of R&D Expenses -18.0
Others +5.9
Total -12.1
Analysis of Increase/Decrease of Operating Profit Forecast (vs. FY2016)
FY16 (’16/4-’17/3)
Actual
FY17 (’17/4-’18/3)
Forecast
Costs on quality measures in market
Others Forex
Material / Manufacturing
Cost Reduction Sales
Related
(billion yen)

27
FY16 Actual FY17 Forecast Variance
Net Sales 1,906.6 2,000.0 +93.4
- Japan 297.3 350.0 +52.7
- North America 297.1 320.0 +22.9
- Europe 433.5 440.0 +6.5
- Asia 433.5 520.0 +86.5
- Others 445.2 370.0 -75.2
FY2017 Regional Forecast (vs. FY2016 )
(billion yen)

28
Preventive Measures to Address Improper Conduct in Fuel Economy Testing Issue: All Measures Completed
(as of Dec.22, 2016)
・ Progress of all 31 measures
74%
Fully implemented
by April 1, 2017
100%
I. We can expect to see the effect at the time the measure is implemented
II. We verify the effect continuously over the next 1 year III. We verify the effect after 3-year ongoing monitoring IV. We verify the effect through employee awareness
surveys
・ Verify the effect of the measures
Implemented: 31
Implemented: 23
Not yet implemented:
8
We will verify the effect continuously and make improvements, as needed, to increase effectiveness of the measures.
(Progress report submitted to MLIT on July 3)
Categorize the measures into the following 4 groups for ongoing follow-up
・The remaining portion of tax breaks for eco-friendly vehicles had been returned in full by July 25.

29
All statements herein, other than historical facts, contain forward-looking statements and are based on MMC’s current forecasts, expectations, targets, plans, and evaluations. Any forecasted value is calculated or obtained based on certain assumptions. Forward-looking statements involve inherent risks and uncertainties. A number of significant factors could therefore cause actual results to differ from those contained in any forward-looking statement. Significant risk factors include: •Feasibility of each target and initiative as laid out in this presentation; •Fluctuations in interest rates, exchange rates and oil prices; •Changes in laws, regulations and government policies; and •Regional and/or global socioeconomic changes. Potential risks and uncertainties are not limited to the above and MMC is not under any obligation to update the information in this presentation to reflect any developments or events in the future. If you are interested in investing in Mitsubishi Motors, you are requested to make a final investment decision at your own risk, taking the foregoing into consideration. Please note that neither Mitsubishi Motors nor any third party providing information shall be responsible for any damage you may suffer due to investment in Mitsubishi Motors based on the information shown in this presentation.