Embed Size (px)
Citation preview
Delft University of Technology
The implications of intermediate stop operations on aviation emissions and climate
Linke, F.; Grewe, Volker; Gollnick, V
DOI10.1127/metz/2017/0763Publication date2017Document VersionPublisher's PDF, also known as Version of recordPublished inMeteorologische Zeitschrift
Citation (APA)Linke, F., Grewe, V., & Gollnick, V. (2017). The implications of intermediate stop operations on aviationemissions and climate. Meteorologische Zeitschrift. DOI: 10.1127/metz/2017/0763
Important noteTo cite this publication, please use the final published version (if applicable).Please check the document version above.
CopyrightOther than for strictly personal use, it is not permitted to download, forward or distribute the text or part of it, without the consentof the author(s) and/or copyright holder(s), unless the work is under an open content license such as Creative Commons.
Takedown policyPlease contact us and provide details if you believe this document breaches copyrights.We will remove access to the work immediately and investigate your claim.
This work is downloaded from Delft University of Technology.For technical reasons the number of authors shown on this cover page is limited to a maximum of 10.

BMeteorologische Zeitschrift, PrePub DOI 10.1127/metz/2017/0763 TAC4© 2017 The authors
The Implications of Intermediate Stop Operations onAviation Emissions and ClimateFlorian Linke1∗, Volker Grewe2,3 and Volker Gollnick1
1Deutsches Zentrum für Luft- und Raumfahrt, Einrichtung Lufttransportsysteme, Hamburg, Germany2Deutsches Zentrum für Luft- und Raumfahrt, Institut für Physik der Atmosphäre, Oberpfaffenhofen, Germany3also at: Delft University of Technology, Faculty of Aerospace Engineering, Section Aircraft Noise & ClimateEffects, The Netherlands
(Manuscript received December 15, 2015; in revised form August 5, 2016; accepted November 15, 2016)
AbstractAmong the various transport modes aviation’s impact on climate change deserves special attention. Due totypical flight altitudes in the upper troposphere and above, the effect of aircraft engine emissions like e.g.water vapour, nitrogen oxides and aerosols on radiative forcing agents is substantial. The projected doublingof aircraft movements in the next 15 years will lead to an increase of aviation’s impact on climate and requiresimmediate mitigation options. Besides technological measures also new operational strategies are widelydiscussed; one of these concepts which has been subject of several studies in the past is Intermediate StopOperations (ISO). It is based on the idea to reduce the stage length of flights by performing one or moreintermediate landings during a mission. Here, we analyse the ISO concept by combining different models,which include a realistic traffic simulation taking into account operational constraints and ambient conditions,like e.g. wind, the calculation of engine emissions and the integration of a climate response model. We analysethe ISO concept for today’s worldwide aircraft fleet, including its influence on global emissions distributionsas well as the impact on climate change by taking into account CO2 and non-CO2 effects, arising fromcontrail-cirrus, water vapour and nitrogen oxide emissions. We show in agreement with earlier findings thatdue to shorter flight distances the amount of fuel burnt over the mission can be reduced by roughly 5 % onaverage globally. For the first time, we quantify the climate impact of ISO, where the flight trajectory isoptimised for fuel use and the aircraft is not redesigned for the ISO procedure. We find an increased warmingeffect, which arises from nitrogen oxide and water vapour emissions, which are released at higher cruisealtitudes and which over-compensate reduced warming effects from CO2 and contrail-cirrus. However, weexpect a climate impact reduction for ISO even with existing aircraft, avoiding the higher flight altitude in thefirst flight segment and hence reducing the fuel savings. Thus, climate impact benefits could be achieved iflower fuel savings were acceptable. Moreover, this negative climate impact is found for the particular case ofintroducing ISO using the current wide-body fleet. It does not necessarily apply to the adoption of ISO usingaircraft redesigned for a shorter range.
Keywords: Intermediate Stop Operations, Staging, emission inventory, climate assessment, operationalconcept, mitigation strategies, system-wide analysis
1 Introduction
As aircraft most of the time cruise at high altitudes inthe upper troposphere and lower stratosphere, the effectof gaseous emissions from aviation on radiative forc-ing agents is substantial (Lee et al., 2010; Brasseuret al., 2016). While the effects of CO2 emission on theclimate is generally independent of the emission locus,the effects of non-CO2 emissions are depending on theweather situation (Grewe et al., 2014) as well as onthe cruise altitude (e.g. Gauss et al., 2006; Frömminget al., 2012). Emitted nitrogen oxides produce ozone; thehigher aircraft emit NOx, the larger is its atmosphericresidence time and the more ozone develops (Greweet al., 2002; Søvde et al., 2014). Contrails form whenthe exhaust air gets, during the mixing with the envi-
∗Corresponding author: Florian Linke, DLR Lufttransportsysteme, Hamburg,Germany, [email protected]
ronment, saturated with respect to water and they per-sist when the air is ice-supersaturated (e.g. Schumann,1996). The number of aircraft movements is expectedto double in the next 15 years causing aviation’s im-pact on climate to increase further (Airbus, 2014). Tolimit these effects and to enable a sustainable develop-ment of aviation, immediate mitigation options are re-quired. Such mitigation options include technologicalmeasures like e.g. new combustion technologies, reg-ulatory measures, but also new operational strategies,which change the way aircraft are operated (e.g. May-nard et al., 2015). Among the operational measures thathave been discussed recently are general cruise altitudechanges, i.e. flying at lower cruise altitudes (Frömminget al., 2012; Koch, 2013), selective closure of airspaces(Niklass et al., 2015), changing horizontal flight tracksor optimizing the entire trajectory with respect to the ex-pected climate impact (e.g. Grewe et al., 2014; Lührset al., 2016). These studies have shown that the options
© 2017 The authorsDOI 10.1127/metz/2017/0763 Gebrüder Borntraeger Science Publishers, Stuttgart, www.borntraeger-cramer.com
2 F. Linke et al.: The Implications of ISO on Aviation Emissions and Climate Meteorol. Z., PrePub Article, 2017
can reduce the climate impact of flight operations sig-nificantly for only comparably small cost penalties. An-other such concept, which is often referred to as Interme-diate Stop Operations (ISO), suggests that aircraft oper-ators conduct intermediate landings during a mission toreduce the stage length of flights. By refueling the air-craft at a stopover location the amount of fuel burnt overthe entire mission can be reduced, as some fuel neces-sary to transport the remaining fuel over a longer dis-tance can be omitted.
The ISO concept has been subject of some studies inthe past, ranging from generic analyses of single mis-sions based on aircraft design methods to investigationson fleet as well as global level. The focus of these stud-ies was mainly to evaluate the potential fuel savingsthat can be gained by the concept, but partly the au-thors also looked into the effects on flight times, costs(both single flight operating costs and lifecycle costs)and safety. In some studies it was found that fuel sav-ings are in the order of 13–23 % (the longer the mission,the more fuel could be saved) for missions with a singlestopover if aircraft are used that are optimized for shorterranges (Martinez-Val et al., 2011; Lammering et al.,2011; Langhans et al., 2010; Creemers and Slinger-land, 2007). These findings were mainly obtained frompayload-range efficiency considerations that have beenderived from aircraft design relationships as provided bytext books. Similar analyses have been done with currentaircraft; here it was found that 5–15 % fuel can be saveddepending on the aircraft type and mission length (Poll,2011; Lammering et al., 2011; Langhans et al., 2010;Creemers and Slingerland, 2007). For these analysesit was assumed that stopover airports were ideally lo-cated in the middle of the route, so no real flight and air-port networks were considered in these studies (genericmission level). However, some authors also consideredreal-world conditions; these so-called fleet and globallevel assessments have been conducted by Poll (2011);Langhans et al. (2010); Green (2005); Linke et al.(2011). E.g., assuming a real geographical distributionof possible intermediate airports for flights operated byBoeing 777 or Airbus A330 Langhans et al. (2010) andLinke et al. (2011) found 10–11 % fuel savings glob-ally if the aircraft is redesigned for 3000 NM (roughly5600 km). The aircraft redesign was done using NASA’ssoftware for preliminary aircraft design called FLOPS(Flight Optimization System). The design range wasvaried while other design parameters (like e.g. passen-ger capacity) were kept constant. By analysing the ISOopportunities of the different redesigns in the real flightnetwork it was found that the optimum design range fora new mid-range aircraft optimized for ISO is approxi-mately 3000 NM.
In addition to the positive implications of the ISOconcept on fuel consumption and operating costs manyauthors infer that the concept may consequently reducethe environmental impact of aviation. With regard tothe CO2 footprint this conclusion is valid without fur-ther ado, for a sound understanding of the impact of
the concept’s non-CO2 emissions on the climate, how-ever, a detailed analysis of the changes of quantities anddistribution of individual pollutant species is necessary.Creemers and Slingerland (2007) have estimated aglobal warming potential reduction of 13 % by ISO withoptimized aircraft using a simplified method. For thesefindings it was assumed that flight altitudes of the re-designed aircraft will slightly increase and that the im-pact of CO2, NOx and H2O emissions of one kilogramfuel can be modeled as a function of altitude. As statedabove, system-wide studies taking real-world air trafficand route networks into account have been performedwith a focus on the global fuel saving potential only. Acomprehensive study of the global impact of ISO on theenvironment, i.e. emissions and climate, has not beendone so far. That is the focus of this research.
This paper presents a system-wide analysis of theshort-term environmental impact of Intermediate StopOperations. Due to the global character of the studysmall-scale effects like changes of the local air quality(LAQ) at airports are not considered. The environmen-tal impact is quantified by the amount and the distri-bution of gaseous engine emissions as well as their ef-fect on climate given as Average Temperature Response(ATR). It is assumed that ISO are carried out with thecurrent world-wide aircraft fleet in a real flight and air-port network. All aircraft types and missions that poten-tially benefit from ISO are considered and realistic op-erational influences, including wind, are taken into ac-count. By analysing previous emission inventories it canbe shown that the selected set of flights account for ap-proximately 28 % of the fuel consumption of the globalscheduled air traffic and a similar share of the relevantgaseous emissions like CO2, H2O and NOx. IntroducingISO on these flights thus may have a significant effect onaviation’s fuel consumption and emissions. The appliedmodels are described in detail in Section 2 and the simu-lation set-up is given in Section 3. Results are presentedin Section 4 before they are discussed with respect to themodel assumptions in Section 5.
2 Methodology
A modeling system was developed that allows for theassessment of operational concepts, like e.g. ISO, withrespect to their impact on global emissions and climate.As depicted in Figure 1 this system consists of dif-ferent models. Flight movements are simulated usingthe Trajectory Calculation Module (TCM, Linke, 2008;Lührs, 2013), which computes aircraft trajectories fromlift-off to touch-down applying a kinetic mass-pointmodel that provides simplified equations of motionknown as Total Energy Model. One of the key featuresimplemented in the TCM for the purpose of this re-search is the use of the advanced aircraft performancemodel (APM) BADA (Base of Aircraft Data) version 4,which allows for modeling typical flight operations re-alistically. The BADA 4 models cover the whole flight

Meteorol. Z., PrePub Article, 2017 F. Linke et al.: The Implications of ISO on Aviation Emissions and Climate 3
TOFLcharts
BADA 4
Trajectory
BADA APM Equations
Flight profile optimization
TCM
Atmosphere
Data processing and analysis
METEO, e.g. ECMWF
Wind distributions
Determination ofair distances
Air traffic infrastructure,
e.g. EAD
Flight Planning
Orthodrome Route optimizationconstrained:Dijkstra/A*
unconstrained:Optimal control
ClimateWindTake-off distance
ADI
Missions/scenario
IATAstatistics M
issi
on (O
/D,
A/C
type
, loa
d fa
ctor
)Environment
Emissions Inventory generation
AirClim
Emissionindices:
ICAO EED
Reducedemissionprofiles
Profile reduction(Downsampling)
Generation of reduced emission profiles(Pre-processing)
Inventory
Climatemetrics
NO , HC, COx
CO , H O, SO2 2 x
Figure 1: Schematic diagram of the developed modeling system (abbreviations: A/C – aircraft; O/D – origin/destination; see text for furtheracronyms).
envelope, capture the flight physics more accurately thanprevious model versions and thus can be used to deter-mine e.g. optimized vertical profiles, i.e. optimum alti-tudes and speeds (Mouillet, 2013). Using this capa-bility airline-preferred cruise profiles can be estimatedincluding the location of step climbs depending on theselected step climb strategy and the heading-dependentavailable flight levels. Regarding meteorological datathe TCM can either be used with International StandardAtmosphere conditions or with real atmospheric data inNetCDF or GRIB format that can e.g. be obtained fromthe European Centre for Medium-Range Weather Fore-casts (ECMWF).
The consideration of wind in system-wide analysesof new operational concepts is one of the main contri-butions of the work with respect to the methodology.From an aircraft performance point of view wind affectsthe mission and thus flight time, fuel burn and emis-sions by changing the actual distance the aircraft has tocover, also known as (still) air distance. Whereas tail-wind shortens the air distance of a flight for a givenground distance, headwind and crosswind increase it.As the aircraft flies, its (true) airspeed overlays with thewind speed in a vector form; in a crosswind situationsome of the aircraft’s energy is needed to compensatefor the drift by applying a wind correction angle in or-der to maintain a desired course.
For considering the described wind effect a new andhighly efficient method has been developed which isable to process daily wind data and statistically analyse
it resulting in a data set of local wind distributions. Thisdatabase contains discrete wind cases (combinations ofwind speed and direction) and their respective frequencyof occurrence for every point in the grid. This data isused to determine characteristic mean still air distancesfor any given flight route as a basis for system-wideanalyses valid for longer periods of time, e.g. one year(Swaid, 2013; Linke, 2016). These air distances areeventually used in the emission distribution calculationexplained below to account for wind.
Moreover, a flight planning functionality is includedthat provides route optimization capabilities with respectto different criteria. This is useful whenever realistic air-line operations should be modeled. Today, many air-craft operators already follow so-called wind-optimalroutes that minimize flight time and fuel consumptionfor a given mission in the presence of wind. Such wind-optimal routes can be determined either without anyconstraints using an optimal control approach (Lührs,2013) or applying a constraining air traffic services(ATS) route network solving a shortest-path problem(combined Dijkstra/A* method, Swaid, 2014). For thispurpose the model accesses the European AeronauticalInformation Services Database (EAD), a comprehensiveair traffic infrastructure database containing geographi-cal data on airports, waypoints and complete ATS routes.The required take-off field length (TOFL) at a given air-port for predominant temperature and pressure condi-tions can be determined with a TOFL model that is madeup by charts taken from airport compatibility manuals.

4 F. Linke et al.: The Implications of ISO on Aviation Emissions and Climate Meteorol. Z., PrePub Article, 2017
For the environmental analysis the modeling systemincludes an emission model that determines the gaseousemissions along resulting trajectories from TCM. Here,both emission species that are produced proportionallyto fuel burn, i.e. CO2, H2O, as well as species that de-velop in a non-proportional way, i.e. NOx, HC and CO,are determined. For the latter the state-of-the-art fuelflow correlation method Boeing Fuel Flow Method 2(DuBois and Paynter, 2006) is applied in combinationwith Emission Indices for sea level conditions obtainedfrom the Engine Emission Databank (EED) by the In-ternational Civil Aviation Organization (ICAO). After-wards, these emission distributions can be mapped intoa geographical grid, which allows for the generation ofemission inventories by superposing the emissions ofa large number of flights. These inventories are thenused by the climate-chemistry response model AirClim(Grewe and Stenke, 2008; Dahlmann et al., 2016) todetermine the climate impact resulting from the emis-sions. The basis of this method constitute atmosphericconcentration changes of radiative forcing agents as afunction of latitude and altitude caused by unit emis-sions, which were pre-calculated using the complexclimate-chemistry model ECHAM4.L39(DLR)/CHEM(Hein et al., 2001) as well as the corresponding radiativeforcing (RF). The model has been evaluated with respectto concentration changes of water vapour and ozone, andespecially RF values for changes in the flight altitudeby comparing AirClim results with results from detailedatmosphere-chemistry models (Grewe and Stenke,2008; Grewe and Dahlmann, 2012; Dahlmann et al.,2016). In addition, a comparison of the vertical sen-sitivity of aircraft emissions on the RF between Air-Clim, LEEA (Köhler et al., 2008; Rädel and Shine,2008) and E39CA has been performed in Grewe andDahlmann (2012). The results clearly show a goodrepresentation of the RF response caused by altitudechanges agreeing within a range of ±10 % for ozone,contrails and ±15 % for water vapour. The model hasbeen previously applied to assess the climate impact ofaircraft designs and trajectory options in a variety ofstudies (Grewe et al., 2010; Koch et al., 2012; Greweet al., 2016; Dahlmann et al., 2016).
In order to reduce the necessary number of trajec-tory simulations in the course of a global analysis witha large number of flights the developed modeling sys-tem makes use of a method that is commonly appliedto reduce the complexity during the generation of emis-sion inventories. So-called reduced emission profiles areused that were derived from pre-calculated trajectoriesand emission distributions. For each considered aircrafttype (19 wide-body aircraft types were used that coverthe entire Airbus and Boeing wide-body aircraft fleet),missions of different air distances and load factors havebeen simulated with TCM and the corresponding emis-sion distributions along these trajectories were deter-mined. For all missions it was assumed that the pilotflies as close as possible to the optimum altitude and se-lects the so-called Long-Range Cruise mach number as
appropriate cruise speed. This mach number generallyrepresents a good compromise between fuel consump-tion and flight time. The resulting standardized profilesare then down-sampled and only the relevant aircraftstate parameters (flown air distance, flight time, altitude,fuel flow, emission flows of all species) at the profilevertices are stored into a database. Assuming a linearparameter gradient between each two flight phase ver-tices, from those few points an entire profile can berecreated. An analysis of the errors of all profiles in thedatabase resulting from this linearization has revealedthat it is generally in the order of ±0.1 percent and thuscan be neglected. With given mean air distances deter-mined by the approach described above to consider thewind effect, for each flight the appropriate profile is ob-tained from the database. Finally, the emission profile ismapped into the geographical grid by scaling it accord-ing to the segment-wise air distance values to the respec-tive ground distance and aligning it to the flight path.Thereby, this method accounts for the effect of wind andcan also be used to consider potential horizontal flightinefficiencies. Through the above mentioned combina-tion of trajectory computation, flight planning and en-vironmental analysis capabilities, the modeling systemcan be used to evaluate the environmental effects result-ing from changes of flight and fleet operations (Linke,2016).
3 Study set-up
In this study we apply the modeling system to ana-lyse the implications Intermediate Stop Operations haveon global aviation emissions and climate. For this pur-pose, we generate emission inventories for two scenar-ios and compare them to each other: the reference case ismade up of a large set of flight missions (approximately1.023 million annual flights) in which every mission isconventionally performed as direct flight, whereas theISO case contains for each mission two flight segmentsconnecting the origin to the destination airport via astopover at the refueling airport. As the short-term ef-fects of ISO are of interest in this study, it is assumedthat each ISO mission is performed by the same aircrafttype as used for the direct flight (self-substitution) andno further changes of the aircraft fleet need to be consid-ered. Flight movement data is obtained from Sabre ADI(Airport Data Intelligence, now: Sabre AirVision MarketIntelligence) flight schedule database (http://www.airdi.net) for the first quarter of 2010 and flight frequenciesare scaled up to the period of one year. As previous stud-ies have revealed that only wide-body aircraft actuallyshow a fuel saving potential in self-substitution on mis-sion lengths above 2500 NM (Linke et al., 2012), thisstudy is limited to the global wide-body aircraft fleet. Inorder to estimate aircraft masses region-dependent pas-senger load factors are calculated based on economicsstatistics published regularly by the International AirTransport Association (http://www.iata.org/economics).

Meteorol. Z., PrePub Article, 2017 F. Linke et al.: The Implications of ISO on Aviation Emissions and Climate 5
−100 0 100 200!
0 1000 2000 3000 4000 5000 60000
5000
10000
15000
20000
25000
30000
35000
40000
Range [NM] Rel. change of emissions [%]
Alti
tude
[ft]
Flight profile Emission profile
ISO segmentsDirect flight
FuelFuel, CO , H O, SO2 2 2
COHC
NOX
Figure 2: Change of flight altitudes and vertical emission distribution due to ISO shown on an exemplary 6000 NM mission flown with anAirbus A340-600 aircraft assuming an ideal intermediate landing (in the middle).
In preparation for the inventory calculation, thestopover locations have to be defined; using an exhaus-tive search algorithm for each ISO mission the respec-tive airport is determined by optimization, assuming thatlocation is selected for the stopover which leads to themaximum fuel savings for the specific mission. The air-ports’ geographical coordinates are obtained from theEAD database which is filtered for only major airportswith at least one asphalt-surfaced runway and an instru-ment landing system assuming that certain equipmentneeds to be installed such that commercial wide-bodyairplanes are able to perform an intermediate stop there.Moreover, a minimum runway length needs to be avail-able which is defined by the required TOFL of the air-craft for the given take-off weight (TOW) and the am-bient conditions at the field. The meteorological data istaken from ECMWF for a grid of 0.75° × 0.75° for theperiod of one year (2012). The statistical wind distribu-tions mentioned above are used to account for the effectof wind by considering annual mean air distances be-tween every airport pair. These air distances are used toobtain the respective reduced emission profiles from thedatabase. By projecting these emissions into the ground-based grid additional emissions caused by headwind areattributed to the grid cells; on the contrary, in case of tail-wind by stretching the profiles to match the ground dis-tances, a reduced amount of emissions is assigned to thegrid cells. For the sake of simplicity only orthodromic(great circle) routes are assumed.
4 Results
The introduction of ISO affects the amount and thedistribution of engine exhaust emissions and thus leadsto a change of the climate impact. In the followingthe results of the study are presented. After a principalinvestigation of the emission distribution changes on a
generic mission the results of a system-wide analysis ona global level considering real flight networks, airportlocations and meteorology are given.
4.1 Generic mission profile
Figure 2 shows the vertical flight profile of a standard6000 NM mission simulated with an Airbus A340-600aircraft. A distinct stepped climb cruise from an initialcruise flight level of 33000 ft (FL 330) up to FL 390 canbe observed. As the aircraft weight decreases over timedue to the continuous fuel burn the optimum altitudeof the aircraft increases (Airbus Customer Services,2002). The optimum altitude is defined as the altitude atwhich the aircraft’s specific range becomes maximum.In today’s flight operations step climbs are conductedto follow the optimum altitude as good as possible whileensuring compliance with air traffic management (ATM)constraints. Besides the profile of the direct flight mis-sion, also the profiles of the two resulting flight segmentsfor a flight performing a stopover at the ideal location af-ter 3000 NM are shown. It can be seen that especially thefirst segment has a higher initial cruise flight level thanthe direct flight. The reason for this is the reduced TOWin the ISO case corresponding to a higher optimum alti-tude. Assuming that pilots try to fly as close as possibleto the optimum altitude for fuel economy reasons, thisfact would lead to a shift of cruise emissions by approx-imately 4000 ft upwards (in this example).
The relative changes of the amounts of the differ-ent emission species per altitude layer are also de-picted in the emission profile in Figure 2. In addition,Table 1 shows the emission split between cruise andclimb/descent both for the relative emission amountsand for the emission changes caused by ISO. It can beseen that below cruise there is an increase of CO emis-sions by about 96 % and an increase of HC emissions byapproximately 83 % due to ISO. This can be attributed
6 F. Linke et al.: The Implications of ISO on Aviation Emissions and Climate Meteorol. Z., PrePub Article, 2017
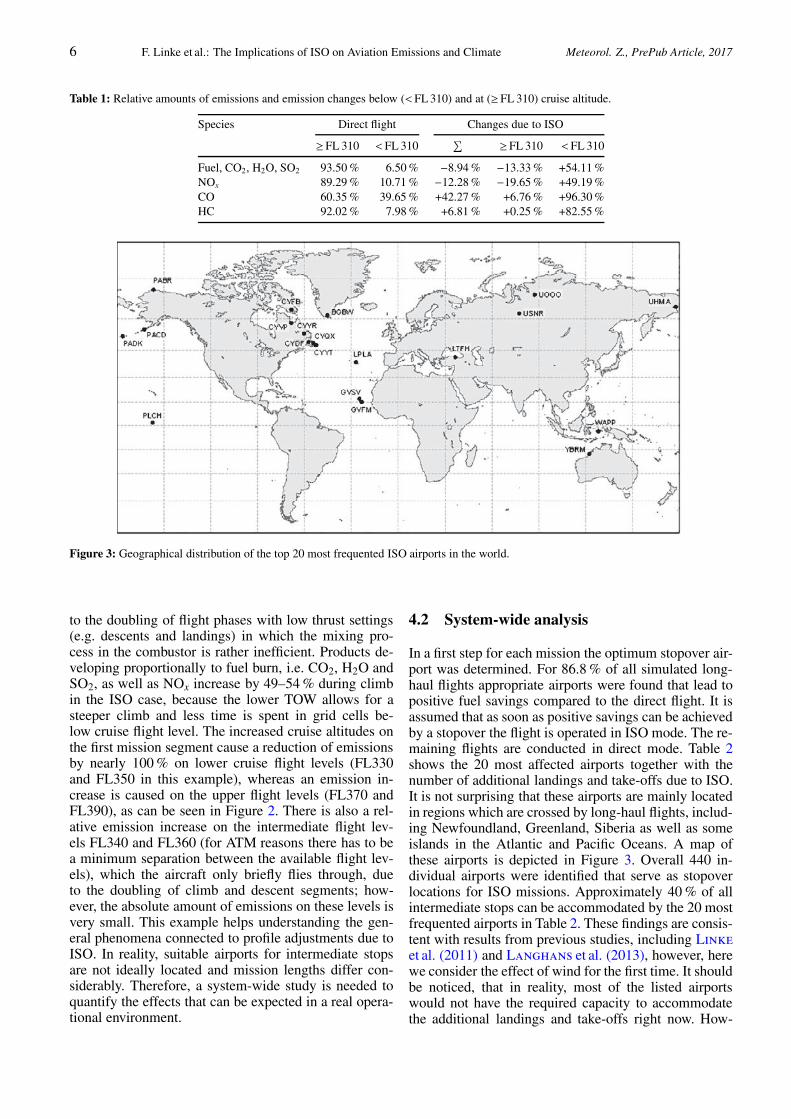
Table 1: Relative amounts of emissions and emission changes below (< FL 310) and at (≥ FL 310) cruise altitude.
Species Direct flight Changes due to ISO
≥ FL 310 < FL 310∑
≥ FL 310 < FL 310
Fuel, CO2, H2O, SO2 93.50 % 6.50 % −8.94 % −13.33 % +54.11 %NOx 89.29 % 10.71 % −12.28 % −19.65 % +49.19 %CO 60.35 % 39.65 % +42.27 % +6.76 % +96.30 %HC 92.02 % 7.98 % +6.81 % +0.25 % +82.55 %
Figure 3: Geographical distribution of the top 20 most frequented ISO airports in the world.
to the doubling of flight phases with low thrust settings(e.g. descents and landings) in which the mixing pro-cess in the combustor is rather inefficient. Products de-veloping proportionally to fuel burn, i.e. CO2, H2O andSO2, as well as NOx increase by 49–54 % during climbin the ISO case, because the lower TOW allows for asteeper climb and less time is spent in grid cells be-low cruise flight level. The increased cruise altitudes onthe first mission segment cause a reduction of emissionsby nearly 100 % on lower cruise flight levels (FL330and FL350 in this example), whereas an emission in-crease is caused on the upper flight levels (FL370 andFL390), as can be seen in Figure 2. There is also a rel-ative emission increase on the intermediate flight lev-els FL340 and FL360 (for ATM reasons there has to bea minimum separation between the available flight lev-els), which the aircraft only briefly flies through, dueto the doubling of climb and descent segments; how-ever, the absolute amount of emissions on these levels isvery small. This example helps understanding the gen-eral phenomena connected to profile adjustments due toISO. In reality, suitable airports for intermediate stopsare not ideally located and mission lengths differ con-siderably. Therefore, a system-wide study is needed toquantify the effects that can be expected in a real opera-tional environment.
4.2 System-wide analysis
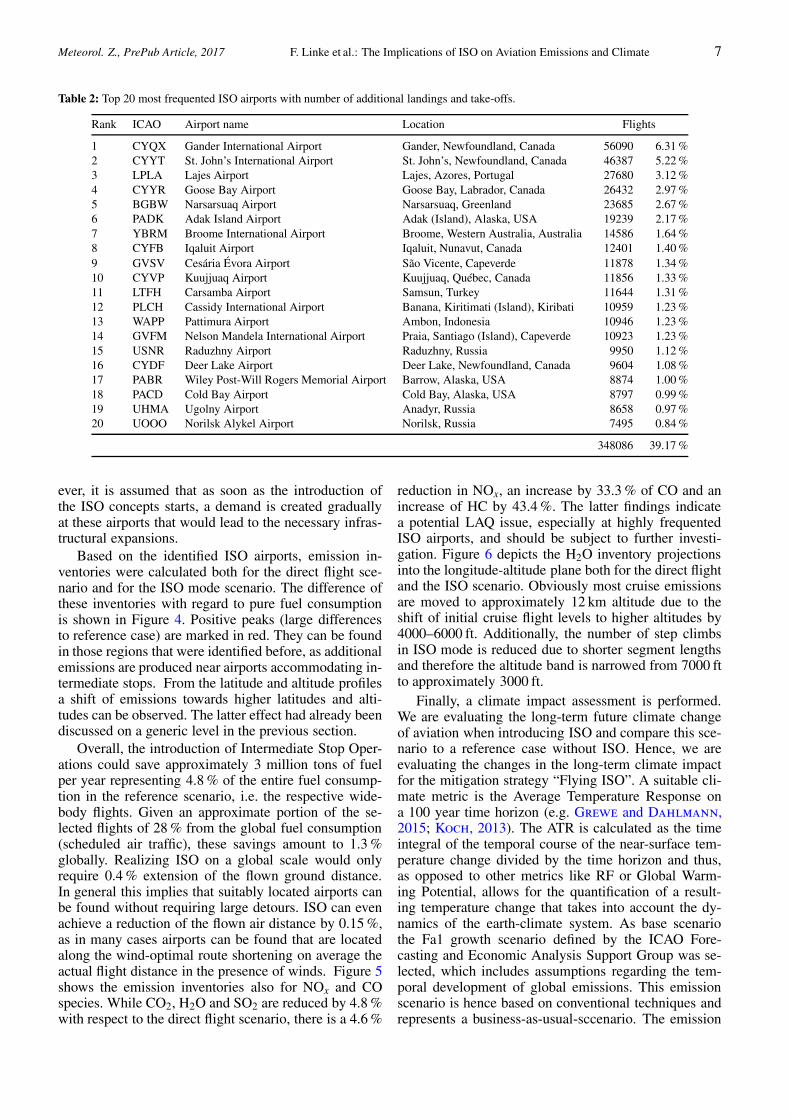
In a first step for each mission the optimum stopover air-port was determined. For 86.8 % of all simulated long-haul flights appropriate airports were found that lead topositive fuel savings compared to the direct flight. It isassumed that as soon as positive savings can be achievedby a stopover the flight is operated in ISO mode. The re-maining flights are conducted in direct mode. Table 2shows the 20 most affected airports together with thenumber of additional landings and take-offs due to ISO.It is not surprising that these airports are mainly locatedin regions which are crossed by long-haul flights, includ-ing Newfoundland, Greenland, Siberia as well as someislands in the Atlantic and Pacific Oceans. A map ofthese airports is depicted in Figure 3. Overall 440 in-dividual airports were identified that serve as stopoverlocations for ISO missions. Approximately 40 % of allintermediate stops can be accommodated by the 20 mostfrequented airports in Table 2. These findings are consis-tent with results from previous studies, including Linkeet al. (2011) and Langhans et al. (2013), however, herewe consider the effect of wind for the first time. It shouldbe noticed, that in reality, most of the listed airportswould not have the required capacity to accommodatethe additional landings and take-offs right now. How-
Meteorol. Z., PrePub Article, 2017 F. Linke et al.: The Implications of ISO on Aviation Emissions and Climate 7
Table 2: Top 20 most frequented ISO airports with number of additional landings and take-offs.
Rank ICAO Airport name Location Flights
1 CYQX Gander International Airport Gander, Newfoundland, Canada 56090 6.31 %2 CYYT St. John’s International Airport St. John’s, Newfoundland, Canada 46387 5.22 %3 LPLA Lajes Airport Lajes, Azores, Portugal 27680 3.12 %4 CYYR Goose Bay Airport Goose Bay, Labrador, Canada 26432 2.97 %5 BGBW Narsarsuaq Airport Narsarsuaq, Greenland 23685 2.67 %6 PADK Adak Island Airport Adak (Island), Alaska, USA 19239 2.17 %7 YBRM Broome International Airport Broome, Western Australia, Australia 14586 1.64 %8 CYFB Iqaluit Airport Iqaluit, Nunavut, Canada 12401 1.40 %9 GVSV Cesária Évora Airport São Vicente, Capeverde 11878 1.34 %10 CYVP Kuujjuaq Airport Kuujjuaq, Québec, Canada 11856 1.33 %11 LTFH Carsamba Airport Samsun, Turkey 11644 1.31 %12 PLCH Cassidy International Airport Banana, Kiritimati (Island), Kiribati 10959 1.23 %13 WAPP Pattimura Airport Ambon, Indonesia 10946 1.23 %14 GVFM Nelson Mandela International Airport Praia, Santiago (Island), Capeverde 10923 1.23 %15 USNR Raduzhny Airport Raduzhny, Russia 9950 1.12 %16 CYDF Deer Lake Airport Deer Lake, Newfoundland, Canada 9604 1.08 %17 PABR Wiley Post-Will Rogers Memorial Airport Barrow, Alaska, USA 8874 1.00 %18 PACD Cold Bay Airport Cold Bay, Alaska, USA 8797 0.99 %19 UHMA Ugolny Airport Anadyr, Russia 8658 0.97 %20 UOOO Norilsk Alykel Airport Norilsk, Russia 7495 0.84 %
348086 39.17 %
ever, it is assumed that as soon as the introduction ofthe ISO concepts starts, a demand is created graduallyat these airports that would lead to the necessary infras-tructural expansions.
Based on the identified ISO airports, emission in-ventories were calculated both for the direct flight sce-nario and for the ISO mode scenario. The difference ofthese inventories with regard to pure fuel consumptionis shown in Figure 4. Positive peaks (large differencesto reference case) are marked in red. They can be foundin those regions that were identified before, as additionalemissions are produced near airports accommodating in-termediate stops. From the latitude and altitude profilesa shift of emissions towards higher latitudes and alti-tudes can be observed. The latter effect had already beendiscussed on a generic level in the previous section.
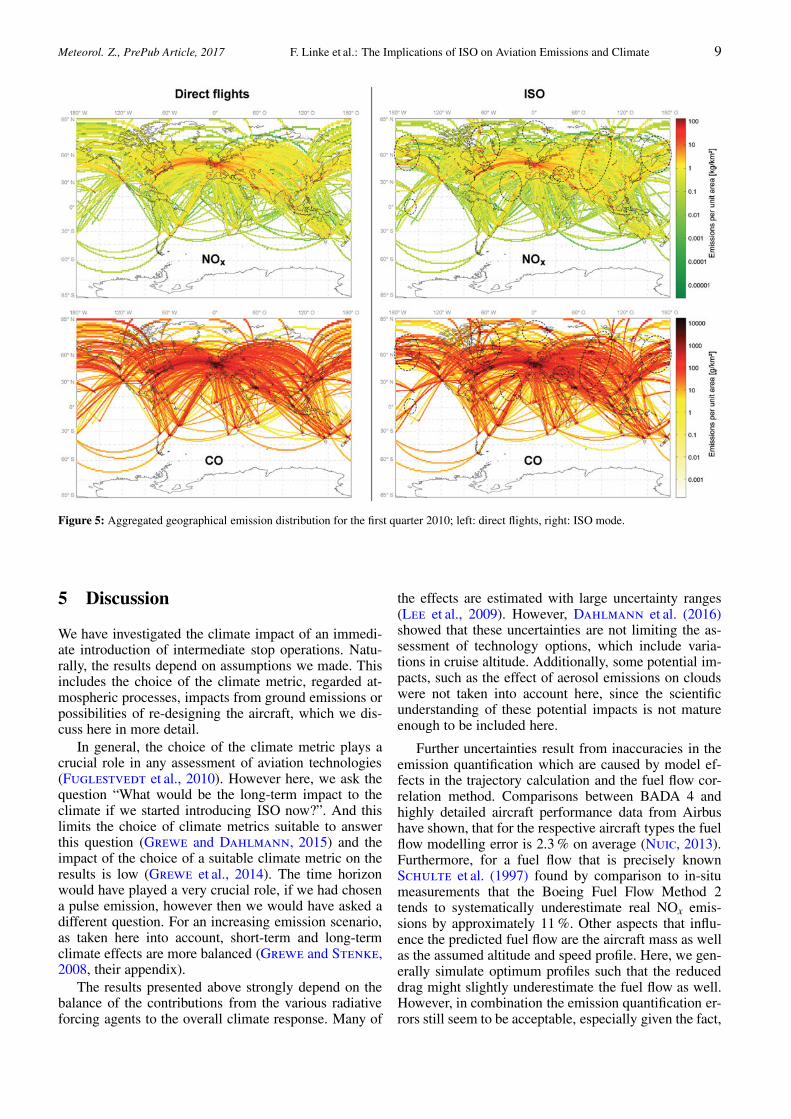
Overall, the introduction of Intermediate Stop Oper-ations could save approximately 3 million tons of fuelper year representing 4.8 % of the entire fuel consump-tion in the reference scenario, i.e. the respective wide-body flights. Given an approximate portion of the se-lected flights of 28 % from the global fuel consumption(scheduled air traffic), these savings amount to 1.3 %globally. Realizing ISO on a global scale would onlyrequire 0.4 % extension of the flown ground distance.In general this implies that suitably located airports canbe found without requiring large detours. ISO can evenachieve a reduction of the flown air distance by 0.15 %,as in many cases airports can be found that are locatedalong the wind-optimal route shortening on average theactual flight distance in the presence of winds. Figure 5shows the emission inventories also for NOx and COspecies. While CO2, H2O and SO2 are reduced by 4.8 %with respect to the direct flight scenario, there is a 4.6 %
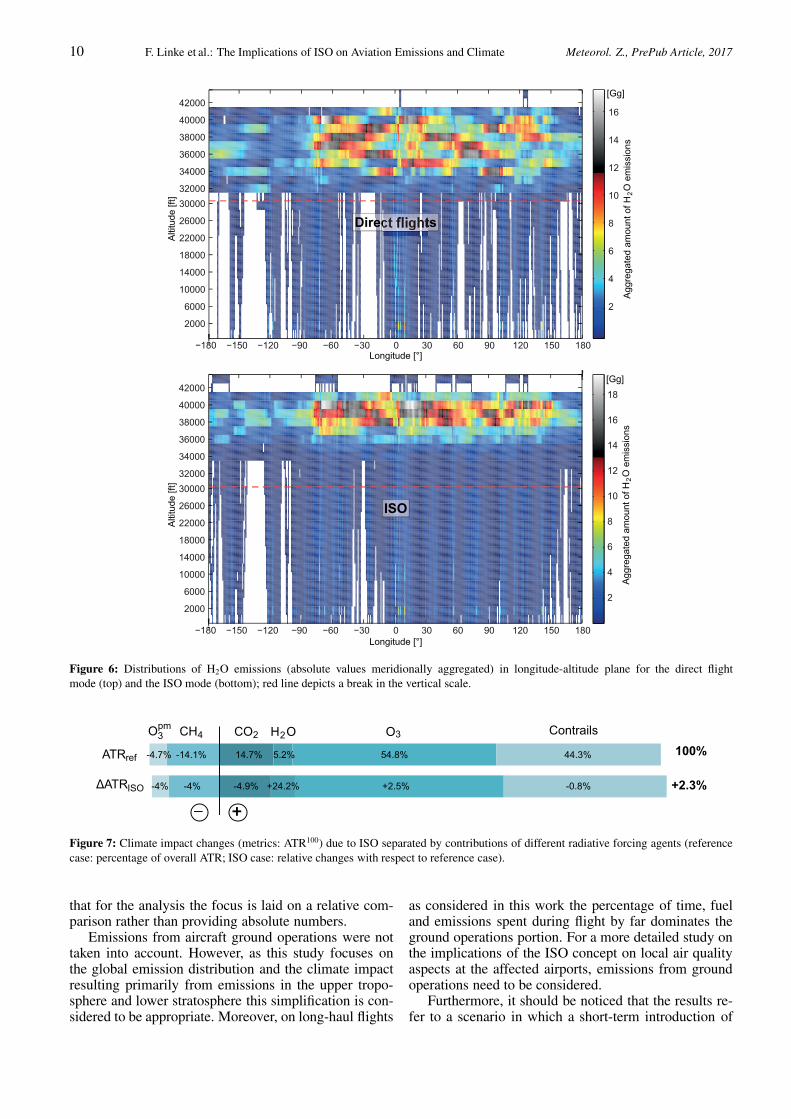
reduction in NOx, an increase by 33.3 % of CO and anincrease of HC by 43.4 %. The latter findings indicatea potential LAQ issue, especially at highly frequentedISO airports, and should be subject to further investi-gation. Figure 6 depicts the H2O inventory projectionsinto the longitude-altitude plane both for the direct flightand the ISO scenario. Obviously most cruise emissionsare moved to approximately 12 km altitude due to theshift of initial cruise flight levels to higher altitudes by4000–6000 ft. Additionally, the number of step climbsin ISO mode is reduced due to shorter segment lengthsand therefore the altitude band is narrowed from 7000 ftto approximately 3000 ft.
Finally, a climate impact assessment is performed.We are evaluating the long-term future climate changeof aviation when introducing ISO and compare this sce-nario to a reference case without ISO. Hence, we areevaluating the changes in the long-term climate impactfor the mitigation strategy “Flying ISO”. A suitable cli-mate metric is the Average Temperature Response ona 100 year time horizon (e.g. Grewe and Dahlmann,2015; Koch, 2013). The ATR is calculated as the timeintegral of the temporal course of the near-surface tem-perature change divided by the time horizon and thus,as opposed to other metrics like RF or Global Warm-ing Potential, allows for the quantification of a result-ing temperature change that takes into account the dy-namics of the earth-climate system. As base scenariothe Fa1 growth scenario defined by the ICAO Fore-casting and Economic Analysis Support Group was se-lected, which includes assumptions regarding the tem-poral development of global emissions. This emissionscenario is hence based on conventional techniques andrepresents a business-as-usual-sccenario. The emission

8 F. Linke et al.: The Implications of ISO on Aviation Emissions and Climate Meteorol. Z., PrePub Article, 2017
−90
−60
−30
0
30
60
90
0
100
200
300
400
−2000
−1500
−1000
−500
0
500
1000
1500
2000−20 0 20 40
−180 −150 −120 −90 −60 −30 0 30 60 90 120 150 180−8
−6
−4
−2
0
2
4
6
8
10
−4 −2 0 2 4
12
10
8
6
4
2
0
Fuel
con
sum
ptio
n di
ffere
nce
per u
nit a
rea
(col
umn)
Flig
ht le
vel [
100
ft]
[kg/km ]
Fuel consumption difference [kg/km ]
Fuel consumption difference [kg/km ]Fu
el c
onsu
mpt
ion
diffe
renc
e [k
g/km
]
Alti
tude
[km
]Figure 4: Redistribution of global fuel consumption due to ISO on long-haul missions (differences from direct flight scenario) in the firstquarter of 2010; top left: geographical distribution of changes in the fuel sums per grid column; top right: latitude profile (zonal); bottomleft: longitude profile (meridional); bottom right: altitude profile.
effects caused by the ISO concept were scaled by theevolution factors from the scenario to simulate trafficgrowth as well as technological advances and the ramp-up of the ISO concept introduction was assumed to last10 years starting in 2015. The results can be seen inFigure 7. Although the absolute amount of emissionsof the species CO2, H2O, SO2 and NOx can be re-duced through ISO the Average Temperature Responseincreases by 2.3 %, which is one of the major findingsof the study. This temperature increase of 2.3 % resultsfrom reduced warming effects of CO2 (−0.72 %) andcontrails (−0.35 %), which are over-compensated by anincrease in warming from NOx emissions (+2.12 %) andH2O emissions (+1.26 %).
The most important effect is the increase in cruise al-titude at mid latitudes for ISO compared to the referencesituation. This results in a shift of emissions to slightlyhigher altitudes, where mixing processes are slower andhence result in a larger accumulation of nitrogen oxidesand water vapor. The relative change in climate impactis largest for water vapor (almost 25 %, Fig. 7). The ra-diative forcing of water vapor generally increases withthe altitude at which it is released (Grewe and Stenke,2008; Lee et al., 2010). The upwards shift of flight lev-els into the lower stratosphere therefore intensifies thegreenhouse effect of H2O. This effect is even increased
by a slight shift of emissions to higher latitudes as thetropopause altitude falls towards the poles. The increaseof cruise altitude also leads to an increase in ozoneand to an increase in methane lifetime, which both arecontributing to an increased warming. These results areconsistent with previous findings, e.g. Frömming et al.(2012); Søvde et al. (2014); Dahlmann et al. (2016).
On the other hand contrail formation is avoided,since many flights are above the main contrail forma-tion area. The radiative forcing by contrails reachesits maximum just below the tropopause and is depen-dent on contrail coverage and optical properties. Abovethe (climatological) tropopause the radiative forcing bycontrails then rapidly decreases with increasing altitude(Lee et al., 2009). The shift to higher altitudes and lat-itudes therefore helps avoiding contrails and reducesthe warming from contrails. The results are largely inagreement with Frömming et al. (2012). In combina-tion, these findings show that in contrast to speculationsfrom previous studies a systematic introduction of ISOon a global level would not necessarily have positive im-plications for the climate, at least not for the current air-craft fleet. Our results show that the increase in warmingeffects from NOx and H2O emissions cannot be com-pensated by a reduction in the warming from less CO2emissions and from less contrails.
Meteorol. Z., PrePub Article, 2017 F. Linke et al.: The Implications of ISO on Aviation Emissions and Climate 9
Figure 5: Aggregated geographical emission distribution for the first quarter 2010; left: direct flights, right: ISO mode.
5 Discussion
We have investigated the climate impact of an immedi-ate introduction of intermediate stop operations. Natu-rally, the results depend on assumptions we made. Thisincludes the choice of the climate metric, regarded at-mospheric processes, impacts from ground emissions orpossibilities of re-designing the aircraft, which we dis-cuss here in more detail.
In general, the choice of the climate metric plays acrucial role in any assessment of aviation technologies(Fuglestvedt et al., 2010). However here, we ask thequestion “What would be the long-term impact to theclimate if we started introducing ISO now?”. And thislimits the choice of climate metrics suitable to answerthis question (Grewe and Dahlmann, 2015) and theimpact of the choice of a suitable climate metric on theresults is low (Grewe et al., 2014). The time horizonwould have played a very crucial role, if we had chosena pulse emission, however then we would have asked adifferent question. For an increasing emission scenario,as taken here into account, short-term and long-termclimate effects are more balanced (Grewe and Stenke,2008, their appendix).
The results presented above strongly depend on thebalance of the contributions from the various radiativeforcing agents to the overall climate response. Many of
the effects are estimated with large uncertainty ranges(Lee et al., 2009). However, Dahlmann et al. (2016)showed that these uncertainties are not limiting the as-sessment of technology options, which include varia-tions in cruise altitude. Additionally, some potential im-pacts, such as the effect of aerosol emissions on cloudswere not taken into account here, since the scientificunderstanding of these potential impacts is not matureenough to be included here.
Further uncertainties result from inaccuracies in theemission quantification which are caused by model ef-fects in the trajectory calculation and the fuel flow cor-relation method. Comparisons between BADA 4 andhighly detailed aircraft performance data from Airbushave shown, that for the respective aircraft types the fuelflow modelling error is 2.3 % on average (Nuic, 2013).Furthermore, for a fuel flow that is precisely knownSchulte et al. (1997) found by comparison to in-situmeasurements that the Boeing Fuel Flow Method 2tends to systematically underestimate real NOx emis-sions by approximately 11 %. Other aspects that influ-ence the predicted fuel flow are the aircraft mass as wellas the assumed altitude and speed profile. Here, we gen-erally simulate optimum profiles such that the reduceddrag might slightly underestimate the fuel flow as well.However, in combination the emission quantification er-rors still seem to be acceptable, especially given the fact,
10 F. Linke et al.: The Implications of ISO on Aviation Emissions and Climate Meteorol. Z., PrePub Article, 2017
!
!
−150 −120 −90 −60 −30 0 30 60 90 120 150 180
6000
14000
26000
32000
38000
42000
−180
30000
40000
36000
34000
22000
18000
10000
20002
4
6
8
10
12
14
16
18
Alti
tude
[ft]
[Gg]
ISO
Agg
rega
ted
amou
nt o
f H O
em
issi
ons
2
! −150 −120 −90 −60 −30 0 30 60 90 120 150 180
6000
14000
26000
32000
38000
42000
−180
30000
40000
36000
34000
22000
18000
10000
2000
2
4
6
8
10
12
14
16
Alti
tude
[ft]
[Gg]
Agg
rega
ted
amou
nt o
f H O
em
issi
ons
2
Direct flights
Figure 6: Distributions of H2O emissions (absolute values meridionally aggregated) in longitude-altitude plane for the direct flightmode (top) and the ISO mode (bottom); red line depicts a break in the vertical scale.
Contrails100%
+2.3%
14.7% 5.2% 54.8% 44.3%-14.1%-4.7%
-4% -4% -4.9% +24.2% +2.5% -0.8%
Figure 7: Climate impact changes (metrics: ATR100) due to ISO separated by contributions of different radiative forcing agents (referencecase: percentage of overall ATR; ISO case: relative changes with respect to reference case).
that for the analysis the focus is laid on a relative com-parison rather than providing absolute numbers.
Emissions from aircraft ground operations were nottaken into account. However, as this study focuses onthe global emission distribution and the climate impactresulting primarily from emissions in the upper tropo-sphere and lower stratosphere this simplification is con-sidered to be appropriate. Moreover, on long-haul flights
as considered in this work the percentage of time, fueland emissions spent during flight by far dominates theground operations portion. For a more detailed study onthe implications of the ISO concept on local air qualityaspects at the affected airports, emissions from groundoperations need to be considered.
Furthermore, it should be noticed that the results re-fer to a scenario in which a short-term introduction of

Meteorol. Z., PrePub Article, 2017 F. Linke et al.: The Implications of ISO on Aviation Emissions and Climate 11
ISO without any adaptations to the existing aircraft fleetand self-substitution are assumed. Given the current lowkerosene price one can argue that this scenario is atpresent rather unrealistic. As mentioned in the introduc-tion there have been studies also on the cost implicationsof the ISO concept revealing that in spite of the possi-ble fuel savings there are only few long-haul routes onwhich airlines actually are able to reduce the Direct Op-erating Costs on their flights (Linke et al., 2012). Thereason for this is that fuel costs are only one portion(up to 50 % on long-haul flights) of the overall DOCbill and ISO induces additional costs that offset the fuelcost savings. These additional costs are partly caused bythe increased flight times (e.g. higher crew costs and re-duced aircraft utilization) and include additional landingand en-route navigation fees as well as increased mainte-nance costs for engine and airframe due to the doublingof flight cycles. Furthermore, in a society for whichcomfort is of high significance and an omnipresent partof the life-style the passengers’ willingness to acceptlonger flight times and intermediate stops is limited un-less flight tickets are significantly cheaper than for di-rect flights. This would further reduce the profit marginof the operator. In combination with optimistic assump-tions regarding the available capacity at the ISO airports,a global short-term implementation of the ISO conceptis therefore rather unlikely. The results should be under-stood as indications of maximum possible savings andthe corresponding climate impact in a “what-if” man-ner.
A more realistic scenario may consider ISO with air-craft types that are redesigned and optimized for shorterranges. According to e.g. Langhans et al. (2013), inthis case higher cost savings can be expected that wouldmake an adoption for airlines easier. Such an aircraftwould have a smaller wing and a lower initial cruise alti-tude than the original long-haul aircraft fuelled for onlyone ISO leg. It is therefore expected, that the utilizationof redesigned medium-range aircraft would rather shiftcruise emissions to lower altitudes which consequentlycould turn the negative climate impact of water vapourand nitrogen oxides into a positive one while saving evenmore fuel.
Based on these findings, there is the need for a fur-ther system-level study taking into account redesignedmedium-range aircraft. Such a study should include arealistic DOC model and analyse various design optionswith different range and cruise altitude requirements.For the existing aircraft fleet it could be investigated towhat extent decreasing cruise altitudes during ISO modewould reduce the negative effects of the concept. As thisalso reduces the potential fuel savings of the concept atrade-off needs to be done and an optimization could beconducted to determine the optimum altitude for the ISOmissions in order to have a combined environmental andfuel saving benefit. However, we expect a climate impactreduction for ISO even with existing aircraft, avoidingthe higher flight altitude in the first flight segment andhence reducing the fuel savings.
6 Conclusions
A method has been presented that allows for the assess-ment of new operational concepts with respect to theirimpact on global emissions and climate. The modelingsystem comprises a trajectory simulation module, flightplanning functionalities, atmospheric models includingan efficient wind distribution method as well as mod-els for generating global emission inventories and cal-culating their climate impact. The trajectory calculationmakes use of the most advanced aircraft performancemodels, namely BADA 4, provided by EUROCON-TROL, and for the first time provides means to modelflight operations including cruise profiles from an airlinepoint-of-view more realistically. A mechanism for com-plexity reduction was applied by using a database of pre-calculated reduced emission profiles. The method wasapplied to analyse the environmental implications of theISO concept for today’s worldwide aircraft fleet. A largeair traffic scenario containing all world-wide long-haulflights in 2010 was considered and the effect of windwas accounted for.
Overall, 4.8 % of fuel can be saved through ISO glob-ally, assuming a full coverage of the operational con-cept. Airports serving as suitable stopover airports arelocated mainly in Newfoundland, Greenland, Siberia,Azores and Capeverdes. While most emission speciescan be reduced by ISO, there would be an increase of33–43 % of HC and CO emissions due to the doublingof descent and landing phases causing a potential LAQissue. Due to a lower TOW on ISO missions, the initialcruise flight levels are shifted up and the altitude bandis narrowed as flight segments are shorter and less stepclimbs are required. This emission relocation causes awarming climate impact compared to the direct oper-ations by 2.3 % in the Average Temperature Responseover 100 years as the increased warming effects, causedby the emitted NOx and H2O, dominates over the re-duced warming effects from CO2 and contrails.
As discussed above, a more realistic adoption ofmedium-range aircraft for flying ISO could on the otherhand have a positive climate impact due to the expectedlower cruise altitudes. A more detailed analysis andverification of this should be subject of future research.
Acknowledgments
Parts of this work were carried out within the DLR in-ternal project WeCare. The authors would like to thankthe project team for fruitful discussions leading to thepresented results. Furthermore, the authors appreciatethe contributions by some colleagues at DLR, particu-larly Majed Swaid and Benjamin Lührs who were in-volved in the development of the modeling system andcontributed with their valuable knowledge on trajectorycalculation and wind modeling.

12 F. Linke et al.: The Implications of ISO on Aviation Emissions and Climate Meteorol. Z., PrePub Article, 2017
References
Airbus, 2014: Flying on demand - global market forecast2014–2033. – Technical report, AIRBUS S.A.S., 31707Blagnac Cedex, France.
Airbus Customer Services, 2002: Getting to grips with aircraftperformance. – Technical report, Flight Operations Support &Line Assistance.
Brasseur, G.P., M. Gupta, B.E. Anderson, S. Balasubra-manian, S. Barrett, D. Duda, G. Fleming, P.M. Forster,J. Fuglestvedt, A. Gettelman, R.N. Halthore,S.D. Jacob, M.Z. Jacobson, A. Khodayari, K.-N. Liou,M.T. Lund, R.C. Miake-Lye, P. Minnis, S. Olsen, J.E. Pen-ner, R. Prinn, U. Schumann, H.B. Selkirk, A. Sokolov,N. Unger, P. Wolfe, H.-W. Wong, D.W. Wuebbles, B. Yi,P. Yang, C. Zhou, 2016: Impact of aviation on climate:FAA’s aviation climate change research initiative (ACCRI)phase ii. – Bull. Amer. Meteor. Soc. 97, 561–583, DOI:10.1175/BAMS-D-13-00089.1.
Creemers, W., R. Slingerland, 2007: Impact of intermediatestops on long-range jet-transport design. – In: 7th AIAA Avi-ation Technology, Integration and Operations (ATIO) Confer-ence, Belfast, Northern Ireland, American Institute of Aero-nautics and Astronautics.
Dahlmann, K., V. Grewe, C. Frömming, U. Burkhardt,2016: Can we reliably assess climate mitigation options forair traffic scenarios despite large uncertainties in atmosphericprocesses? – Transportation Research Part D: Transport andEnvironment 46, 40–55, DOI:10.1016/j.trd.2016.03.006.
DuBois, D., G.C. Paynter, 2006: “fuel flow method2" for es-timating aircraft emissions. – In: SAE Technical Paper 2006-01-1987. SAE International.
Frömming, C., M. Ponater, K. Dahlmann, V. Grewe,D.S. Lee, R. Sausen, 2012: Aviation-induced radiative forc-ing and surface temperature change in dependency of theemission altitude. – J. Geophys. Res. Atmos. 117, publishedonline, DOI:10.1029/2012JD018204 D19104.
Fuglestvedt, J., K. Shine, T. Berntsen, J. Cook, D. Lee,A. Stenke, R. Skeie, G. Velders, I. Waitz, 2010: Transportimpacts on atmosphere and climate: Metrics. – Atmos. Env.44, 4648–4677, DOI:10.1016/j.atmosenv.2009.04.044
Gauss, M., I.S.A. Isaksen, D.S. Lee, O.A. Søvde, 2006: Impactof aircraft NOx emissions on the atmosphere – tradeoffs toreduce the impact. – Atmos. Chem. Phys. 6, 1529–1548, DOI:10.5194/acp-6-1529-2006.
Green, J.E., 2005: Air travel – greener by design: Mitigatingthe environmental impact of aviation: Opportunities and pri-orities. – Technical report, Report of the Science and Technol-ogy Sub-Group.
Grewe, V., K. Dahlmann, 2012: Evaluating Climate-Chemistry Response and Mitigation Options with AirClim. –Springer Berlin Heidelberg, Berlin, Heidelberg, 591–606.
Grewe, V., K. Dahlmann, 2015: How ambiguous are climatemetrics? and are we prepared to assess and compare the cli-mate impact of new air traffic technologies?. – Atmos. Env.106, 373–374, DOI:10.1016/j.atmosenv.2015.02.039.
Grewe, V., A. Stenke, 2008: Airclim: an efficient tool forclimate evaluation of aircraft technology. – Atmos. Chem.Phys. 8, 4621–4639, DOI:10.5194/acp-8-4621-2008.
Grewe, V., M. Dameris, C. Fichter, D.S. Lee, 2002: Im-pact of aircraft NOx emissions. part 2: Effects of lower-ing the flight altitude. – Meteorol. Z. 11, 197–205, DOI:10.1127/0941-2948/2002/0011-0197.
Grewe, V., M. Plohr, G. Cerino, M.D. Muzio, Y. Deremaux,M. Galerneau, de P. Saint Martin, T. Chaika, A. Has-selrot, U. Tengzelius, V.D. Korovkin, 2010: Estimates ofthe climate impact of future small-scale supersonic transport
aircraft results from the HISAC EU-project. – Aeronautical J.114(1153), 199–206, DOI:10.1017/S000192400000364X.
Grewe, V., T. Champougny, S. Matthes, C. Frömming,S. Brinkop, O.A. Søvde, E.A. Irvine, L. Halscheidt, 2014:Reduction of the air traffic’s contribution to climate change:A REACT4C case study. – Atmos. Env. 94, 616–625, DOI:10.1016/j.atmosenv.2014.05.059.
Grewe, V., L. Bock, U. Burkhardt, K. Dahlmann,K. Gierens, L. Hüttenhofer, S. Unterstrasser,A.G. Rao, A. Bhat, F. Yin, T.G. Reichel, O. Paschereit,Y. Levy, 2016: Assessing the climate impact of the aheadmulti-fuel blended wing body. – Meteorol. Z., publishedonline, DOI:10.1127/metz/2016/0758.
Hein, R., M. Dameris, C. Schnadt, C. Land, V. Grewe,I. Köhler, M. Ponater, R. Sausen, B.B. Steil, J. Land-graf, C. Brühl, 2001: Results of an interactively coupled at-mospheric chemistry – general circulation model: Comparisonwith observations. – Annales Geophysicae 19, 435–457, DOI:10.5194/angeo-19-435-2001.
Köhler, M.O., G. Rädel, O. Dessens, K.P. Shine,H.L. Rogers, O. Wild, J.A. Pyle, 2008: Impact ofperturbations to nitrogen oxide emissions from globalaviation. – J. Geophys. Res. Atmos. 113, D11305, DOI:10.1029/2007JD009140.
Koch, A., 2013: Climate impact mitigation potential given byflight profile and aircraft optimization. – Ph.D. thesis, Ham-burg University of Technology (TUHH).
Koch, A., B. Lührs, F. Linke, V. Gollnick, K. Dahlmann,V. Grewe, U. Schumann, T. Otten, M. Kunde, 2012:Climate-compatible air transport system, climate impact miti-gation potential for actual and future aircraft. – In: Sausen, R.,S. Unterstrasser, A. Blum: (Eds.), Proceedings of the3rd International Conference on Transport, Atmosphere andClimate (TAC-3), number ISSN 1434-8454. – Forschungs-bericht DLR-FB–2012-17, Deutsches Zentrum für Luft- undRaumfahrt.
Lammering, T., E. Anton, K. Risse, K. Franz, R. Hoern-schemeyer, 2011: Gains in fuel efficiency: Multi-stop mis-sions vs. laminar aircraft. – In: 11th Aviation Technology, In-tegration, and Operations (ATIO) Conference, Virginia Beach,VA, USA, American Institute of Aeronautics and Astronau-tics.
Langhans, S., F. Linke, P. Nolte, H. Schnieder, 2010: Sys-tem analysis for future long-range operation concepts. – In:27th Congress of the International Council of the Aeronauti-cal Sciences (ICAS), Nice, France.
Langhans, S., F. Linke, P. Nolte, V. Gollnick, 2013:System analysis for an intermediate stop operations con-cept on long range routes. – J. Aircraft 50, 29–37, DOI:10.2514/1.C031446.
Lee, D., G. Pitari, V. Grewe, K. Gierens, J. Penner, A. Pet-zold, M. Prather, U. Schumann, A. Bais, T. Berntsen,D. Iachetti, L. Lim, R. Sausen, 2010: Transport im-pacts on atmosphere and climate: Aviation. Transport Im-pacts on Atmosphere and Climate: The {ATTICA} As-sessment Report. – Atmos. Env. 44, 4678–4734, DOI:10.1016/j.atmosenv.2009.06.005.
Lee, D.S., D.W. Fahey, P.M. Forster, P.J. Newton, R.C. Wit,L.L. Lim, B. Owen, R. Sausen, 2009: Aviation and global cli-mate change in the 21st century. – Atmos. Env. 43, 3520–3537,DOI:10.1016/j.atmosenv.2009.04.024.
Linke, F., 2008: Trajectory Calculation Module (Part I: VNAV).Internal report, Deutsches Zentrum für Luft- und Raumfahrt.
Linke, F., 2016: Ökologische Analyse operationeller Lufttrans-portkonzepte. – Forschungsbericht dlr-fb–2016-10, HamburgUniversity of Technology (TUHH), ISSN 1434-8454.

Meteorol. Z., PrePub Article, 2017 F. Linke et al.: The Implications of ISO on Aviation Emissions and Climate 13
Linke, F., S. Langhans, V. Gollnick, 2011: Global fuel analy-sis of intermediate stop operations on long-haul routes. – In:11th Aviation Technology, Integration, and Operations (ATIO)Conference, Virginia Beach, VA, USA, American Institute ofAeronautics and Astronautics.
Linke, F., S. Langhans, V. Gollnick, 2012: Studies on the po-tential of intermediate stop operations for today’s airlines. –In: 16th Air Transport Research Society (ATRS) World Con-ference, Tainan, Taiwan.
Lührs, B., 2013: Erweiterung eines Trajektorienrechners zurNutzung meteorologischer Daten für die Optimierung vonFlugzeugtrajektorien. – Master’s thesis, Hamburg Universityof Technology (TUHH).
Lührs, B., M. Niklass, C. Froemming, V. Grewe, V. Goll-nick, 2016: Cost-benefit assessment of 2d and 3d climateand weather optimized trajectories. – In: 16th AIAA AviationTechnology, Integration, and Operations (ATIO) Conference,Washington, D.C., USA, American Institute of Aeronauticsand Astronautics.
Martinez-Val, R., J. Roa, E. Perez, C. Cuerno, 2011: Ef-fects of the mismatch between design capabilities and ac-tual aircraft utilization. – J. Aircraft 48, 1921–1927, DOI:10.2514/1.C031348.
Maynard, G., P. Bearman, R. Gardner, J.E. Green, K. Mor-ris, I. Poll, R. Whitfield, R. Wiltshire, 2015: Air travel -greener by design, annual report 2014–2015. – Technical re-port, Royal Aeronautical Society, London, UK.
Mouillet, V., 2013: Session 4: Bada family 4 – state of theart. – In: BADA User Group Meeting, EUROCONTROL Ex-perimental Centre, Bretigny sur Orge, France.
Niklass, M., B. Lührs, V. Grewe, T. Luchkova, 2015: Po-tential to reduce the climate impact of aviation by closure ofairspaces. – In: 19th Air Transport Research Society (ATRS)World Conference, Singapore.
Nuic, A., 2013: Session 4: Bada family 4 – results of bada 3 &4 assessment within the scope of sesar wp16.3.1. – In: BADAUser Group Meeting, EUROCONTROL Experimental Centre,Bretigny sur Orge, France.
Poll, D.I.A., 2011: On the effect of stage length on the effi-ciency of air transport. – Aeronautical J. 115, 273–283, DOI:10.1017/S0001924000005741.
Rädel, G., K.P. Shine, 2008: Radiative forcing by persistentcontrails and its dependence on cruise altitudes. – J. Geophys.Res. Atmos. 113, D07105, DOI:10.1029/2007JD009117
Schulte, P., H. Schlager, H. Ziereis, U. Schumann,S.L. Baughcum, F. Deidewig, 1997: NOx emission indicesof subsonic long-range jet aircraft at cruise altitude: In situmeasurements and predictions. – Journal of GeophysicalResearch: Atmospheres (D17), 21431–21442, DOI:10.1029/97JD01526.
Schumann, U., 1996: On conditions for contrail formation fromaircraft exhausts. – Meteorol. Z. 5, 4–23.
Søvde, O.A., S. Matthes, A. Skowron, D. Iachetti, L. Lim,B. Owen, Ø. Hodnebrog, G.D. Genova, G. Pitari,D.S. Lee, G. Myhre, I.S. Isaksen, 2014: Aircraft emis-sion mitigation by changing route altitude: A multi-modelestimate of aircraft nox emission impact on o3 photo-chemistry. – Atmos. Env. 95, 468–479, DOI:10.1016/j.atmosenv.2014.06.049.
Swaid, M., 2013: Entwicklung von Flugplanungsfunktional-itäten zur Flugmissionsanalyse unter realistischen opera-tionellen Bedingungen. – Internal Report IB-328-2013-37,Deutsches Zentrum für Luft- und Raumfahrt.
Swaid, M., 2014: Entwicklung eines Routenoptimierungsalgo-rithmus zur Ermittlung windoptimaler Flugrouten in einemLuftverkehrsstrassensystem. – Master’s thesis, Hamburg Uni-versity of Technology (TUHH).