Embed Size (px)
Citation preview

Delft University of Technology
Absorption of CO2-NH3-H2O mixture in mini-channel heat exchangers
Shi, Liang; Gudjonsdottir, Vilborg; Infante Ferreira, Carlos; Rexwinkel, Glenn ; Kiss, Anton A.
Publication date2017Document VersionFinal published versionPublished inProceedings 12th IEA Heat Pump Conference
Citation (APA)Shi, L., Gudjonsdottir, V., Infante Ferreira, C., Rexwinkel, G., & Kiss, A. A. (2017). Absorption of CO2-NH3-H2O mixture in mini-channel heat exchangers. In Proceedings 12th IEA Heat Pump Conference StichtingHPC 2017.
Important noteTo cite this publication, please use the final published version (if applicable).Please check the document version above.
CopyrightOther than for strictly personal use, it is not permitted to download, forward or distribute the text or part of it, without the consentof the author(s) and/or copyright holder(s), unless the work is under an open content license such as Creative Commons.
Takedown policyPlease contact us and provide details if you believe this document breaches copyrights.We will remove access to the work immediately and investigate your claim.
This work is downloaded from Delft University of Technology.For technical reasons the number of authors shown on this cover page is limited to a maximum of 10.

Absorption of CO2-NH3-H2O mixture in mini-channel heat
exchangers
Liang Shia, Vilborg Gudjonsdottir
a*, Carlos A. Infante Ferreira
a, Glenn Rexwinkel
b,
Anton A. Kissc
aProcess and Energy Laboratory, Delft University of Technology, Leeghwaterstraat 39, 2628 CB, Delft, The Netherlands; bFrames, Eikenlaan 237,2404 BP Alphen aan den Rijn, The Netherlands;
cAkzoNobel – Research, Development & Innovation, Process Technology SRG, Zutphenseweg 10, 7418 AJ Deventer, The Netherlands
Abstract
Compression resorption heat pumps (CRHP) are a promising option to upgrade waste heat from industry.
Alternative working fluids can further improve the efficiency of CRHP. The ternary mixture NH3-CO2-H2O has
been identified as a promising working fluid for CRHP and has the potential to further enhance the coefficient
of performance (COP) of the cycle compared to the traditionally used ammonia water mixture. So far the
studies on the NH3-CO2-H2O mixture have focused mainly on carbon capture applications. But the desired
operating conditions are different than for CRHP applications, e.g. the NH3 concentration. Additionally the
absorption process with the mixture in tubular absorbers has not yet been reported. The focus of this study is
therefore to investigate experimentally the absorption process of a CRHP with this ternary mixture. To reach
this goal a model is developed for ammonia-water that takes into account the kinetics and mass transfer during
the absorption process. To validate the model, experiments were performed for an absorption process in a mini
channel heat exchanger with NH3 concentration of 35 wt%. The results show a good match between the model
and the experiments. Additionally CO2 has been added to the solution and the experimental performance was
compared with the experimental performance of the NH3-H2O mixture. A concentration of 2 wt% CO2 resulted
in a performance increase of up to 5% however the working fluid flow became limited by pumping instabilities.
© 2017 Stichting HPC 2017.
Selection and/or peer-review under responsibility of the organizers of the12th IEA Heat Pump Conference 2017.
Keywords: heat pumps, NH3-CO2-H2O mixture, NH3-H2O mixture, waste heat recovery, absorption, mini-channel heat exchangers
Nomenclature
A area m2 Greek symbols
cp heat capacity Jkg-1
K-1
heat transfer coefficient Wm-2
K-1

Shi et al./ 12th IEA Heat Pump Conference00 (2017) O.3.5.2
2
d diameter m heat flux Wm-2
F mass transfer coefficient molm-2
s-1
density kgm-3
f friction factor - thermal conductivity Wm-1
K-1
G mass flux kgm-2
s-1
h enthalpy Jkg
-1 Subscripts
h partial enthalpy Jkg-1
cw cooling water
J molar flux molm-2
s-1
H hydraulic L length m i interface M molar mass kgmol
-1 in inlet
m mass flow kgs-1
l liquid P pressure bar out outlet Q heat flow W s shell q quality - t tube Re Reynolds number - ti inner tube T temperature °C to outer tube u velocity ms
-1 tp two-phase
x molar concentration molmol-1
v vapor y axial coordinate m z molar flux ratio -
1. Introduction
Industry contributes to a great part of the total energy consumption. In 2014, 30% of the total final energy
consumption originated from the industry in the Netherlands [1]. This large share of energy consumption by
industry indicates that developing technologies to increase the total efficiency of industrial processes has a
great potential to save energy. Heat pump technology is one of the best options to recover energy in many
industrial processes. Take cooling water as an example, a large amount of low grade waste heat is available as
water from cooling towers with temperatures in the range of 45-60°C [2]. A previous study by van de Bor et al.
[2] indicated that compression-resorption heat pumps (CRHP) can be integrated with industrial processes to
recover heat and provide a higher efficiency compared to conventional vapor-compression heat pumps
(VCHP). Similar to the vapor absorption cycle, the most common working pair used in CRHP cycle is the
binary mixture ammonia-water. Ammonia-water mixture shows plenty of advantages: non-isothermal phase
transition of the mixture at constant pressure in heat exchangers ensures higher coefficient of performance
(COP) than pure working fluid for VCHP; the mixture can be operated at relatively low pressures to achieve
high temperature; CRHP cycle can be designed to match the temperature glide of the industrial flow that has to
be heated using the temperature glide in the resorber [3]. The CO2-NH3-H2O mixture has been identified as a
possible working fluid for CRHP, and a preliminary study suggests that it has better performance than
ammonia-water [4]. Resorbers are important components in CRHP cycle and comparable to condensers in
VCHP cycles. To evaluate the COP of the CRHP cycle, it is necessary to study the performance of the
absorption process in resorbers in detail. Van Leeuwen [5] experimentally investigated absorption and
desorption of ammonia-water mixtures in a tube-in-tube mini-channel heat exchanger and built a model to
simulate these processes. The calculation method proposed by Fernandez-Seara et al. [6] served as a basis for
the model. The study concludes that mini-channel heat exchangers provide a considerably higher overall heat
transfer coefficient than conventional heat exchangers. Rijpkema [7] further developed a model following the

Shi et al./ 12th IEA Heat Pump Conference00 (2017) O.3.5.2
3
approach by van Leeuwen [5] to predict the performance of an ammonia-water mixture in a mini-channel, and
the influence of the surface tension was investigated. The results show that modeling of surface tension has
little effect on the absorption side, while on the desorption side it has significant effect. The current work
performs experiments in a mini-channel heat exchanger using both ammonia-water binary mixture and CO2-
NH3-H2O ternary mixture to study the absorption process of a CRHP cycle. A corresponding mathematical
model is developed to simulate the absorption process of ammonia-water mixture, while experimental data are
used to validate the proposed model.
2. Experimental Setup
Fig. 1 shows the scheme of the experimental setup. The ammonia-water binary mixture or CO2-NH3-H2O
ternary mixture is fed from top to bottom on the tube side of the multi-tube mini-channel heat exchanger. The
mini-channel heat exchanger acts as the resorber of a CRHP cycle and is the main test section of the
experimental setup. The two cycles connected to the mini-channel heat exchanger are installed to ensure the
inlet conditions of the mini-channel are as expected. The cycle on the right hand side in Fig. 1 represents the
mixture absorption cycle. The pump compensates the pressure drop along the cycle and drives the mixture to
flow through the system. A flow meter is installed after the pump to measure the flow rate of the cycle. After
passing through the flow meter, the fluid mixture is heated up by a tube-in-tube heat exchanger of which the
hot side is filled with silicon oil flowing through a thermostatic bath. Extra heating is provided by an electric
tracing coil to keep the temperature at the inlet of the absorber stable. The fluid mixture changes its phase from
vapor to liquid in the tube side of the mini-channel by releasing heat to the water on the shell side. A plate heat
exchanger is installed after the mini-channel for further cooling of the fluid. Cooling water from a cooling
tower is used to sub-cool the liquid before entering the pump. Mass flow of the cooling water passing through
the plate heat exchanger is always set at the maximum flow rate to ensure the working fluid is sufficiently sub-
cooled before entering the pump. The setup of the cycle on the left hand side is identical to the absorption cycle
on the right hand side.

Shi et al./ 12th IEA Heat Pump Conference00 (2017) O.3.5.2
4
Fig. 1. Schematic diagram of experimental setup
Two parameters can be controlled on each side of the setup during the experiments: the mass flow of the
cycle and the temperature at the inlet of the test section. Fluid temperature entering the absorber can be
controlled by the thermostatic bath behind the flow meter and/or the tracing coil around the pipe before
entering the mini-channel heat exchanger. The flow meters after the pumps are used to control the mass flow
on both sides, they also give back the values of the temperature and the density of the fluid. Pressure sensors
are installed at the inlets of the mini-channel heat exchanger to measure the gauge pressure and differential
pressure sensors measure the pressure difference between in- and outlets of the absorber. Additionally 10
temperature sensors are averagely located on the outside of the shell of the mini-channel heat exchanger to
investigate the temperature profile along the heat exchanger. The dimensions of the mini-channel heat
exchanger are listed in Table 1. Design details can be found in Nefs et al. [8]. The accuracies of the different
sensors are listed in Table 2.
Table 1. Main dimensions of the mini-channel heat exchanger
Parameter Unit Value
Number of tubes - 116
Total length of heat exchanger section mm 800
Inner diameter of the tube mm 0.5
Outer diameter of the tube mm 1.0
Inner diameter of the shell mm 21
Outer diameter of the shell mm 25
Table 2.Accuracy of the different sensors
Sensor Type Range Accuracy Unit
Temperature sensor PT-100, Type B -50...+200 ±(0.3+0.005T) °C
Mass flow sensor mini Cori-Flow, M14 +0...+20 ±0.04 kg/hr
Density sensor mini Cori-Flow, M14 not given ±5 kg/m3
Temperature sensor mini Cori-Flow, M14 +0...+70 ±0.5 °C
Gauge pressure sensor Sitrans P DS III, 7MF4033 -1...+15 ±0.13 bar
Differential pressure sensor Sitrans P DS III, 7MF4333 -1600...+1600 ±8 mbar
The inlet and outlet temperature sensors of the test section have been separately calibrated. Its accuracy after
calibration was 0.03 K.
3. Theoretical Models
3.1. Ammonia-water model
A steady-state mathematical model has been developed using the computer software Matlab based on
momentum, heat and mass transfer phenomena for an ammonia-water mixture. The model considers heat and
mass transfer between the vapor and liquid phase on the tube side, and heat transfer from the liquid phase to the
water on the shell side through the tube wall. After applying finite control volume method, the absorption

Shi et al./ 12th IEA Heat Pump Conference00 (2017) O.3.5.2
5
process is analyzed by simultaneously solving the kinetic equations for heat and mass transfer, and
conservation equations for momentum, heat and energy balances.
3.1.1. Assumptions To simplify the model, the following assumptions are applied to the model:
(1) The whole process simulated by the mathematical model is assumed to be in steady state.
(2) The interface between vapor and liquid phases on the tube side is considered to be in thermodynamic
equilibrium.
(3) Heat and mass transfer only occurs in the transversal direction of the flow.
(4) The model is 1-D, which means, properties of the working fluid are assumed to be constant with the angular
coordinate and only change within the axial direction.
(5) The shell of the heat exchanger is assumed to be adiabatic, heat losses to the environment are neglected.
(6) Radiative heat transfer is neglected through the whole process.
(7) Entrance effects are neglected.
3.1.2. Mass transfer equations Mass transfer takes place between the vapor and liquid phases, it is caused by molecular diffusion combined
with convection between the bulk flows and the interface.
The mass transfer from the bulk vapor to the bulk liquid is defined as positive. Based on Fick's first law of mass
transfer, the molar flux of ammonia from the bulk vapor to the interface can be determined by Eq. 1, as
proposed by Bird et al. [9]:
3
3
3
,
,
,
lnNH vi
NH v vNH v
z xJ F z
z x
(1)
where z is defined as the ratio of ammonia molar flux to the total molar flux:
3NHJz
J
(2)
Similarly, the molar flux of ammonia from the interface to the bulk liquid can be determined using Eq. 3.
3
3
3
,
,
,
lnNH l
NH l lNH li
z xJ F z
z x
(3)
The mass fluxes can be obtained when the corresponding molar flux is known:
3 3 3NH NH NHG J M (4)
2 3 2
1H O NH H O
zG J Mz
(5)
3.1.3. Pressure drop calculation The frictional pressure drop for 2-phase flow in tube side can be estimated using the correlation from Muller-
Steinhagen and Heck [10]:
1/3(1 )tp
dP C q BdL
(6)
where
2C A B A q (7)

Shi et al./ 12th IEA Heat Pump Conference00 (2017) O.3.5.2
6
The factors A and B are the frictional pressure gradients for the liquid and the vapor phase, respectively: 2
2l
l
GA fd
(8)
2
2v
v
GB fd
(9)
with
64 64,
Re Rel v
l v
f f for Re ,Re 1187l v (10)
1/4 1/4
0.3164 0.3164,
Re Rel v
l v
f f for Re ,Re 1187l v (11)
The frictional pressure drop for single phase flow on the shell side can be calculated by: 2
2
cw cwcw
cw H
udP fdL d
(12)
The effective friction factor cwf is estimated to be 22 based on the study from Nefs [11].
3.1.4. Heat transfer equations Heat transfer takes place at two main sections in the heat exchanger: between the vapor and the liquid phases in
the tube, and between the liquid phase and the cooling water through the tube wall.
The heat transfer between the vapor and the liquid phases is contributed by two parts. One part is the sensible
heat caused by heat convection, the other part is the heat transfer caused by mass transfer and the enthalpy
difference between the vapor and the liquid phase.
The heat transfer from the bulk vapor to the cooling water is defined as positive. The heat fluxes caused by
convection from the bulk vapor to the interface and from the interface to the bulk liquid are given in Eq. 13 and
14.
v v v iT T (13)
l l i lT T (14)
Heat transfer from the bulk liquid to the cooling water can be calculated using Eq. 15.
ln /1 1
2
l cw
to ti
s to t t ti
T TQd d
d d
(15)
3.1.5. Mass conservation Since there is mass transfer between the vapor bulk and the interface, the mass balance for the bulk vapor can
be expressed as:
3 2, ,v in NH H O i v outm G G dA m (16)
There is no mass accumulation within the interface, thus mass balance for the interface can be expressed as:
3 3, ,NH v NH lJ J (17)
Similar to the bulk vapor, the mass balance for the bulk liquid can be expressed as:

Shi et al./ 12th IEA Heat Pump Conference00 (2017) O.3.5.2
7
3 2, ,l in NH H O i l outm G G dA m (18)
3.1.6. Energy conservation The energy balance for the bulk vapor can be expressed as:
3 3 2 2, , , , , ,v in v in v NH NH v H O H O v i v out v outm h G h G h dA m h (19)
There is no energy accumulation within the interface, thus energy balance for the interface can be expressed as:
3 3 2 2 3 3 2 2, , , ,v NH NH v H O H O v l NH NH l H O H O lG h G h G h G h (20)
The energy balance for the bulk liquid can be expressed as:
3 3 2 2, , , , , ,l in l in l NH NH l H O H O l i l out l outm h G h G h dA Q dy m h (21)
with dy the control volume length. The energy balance for the cooling water can be expressed as:
, , , ,cw in cw in cw out cw outm h Q dy m h (22)
3.2. CO2-NH3-H2O model
The CO2-NH3-H2O absorption model is still under development. A comparable approach to what has been
discussed in the previous section will be followed. The present experimental data have been compared to the
simplified Aspen Plus model introduced in [4].
4. Experimental Results and Validation
4.1. Water/water experiment
For the first experiments, demineralised water is fed into both loops to determine the shell side heat transfer
coefficient. Mass flow on the tube side is fixed at 10.0 kg/hr and the shell side mass flow ranges from 2.5 to
20.0 kg/hr. Inlet temperatures on shell and tube sides are fixed at around 60 and 110°C, respectively. The
experimental results are shown in Fig. 2.
Fig. 2. Left: In- and outlet temperatures of the tube and shell side of the heat exchanger for different shell side mass flows with constant
tube side mass flow (10 kg/hr); Right: Heat flow through the heat exchanger wall based on the experimental energy balances on tube and
shell side and its predicted value.
Shi et al./ 12th IEA Heat Pump Conference00 (2017) O.3.5.2
8
The flow on both sides of the heat exchanger is laminar. There are analytical solutions for the heat transfer
of single phase flow in tubes: considering constant wall heat flux (Nu = 4.364) and considering a constant wall
temperature (Nu = 3.66). Both conditions do not generally apply for the experiments reported here. However
for the condition in which both flows are identical (10 kg/hr) the condition of constant heat flux applies so that
for that condition Nu = 4.364 must apply for the tube side. Miyatabe [12] derived analytically the Nusselt
number for single phase flow along a tube bundle. Taking the discussion by Nefs [11] into account the heat
transfer coefficient can be obtained from:
2 2 2/3
,0.008495 0.4775 ( / ( ))cw
s s p cw cwH
m c Ld
(23)
Where dH is the hydraulic diameter (2.37 mm for the experimental heat exchanger). For 10 kg/hr on both sides
the heat transfer coefficients become 5237 W/m2K and 350 W/m
2K respectively for the tube and shell sides
when the length, L, is taken as 0.8 m. It should be noticed that the shell side heat transfer coefficient reduces as
the flow progresses along the heat exchanger. In fact a shell side heat transfer coefficient of 590 W/m2K is
derived from the experimental results for these conditions. Since the tube side flow has further been maintained
for all experiments it can be assumed that the heat transfer coefficient on this side remains unchanged when the
shell side flow is varied. This allows for the determination of the shell side heat transfer coefficient as a
function of the shell side mass flow. 6 5 4 3 2
0.0001 0.0113 0.4056 6.7014 52.598 204.43 1022.5s s s s s s sm m m m m m (24)
with sm in kg/hr and s in W/m2K.
4.2. Ammonia-water/water experiment
1 2 3 4 5 6 7 8 9 1050
60
70
80
90
100
110
120
130
Temperature Sensor Number [-]
Tem
pera
ture
[
C]
mt=2.1kg/hr
mt=2.2kg/hr
mt=2.3kg/hr
4.0 6.0 8.0 10.0 12.0 14.0 16.0 18.0
40
50
60
70
80
90
100
110
120
130
140
Mass Flow (shell side) [kg/hr]
Tem
pera
ture
[
C]
Tt,in
Ts,out
Tt,out
Ts,in
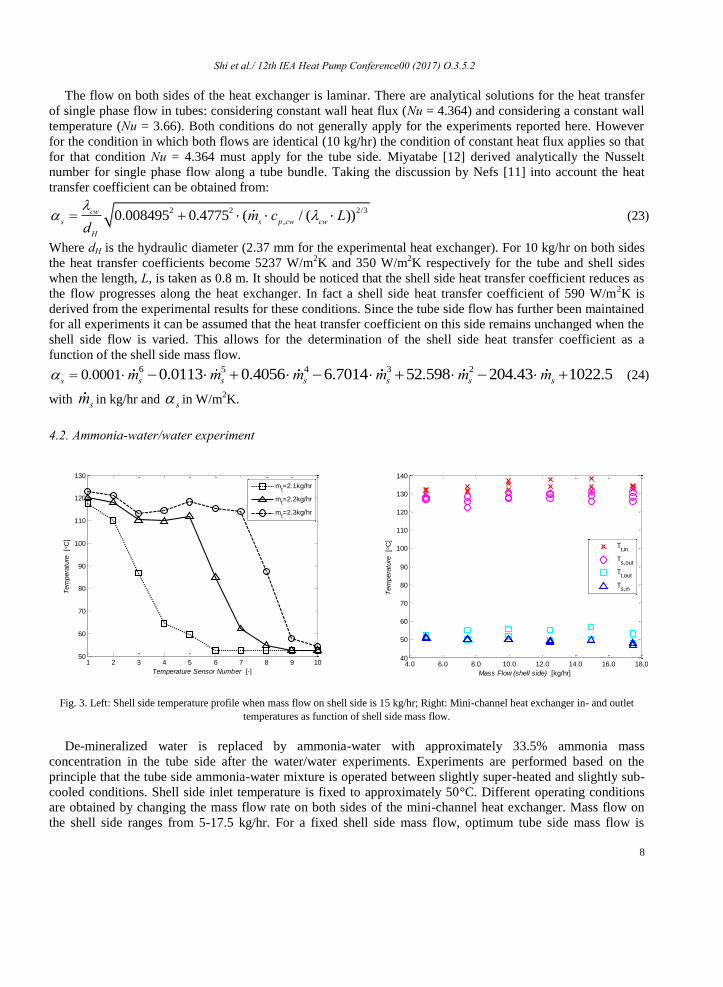
Fig. 3. Left: Shell side temperature profile when mass flow on shell side is 15 kg/hr; Right: Mini-channel heat exchanger in- and outlet
temperatures as function of shell side mass flow.
De-mineralized water is replaced by ammonia-water with approximately 33.5% ammonia mass
concentration in the tube side after the water/water experiments. Experiments are performed based on the
principle that the tube side ammonia-water mixture is operated between slightly super-heated and slightly sub-
cooled conditions. Shell side inlet temperature is fixed to approximately 50°C. Different operating conditions
are obtained by changing the mass flow rate on both sides of the mini-channel heat exchanger. Mass flow on
the shell side ranges from 5-17.5 kg/hr. For a fixed shell side mass flow, optimum tube side mass flow is

Shi et al./ 12th IEA Heat Pump Conference00 (2017) O.3.5.2
9
determined by varying its value until the heat exchange area is sufficiently used. This can be observed from the
temperature profile on shell side, for example, when mass flow on the shell side is 15 kg/hr, the temperature
profile corresponding to different tube side mass flows which range from 2.1 to 2.3 kg/ hr is shown in Fig. 3
(left). It can be observed that 2.2 kg/hr on the tube side is the optimum mass flow rate, while 2.1 is not
sufficient and 2.3 is too high. Some of the results of the ammonia-water/water experiment are shown in Figs. 3
to 5. Notice that these ten sensors are less accurate than listed in Table 2 but clearly indicate the temperature
profile trends during the experiments.
Fig. 3 (right) shows the in- and outlet temperatures of the heat exchanger for all the experiments. It reflects
different operating conditions of the experiment. The principle is to fix the inlet temperatures on shell and tube
side to 50 and 135 °C, respectively. Adjust the mass flow on tube side to achieve sufficient heat transfer so that
the shell side outlet temperature approaches the tube side inlet temperature.
4.0 6.0 8.0 10.0 12.0 14.0 16.0 18.00.5
1.0
1.5
2.0
2.5
3.0
Mass Flow (shell side) [kg/hr]
Optim
um
Mass F
low
(tu
be s
ide)
[kg/h
r]
experimental data
fitting curve
400 600 800 1000 1200 1400 1600 1800 2000400
600
800
1000
1200
1400
1600
1800
2000
Heat Load (tube side) [W]
Heat
Load (
shell
sid
e)
[W
]
Fig. 4. Left: Optimum tube side mass flow as a function of shell side mass flow; Right: Comparison of the shell and tube side heat loads.
0.5 1.0 1.5 2.0 2.5 3.0-0.26
-0.22
-0.18
-0.14
-0.10
-0.06
Mass Flow (tube side) [kg/hr]
Pre
ssure
Dro
p
[bar]
dPt,sensor
fitting curve
4.0 6.0 8.0 10.0 12.0 14.0 16.0 18.0
-0.04
-0.03
-0.02
-0.01
0.00
0.01
Mass Flow (shell side) [kg/hr]
Pre
ssure
Dro
p
[bar]
dPs,sensor
fitting curve
Fig. 5. Pressure drop as a function of mass flow on the tube side (left) and shell side (right)
Fig. 4 (left) shows the relation between shell side mass flow and its corresponding optimum tube side mass
flow. The result gives a linear profile, the fitting curve can be expressed as:

Shi et al./ 12th IEA Heat Pump Conference00 (2017) O.3.5.2
10
0.1521 0.0708t sm m (25)
The heat load on both sides of the heat exchanger can be calculated by multiplying mass flows with their
corresponding enthalpy differences between in- and outlet. The results from different operating conditions are
shown in Fig. 4 (right). The figure shows that the tube side heat load is always slightly higher than that of the
shell side. This is because of the heat transfer to the environment from the shell. The difference is within 5%
(dashed lines are 5% error boundaries) so it can be concluded that the shell side is well insulated.
Fig. 5 shows the relation between pressure drop and mass flow on both shell and tube sides. Trends on both
sides show linear profiles, although results from tube side are quite dispersed.
4.3.CO2-NH3-H2O mixture/water experiment
To experimentally investigate the effect of adding CO2, a small amount of CO2 has been added to the tube
side. For the first experiments, mass fractions of CO2 and NH3 are 2.1% and 32.8% respectively. Similar to
ammonia-water/water experiment, inlet temperatures on shell and tube sides are fixed to around 50 and 135°C.
Shell side mass flow rate ranges from 5 to 17.5 kg/hr. Comparable to ammonia-water/water experiment, tube
side mass flow is adjusted until outlet temperatures on both sides are identical to those from ammonia-
water/water experiment. Some of the results are shown in the following figures. These experiments have been
repeated to verify its reproducibility and showed to be reproducible. This has been done because, at higher
flows, the pump circulation with CO2 added became quite unstable. This instability might be caused by un-
absorbed CO2 gas which passes the pump. If this is the case it indicates that the kinetics of the CO2 absorption
are slow which might be a problem in practical systems.
4.0 6.0 8.0 10.0 12.0 14.0 16.0 18.00.5
1.0
1.5
2.0
2.5
3.0
3.5
4.0
4.5
Mass Flow (shell side) [kg/hr]
Optim
um
Mass F
low
(tu
be s
ide)
[kg/h
r]
NH3-H
2O experiment
NH3-H
2O fitting
CO2-NH
3-H
2O experiment
CO2-NH
3-H
2O fitting
4.0 5.0 6.0 7.0 8.0 9.0 10.0 11.0400
500
600
700
800
900
1000
Mass Flow (shell side) [kg/hr]
Heat
Load (
shell
sid
e)
[W
]
NH3-H
2O experiment
CO2-NH
3-H
2O experiment
Fig. 6. Left: Comparison of optimum tube side mass flow as a function of shell side mass flow between two different working fluids;
Right: Comparison of shell side heat load between the two different working fluids
The red curve shown in Fig. 6 (left) represents the relation between shell side mass flow and its
corresponding optimum tube side mass flow for CO2-NH3-H2O mixture/water experiment. It can be concluded
that higher mass flow on tube side is needed to get comparable heat transfer rate for CO2-NH3-H2O mixture
compared to ammonia water. Fig. 6 (right) indicates that when reaching optimum operating conditions, CO2-
NH3-H2O mixture/water experiment can have as much as 5% more heat transferred.
Fig. 7 compares pressure drop on both sides between two experiments with different working fluids. Shell
side pressure drop from the two experiments (left) shows great accordance with each other. Tube side pressure

Shi et al./ 12th IEA Heat Pump Conference00 (2017) O.3.5.2
11
drop comparison (right) indicates that CO2-NH3-H2O mixture has better performance than ammonia water since
it gives lower pressure drop.
4.0 6.0 8.0 10.0 12.0 14.0 16.0 18.0-0.04
-0.03
-0.02
-0.01
0.00
0.01
Mass Flow (shell side) [kg/hr]
Pre
ssure
Dro
p (
shell
sid
e)
[bar]
NH3-H
2O experiment
NH3-H
2O fitting
CO2-NH
3-H
2O experiment
CO2-NH
3-H
2O fitting
0.5 1.0 1.5 2.0 2.5 3.0 3.5 4.0 4.5 5.0
-0.26
-0.22
-0.18
-0.14
-0.10
-0.06
Mass Flow (tube side) [kg/hr]
Pre
ssure
Dro
p (
tube s
ide)
[bar]
NH3-H
2O experiment
NH3-H
2O fitting
CO2-NH
3-H
2O experiment
CO2-NH
3-H
2O fitting
Fig. 7. Comparison of pressure drop as a function of mass flow on the shell side (left) and tube side (right) between two different working
fluids
4.4.Ammonia-water model validation
Ammonia-water/water experiment results are used to validate the ammonia-water theoretical model. Tube
inlet and shell outlet conditions (temperature, pressure, mass flow) are applied to the model as the inputs. Tube
outlet and shell inlet conditions together with other parameters calculated from the model can be compared
with the experimental data. Some of the results are shown in Fig. 8.
400 600 800 1000 1200 1400 1600400
600
800
1000
1200
1400
1600
Heat Load (experiment) [W]
Heat
Load (
model)
[W]
Qt
Qs
0 0.1 0.2 0.3 0.4 0.5 0.6 0.7 0.8
40
50
60
70
80
90
100
110
120
130
Position [m]
Tem
pera
ture
[
C]
ms17.5 experiment
ms17.5 model
ms10.0 experiment
ms10.0 model
Fig. 8. Left: Shell and tube side heat load comparison between experimental data and theoretical model results; Right: Shell side
temperature profile comparison between experimental data and theoretical model results
Fig. 8 (left) compares the heat load of the experimental data and of the theoretical model results on both
sides of the heat exchanger. Heat loads of the experimental data are calculated by multiplying mass flows with
their corresponding enthalpy differences of the fluid. The red dashed lines are the boundaries with±15% error.

Shi et al./ 12th IEA Heat Pump Conference00 (2017) O.3.5.2
12
It can be observed that all the data are within the boundary, the model can predict the heat load of the mini-
channel heat exchanger with reasonable accuracy.
Cooling water temperature profile along the heat exchanger calculated using the theoretical model can be
validated by the experimental data from the ten temperature sensors attached along the shell. Although the
accuracy of these temperature sensors are low, they give an idea about how the trend would be like. Results for
two different operating conditions are shown in Fig. 8 (right). It can be observed that the model has
successfully predicted the shell side temperature profile, because for both cases the slopes of the curves are
similar, also the effective heat exchange area predicted by the model is similar to that of the experimental data.
Since the model starts calculation from the 2-phase condition, the superheated condition at the inlet of the tube
cannot be predicted, this caused the interval between the blue curves.
5. Conclusions
This study is the first to investigate successfully the experimental aspects of the absorption process of a CRHP
with the ternary mixture NH3-CO2-H2O. A model has been developed for ammonia-water which takes into
account the kinetics and mass transfer during the absorption process. The model has been validated against
experiments performed for an absorption process in a mini channel heat exchanger with NH3 concentration of
35 wt%. The results show a good match between the model and the experiments (within 15% error).
Experiments have also been performed with 2.1% CO2 weight fraction and 32.7% NH3 which indicated a heat
flow rate increase of up to 5% when CO2 was added when compared to only ammonia-water. However it
should be remarked that, with CO2 added, the working fluid flow became unstable above 4.0 kg/h.
Acknowledgements
This is an ISPT (Institute for Sustainable Process Technology) project.
References
[1] CBS, 2006. URL: http://statline.cbs.nl/StatWeb/publication/?DM=SLEN&PA=83140ENG&la=en
[2] Van de Bor DM, Infante Ferreira CA, Kiss AA. Low grade waste heat recovery using heat pumps and
power cycles. Energy. 2015;89: 864-873.
[3] Kiss AA, Advanced distillation technologies - design, control and applications. Chichester, UK: John
Wiley & Sons; 2013.
[4] Gudjonsdottir V, Infante Ferreira CA. Comparison of models for calculation of the thermodynamic
properties of NH3-CO2-H2O mixture. International Refrigeration and Air Conditioning Conference; 2016.
[5] Van Leeuwen JM. Absorption and desorption of ammonia-water mixtures in mini-channel heat exchangers. Delft University of Technology. Master thesis; 2011.
[6] Fernandez-Seara J, Sieres J, Rodriguez C, Vazquez M. Ammonia-water absorption in vertical tubular
absorbers. International Journal of Thermal Sciences. 2005; 44: 277-288.
[7] Rijpkema J. Experimental validation of a new ammonia/water absorption model in a minichannel annulus.
Delft University of Technology. Master thesis; 2012.
[8] Nefs CWM, Van de Bor DM, Infante Ferreira CA. Laminar single phase flow distribution in a multi-tube
mini-channel heat exchanger using fractal distribution. Chemical Engineering and Processing.2015; 80:
29–37.
[9] Bird RB, Stewart WE, Lightfoot EN. Transport phenomena. 2nd ed. New York: John Wiley & Sons; 2002.
[10] Muller-Steinhagen H, Heck K. A simple friction pressure drop correlation for two-phase flow in pipes.
Chemical Engineering and Processing: Process Intensification. 1986; 20: 297-308.
[11] Nefs CWM. Experimental validation of a mini-channel multi-tube ammonia-water absorption/desorption model. Delft University of Technology. Master thesis; 2013.
[12] Miyatake O. Laminar-flow heat transfer to a fluid flowing axially between cylinders with a uniform wall
heat flux. Int. J. Heat Mass Transfer. 1991;34: 322–327.
![A Helmholtz free energy equation of state for the NH3-H2O ... › uploadCms › file › 20600 › ... · EOSs [12, 13], Gibbs excess energy models [14-16], Helmoltz free energy models](https://img.dokumen.tips/doc/110x75/5f03afb37e708231d40a4612/a-helmholtz-free-energy-equation-of-state-for-the-nh3-h2o-a-uploadcms-a.jpg)


![[1] H2O, NH3, CH4 대해 분자 내 수소 중심원자 수소가 이루는 각도가 ...gencheminkaist.pe.kr/papers/2005/2005_1_CH101.pdf · 2019-07-09 · [8] You are stranded on](https://img.dokumen.tips/doc/110x75/5e56e5535754a0556c0875f4/1-h2o-nh3-ch4-eoe-e-e-oe-oee-ee-eee.jpg)