Embed Size (px)
Citation preview
1
Delfi Limited (formerly known as Petra Foods Limited) Unaudited Financial Statements and Dividend Announcement For the 1st Quarter Ended 31 March 2017
TABLE OF CONTENTS
PART I - INFORMATION REQUIRED FOR ANNOUNCEMENT OF QUARTERLY (1Q, 2Q, 3Q & 4Q), HALF YEAR AND FULL YEAR RESULTS
1(a) Income Statement 2
1(b) Statement of Financial Position 5
1(c) Cash Flow Statement 10
1(d) Statement of Changes in Equity 12
2 Audit 14
3 Auditors' Report 14
4 Accounting Policies 14
5 Changes in Accounting Policies 14
6 Earnings per Ordinary Share 14
7 Net Asset Value per Share 15
8 Review of Group Performance 15
9 Variance from Prospect Statement 22
10 Prospects 22
11 Dividend 23
12 Statement relating to Dividend 23
13 General Mandate 24
14 Negative Confirmation 24
15 Undertakings from Directors and Executive Officers 24

2
1(a) An income statement and statement of comprehensive income, or a statement of comprehensive income, for the group together with a comparative statement for the corresponding period of the immediately preceding financial year.
Group
1Q ended 31 March
2017 2016 Change
Notes US$'000 US$'000 %
Revenue 1 93,120 103,555 (10.1)
Cost of Sales (62,389) (70,501) (11.5)
Gross Profit 30,731 33,054 (7.0)
Other operating income 759 1,100 (31.0)
Expenses
Selling and distribution costs (17,647) (17,148) 2.9
Administrative expenses (4,595) (4,104) 12.0
Finance costs (801) (1,083) (26.0)
Other operating expenses (24) (130) (81.5)
Share of results of associated companies 244 219 11.4
Profit before income tax 8,667 11,908 (27.2)
Income tax expense 2 (3,042) (3,464) (12.2)
Total profit 3 5,625 8,444 (33.4)
Profit/(loss) attributable to:
Equity holders of the Company 5,625 8,445 (33.4)
Non-controlling interest - (1) NM
5,625 8,444 (33.4)
EBITDA 12,003 14,321 (16.2)
Earnings per ordinary share (US cents) - Basic and Diluteda
- Include Exceptional Items 0.92 1.38 (33.4)
- Exclude Exceptional Items 0.92 1.38 (33.4)
Return on equity
- Include Exceptional items 11.0% 11.8%b (0.8%) pt
- Exclude Exceptional items 11.0% 12.6%b (1.6%) pt
Notes a. As there are no potentially dilutive ordinary shares, diluted Earnings per Share (EPS) is the same as basic Earnings
per Share. EPS is calculated by dividing the net profit attributable to shareholders of the Company by the number of shares of 611,157,000.
b. Relates to FY2016 audited figures.

3
Explanatory notes on income statement
Note 1 - Revenue
(a) Information is based on the location of the markets in which the Group operates.
1Q ended 31 March
2017 2016 Change
US$'000 US$'000 %
Indonesia 64,676 75,854 (14.7)
Regional Markets 28,444 27,701 2.7
93,120 103,555 (10.1)
(b) Breakdown of Sales
1Q ended 31 March
2017 2016 Change
US$'000 US$'000 %
Own Brands 57,481 69,513 (17.3)
Agency Brands 35,639 34,042 4.7
93,120 103,555 (10.1)
Note 2 - Income Tax Expense
Included in income tax expense was withholding tax of US$0.6 million paid by the Company on dividend and royalty income received from its subsidiaries in Indonesia during the quarter under review. (1Q 2016: US$0.4 million).
4
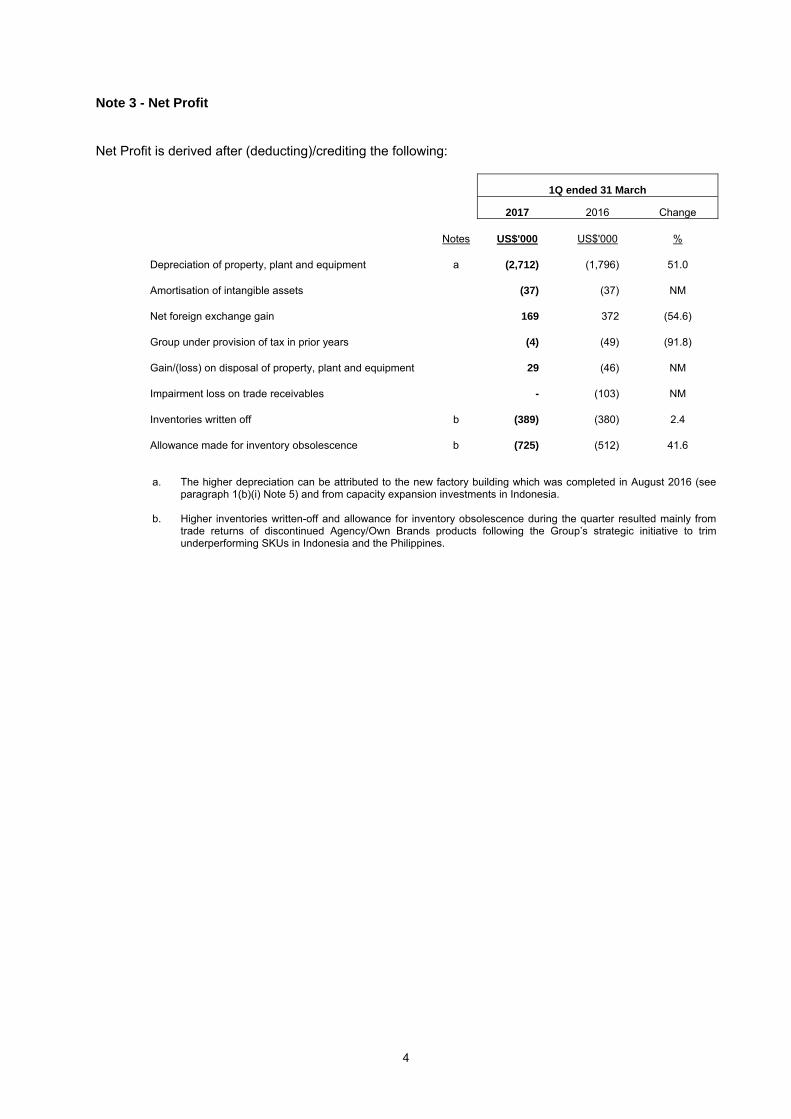
Note 3 - Net Profit
Net Profit is derived after (deducting)/crediting the following:
1Q ended 31 March
2017 2016 Change
Notes US$'000 US$'000 %
Depreciation of property, plant and equipment a (2,712) (1,796) 51.0
Amortisation of intangible assets (37) (37) NM
Net foreign exchange gain 169 372 (54.6)
Group under provision of tax in prior years (4) (49) (91.8)
Gain/(loss) on disposal of property, plant and equipment 29 (46) NM
Impairment loss on trade receivables - (103) NM
Inventories written off b (389) (380) 2.4
Allowance made for inventory obsolescence b (725) (512) 41.6
a. The higher depreciation can be attributed to the new factory building which was completed in August 2016 (see
paragraph 1(b)(i) Note 5) and from capacity expansion investments in Indonesia. b. Higher inventories written-off and allowance for inventory obsolescence during the quarter resulted mainly from
trade returns of discontinued Agency/Own Brands products following the Group’s strategic initiative to trim underperforming SKUs in Indonesia and the Philippines.

5
1(b)(i) A statement of financial position (for the issuer and group), together with a comparative statement as at the end of the immediately preceding financial year.
Group Company
31-Mar-17 31-Dec-16 31-Mar-17 31-Dec-16
Notes US$'000 US$'000 US$'000 US$'000
ASSETS
Current assets
Cash and cash equivalents 67,601 67,737 62,718 60,030
Derivative assets 12 4 12 -
Trade receivables 56,500 61,756 684 1,337
Loan to subsidiaries - - 700 700
Inventories 56,141 54,685 - -
Tax recoverable 1 3,207 5,792 - -
Other current assets 11,227 12,697 988 888
Assets held for sale 2 3,037 - 3,000 -
197,725 202,671 68,102 62,955
Non-current assets
Investments in subsidiaries 3 - - 35,935 35,935
Investments in associated companies and joint ventures 4 900 2,769 900 3,000
Loans to subsidiaries - - -
Loans to associated company and joint venture 925 932 - -
Property, plant and equipment 5 128,218 126,768 827 905
Intangibles assets 5,279 5,243 5,158 5,167
Deferred income tax assets 829 775 - -
Other non-current assets 4,388 3,173 - -
140,539 139,660 42,820 45,007
Total Assets 338,264 342,331 110,922 107,962
LIABILITIES
Current liabilities
Trade payables 27,260 34,689 849 332
Other payables 39,186 37,820 3,872 4,086
Current income tax liabilities 1 4,292 1,382 - -
Derivative liabilities 11 91 - 91
Borrowings 6 35,392 44,197 99 95
106,141 118,179 4,820 4,604
Non-current liabilities
Borrowings 6 10,220 9,578 171 190
Deferred income tax liabilities 1,540 1,628 - -
Provisions for other liabilities and charges 12,301 11,654 - -
24,061 22,860 171 190
Total liabilities 130,202 141,039 4,991 4,794
NET ASSETS 208,062 201,292 105,931 103,168
Capital and reserves attributable to the equity holders of the Company
Share capital 95,936 95,936 95,936 95,936
Foreign currency translation reserve 7 (59,082) (60,228) - -
Other reserves 1,755 1,760 - -
Retained earnings 169,335 163,710 9,995 7,232
207,944 201,178 105,931 103,168
Non controlling interest 118 114 - -
TOTAL EQUITY 208,062 201,292 105,931 103,168

6
Explanatory Notes on Statement of Financial Position Note 1 - Tax Recoverable and Income Tax Liabilities Tax recoverable decreased by US$2.6 million while current income tax liabilities increased by US$2.9 million. This was mainly due to a tax refund of IDR 62 billion (US$4.6 million) received by one of the Company’s Indonesian subsidiaries. Note 2 - Assets held for Sale On 16 March 2017, the Company and its subsidiary, PT Perusahaan Ceres (“Ceres”) entered into a conditional sale and purchase agreement with Meiji Co. Ltd (the “Purchaser”) and Meiji Seika (Singapore) Pte Ltd for the sale of PT Ceres-Meiji Indotoma (“CMI”), an associated company. The Company and Ceres will sell their respective shareholdings - a combined total of 3,750,000 ordinary shares which represents 50% of the total number of issued shares in CMI to the Purchaser for a total consideration of US$8.3 million, to be paid in cash upon completion of the transaction. The proposed disposal is subject to the fulfilment of certain conditions precedent including but not limited to regulatory approvals in Indonesia required to effect the transfer of sale shares and to reflect the purchases as shareholder of the sale shares. The transaction is expected to be completed in 2Q 2017. Assuming the disposal was completed on 31 March 2017, the pre-tax gain on disposal, after deducting fees and other charges associated with the proposed disposal for the Delfi Group would have been approximately US$4.6 million. Note 3 - Investment in Subsidiary On 21 April 2017, the Company announced the signing of a Joint Venture Agreement (“the Agreement) with Japan’s Yuraku Confectionery Company Ltd. The Agreement will see the formation of a Joint Venture Company (“JVC”) in Singapore to produce, develop, market and sell a range of chocolate snack products under the “Delfi” masterbrand (“Products”) in Indonesia. The JVC will be named Delfi Yuraku Pte Ltd and will be the holding company of an operating entity to be incorporated in Indonesia which will produce, market and sell the Products in Indonesia. The JVC’s majority shareholder will be Delfi with a 60% share, while Yuraku will hold the remaining 40%. The total initial capital commitment shall be agreed between Delfi and Yuraku and is estimated at between US$5 million and US$7 million, which will be utilised by the JVC to establish manufacturing and sales & marketing capabilities to develop the business in Indonesia, and fund the initial operations, working capital requirements and other operating expenses. Delfi’s local distribution arm in Indonesia will be appointed as its exclusive distributor of the products in Indonesia. The launch of the JVC is subject to the customary approvals, including regulatory approvals. Note 4 - Investment in Joint Venture On 11 May 2016, the Company announced its joint venture with South Korea’s Orion Corporation. As part of the JV, the Company and Orion established Delfi-Orion Pte. Ltd. (“Delfi-Orion”), a company incorporated in Singapore, will develop, market and sell a range of joint branded confectionery products in Indonesia.

7
On 30 March 2017, the Company subscribed for an additional 900,000 new ordinary shares in Delfi-Orion by paying a cash consideration of US$900,000. As a result of the subscription, the Company holds 900,001 ordinary shares in Delfi-Orion, for a total consideration of US$900,001 representing 50% of the total issued shares of Delfi-Orion. Orion Corporation holds the remaining 50%. The Subscription by the Company in Delfi-Orion was paid in cash and funded through the Company’s internal resources. Note 5 - Capital Expenditure on Property, Plant and Equipment The capital expenditure in 1Q 2017 was incurred mainly to activate the mechanical and engineering works in the new factory building in Indonesia which was completed in August 2016. Funded by the Group’s operating cash flow, the allocation of this capital expenditure by geographical region is as follows:
1Q 2017 1Q 2016
US$'000 US$'000
Indonesia 2,857 1,663
Regional Markets 288 381
3,145 2,044
In light of the continuing uncertainties in Indonesia, the Group will remain vigilant in its capital expenditure for FY2017. Note 6 - Borrowings
Group Company
31-Mar-17 31-Dec-16 31-Mar-17 31-Dec-16
US$'000 US$'000 US$'000 US$'000
Bank overdraft 12,678 22,502 - -
Bank borrowings 25,411 24,088 - -
Finance lease liabilities 977 1,271 270 285
Trade finance 6,546 5,914 - -
45,612 53,775 270 285
Breakdown of borrowings:
Current 35,392 44,197 99 95
Non current 10,220 9,578 171 190
45,612 53,775 270 285
In 1Q 2017, the Group used part of its operating cash flow and tax refund (see Note 1 on page 6) received to reduce its total borrowings by US$8.2 million.
8
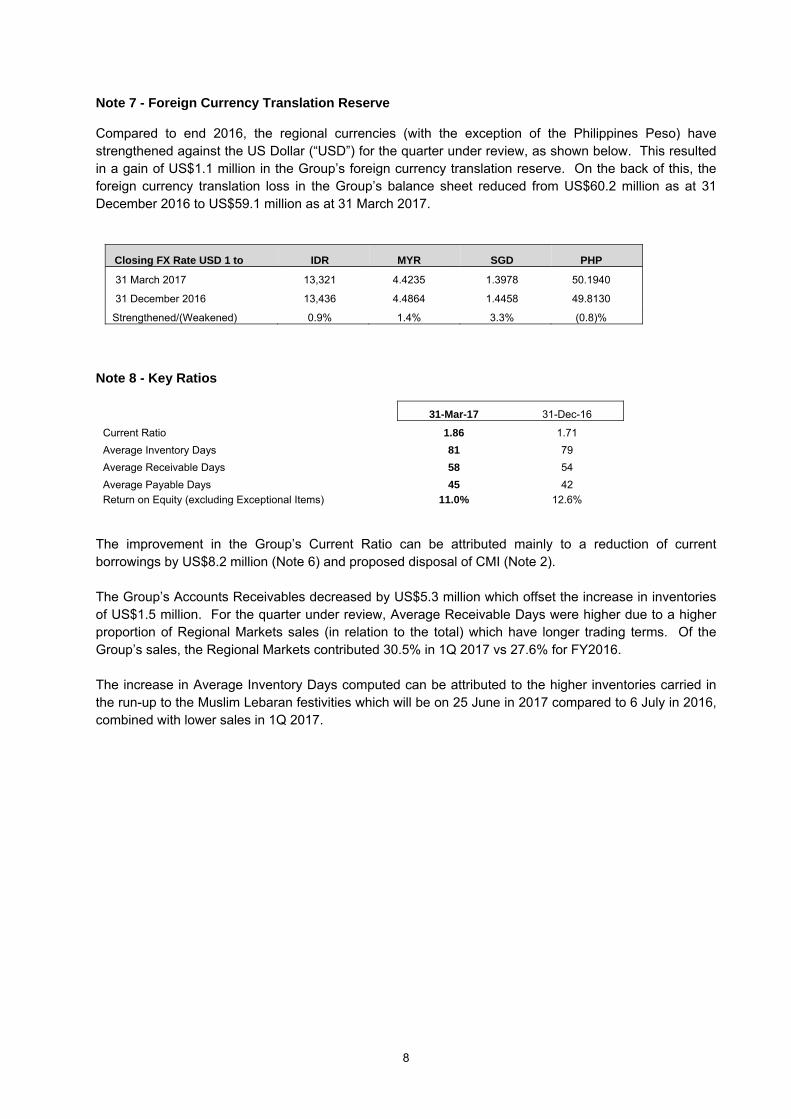
Note 7 - Foreign Currency Translation Reserve Compared to end 2016, the regional currencies (with the exception of the Philippines Peso) have strengthened against the US Dollar (“USD”) for the quarter under review, as shown below. This resulted in a gain of US$1.1 million in the Group’s foreign currency translation reserve. On the back of this, the foreign currency translation loss in the Group’s balance sheet reduced from US$60.2 million as at 31 December 2016 to US$59.1 million as at 31 March 2017.
Closing FX Rate USD 1 to IDR MYR SGD PHP
31 March 2017 13,321 4.4235 1.3978 50.1940
31 December 2016 13,436 4.4864 1.4458 49.8130
Strengthened/(Weakened) 0.9% 1.4% 3.3% (0.8)%
Note 8 - Key Ratios
31-Mar-17 31-Dec-16
Current Ratio 1.86 1.71
Average Inventory Days 81 79
Average Receivable Days 58 54
Average Payable Days 45 42
Return on Equity (excluding Exceptional Items) 11.0% 12.6% The improvement in the Group’s Current Ratio can be attributed mainly to a reduction of current borrowings by US$8.2 million (Note 6) and proposed disposal of CMI (Note 2). The Group’s Accounts Receivables decreased by US$5.3 million which offset the increase in inventories of US$1.5 million. For the quarter under review, Average Receivable Days were higher due to a higher proportion of Regional Markets sales (in relation to the total) which have longer trading terms. Of the Group’s sales, the Regional Markets contributed 30.5% in 1Q 2017 vs 27.6% for FY2016. The increase in Average Inventory Days computed can be attributed to the higher inventories carried in the run-up to the Muslim Lebaran festivities which will be on 25 June in 2017 compared to 6 July in 2016, combined with lower sales in 1Q 2017.
9
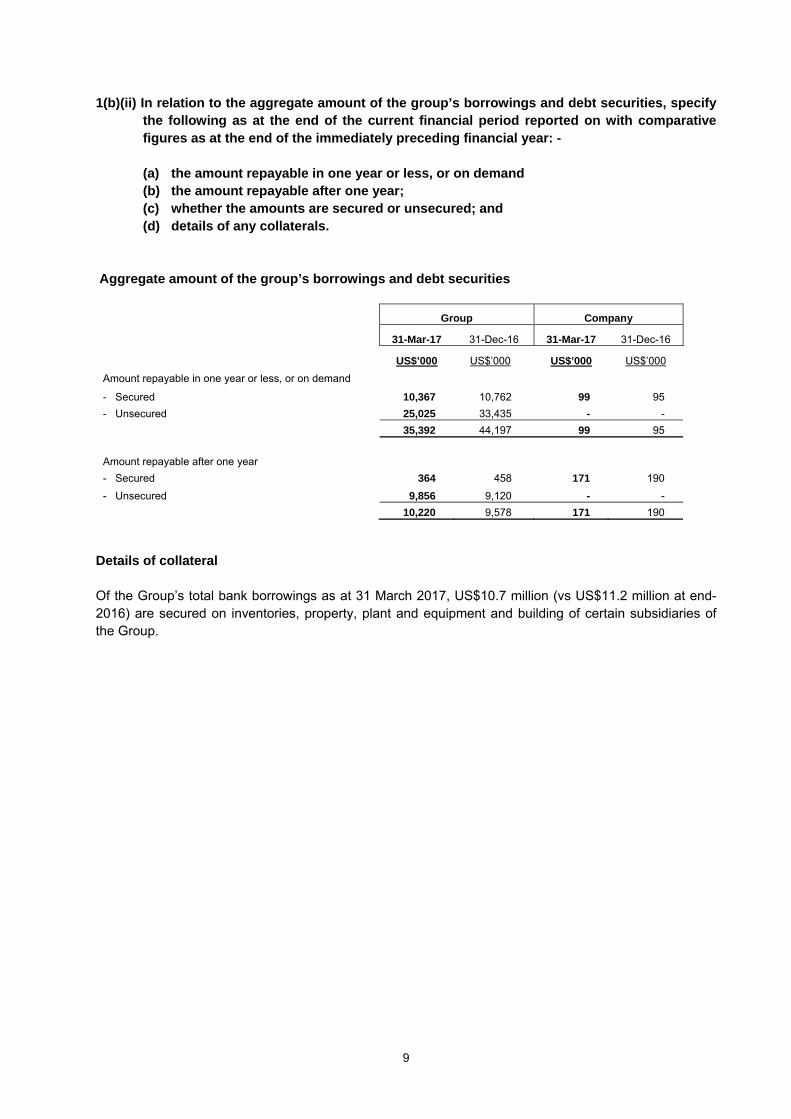
1(b)(ii) In relation to the aggregate amount of the group’s borrowings and debt securities, specify the following as at the end of the current financial period reported on with comparative figures as at the end of the immediately preceding financial year: -
(a) the amount repayable in one year or less, or on demand (b) the amount repayable after one year; (c) whether the amounts are secured or unsecured; and (d) details of any collaterals.
Aggregate amount of the group’s borrowings and debt securities
Group Company
31-Mar-17 31-Dec-16 31-Mar-17 31-Dec-16
US$’000 US$’000 US$’000 US$’000
Amount repayable in one year or less, or on demand
- Secured 10,367 10,762 99 95
- Unsecured 25,025 33,435 - -
35,392 44,197 99 95
Amount repayable after one year
- Secured 364 458 171 190
- Unsecured 9,856 9,120 - -
10,220 9,578 171 190
Details of collateral Of the Group’s total bank borrowings as at 31 March 2017, US$10.7 million (vs US$11.2 million at end-2016) are secured on inventories, property, plant and equipment and building of certain subsidiaries of the Group.

10
1(c) A statement of cash flows (for the group), together with a comparative statement for the corresponding period of the immediately preceding financial year.
Period ended
Notes 31-Mar-17 31-Mar-16
US$'000 US$'000
Cash flows from operating activities
Total profit 5,625 8,444
Adjustments:
Income tax expense 3,042 3,464
Depreciation and amortisation 2,749 1,833
(Gain)/loss on disposal of property, plant and equipment (29) 46
Interest income (211) (503)
Interest expense 801 1,083
Fair value (gain)/loss on derivatives (88) 61
Share of results of associated companies (244) (219)
Operating cash flow before working capital changes 11,645 14,209
Change in working capital
Inventories (1,456) 1,685
Trade and other receivables 5,511 (8,819)
Trade and other payables (6,124) 6,295
Cash generated from operations 9,576 13,370
Interest received 211 503
Income tax received/(paid) See para 1(b) Note
1 on page 6 2,297 (3,403)
Net cash provided by operating activities 12,084 10,470
Cash flows from investing activities
Purchases of property, plant and equipment (3,145) (2,019)
Payments for patents and trademarks (16) (42)
Proceeds from disposal of property, plant and equipment 39 99
Net cash used in investing activities (3,122) (1,962)
Cash flows from financing activities
Proceeds from bank borrowings 7,607 217
Proceeds from trade finance 632 1,931
Repayment of bank borrowings (6,334) (10,152)
Repayment of lease liabilities (302) (1,053)
Interest paid (801) (1,097)
Net cash provided by/(used in) financing activities 802 (10,154)
Net increase/(decrease) in cash and cash equivalents 9,764 (1,646)
Cash and cash equivalents
Beginning of financial year 45,235 100,550
Effects of currency translation on cash and cash equivalents (76) (696)
End of financial year 54,923 98,208
11
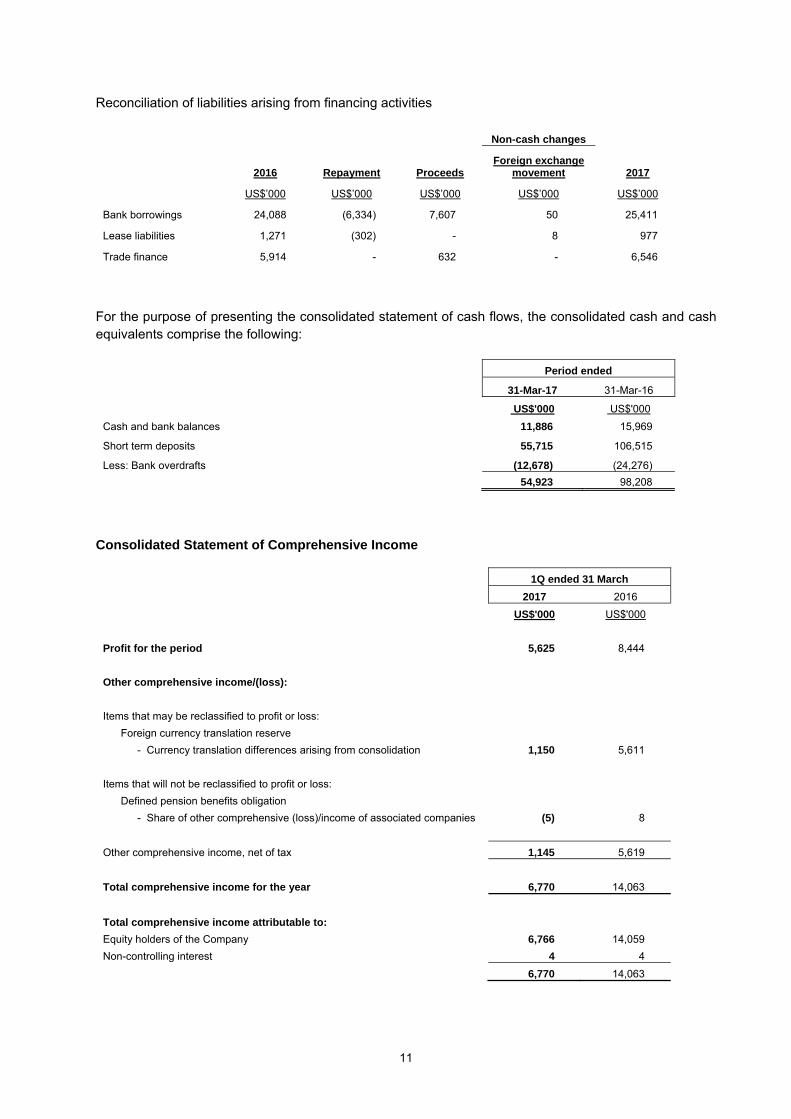
Reconciliation of liabilities arising from financing activities
2016 Repayment
Non-cash changes
2017 Proceeds Foreign exchange
movement
US$’000 US$’000 US$’000 US$’000 US$’000
Bank borrowings 24,088 (6,334) 7,607 50 25,411
Lease liabilities 1,271 (302) - 8 977
Trade finance 5,914 - 632 - 6,546 For the purpose of presenting the consolidated statement of cash flows, the consolidated cash and cash equivalents comprise the following:
Period ended
31-Mar-17 31-Mar-16
US$'000 US$'000
Cash and bank balances 11,886 15,969
Short term deposits 55,715 106,515
Less: Bank overdrafts (12,678) (24,276)
54,923 98,208
Consolidated Statement of Comprehensive Income
1Q ended 31 March
2017 2016
US$'000 US$'000
Profit for the period 5,625 8,444
Other comprehensive income/(loss):
Items that may be reclassified to profit or loss:
Foreign currency translation reserve
- Currency translation differences arising from consolidation 1,150 5,611
Items that will not be reclassified to profit or loss:
Defined pension benefits obligation
- Share of other comprehensive (loss)/income of associated companies (5) 8
Other comprehensive income, net of tax 1,145 5,619
Total comprehensive income for the year 6,770 14,063
Total comprehensive income attributable to:
Equity holders of the Company 6,766 14,059
Non-controlling interest 4 4
6,770 14,063

12
1(d)(i) A statement (for the issuer and group) showing either (a) all changes in equity or (b) changes in equity other than those arising from capitalization issues and distributions to shareholders, together with a comparative statement for the corresponding period of the immediately preceding financial year.
Attributable to equity holders of the Company
Share capital
Foreign currency
translation reserve
General reserve
Defined pension benefits
obligation Retained earnings Total
Non-controlling
interest Total
equity
US$’000 US$’000 US$’000 US$’000 US$’000 US$’000 US$’000 US$’000
The Group
1Q 2017
Balance at 1 January 2017a 95,936 (60,228) 2,222 (462) 163,710 201,178 114 201,292
Profit for the period - - - - 5,625 5,625 - 5,625 Other comprehensive income/(loss) for the period - 1,146 - (5) - 1,141 4 1,145
Balance at 31 March 2017 95,936 (59,082) 2,222 (467) 169,335 207,944 118 208,062
The Group
1Q 2016
Balance at 1 January 2016 155,951 (62,066) 2,147 98 145,904 242,034 120 242,154
Profit/(loss) for the period - - - - 8,445 8,445 (1) 8,444
Total comprehensive income for the period - 5,606 - 8 - 5,614 5 5,619
Balance at 31 March 2016 155,951 (56,460) 2,147 106 154,349 256,093 124 256,217
a. On 23 June 2016, the Company reduced share capital by US$60.0 million under a court-sanctioned Capital Reduction Scheme.

13
Statement of Changes in Equity for the Company
Attributable to equity holders of the Company
Share capital
Retained earnings
Total equity
US$’000 US$’000 US$’000
The Company
1Q 2017
Balance at 1 January 2017a 95,936 7,232 103,168
Profit for the period - 2,763 2,763
Balance at 31 March 2017 95,936 9,995 105,931
The Company
1Q 2016
Balance at 1 January 2016 155,951 315 156,266
Profit for the period - 754 754
Balance at 31 March 2016 155,951 1,069 157,020
a. On 23 June 2016, the Company reduced share capital by US$60.0 million under a court-sanctioned Capital Reduction Scheme.
The change in the Company’s share capital can be attributed to the Capital Reduction Exercise which was completed in FY2016. 1(d)(ii) Details of any changes in the company’s share capital arising from rights issue, bonus
issue, share buy-backs, exercise of share options or warrants, conversion of other issues of equity securities, issue of shares for cash or as consideration for acquisition or for any other purpose since the end of the previous period reported on. State the number of shares that may be issued on conversion of all the outstanding convertibles, if any, against the total number of issued shares excluding treasury shares and subsidiary holdings of the issuer, as at the end of the current financial period reported on and as at the end of the corresponding period of the immediately preceding financial year. State also the number of shares held as treasury shares and the number of subsidiary holdings held against the total number of shares outstanding in a class that is listed as at the end of the current financial period reported on and as at the end of the corresponding period of the immediately preceding financial year.
For 1Q 2017 ended 31 March 2017, there was no change in issued and paid up share capital of the Company.
The Company has not issued any convertibles nor holds any treasury shares. There is no subsidiary holdings held against the total number of shares outstanding in a class that is listed.
1(d)(iii) To show the total number of issued shares excluding treasury shares as at the end of the
current financial period and as at the end of the immediately preceding year. Not applicable - See para 1(d)(ii) above. 1(d)(iv) A statement showing all sales, transfers, cancellation and/or use of treasury shares as at
the end of the current financial year reported on.
Not applicable - See para 1(d)(ii) above.
14
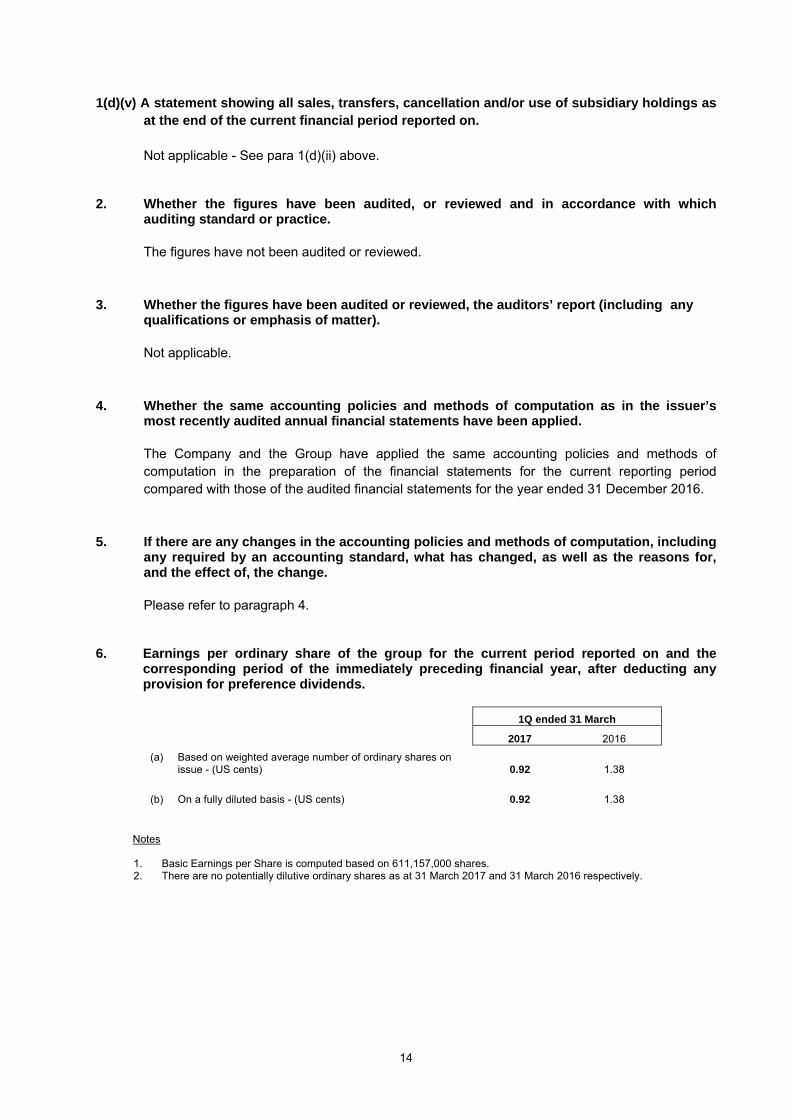
1(d)(v) A statement showing all sales, transfers, cancellation and/or use of subsidiary holdings as at the end of the current financial period reported on.
Not applicable - See para 1(d)(ii) above. 2. Whether the figures have been audited, or reviewed and in accordance with which
auditing standard or practice. The figures have not been audited or reviewed. 3. Whether the figures have been audited or reviewed, the auditors’ report (including any
qualifications or emphasis of matter). Not applicable. 4. Whether the same accounting policies and methods of computation as in the issuer’s
most recently audited annual financial statements have been applied. The Company and the Group have applied the same accounting policies and methods of computation in the preparation of the financial statements for the current reporting period compared with those of the audited financial statements for the year ended 31 December 2016.
5. If there are any changes in the accounting policies and methods of computation, including
any required by an accounting standard, what has changed, as well as the reasons for, and the effect of, the change.
Please refer to paragraph 4. 6. Earnings per ordinary share of the group for the current period reported on and the
corresponding period of the immediately preceding financial year, after deducting any provision for preference dividends.
1Q ended 31 March
2017 2016
(a)
Based on weighted average number of ordinary shares on issue - (US cents) 0.92 1.38
(b) On a fully diluted basis - (US cents) 0.92 1.38
Notes
1. Basic Earnings per Share is computed based on 611,157,000 shares. 2. There are no potentially dilutive ordinary shares as at 31 March 2017 and 31 March 2016 respectively.

15
7. Net asset value (for the issuer and group) per ordinary share based on total number of issued shares excluding treasury shares of the issuer at the end of the:
(a) current period reported on; and (b) immediately preceding financial year.
Group Company
31-Mar-17 31-Dec-16 31-Mar-17 31-Dec-16
Net asset value per ordinary share based on issued share capital - (US cents) 34.0 32.9 17.3 16.9
8. A review of the performance of the group, to the extent necessary for a reasonable
understanding of the group’s business. It must include a discussion of the following:
(a) any significant factors that affected the turnover, costs, and earnings of the group for the current financial period reported on, including (where applicable) seasonal or cyclical factors; and
(b) any material factors that affected the cash flow, working capital, assets or
liabilities of the group during the current financial period reported on. Key Figures for the Group (unaudited)
1Q ended 31 March
2017 2016 Change in %
US$'000 US$'000 In USD
term In constant
exchange rate
Indonesia 64,676 75,854 (14.7) (16.6)
Regional Markets 28,444 27,701 2.7 8.1
REVENUE 93,120 103,555 (10.1) (10.0)
Indonesia 11,972 14,436 (17.1) (19.2)
Regional Markets 31 (115) (127.0) (166.3)
EBITDA 12,003 14,321 (16.2) (18.0)
Profit before tax 8,667 11,908 (27.2) (29.0)
Net profit attributable to shareholders 5,625 8,445 (33.4) (35.4)
Key performance indicators
1Q ended 31 March
2017 2016 %
Gross profit margin 33.0% 31.9% 1.1 pt
Notes: 1 The Group’s income statement used the following average exchange rate(s) in translating the results of its subsidiaries into USD term. For 1Q 2017
Average FX Rate USD 1 to
Indonesian Rupiah (IDR)
Malaysian Ringgit (MYR)
Singapore Dollar (SGD)
Philippines Peso (PHP)
1Q 2017 13,375 4.4518 1.4228 49.9647
1Q 2016 13,679 4.2118 1.4141 47.5163
Strengthened/(Weakened) Y-o-Y 2.2% (5.7%) (0.6%) (5.2%)

16
Review of the Group’s 1Q 2017 Financial Performance
Figure 1 - Key Financial Highlights
Note: * For comparative purposes only, this shows the effect of using the respective exchange rates of the regional currencies in 1Q 2016 in translating 1Q 2017 results.
The Group reported revenue of US$93.1 million and PATMI of US$5.6 million for 1Q 2017. The Group’s 1Q 2017 sales performance was affected by the on-going product portfolio rationalization exercise which was implemented in 2016, and an on-going review of trading terms. The product rationalization programme is an initiative we have undertaken to eliminate lower performing SKU’s so that we can focus on our core brands and products, and drive forward higher margin products. In the short term, there is an impact on sales and profitability but this is a stronger base to grow from. In addition, the sales in Indonesia in 1Q 2016 reflected higher than usual deliveries to our trade customers as they undertook a programme to replenish their supply pipeline which in 2015 had been reduced as they minimized orders in reaction to the weak consumption environment in Indonesia.
For the Regional Markets, the higher 1Q 2017 sales achieved can be attributed to higher Agency Brands sales although Own Brands sales achieved reasonable growth despite the on-going product rationalization exercise.
On the back of the lower sales, the Group’s EBITDA was lower by 16.2% Y-o-Y. The Group’s 1Q
2017 Gross Profit Margin of 33.0% improved by 1.1% point Y-o-Y reflecting lower input costs which offset higher depreciation following the completion of the new production building in Bandung in August last year.
The Group’s PATMI of US$5.6 million (▼33.4% Y-o-Y) reflected a higher effective tax rate on the back of higher withholding tax paid by the Company on dividend and royalty income received from its Indonesian subsidiaries. See “Note 2 - Income Tax Expense” on page 3.
For 1Q 2017, the Group generated Free Cash Flow of US$8.1 million (higher Y-o-Y by 20.9%) which was utilized to reduce borrowings. In addition, the Group’s cash balance of US$67.6
(In US$ Million) 1Q 2017 1Q 2016
Indonesia 64.7 75.9 (14.7%) (16.6%)
The Regional Markets 28.4 27.7 2.7% 8.1%
Total Revenue 93.1 103.6 (10.1%) (10.0%)
Gross Profit Margin (%) 33.0% 31.9% 1.1% pt 1.1% pt
EBITDA 12.0 14.3 (16.2%) (18.0%)
EBITDA Margin (%) 12.9% 13.8% (0.9% pt) (1.2% pt)
PATMI 5.6 8.4 (33.4%) (35.4%)
% chg Y-o-Y in Constant
Exch Rates *% chg Y-o-Y
17
million at 31 March 2017 is adequate to support the Group’s foreseeable near term business and investment needs.
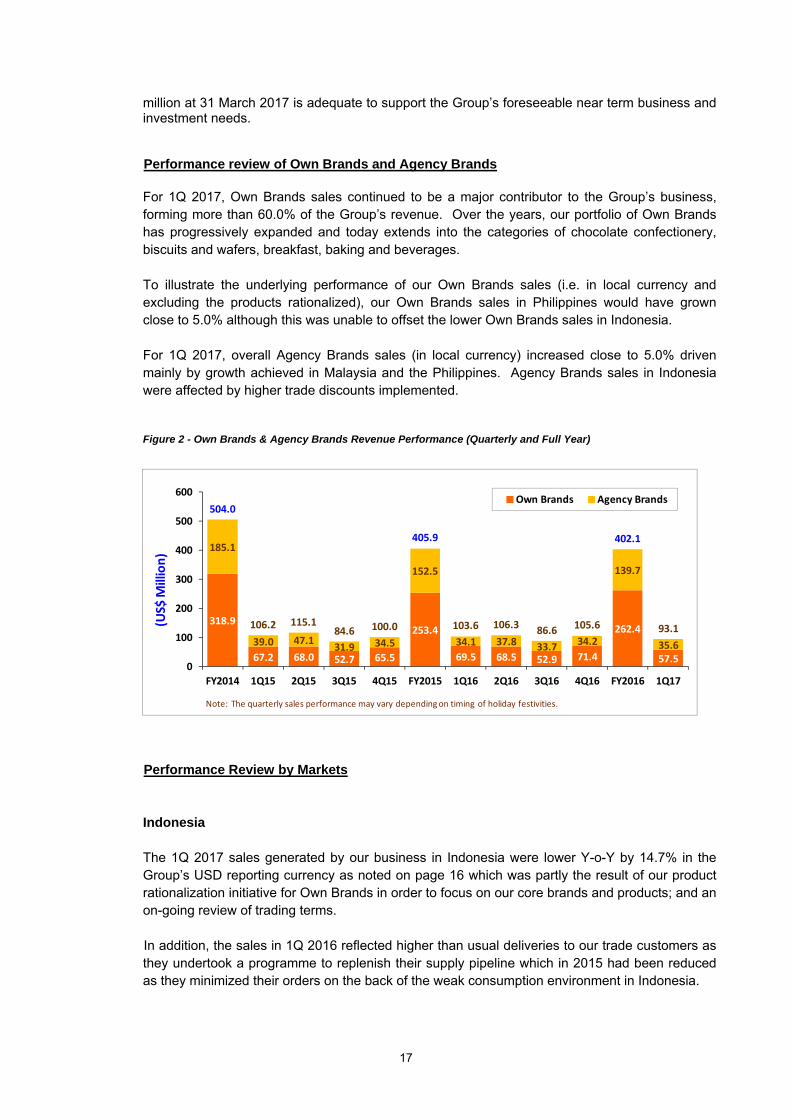
Performance review of Own Brands and Agency Brands
For 1Q 2017, Own Brands sales continued to be a major contributor to the Group’s business,
forming more than 60.0% of the Group’s revenue. Over the years, our portfolio of Own Brands has progressively expanded and today extends into the categories of chocolate confectionery, biscuits and wafers, breakfast, baking and beverages.
To illustrate the underlying performance of our Own Brands sales (i.e. in local currency and
excluding the products rationalized), our Own Brands sales in Philippines would have grown close to 5.0% although this was unable to offset the lower Own Brands sales in Indonesia.
For 1Q 2017, overall Agency Brands sales (in local currency) increased close to 5.0% driven
mainly by growth achieved in Malaysia and the Philippines. Agency Brands sales in Indonesia were affected by higher trade discounts implemented.
Figure 2 - Own Brands & Agency Brands Revenue Performance (Quarterly and Full Year)
Performance Review by Markets
Indonesia
The 1Q 2017 sales generated by our business in Indonesia were lower Y-o-Y by 14.7% in the Group’s USD reporting currency as noted on page 16 which was partly the result of our product rationalization initiative for Own Brands in order to focus on our core brands and products; and an on-going review of trading terms. In addition, the sales in 1Q 2016 reflected higher than usual deliveries to our trade customers as they undertook a programme to replenish their supply pipeline which in 2015 had been reduced as they minimized their orders on the back of the weak consumption environment in Indonesia.
318.9
67.2 68.0 52.7 65.5
253.4
69.5 68.5 52.9 71.4
262.4
57.5
185.1
39.0 47.131.9 34.5
152.5
34.1 37.8 33.7 34.2
139.7
35.6
504.0
106.2 115.184.6 100.0
405.9
103.6 106.386.6 105.6
402.1
93.1
0
100
200
300
400
500
600
FY2014 1Q15 2Q15 3Q15 4Q15 FY2015 1Q16 2Q16 3Q16 4Q16 FY2016 1Q17
Own Brands Agency Brands
(US$ M
illion)
Note: The quarterly sales performance may vary depending on timing of holiday festivities.
18
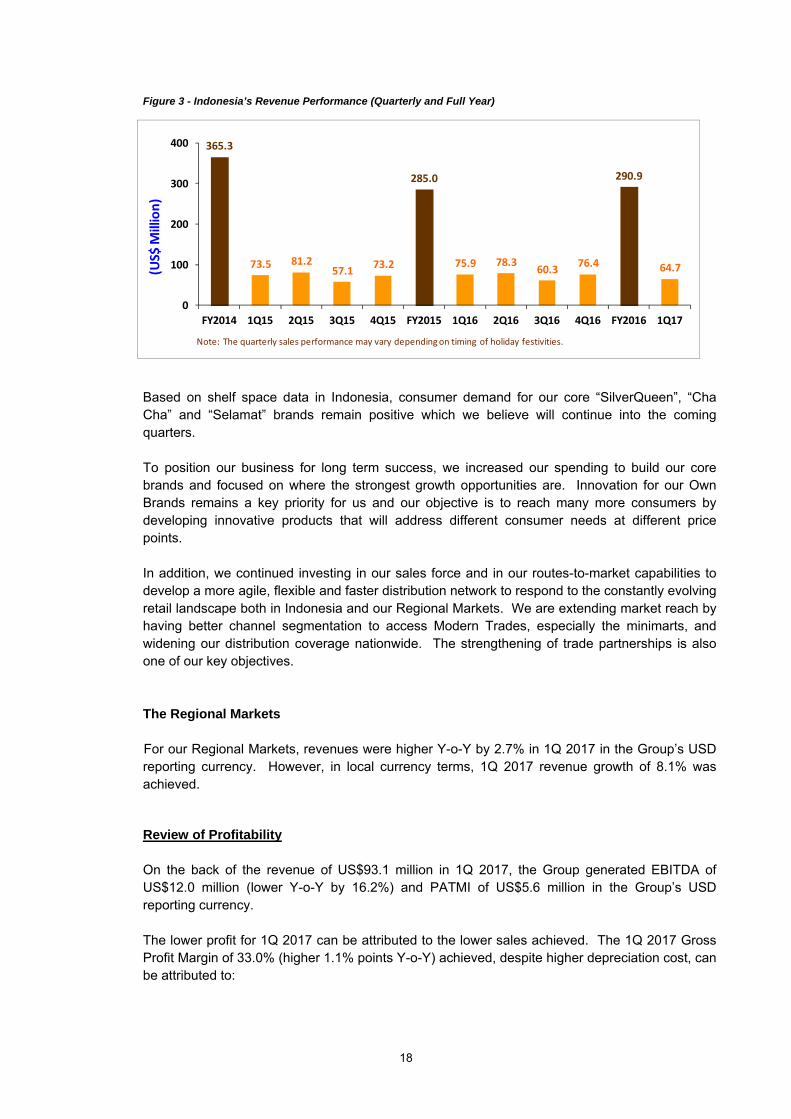
Figure 3 - Indonesia’s Revenue Performance (Quarterly and Full Year)
Based on shelf space data in Indonesia, consumer demand for our core “SilverQueen”, “Cha Cha” and “Selamat” brands remain positive which we believe will continue into the coming quarters. To position our business for long term success, we increased our spending to build our core brands and focused on where the strongest growth opportunities are. Innovation for our Own Brands remains a key priority for us and our objective is to reach many more consumers by developing innovative products that will address different consumer needs at different price points. In addition, we continued investing in our sales force and in our routes-to-market capabilities to develop a more agile, flexible and faster distribution network to respond to the constantly evolving retail landscape both in Indonesia and our Regional Markets. We are extending market reach by having better channel segmentation to access Modern Trades, especially the minimarts, and widening our distribution coverage nationwide. The strengthening of trade partnerships is also one of our key objectives. The Regional Markets
For our Regional Markets, revenues were higher Y-o-Y by 2.7% in 1Q 2017 in the Group’s USD reporting currency. However, in local currency terms, 1Q 2017 revenue growth of 8.1% was achieved.
Review of Profitability On the back of the revenue of US$93.1 million in 1Q 2017, the Group generated EBITDA of US$12.0 million (lower Y-o-Y by 16.2%) and PATMI of US$5.6 million in the Group’s USD reporting currency. The lower profit for 1Q 2017 can be attributed to the lower sales achieved. The 1Q 2017 Gross Profit Margin of 33.0% (higher 1.1% points Y-o-Y) achieved, despite higher depreciation cost, can be attributed to:
365.3
73.5 81.257.1
73.2
285.0
75.9 78.360.3
76.4
290.9
64.7
0
100
200
300
400
FY2014 1Q15 2Q15 3Q15 4Q15 FY2015 1Q16 2Q16 3Q16 4Q16 FY2016 1Q17
(US$ M
illion)
Note: The quarterly sales performance may vary depending on timing of holiday festivities.
19
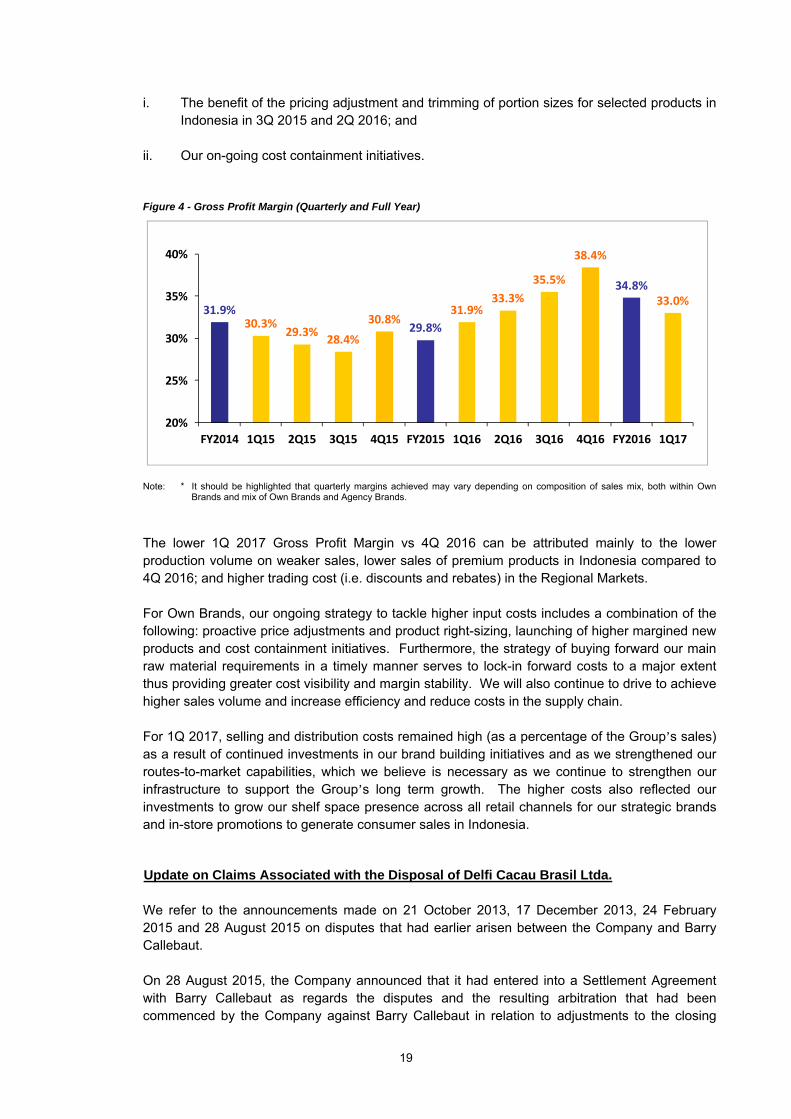
i. The benefit of the pricing adjustment and trimming of portion sizes for selected products in Indonesia in 3Q 2015 and 2Q 2016; and
ii. Our on-going cost containment initiatives.
Figure 4 - Gross Profit Margin (Quarterly and Full Year)
Note: * It should be highlighted that quarterly margins achieved may vary depending on composition of sales mix, both within Own
Brands and mix of Own Brands and Agency Brands.
The lower 1Q 2017 Gross Profit Margin vs 4Q 2016 can be attributed mainly to the lower production volume on weaker sales, lower sales of premium products in Indonesia compared to 4Q 2016; and higher trading cost (i.e. discounts and rebates) in the Regional Markets. For Own Brands, our ongoing strategy to tackle higher input costs includes a combination of the following: proactive price adjustments and product right-sizing, launching of higher margined new products and cost containment initiatives. Furthermore, the strategy of buying forward our main raw material requirements in a timely manner serves to lock-in forward costs to a major extent thus providing greater cost visibility and margin stability. We will also continue to drive to achieve higher sales volume and increase efficiency and reduce costs in the supply chain. For 1Q 2017, selling and distribution costs remained high (as a percentage of the Group’s sales) as a result of continued investments in our brand building initiatives and as we strengthened our routes-to-market capabilities, which we believe is necessary as we continue to strengthen our infrastructure to support the Group’s long term growth. The higher costs also reflected our investments to grow our shelf space presence across all retail channels for our strategic brands and in-store promotions to generate consumer sales in Indonesia.
Update on Claims Associated with the Disposal of Delfi Cacau Brasil Ltda.
We refer to the announcements made on 21 October 2013, 17 December 2013, 24 February 2015 and 28 August 2015 on disputes that had earlier arisen between the Company and Barry Callebaut. On 28 August 2015, the Company announced that it had entered into a Settlement Agreement with Barry Callebaut as regards the disputes and the resulting arbitration that had been commenced by the Company against Barry Callebaut in relation to adjustments to the closing
31.9%30.3%
29.3%28.4%
30.8%29.8%
31.9%33.3%
35.5%
38.4%
34.8%33.0%
20%
25%
30%
35%
40%
FY2014 1Q15 2Q15 3Q15 4Q15 FY2015 1Q16 2Q16 3Q16 4Q16 FY2016 1Q17

20
price that had been paid by Barry Callebaut to the Company. The Company had also announced that as part of the settlement, the parties had mutually agreed to terminate the SPA dated 28 August 2015 although the parties agreed that certain environmental, tax and other warranties would continue (of which the environmental and tax warranties are time-limited). On 28 August 2015, the Company also announced that the Brazilian tax claims (which were previously announced on 24 February 2015) would continue to be contested. On 24 February 2015, the Company had announced that Barry Callebaut had notified the Company of various claims from the Brazil tax authorities against the former Delfi Cacau Brazil Ltda (“DCBR”), which Barry Callebaut purchased as part of the sale of the Cocoa Ingredients business. In the Company’s announcement made on 28 August 2015, the Company also pointed out that although the settlement agreement fully settled the dispute over the closing price adjustments, Barry Callebaut remained entitled to bring any further claims that may arise under the continuing warranties. The Company wishes to add that on 20 December 2016, it received notifications (in Portugese) of new Brazilian tax claims (‘the Notifications’) which were sent to the Company by Barry Callebaut, which are as follows: 1. A new claim of BRL 12,751,426/- in connection with tax assessment of the “Social
Integration Program / Public Employee Savings Program (PIS)” and the “Contribution for the Financing of Social Security (COFINS)”;
2. 2 separate new claims of BRL 29,177,666/- and BRL 1,270,319/- respectively for
allegedly unpaid tax duties arising from the import of cocoa beans; and 3. 2 new claims of BRL 297,830/- and BRL 155,334/- respectively, for allegedly incorrect or
‘over stating’ credits due arising from tax assessments from prior years. Through its advisors and consultants, the Company has checked the Notifications. The Company has requested Barry Callebaut to defend these new tax claims, as Management believes that there are grounds to resist these claims.
The Company also wishes to highlight that the existing tax claims previously announced or disclosed, have been revised by the local authorities or that these have progressed as follows:
1. The claim of BRL 18,588,594/- in connection with a tax assessment of the PIS/COFINS, has been revised to BRL 23,063,648/-;
2. The claim of BRL 227,440/- for unpaid import tax arising from the import of a bean roaster, has been revised to BRL 953,992/-;
3. The claim of BRL 15,643,285/- for the restitution of taxes and import duties arising from the import of cocoa beans, has been revised to BRL 19,331,972/-; and
4. The unquantified claim based on a Labour complaint on account of DCBR having
“outsourced” work it allegedly should not have outsourced to ‘contract workers’, has been referred on appeal to the 2nd level judicial court.
21
Taking into account the revisions made to the quantum of the tax claims, the existing claims which amounted to BRL 34,459,319/-, have been revised to BRL 43,349,612/- (equivalent to US$13,752,291/- based on end-March 2017 exchange rate). Taking into account all new claims and existing claims, the Company’s total exposure in respect of tax and labour claims in Brazil amount to BRL 87,002,187/- (equivalent to US$27,600,694/- based on end-March 2017 exchange rate). The Company will keep the shareholders updated of material developments in relation to the existing and new Brazilian claims. While reserving its rights in relation to the Notifications, the Company has requested Barry Callebaut to defend these claims. There are grounds to resist these claims. In assessing the relevant liabilities, management has considered among other factors industry developments in the current financial year and the legal environment in Brazil, and assessed that the amounts recognized in respect of these claims are adequate as at 31 December 2016. As management considers the disclosure of further details of these claims can be expected to prejudice seriously the Group’s position in relation to the claims, further information has not been disclosed in the Group’s financial statements.
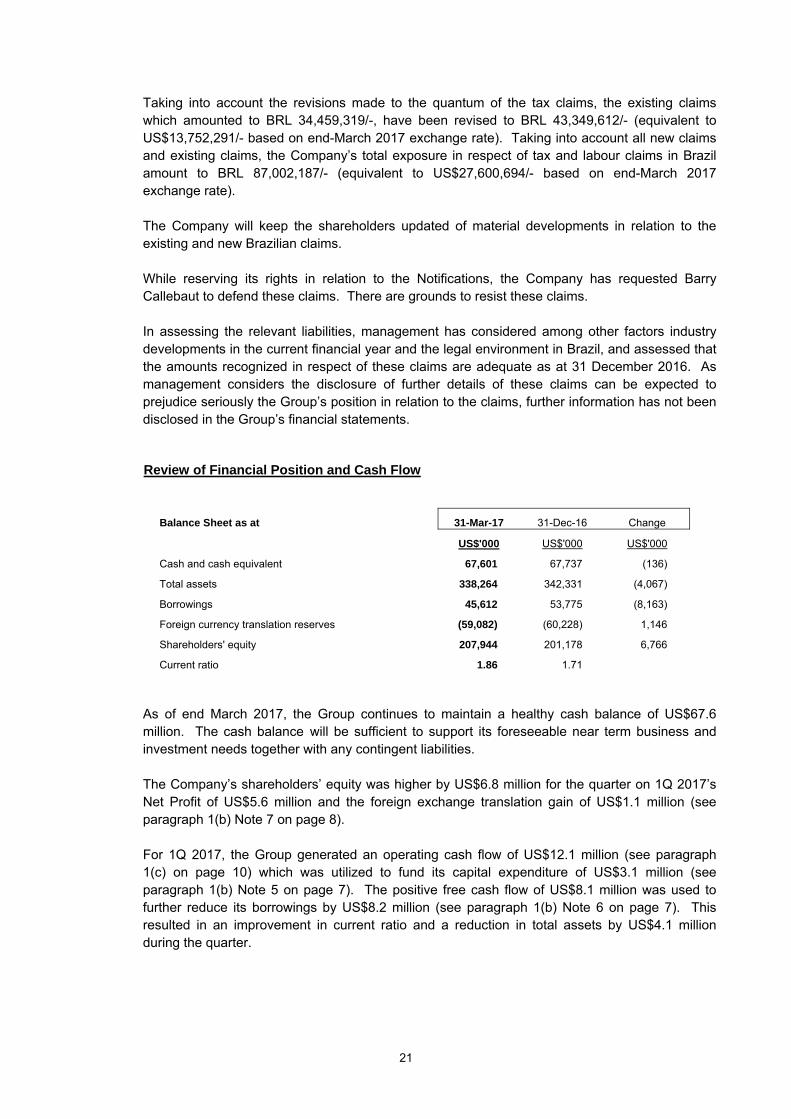
Review of Financial Position and Cash Flow
Balance Sheet as at 31-Mar-17 31-Dec-16 Change
US$'000 US$'000 US$'000
Cash and cash equivalent 67,601 67,737 (136)
Total assets 338,264 342,331 (4,067)
Borrowings 45,612 53,775 (8,163)
Foreign currency translation reserves (59,082) (60,228) 1,146
Shareholders' equity 207,944 201,178 6,766
Current ratio 1.86 1.71
As of end March 2017, the Group continues to maintain a healthy cash balance of US$67.6 million. The cash balance will be sufficient to support its foreseeable near term business and investment needs together with any contingent liabilities.
The Company’s shareholders’ equity was higher by US$6.8 million for the quarter on 1Q 2017’s Net Profit of US$5.6 million and the foreign exchange translation gain of US$1.1 million (see paragraph 1(b) Note 7 on page 8). For 1Q 2017, the Group generated an operating cash flow of US$12.1 million (see paragraph 1(c) on page 10) which was utilized to fund its capital expenditure of US$3.1 million (see paragraph 1(b) Note 5 on page 7). The positive free cash flow of US$8.1 million was used to further reduce its borrowings by US$8.2 million (see paragraph 1(b) Note 6 on page 7). This resulted in an improvement in current ratio and a reduction in total assets by US$4.1 million during the quarter.
22
9. Where a forecast, or a prospect statement, has been previously disclosed to shareholders, any variance between it and the actual results.
The Group’s 1Q 2017 are below the expectations which had been indicated in paragraph 10 of the Group’s “4Q and FY2016 Unaudited Financial Statement and Dividend Announcement”.
10. A commentary at the date of the announcement of significant trends and the competitive
conditions of the industry in which the group operates and any known factors or events that may affect the group in the next reporting period and the next 12 months.
It is unclear at this stage how prolonged the present economic and currency volatility in our core
markets will be. As a result, we believe consumers and retailers in our markets will continue to face tough conditions with economic uncertainty likely to weigh on consumer confidence. The Group’s focus is to continuously work closely with our trade customers and partners to grow our business by ensuring that our brands are always available, properly displayed and at the right price points. Furthermore, we will continue to invest in innovation for our core Own Brands as this remains a key priority for us with our objective to reach many more consumers by developing innovative products that will address different consumer needs at different price points.
In addition to growing sales of our continuing Own Brands products to replace sales lost due to
the product portfolio rationalization, we will focus on driving cost efficiencies throughout our organization and our supply chain. Through this combination of top line focus and stepped up productivity efforts, after taking into account our 1Q 2017 results and the gain from the disposal of our 50% stake in PT Ceres-Meiji Indotama1 which is expected to be completed in 2Q 2017, we expect, barring unforeseen circumstances, the Group’s financial performance in FY2017 to be similar to FY2016. We will further strengthen the Group’s cash flow generation through tighter working capital management and focused capital expenditure.
To sustain profitable growth over the longer term, despite the challenging environment and intensifying competition, we are continuously taking actions to further strengthen our business to capture the significant growth opportunities and find new paths to grow. These include: i. Ensuring our organization is well aligned to our growth plans; ii. Making targeted and disciplined investments to grow our key brands in our markets.
Innovation remains a key part of this strategy, whether it is through product innovation in order to provide us the competitive edge or through continuous reinvention to stay relevant by creating excitement at the shelf space in order to further reinforce the position of our core brands;
iii. Implementing a multi-channel strategy to adapt to the continuously evolving retail
landscape where our objectives are to further broaden and deepen our routes-to-market in order to capture the growth opportunities; and
iv. Prudently invest to build capacity and capabilities where there are clear expansion
opportunities and increase our productivity and efficiency targets in our production and distribution infrastructure.
1 Refer to “Note 2 - Assets held for Sale” on page 6.

23
Despite the current uncertainties in our markets, we believe our geographic and product portfolio positions us well for future growth. Over the long term, the consumption environment in our regional markets will continue to be supported by the robust economies and the fast growing middle income classes. Our success in our core markets is rooted in our undertaking that our organization must always be ready to adapt to changing times and nimble to cope with the fast moving world. To add further value over the longer term to our quality earnings, we will continue to explore opportunities to enter new markets and to extend to new categories if these opportunities meet our investment criteria.
11. Dividend
a. Current Financial Period Reported On
Whether an interim (final) ordinary dividend has been declared (recommended)? No b. Corresponding Period of the Immediately Preceding Financial Year
Any interim/final dividend declared for the preceding financial period reported on? No
c. Date payable
Not applicable.
d. Books closure date
Not applicable.
12. If no dividend has been declared (recommended), a statement to that effect.
No dividend has been declared for the quarter ended 31 March 2017 (31 March 2016: Nil). For the financial year ended 31 December 2016, the Company’s Shareholders have approved the proposed final dividend of 1.35 Singapore cents per share at the Annual General Meeting held on 26 April 2017. The final dividend will be paid on 19 May 2017.

24
13. If the Group has obtained a general mandate from shareholders for IPTs, the aggregate value of such transactions as required under Rule 920(1)(a)(ii). If no IPT mandate has been obtained, a statement to that effect. The Company has obtained a general mandate (“Shareholders’ Mandate”) from its shareholders for the Group’s IPTs with the following interested persons. The Shareholders’ mandate was approved at the Annual General Meeting (“AGM”) of the Company held on 26 April 2017 and will be effective until the next AGM. The aggregate value of transactions conducted pursuant to the general mandate is as follows:
1 Aggregate value of all transactions conducted under a shareholders' mandate
pursuant to Rule 920 of the SGX Listing Manual
1Q 2017
US$’000
PT Freyabadi Indotama
- Sales of goods 162
- Purchase of products 3,831
3,993
PT Fajar Mataram Sedayu
- Purchase of goods 134
4,127
14. Negative confirmation pursuant to Rule 705(5)
On behalf of the Board, we, directors of the Company, Mr Chuang Tiong Choon and Mr Chuang Tiong Kie, hereby confirm to the best of our knowledge that nothing has come to the attention of the Board of Directors of the Company which may render the financial results of the Group for the 1st Quarter ended 31 March 2017 to be false or misleading.
15. Confirmation that the issuer has procured undertakings from all its directors and
executive officers (in the format set out in Appendix 7.7) under Rule 720(1)
The Group has procured undertakings from all its directors and executive officers. BY ORDER OF THE BOARD Raymond Lam Kuo Wei/Evelyn Chuang Secretaries 8 May 2017