Embed Size (px)
Citation preview

U.S. Department of Education Washington, DC 20202
Delaware ReportYear 4: School Year 2013 –2014
April 2015

Delaware Year 4: School Year 2013 –2014 Race to the Top 2
Executive Summary
Race to the Top overview On February 17, 2009, President Obama signed into law the American Recovery and Reinvestment Act of 2009 (ARRA), historic legislation designed to stimulate the economy, support job creation, and invest in critical sectors, including education. ARRA provided $4.35 billion for the Race to the Top fund, of which approximately $4 billion was used to fund comprehensive statewide reform grants under the Race to the Top program.1
In 2010, the U.S. Department
of Education (Department) awarded Race to the Top Phase 1 and Phase 2 grants to 11 States and the District of Columbia. The Race to the Top program is a competitive four-year grant program designed to encourage and reward States that are creating the conditions for education innovation and reform; achieving significant improvement in student outcomes, including making substantial gains in student achievement, closing achievement gaps, and improving high school graduation rates; and ensuring students are prepared for success in college and careers. Since the Race to the Top Phase 1 and 2 competitions, the Department has made additional grants under the Race to the Top Phase 3, Race to the Top – Early Learning Challenge,2 and Race to the Top – District3 competitions.
The Race to the Top program is built on the framework of comprehensive reform in four education reform areas:
• Adopting rigorous standards and assessments that prepare students for success in college and the workplace;
• Building data systems that measure student success and inform teachers and principals how they can improve their practices;
• Recruiting, developing, retaining, and rewarding effective teachers and principals; and
• Turning around the lowest-performing schools.
Since education is a complex system, sustained and lasting instructional improvement in classrooms, schools, local educational agencies (LEAs), and States will not be achieved through piecemeal change. Race to the Top builds on the local contexts of States and LEAs participating in the State’s Race to the Top plan (participating LEAs)4 in the design and implementation of the most effective and innovative approaches that meet the needs of their educators, students, and families.
1 The remaining funds were awarded under the Race to the Top Assessment program. More information about the Race to the Top Assessment program is available at www.ed.gov/programs/racetothetop-assessment.
2 More information on the Race to the Top – Early Learning Challenge can be found at http://www2.ed.gov/programs/racetothetop-earlylearningchallenge/index.html.
3 More information on Race to the Top – District can be found at http://www2.ed.gov/programs/racetothetop-district/index.html.
4 Participating local educational agencies (LEAs) are those LEAs that choose to work with the State to implement all or significant portions of the State’s Race to the Top plan, as specified in each LEA’s Memorandum of Understanding with the State. Each participating LEA that receives funding under Title I, Part A will receive a share of the 50 percent of a State’s grant award that the State must subgrant to LEAs, based on the LEA’s relative share of Title I, Part A allocations in the most recent year, in accordance with section 14006(c) of the American Recovery and Reinvestment Act (ARRA).
Race to the Top program reviewAs part of the Department’s commitment to supporting States as they implement ambitious reform agendas, the Department established the Implementation and Support Unit (ISU) in the Office of the Deputy Secretary to administer, among others, the Race to the Top program. The goal of the ISU was to provide assistance to States as they implement unprecedented and comprehensive reforms to improve student outcomes. Consistent with this goal, the Department has developed a Race to the Top program review process that not only addresses the Department’s responsibilities for fiscal and programmatic oversight, but is also designed to identify areas in which Race to the Top grantees need assistance and support to meet their goals. Specifically, the ISU worked with Race to the Top grantees to differentiate support based on individual State needs, and helped States work with each other and with experts to achieve and sustain educational reforms that improve student outcomes. In partnership with the ISU, the Reform Support Network (RSN) offers collective and individualized technical assistance and resources to Race to the Top grantees. The RSN’s purpose is to support Race to the Top grantees as they implement reforms in education policy and practice, learn from each other, and build their capacity to sustain these reforms.5 At the end of Year 4, the Department created the Office of State Support to continue to provide support to States across programs as they implement comprehensive reforms. The Office of State Support will administer programs previously administered by the ISU.
Grantees are accountable for the implementation of their approved Race to the Top plans, and the information and data gathered throughout the program review process help to inform the Department’s management and support of the Race to the Top grantees, as well as provide appropriate and timely updates to the public on their progress. In the event that adjustments are required to an approved plan, the grantee must submit a formal amendment request to the Department for consideration. States may submit for Department approval amendment requests to a plan and budget, provided such changes do not significantly affect the scope or objectives of the approved plans. In the event that the Department determines that a grantee is not meeting its goals, activities, timelines, budget, or annual targets, or is not fulfilling other applicable requirements, the Department will take appropriate enforcement action(s), consistent with 34 CFR section 80.43 in the Education Department General Administrative Regulations (EDGAR).6
5 More information can be found at http://www2.ed.gov/about/inits/ed/implementation-support-unit/tech-assist/index.html.
6 More information about the Implementation and Support Unit’s (ISU’s) program review process, State Annual Performance Report (APR) data, and State Scopes of Work can be found at http://www2.ed.gov/programs/racetothetop/index.html.

Delaware Year 4: School Year 2013 –2014 Race to the Top 3
Executive Summary
State-specific summary reportThe Department uses the information gathered during the review process (e.g., through monthly calls, onsite reviews, and Annual Performance Reports (APRs)) to draft State-specific summary reports. The State-specific summary report serves as an assessment of a State’s annual Race to the Top implementation. The Year 4 report for Phase 2 grantees highlights successes and accomplishments, identifies challenges, and provides lessons learned from implementation from approximately September 2013 through September 2014. Given that Delaware and Tennessee’s initial four-year grant periods ended in June and July 2014, respectively, for Phase 1 grantees, the Year 4 report includes the beginning of the no-cost extension year (Year 5).
State’s education reform agendaDelaware’s 2009 strategic plan, created with input from more than 150 educators, parents, community members, funders, and supporters, is the State’s blueprint for improving classroom instruction and ensuring that every student graduates from high school college- and career-ready. The State’s Race to the Top plan builds on this blueprint and leverages the State’s $119,122,128 grant to catalyze and accelerate implementation of the strategic plan.
Delaware’s broad goals under Race to the Top include setting high standards for college- and career-readiness; measuring progress with high-quality assessments and robust data systems; recruiting, retaining, developing and supporting great teachers and leaders who can help all students meet high standards; building core capabilities to promote great teaching and leadership; accelerating improvements in the State’s high-need schools; and building capacity at State and local levels to meet its goals. In July 2010, Delaware was one of the first two States to receive a Race to the Top grant.
State Years 1 through 3 summaryThe Delaware Department of Education (DDOE) worked to build critical project management capacity to support LEAs and implement Race to the Top initiatives. In Year 1, it created the Delivery Unit, the Teacher and Leader Effectiveness Unit, and the School Turnaround Unit. In addition, it launched the LEA Support Program to help LEAs develop and implement their plans. In Year 2, the State focused on increasing the quality of implementation of its plan through its performance management processes and leveraged routines to help LEAs continuously improve implementation. DDOE progressed toward a consolidated, performance-based management approach in Year 3.
The State sought to support its LEAs and schools in making the transition to college- and career-ready standards and aligned high-quality assessments. In Year 1, the State provided educators with initial Common Core State Standards (CCSS) training. To prepare for the roll-out of the CCSS in Year 3, DDOE developed curricular and training materials for educators in Year 2. DDOE anticipated full
instructional implementation of the CCSS for kindergarten through twelfth grade (K-12) by the end of Year 3; however, the fidelity of implementation varied by LEA. To address this challenge the State kicked off its Common Ground for the Common Core program in Year 3. In addition, the State took steps to prepare to fully implement the assessments being developed by the Smarter Balanced Assessment Consortium (Smarter Balanced) in school year (SY) 2014-2015.
Delaware also worked to improve its data system capabilities. The State improved educator access to student data through the Education Insight Portal, which provides stakeholders with access to relevant information from the State’s longitudinal data system in Year 2. In Year 3, continued improvement of statewide professional learning community (PLC) implementation indicated that a culture of data analysis was developing throughout the State.
In addition, the State implemented various support programs for teachers and principals, with Year 1 being a critical preparation year. In Year 2, the State opened new pipelines for qualified teachers and principals seeking to teach in Delaware and continued use of Components I-IV of its evaluation system to inform decisions regarding educators in tested and non-tested grades and subjects.7 In Year 3, the State fully implemented its educator evaluation system and included Component V— a revised measurement of student growth for all K-12 educators. Delaware also collaborated with the Harvard Strategic Data Project to analyze statewide human capital data and sought to better understand the impact of initiatives geared toward educator recruitment, placement, development, evaluation and retention in Year 3.
Delaware also launched the Partnership Zone to turn around its lowest-achieving schools and selected the first cohort of schools to implement Partnership Zone intervention plans in Year 1. In Year 2, Delaware implemented Partnership Zone intervention plans in four schools selected in Year 1 and selected a second cohort of schools to implement intervention plans in Year 3. In Year 3, Delaware implemented Partnership Zone intervention plans in six additional schools.
State Year 4 summaryDelaware has made significant strides toward accomplishing its Race to the Top goals, though it encountered some implementation challenges and delays.
AccomplishmentsIn Year 4, DDOE implemented its Race to the Top reforms with an eye towards long-term sustainability. Working toward this goal, in Year 4 the State better integrated its project management office within the State educational agency’s (SEA) overall structure. As part of this shift, the State refined its LEA performance management routines 7 Delaware’s teacher and principal evaluation system, the Delaware Performance
Appraisal System II (DPAS-II), includes five components. Components I-IV (also referred to as traditional teacher evaluation metrics) are as follows: (1) Planning and Preparation, (2) Classroom Environment, (3) Instruction, and (4) Professional Responsibilities. The final component (Component V) is a student improvement component based on academic achievement scores.
Delaware Year 4: School Year 2013 –2014 Race to the Top 4
Executive Summary
to increase SEA staff collaboration. The State also continued to investigate ways to align other federal funds with Race to the Top projects.
During Year 4, Delaware supported its LEAs and schools through State-provided programs and resources that focused on the State’s transition to college- and career-ready standards and aligned high-quality assessments. Throughout the year, 99 of Delaware’s 236 schools participated in the Common Ground for the Common Core program, a program supporting full instructional implementation of the CCSS. The State prepared for the transition to Smarter Balanced assessments in SY 2014-2015 by providing training and resources to help ensure that educators understood the difference between the level of rigor of the Delaware Comprehensive Assessment System (DCAS) and Smarter Balanced assessments. The State also developed new strategies to increase student participation and success in Advanced Placement (AP) courses and continued to pay for Preliminary Scholastic Aptitude Test (PSAT) and Scholastic Aptitude Test (SAT) for all Delaware high school sophomores and juniors.
In Year 4, Delaware continued its focus on ensuring broad use of education data to improve student achievement. The State trained educators by providing them with resources so they could more easily access State and local student data. The State also gathered stakeholder feedback to inform refinements to its Education Insight Portal. The State continued statewide implementation of PLCs, providing a forum for educators to collaborate with their colleagues on data-driven instructional strategies, and subsidized the cost for 39 schools to continue to provide the data coach support.
Throughout Year 4, Delaware continued to analyze educator evaluation, development, placement, recruitment, and retention data, and used its findings to improve DDOE policies and practices. For example, SY 2013-2014 marked the second year of full implementation of the Delaware Performance Appraisal System (DPAS-II) for all educators in K-12; and after analyzing student growth data, educators’ evaluation ratings, and educators’ responses to an annual survey about the DPAS-II process, the State developed a Year One Continuous Improvement report. In addition, the State’s internal capacity to manage its Educator Recruitment Portal (www.joindelawareschools.org) initiative grew after it hired a full-time Deputy Officer of Recruitment and Selection, and the State signed up 17 traditional LEAs and 18 charter school LEAs to use the statewide portal by the end of Year 4. The State also revised Regulation 290, which complements Delaware Senate Bill (SB) 51, and, according to the State, together raises the bar for local preparation programs while mandating that DDOE monitor the performance of program graduates in Delaware schools.8
8 Delaware Senate Bill (SB) 51 was passed into Delaware State law in June 2013, requiring annual reporting of preparation program graduates’ effectiveness data. It also required programs to have increased rigor for entrance into teacher preparation programs, increased data collection, performance assessments, clinical experiences, and content knowledge exams. Revisions to Regulation 290 that complemented SB 51 took effect on July 1, 2014, and included a Delaware Department of Education (DDOE)-led educator preparation program approval and renewal process.
ChallengesDDOE supported many LEAs and schools transitioning to full instructional implementation of the CCSS through the Common Ground for the Common Core program in Year 4, but not all LEAs and schools took advantage of the voluntary program. In response, DDOE leveraged its LEA performance management routines to hold LEAs accountable for high-quality CCSS implementation in Year 4. According to DDOE, the State monitored and supported its LEAs to ensure they had curricula that are fully aligned to the CCSS, and LEAs made substantial progress in Year 4.
In Year 4, it remained challenging for DDOE to meet goals related to stakeholder use of data provided through the State’s longitudinal data system. According to the State, the goals established were artificially high, given the number of possible users in the State. In addition, many Delaware LEAs prefer commercially-provided systems over the State’s Education Insight Portal.
The State is still at an early phase of some projects geared toward ensuring access to effective teachers and leaders in every Delaware school. Due to earlier project delays (e.g., with finalizing the technical infrastructure), the State did not launch the strategic marketing campaign for its Educator Recruitment Portal until Year 4. In addition, due to vendor management challenges and lower than expected LEA demand for the Delaware Talent Management Program, the State scaled back the amount and type of human capital services provided in Year 4. Moreover, the State has not met Delaware Talent Cooperative program goals to issue 600 retention and 240 transfer bonuses by SY 2013-2014, though it significantly increased the number of retention bonuses awarded in Year 4.
Implementation challenges persisted for some aspects of the DPAS-II system in Year 4. For example while the State remained committed to continuous improvement of the DPAS-II system, summative ratings continued to show little variation in overall teacher quality.
While Delaware’s 10 Partnership Zone schools received comprehensive supports and monitoring from the School Turnaround Unit, one Cohort II school did not meet the criteria to exit Partnership Zone status, and a school from Cohort I was re-identified a Partnership Zone school after it did not meet adequate yearly progress (AYP) in SY 2013-2014. DDOE began to re-envision how the State could better support improvement in Delaware’s highest-need schools, including focusing on attracting school leaders with a demonstrated ability to implement interventions.
Looking aheadIn SY 2014-2015 (Year 5), Delaware indicated that it will continue implementing its highest priority reforms and continue its use of data to drive decision-making. The State received no-cost extensions to continue many reforms, so Race to the Top funds, State funds, and other resources will contribute to the State’s implementation efforts in SY 2014-2015. The State plans to use data to drive actions
Delaware Year 4: School Year 2013 –2014 Race to the Top 5
Executive Summary
at the SEA and LEA levels, for example in educator evaluation system implementation, as the State continues to improve CCSS implementation and makes the full transition to Smarter Balanced assessments. The State plans to use its State assessment as a measure of Component V (the student improvement component) as it had in Years 3 and 4; however, in Year 5, as the State transitions to Smarter Balanced assessments, this measure will be considered an informational measure and will not be factored into educators’ and administrators’ Component V ratings. Instead, administrators and educators teaching tested grades and subjects will have a Component V rating that includes measures that are similar to educators teaching non-tested grades and subjects (see Great Teachers and Leaders). This will serve as an educator’s rating of record and will be used for human capital decisions.
The State intends to continue its focus on increasing the number of college- and career-ready Delaware students by continuing statewide implementation of the PSAT and SAT and implementing initiatives to increase the number of students taking, successfully completing,
and passing AP courses and exams. DDOE intends to improve functionality and promote usage of the longitudinal data system and Education Insight Portal at the LEA and school levels as it continues implementation of PLCs. Moreover, the State plans to continue analyzing educator recruitment, placement, retention, evaluation, and development data, as it continues implementation of some of its Great Teachers and Leaders projects, including projects that require additional time to meet goals. The State will also implement a few additional projects that build on initiatives DDOE implemented in Years 1 through 4, including establishing up to two additional alternative routes to certification.
In Year 5, DDOE plans to link DPAS-II and student achievement results to teacher preparation programs and publicly report teacher preparation program effectiveness data. Delaware also plans to continue providing supports to the State’s lowest-achieving schools, while focusing on improving school leadership within the schools requiring intervention and support.
State Success Factors
Race to the Top States are developing a comprehensive and coherent approach to education reform. This involves creating plans to build strong statewide capacity to implement, scale up, and sustain the reforms initiated by the Race to the Top grant program.
Building capacity to support LEAsA major goal of Delaware’s Race to the Top plan is to strengthen DDOE’s capacity to support the State’s LEAs as they implement key initiatives. Specifically, the State believed that if it leveraged the support of local leaders committed to improving education in Delaware, strengthened DDOE’s capacity to actively performance manage at the SEA and LEA levels, and improve teacher and leader effectiveness and support school turnaround, DDOE would become a more outcomes-oriented organization. Therefore, the State created and leveraged a project management office, consisting of the Delivery Unit, Teacher and Leader Effectiveness Unit, and School Turnaround Unit, to deliver against and actively support LEA implementation of ambitious Race to the Top reforms in Years 1 through 3. In Year 4, the State shifted its focus to long-term sustainability by better integrating its project management office into the SEA’s overall structure and refining its LEA performance management routines to increase SEA staff collaboration. Specifically, DDOE replaced its LEA liaison structure with Cross-Agency Teams consisting of SEA staff working on various State reform priorities, and leveraged this new structure to support LEA implementation and to better understand local progress toward goals. Moreover, the State’s focus on increased alignment resulted in the launch of an updated approval process for LEA consolidated grant applications. The State continued implementation
of a tiered support and accountability structure for LEAs based on student growth and other indicators of continuous improvement, which allowed DDOE to better allocate limited State resources to support LEAs. The State regularly collected and analyzed data, such as the information gathered through its Human Capital Analytics project, allowing the State to implement a more rigorous and timely LEA oversight process that resulted in individualized LEA support plans. The State also continued to investigate ways to align other federal funds with Race to the Top projects.
Although DDOE reported that it’s Cross-Agency Teams and tiered support and accountability structure allowed the State to be more responsive to LEA needs during Year 4, according to selected LEA representatives some communications challenges resulted from SEA staffing changes and shifts in LEA expectations. The State acknowledged SEA capacity challenges at various points in Year 4 but reported limited LEA service interruptions and that it felt that it was able to ensure that Race to the Top projects stayed generally on track.
As the State considered how best to approach sustaining highest-priority reforms initiated during the Race to the Top grant period, DDOE engaged with the RSN’s Sustainability Workgroup throughout Year 4. In doing so, the State assessed its existing approach to sustaining priority reforms against comprehensive criteria, took key steps to improve its approach, empowered SEA staff to use

Delaware Year 4: School Year 2013 –2014 Race to the Top 6
State Success Factors
DDOE’s performance management processes to manage progress on implementation of sustainability strategies, and shared insights gained during this process with other States participating in the Sustainability Workgroup. Delaware was also featured in the Department’s brief,
“Performance Management: Collecting and Using Data to Measure Progress, Improve Results,” which looks at the ways that Delaware and another State implemented routines and processes for collecting, analyzing and monitoring data to inform continuous improvement, provide feedback and make decisions about their reforms.9
Support and accountability for LEAsDDOE supported LEAs and held them accountable in Year 4 through site visits, the State’s Cross-Agency Teams, monthly Chiefs’ meetings, LEA progress reviews, and annual performance evaluations.10 Similar to previous years, such structures allowed DDOE to track LEA performance, support LEAs based on challenges faced and outcomes achieved, and helped to ensure that LEAs implemented Race to the Top projects as outlined in their plans. Varying the level of support and frequency of contact with LEAs, DDOE prioritized support and closely monitored project implementation for the LEAs most in need of assistance. In Year 4, seven of Delaware’s LEAs were assigned to the “intense” tier, requiring DDOE to provide them with the highest level of support and onsite visits. DDOE did not evaluate Race to the Top project implementation beyond fiscal accountability for its 18 participating charter schools, which receive five percent of the State’s LEA Race to the Top funds. DDOE reported that its Charter Office conducted charter-LEA specific programmatic monitoring; however, such monitoring did not focus on Race to the Top project implementation in Year 4. According to the State, DDOE conducted the same Race to the Top fiscal monitoring for its charter schools and traditional LEAs. Delaware also implemented a new Academic Performance Framework for charter school accountability in Year 4, which it plans to consider using for traditional LEAs as the State plans for deeper alignment across the SEA.
DDOE revised the format of progress reviews and performance evaluations to allocate more time for SEA and LEA leadership teams to discuss and develop actions plans to correct identified deficiencies in Race to the Top implementation. DDOE helped its LEAs analyze the data during progress and performance reviews and partnered
9 Reform Support Network (RSN) publications can be found at http://www2.ed.gov/about/inits/ed/implementation-support-unit/tech-assist/index.html.
10 DDOE’s project management office differentiated its monitoring and support of traditional LEAs’ Race to the Top project implementation in Year 4, but it did not oversee programmatic Race to the Top monitoring for the State’s charter LEAs. Therefore, the monitoring and support described in this section refers to DDOE’s work to improve Race to the Top project implementation in the State’s traditional LEAs only.
with each LEA to craft a plan to address the challenges faced. In Year 4, DDOE conducted a thorough data analysis for each LEA and identified trends for discussion during end of year performance evaluation meetings. During the meetings, the State asked LEAs to share best practices and root causes that attributed to performance increases or decreases in each area. The State also broadened the list of meeting participants to include a school board member and teacher’s union representative.
In between progress reviews (held during the school year) and end of school year performance reviews, DDOE leaders regularly interacted with LEA leadership during monthly Chiefs’ meetings and through its new Cross-Agency Teams structure. During the Chiefs’ meetings, DDOE discusses with LEA leadership statewide performance successes and challenges by reporting on school- and LEA-level student outcomes. In Year 4, these meetings also focused on major education policy and practice changes happening within the State, such as the transition to Smarter Balanced assessments, SB 51 requirements for educator preparation programs, and a focus on personalized student learning in classrooms. Year 4 was the first year DDOE implemented its new Cross-Agency Teams structure, which replaced assigned LEA liaisons. DDOE phased out LEA liaisons after receiving feedback from some stakeholders that the liaisons had some knowledge gaps around LEA context and their Race to the Top Success Plans. According to DDOE, its Cross-Agency Teams better leverage information that resides within various DDOE offices. In the new structure, data are reviewed at the State level and each functional unit assigns a representative to a Cross-Agency Team for each LEA. Therefore, the State reported that Cross-Agency Teams allowed for deeper cross-departmental collaboration and engagement in supporting LEAs, as well as greater awareness of LEA implementation challenges in Year 4.
Delaware fully launched Version 3.0 of its consolidated grant system, Education Success Planning and Evaluation System (ESPES) in summer 2014, roughly one year later than planned. ESPES fully integrates all SEA program areas and requires that LEAs submit consolidated grant applications for DDOE review and approval. During summer 2014, the State’s new Cross-Agency Teams partnered with the consolidated grant team to review each LEA’s consolidated grant application and Implementation Plan, a SY 2014-2015 plan that builds on an LEA’s Race to the Top Success Plan. According to the State, as DDOE marshals evidence from all program offices to assess LEA performance, it is able to better utilize data in decision-making and hold LEAs accountable for doing the same.
Delaware Year 4: School Year 2013 –2014 Race to the Top 7
State Success Factors
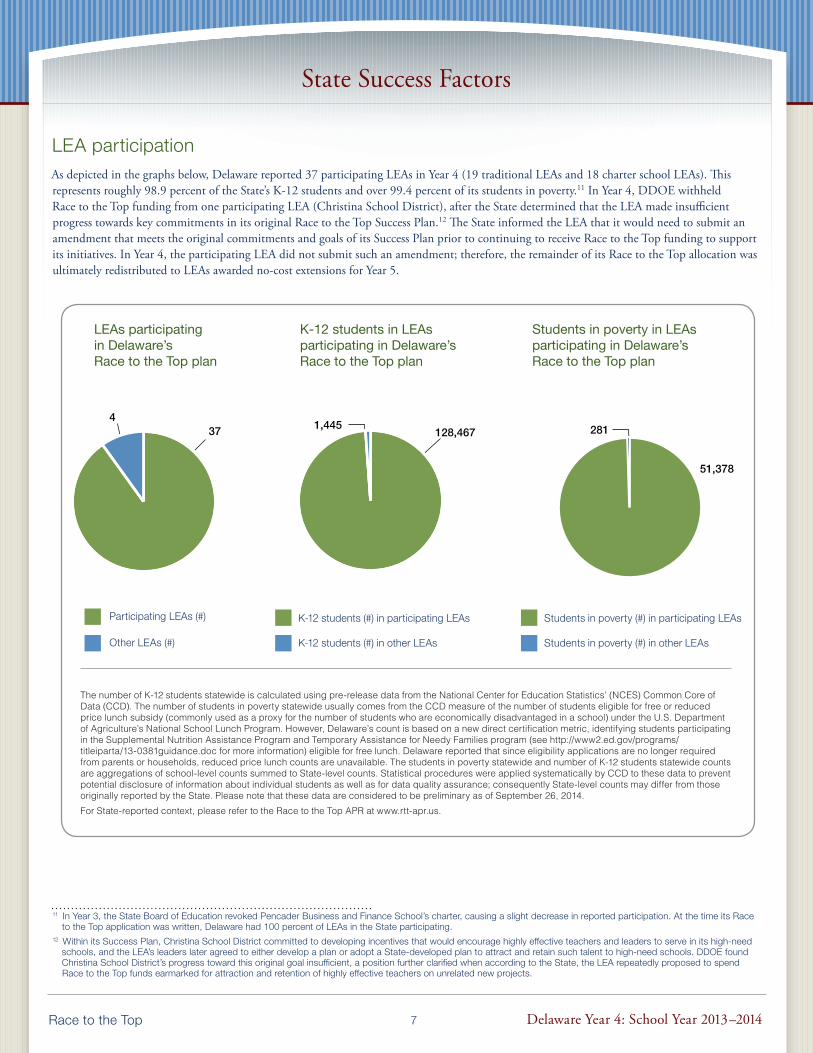
LEA participationAs depicted in the graphs below, Delaware reported 37 participating LEAs in Year 4 (19 traditional LEAs and 18 charter school LEAs). This represents roughly 98.9 percent of the State’s K-12 students and over 99.4 percent of its students in poverty.11 In Year 4, DDOE withheld Race to the Top funding from one participating LEA (Christina School District), after the State determined that the LEA made insufficient progress towards key commitments in its original Race to the Top Success Plan.12 The State informed the LEA that it would need to submit an amendment that meets the original commitments and goals of its Success Plan prior to continuing to receive Race to the Top funding to support its initiatives. In Year 4, the participating LEA did not submit such an amendment; therefore, the remainder of its Race to the Top allocation was ultimately redistributed to LEAs awarded no-cost extensions for Year 5.
11 In Year 3, the State Board of Education revoked Pencader Business and Finance School’s charter, causing a slight decrease in reported participation. At the time its Race to the Top application was written, Delaware had 100 percent of LEAs in the State participating.
12 Within its Success Plan, Christina School District committed to developing incentives that would encourage highly effective teachers and leaders to serve in its high-need schools, and the LEA’s leaders later agreed to either develop a plan or adopt a State-developed plan to attract and retain such talent to high-need schools. DDOE found Christina School District’s progress toward this original goal insufficient, a position further clarified when according to the State, the LEA repeatedly proposed to spend Race to the Top funds earmarked for attraction and retention of highly effective teachers on unrelated new projects.
374
128,4671,445 281
51,378
Participating LEAs (#)
Other LEAs (#)
K-12 students (#) in participating LEAs
K-12 students (#) in other LEAs
Students in poverty (#) in participating LEAs
Students in poverty (#) in other LEAs
LEAs participating in Delaware’s Race to the Top plan
K-12 students in LEAs participating in Delaware’s Race to the Top plan
Students in poverty in LEAs participating in Delaware’s Race to the Top plan
The number of K-12 students statewide is calculated using pre-release data from the National Center for Education Statistics’ (NCES) Common Core of Data (CCD). The number of students in poverty statewide usually comes from the CCD measure of the number of students eligible for free or reduced price lunch subsidy (commonly used as a proxy for the number of students who are economically disadvantaged in a school) under the U.S. Department of Agriculture’s National School Lunch Program. However, Delaware’s count is based on a new direct certification metric, identifying students participating in the Supplemental Nutrition Assistance Program and Temporary Assistance for Needy Families program (see http://www2.ed.gov/programs/titleiparta/13-0381guidance.doc for more information) eligible for free lunch. Delaware reported that since eligibility applications are no longer required from parents or households, reduced price lunch counts are unavailable. The students in poverty statewide and number of K-12 students statewide counts are aggregations of school-level counts summed to State-level counts. Statistical procedures were applied systematically by CCD to these data to prevent potential disclosure of information about individual students as well as for data quality assurance; consequently State-level counts may differ from those originally reported by the State. Please note that these data are considered to be preliminary as of September 26, 2014.For State-reported context, please refer to the Race to the Top APR at www.rtt-apr.us.
Delaware Year 4: School Year 2013 –2014 Race to the Top 8
State Success Factors
Stakeholder engagement Key activities and stakeholders Delaware’s leadership team, composed of the Governor, the State Education Secretary, and other senior officials from the Delaware State Education Association and the Delaware Association of School Administrators, were deeply engaged with implementation of the State’s Race to the Top plan in Year 4. DDOE engaged other key stakeholders in the State’s reform efforts, including leaders from the Rodel Foundation, the Delaware State Board of Education, the State’s institutions of higher education (IHEs), and the Parent Teacher Association (PTA).
In Year 4, the State continued its engagement and frequent communication with LEAs, as described above. Specifically, DDOE utilized Chiefs’ meetings, progress reviews, and performance evaluations to disseminate information and share feedback about implementation progress. The State also solicited LEA feedback on DDOE monitoring and support. For example, based on results of the District Support Survey, DDOE determined that LEAs needed additional CCSS implementation support and technical assistance. DDOE responded by providing a comprehensive 18-month professional development plan that focused on the use of guiding teams to build capacity in Delaware schools (see Standards and Assessments).
DDOE increased its focus on improving broader community and stakeholder engagement in Year 4. Specifically, the State partnered with GMMB/Council of Chief State School Officers to develop an outreach and stakeholder mobilization strategy around each of its key reform areas. In Year 4, DDOE in cooperation with many of its local partners also began implementing a four-phase communications plan, including ensuring key information was shared with Delaware legislators, parents, and educators regarding the State’s transition to Smarter Balanced assessments before, during, and after the spring 2014 field test (see Standards and Assessments).
Continuous improvementDDOE’s senior leadership and project managers demonstrated a willingness to address concerns from the field and to thoughtfully
consider how to make mid-course corrections to improve Delaware’s education system. In Year 4, feedback provided through DDOE progress review observations, project lead reports, statewide educator surveys, and student growth data, cumulatively provided DDOE leadership with timely status checks on key State initiatives. In one response to such feedback and data, the State began implementing its new Cross-Agency Teams to increase SEA staff collaboration and better understand local progress toward goals in Year 4. DDOE also developed new strategies to ensure students are prepared for more rigorous coursework and played a proactive role in ensuring students ready for AP courses take advantage of AP course offerings (see Standards and Assessments). Further, the State responded to concerns related to the implementation of DPAS-II by making regulatory policy changes to create greater flexibility for local implementation, while maintaining the standards of its educator evaluation system (see Great Teachers and Leaders).
Successes and challengesDDOE focused on planning for sustainability as it implemented its Race to the Top reforms in Year 4. The State better integrated its project management office into the SEA’s overall structure and made continued progress toward a consolidated approach to performance management. The State refined its LEA monitoring routines and increased the extent to which SEA staff collaborate to support LEA Race to the Top project implementation. The State continued its use of data to drive decision-making, and leveraged such data to identify its highest priority reforms and secured resources to continue implementing these reforms in SY 2014-2015.
While the State required all LEAs to develop revised Implementation Plans for SY 2014-2015, only 10 traditional LEAs and two charter school LEAs received a Year 5 no-cost extension. Collectively, these LEAs received the remaining portion of the LEA half of the State’s Race to the Top award at the end of Year 4. The State plans to continue to leverage information collected through its Cross-Agency Teams, monthly Chiefs’ meetings, progress reviews and end of school year performance reviews to understand LEA progress against goals. The State also anticipates continuing to apply lessons learned from its LEA monitoring and support to its performance management at the SEA level.

Delaware Year 4: School Year 2013 –2014 Race to the Top 9
State Success Factors
Student outcomes dataStudents showed gains on the DCAS assessment across all grade levels from SY 2010-2011 to SY 2011-2012 in mathematics and English language arts (ELA). In SY 2012-2013, results for most grades remained about the same or slightly decreased in ELA and mathematics. Student assessment performance was mostly steady in SY 2013-2014, with a slight increase in grade 10 ELA and grade 4 mathematics.
Preliminary SY 2013-2014 data reported as of: September 25, 2014.NOTE: Over the last four years, a number of States adopted new assessments and/or cut scores.For State-reported context, please refer to the Race to the Top APR at www.rtt-apr.us.
Student proficiency on Delaware’s ELA assessment
Student proficiency on Delaware’s mathematics assessment
Grade 3 Grade 4 Grade 5 Grade 6 Grade 7 Grade 8 Grade 100%
10%20%30%40%50%60%70%80%90%
100%
Per
cent
pro
ficie
nt
Actual:SY 2010–2011
Actual:SY 2011–2012
Actual:SY 2012–2013
Actual:SY 2013–2014
62.8
75.3
70.5
70.0
60.6
74.7
73.6
72.9
65.0
78.5
76.5
76.3
62.3
74.2 73.8
72.7
59.2
71.4 72.0
71.1
61.3
73.8
72.9
71.4
63.6 71
.5 73.6 74.9
Grade 3 Grade 4 Grade 5 Grade 6 Grade 7 Grade 8 Grade 100%
10%20%30%40%50%60%70%80%90%
100%
Per
cent
pro
ficie
nt
Actual:SY 2010–2011
Actual:SY 2011–2012
Actual:SY 2012–2013
Actual:SY 2013–2014
67.1 76
.472
.771
.5
65.2
76.8
73.5 74.2
65.0
74.2
70.3
70.4
57.3
67.4
65.8
65.3
60.6
70.6
67.3
65.6
61.9
74.1
71.7
68.7
58.9
71.4
69.6
68.3
Delaware Year 4: School Year 2013 –2014 Race to the Top 10
State Success Factors
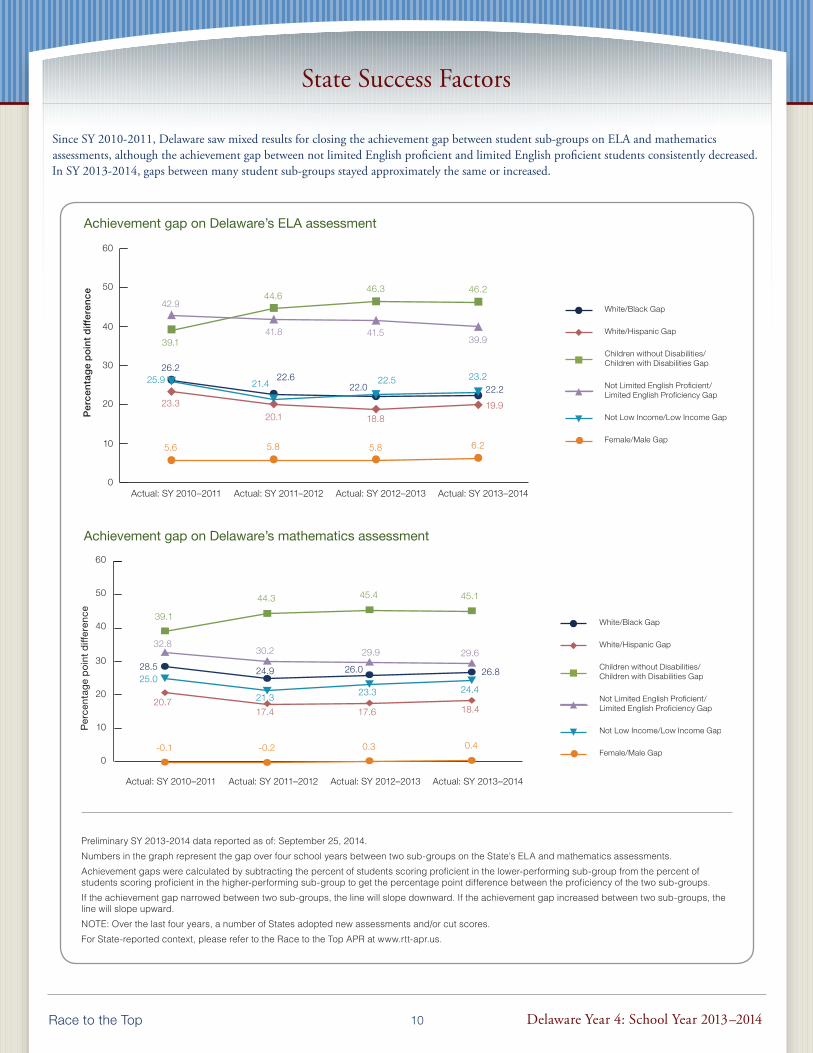
Since SY 2010-2011, Delaware saw mixed results for closing the achievement gap between student sub-groups on ELA and mathematics assessments, although the achievement gap between not limited English proficient and limited English proficient students consistently decreased. In SY 2013-2014, gaps between many student sub-groups stayed approximately the same or increased.
Preliminary SY 2013-2014 data reported as of: September 25, 2014.Numbers in the graph represent the gap over four school years between two sub-groups on the State’s ELA and mathematics assessments.Achievement gaps were calculated by subtracting the percent of students scoring proficient in the lower-performing sub-group from the percent of students scoring proficient in the higher-performing sub-group to get the percentage point difference between the proficiency of the two sub-groups.If the achievement gap narrowed between two sub-groups, the line will slope downward. If the achievement gap increased between two sub-groups, the line will slope upward. NOTE: Over the last four years, a number of States adopted new assessments and/or cut scores.For State-reported context, please refer to the Race to the Top APR at www.rtt-apr.us.
Achievement gap on Delaware’s ELA assessment
Achievement gap on Delaware’s mathematics assessment
Actual: SY 2010–2011 Actual: SY 2011–2012 Actual: SY 2012–2013 Actual: SY 2013–2014
Perc
enta
ge p
oint
diff
eren
ce
White/Black Gap
White/Hispanic Gap
Children without Disabilities/Children with Disabilities Gap
Not Limited English Proficient/Limited English Proficiency Gap
Not Low Income/Low Income Gap
Female/Male Gap
0
10
20
30
40
50
60
26.222.6
22.0 22.223.3
20.1 18.819.9
39.1
44.646.3 46.2
42.9
41.8 41.539.9
25.9 21.4 22.5 23.2
5.6 5.8 5.8 6.2
0
10
20
30
40
50
60
Actual: SY 2010–2011 Actual: SY 2011–2012 Actual: SY 2012–2013 Actual: SY 2013–2014
Perc
enta
ge p
oint
diff
eren
ce
White/Black Gap
White/Hispanic Gap
Children without Disabilities/Children with Disabilities Gap
Not Limited English Proficient/Limited English Proficiency Gap
Not Low Income/Low Income Gap
Female/Male Gap
25.028.5 24.9 26.0
29.9
26.8
20.717.4 17.6 18.4
39.1
44.3 45.4 45.1
32.830.2 29.6
21.3 23.3 24.4
-0.1 -0.2 0.3 0.4

Delaware Year 4: School Year 2013 –2014 Race to the Top 11
State Success Factors
Delaware’s high school graduation rates slightly increased from SY 2011-2012 to SY 2012-2013. The State also reported a notable increase in college enrollment rate from SY 2012-2013 to SY 2013-2014.
High school graduation rate
Preliminary SY 2012–2013 data reported as of: October 16, 2014.For State-reported context, please refer to the Race to the Top APR at www.rtt-apr.us.
78.5 79.6 80.4 82.0
0%
10%
20%
30%
40%
50%
60%
70%
80%
90%
100%
School year
Gra
du
atio
n ra
te
Actual: SY 2010–2011
Actual: SY 2011–2012
Actual: SY 2012–2013
Target from approvedplan: SY 2012–2013
College enrollment rate
Preliminary SY 2013-2014 data reported as of: October 9, 2014.For State-reported context, please refer to the Race to the Top APR at www.rtt-apr.us.The Department provided guidance to States regarding the reporting period for college enrollment. For SY 2013-2014 data, States report on the students who graduated from high school in SY 2011-2012 and enrolled in an institution of higher education (IHE).
67.055.9 55.8
66.470.0
0%
10%
20%
30%
40%
50%
60%
70%
80%
90%
100%
School year
Co
lleg
e en
rollm
ent
rate
Actual: SY 2010–2011
Actual: SY 2011–2012
Actual: SY 2012–2013
Actual: SY 2013–2014Target from approvedplan: SY 2013–2014
Delaware Year 4: School Year 2013 –2014 Race to the Top 12
Standards and Assessments
Implementing rigorous college- and career-ready standards and assessments that prepare students for success in college and career is an integral aspect of education reform in all Race to the Top States.
Supporting the transition to college- and career-ready standards and high-quality assessmentsAdopting standards and developing assessments Over the course of the Race to the Top grant period, Delaware worked to support its educators in transitioning to and effectively implementing college- and career-ready standards and high- quality assessments.
Since adopting the CCSS in ELA and mathematics in August 2010, the State has steadily progressed toward full implementation. In Years 1 and 2, DDOE provided model curricula and developed resources to aid educator implementation. In response to findings that LEAs were implementing the standards with uneven quality and rigor, the State kicked off its Common Ground for the Common Core program during Year 3, to build school-level capacity for CCSS implementation through a network of carefully selected school guiding teams. After receiving State-sponsored professional development, the guiding teams crafted two-year implementation plans for their schools’ transition to the CCSS. Ninety-nine of Delaware’s 236 schools participated in Common Ground for the Common Core throughout Year 4, and their guiding teams worked internally and with teams from other participating schools to ensure key CCSS-aligned instructional shifts occurred. DDOE provided face-to-face training meetings and on-demand webinars for school-guiding teams throughout SY 2013-2014. The State also facilitated monthly clinics and Feed-Forward-Feedback meetings, during which guiding teams shared evidence-based implementation successes and used a Common Ground protocol to provide feedback to other schools. Throughout Year 4, DDOE also disseminated and posted training resources on the State’s Common Ground Blackboard site, where they were made available to all schools statewide. According to DDOE, as Common Ground for the Common Core is a voluntary program, some LEAs and schools that could have benefitted from these State-provided CCSS implementation supports did not participate. Therefore, DDOE leveraged its LEA performance management routines to hold all LEAs accountable for high-quality CCSS implementation in Year 4. According to DDOE, the State monitored and supported its LEAs to ensure they had curricula that are fully aligned to the CCSS, and LEAs made substantial progress in Year 4.
In Year 4, Delaware successfully conducted all DCAS and DCAS Alternative assessments on schedule and prepared for the transition to Smarter Balanced assessments in SY 2014-2015. Based on educator survey data, feedback on DCAS and DCAS Alternative assessments, educators generally felt positive about implementation across multiple elements (e.g., 71 percent agreed or strongly agreed that immediate feedback provided by DCAS encourages students to track their
progress over time and 74 percent agreed or strongly agreed that the DCAS Portal was helpful to teachers and administrators). While positive feedback was not universal, (e.g., only 58 percent of educators agreed or strongly agreed that information from the DCAS reporting system was useful to instruction in Year 4), overall survey data demonstrated educators agreed that DCAS was being implemented with quality. In Year 4, Delaware worked in collaboration with its assessment vendor to continue efforts to ensure that all tests in ELA-reading and mathematics for grades 3-10 utilized CCSS-aligned test items by SY 2014-2015. The State achieved its goal of populating the DCAS item pool with 90 percent of CCSS-aligned test items in SY 2013-2014, which represents an increase from SY 2012-2013 when 50 to 70 percent of DCAS items were CCSS-aligned. The State also prepared for the transition to Smarter Balanced assessments in SY 2014-2015 by providing training and resources for educators to help ensure that they understood the difference between the level of rigor of DCAS and Smarter Balanced assessments.
DDOE also partnered with the Rodel Foundation, the Delaware State Education Association, and the PTA to begin implementing a four-phase communications plan around the transition to Smarter Balanced assessments. In phase one of four, the State focused on broad public awareness and explaining legislative changes required for full implementation of the new assessments in SY 2014-2015.13 In phase two, DDOE provided information regarding the spring 2014 field test to Delaware parents and educators via kits provided at every school site. During the Smarter Balanced field test, half of all Delaware schools participated, with one grade level and subject participating in each school. In phase three, the State released Year 4 DCAS scores and amplified messaging around the State’s assessment transition in SY 2014-2015. Phase four began in fall 2014, when the State shared more details about the full Smarter Balanced assessment suite, providing information regarding resources beyond the summative assessment.
During Year 4, Delaware also participated in the RSN’s Transitions Workgroup, designed to support States as they navigated the various transitions to new college- and career-ready standards, assessments and evaluations in pursuit of classroom instruction aligned this new level of rigor.
Supporting college readinessThe State also implemented a few key initiatives to assess and improve student readiness for college. During Year 4, the State continued to require that all public school students in grade 11 take the SAT during the school day at no cost to the student. The State reported
13 Delaware’s Governor signed Delaware House Bill (HB) 334 on July 1, 2014, enabling the State to make the full transition to Smarter Balanced assessments in school year (SY) 2014-2015. See the legislative changes at: http://legis.delaware.gov/LIS/lis147.nsf/vwLegislation/HB+334/$file/legis.html?open.

Delaware Year 4: School Year 2013 –2014 Race to the Top 13
Standards and Assessments
that 96 percent of high school juniors took the SAT in Year 4, a slight decrease from the reported 99 percent of high school juniors that completed the SAT in Year 3.
DDOE also continued implementation of its Middle School Preparation Program in Year 4, which aims to ensure middle school students are prepared for more rigorous high school coursework that would prepare them for college and career. Through this program, each LEA implemented one of four programs (Achieve 3000, Compass Learning, Carnegie Learning, or College Board) in all of its middle schools, affecting 30,230 middle grade students statewide in Year 4. The State developed a program evaluation protocol in partnership with a vendor and used the protocol, which is an adaptation of Guskey’s 5 Levels of Professional Development, to collect evidence of fidelity of implementation during Year 4. DDOE expected to complete an evaluation of the effectiveness of LEA implementation of the four programs in Year 4, but due to earlier delays the State plans to complete this evaluation in SY 2014-2015.
In Year 4, Delaware also continued implementation of the AP Summer Institute, a program for AP teachers to learn how to better develop and teach AP courses. Educator participation in this program’s trainings has steadily declined, with 129 teachers attending in 2011, 79 in 2012, and 55 in 2013. In December 2013, DDOE and the College Board collected data on LEA preferences for summer training. As a result of the feedback from the survey, the AP Summer Institute was re-conceptualized as the AP Summer Vertical Team Institute. Through the AP Summer Vertical Team Institute, the State sought to increase collaboration among secondary educators (from middle and high schools) working to ensure students are ready for college and career. In Year 4, three Delaware LEAs participated in the three-day institute, which provided learning opportunities for 28 teachers and administrators in AP Cornerstone as well as in vertical team planning for Science, Math and English Language Arts. The State plans to continue to implement several AP extension initiatives geared toward building strong college and career readiness pathways from middle school to high school in Year 5. The State will also continue to leverage PSAT and other data to identify students ready for AP courses and work to ensure these students take advantage of AP courses in Year 5.
Delaware Department of Education (DDOE) plays a key role in increasing student participation in Advanced Placement (AP) courses
The College Board’s 10th annual “AP Report to the Nation – Delaware Supplement” demonstrated the State’s progress in ensuring students participate and succeed in AP courses. In 2013, 56 percent of the graduates leaving high school who took an AP Exam scored a 3 or higher. Prior to the State’s Race to the Top work, in 2008, 51 percent of graduates leaving high school who took an AP exam scored a 3 or higher. According to this report, the number of graduates that scored a 3 or higher on an AP Exam during high school who were from low-income backgrounds more than doubled from 6.8 percent in 2008 to 14.5 percent in 2013.
Delaware was also featured in an infographic on the Department’s PROGRESS blog site that shows an increase in participation and qualifying scores on AP exams nationally, with a focus on Race to the Top States.14 As displayed in the infographic, students in Delaware took 19.1 percent more AP exams in 2013 than they did in 2011, and 17.2 percent scored a 3 or higher in the same time period.
DDOE demonstrated its commitment to increasing student participation in AP courses in Year 4. In June 2014, State Secretary of Education Mark Murphy sent 4,600 letters to Delaware high school students who demonstrated potential for AP coursework through their PSAT scores. The letter congratulated the students and encouraged them to adjust their school schedules to include more rigorous courses. In addition, in August 2014, 1,000 letters were sent to students with potential for taking AP Computer Science inviting them to participate in a State-supported Massive Open Online Course. As of early school year 2014-2015, 131 students were actively participating in and half way through the course.
14 Available online at http://www.ed.gov/edblogs/progress/files/2014/05/AP-Infographic-with-Alt-Text-5.23.jpg.
Dissemination of resources and professional developmentDelaware prepared its educators to implement the CCSS by developing instructional materials and providing professional development to educators. The State disseminated these resources through a dedicated clearinghouse on its State website and tracked professional development registration through its Professional Development Management System.
During Year 4, DDOE used its Cadre Groups of ELA and mathematics practitioners, DDOE staff, and higher education personnel to develop resources focused on formative assessment
practices, which were delivered to educators through PLCs (see Data Systems to Support Instruction) and school-based workshops. Additionally, 34 teachers from across the State participated in the Delaware Dream Team, a group working collaboratively to develop high-quality formative assessment items, which are now available to educators statewide on the Delaware LearnZillion platform. Another group of Delaware educators, the State Network of Educators, continued to build items for the Smarter Balanced Formative Digital Library. The State Leadership Team convened regionally to receive training in order to support the State Network of Educators. DDOE continued to leverage data coach services in select schools across the State, and these coaches provided feedback and evidence of CCSS implementation in schools (see Data Systems to Support Instruction).
DDOE developed instructional materials that supported CCSS implementation. DDOE created ELA and mathematics model lessons using the Literacy Concept Organizers and Math Learning Progressions frameworks developed in earlier grant years. The State shared the mathematics resources with Delaware educators in Year 3;
Delaware Year 4: School Year 2013 –2014 Race to the Top 14
Standards and Assessments
of instruction and assessment, DDOE plans to require the LEA to submit curriculum and assessment documents for further review.
Successes and challengesIn Year 4, approximately half of Delaware’s schools participated in its voluntary Common Ground for the Common Core program, receiving State-provided professional development and resources to support CCSS-aligned instructional shifts. Moreover, the State facilitated a number of different meetings between guiding teams from participating schools, so they could learn from each other and provide feedback regarding implementation successes and challenges. Some LEAs and their schools did not participate so DDOE used its LEA performance management routines as a mechanism for ensuring accountability for quality CCSS implementation. Since the curriculum alignment process was not complete in all Delaware LEAs in Year 4, the State will leverage its Regulation 502 alignment process to monitor LEA curricula alignment in Year 5.
The State prepared for the SY 2014-2015 transition to Smarter Balanced assessments with half of all Delaware schools participating in the spring 2014 field test, providing educators with training and resources on assessment rigor, and communicating broadly about the change in State assessment. In addition, the State continued implementation of programs intended to increase the percentage of college-ready Delaware students, and focused on leveraging data and feedback to develop new strategies for Year 5 and subsequent years.
in Year 4, the State released the ELA resources, which focused on disciplinary literacy in career and technical areas and social studies. DDOE also contracted with local K-12 teachers across several disciplines (career and technical education, science, social studies, and ELA) to participate in two days of professional development on close reading, pilot close reading lessons in classrooms across the State, and collect student work. The cohort of teachers reconvened to score student work and discuss lessons learned, and afterward DDOE posted the lessons on the DDOE Common Core website.
By Year 4, the curriculum alignment process was not complete in all Delaware LEAs, a goal the State set out to achieve by the end of Year 2. During LEA performance management routines in Year 4, DDOE monitored its LEAs to ensure they had curricula that are fully aligned to the CCSS. According to DDOE, during Year 4 it also focused on training its LEAs to use the Educators Evaluating the Quality of Instructional Products (EQUIP) rubric, a curriculum alignment tool, and an Instructional Materials Evaluation Tool to evaluate the extent of the alignment of their curriculum with the CCSS. In Year 4, DDOE required all LEAs to develop Implementation Plans (see State Success Factors) that include a description of how they will use these tools to evaluate their curriculum for the CCSS alignment in SY 2014-2015. In addition, in Year 4 the State revised its Regulation 502 alignment process to require LEAs to make an assurance that their local curricula are aligned to the CCSS.15 Beginning in SY 2014-2015, through monitoring or other means, if the State has concerns around the quality
15 According to the State, the 502 Alignment of Local School District Curricula to the State Content Standards regulation provides a process through which all Delaware LEAs demonstrate alignment of their local curricula with State Content Standards in specified content areas. More information is available at http://regulations.delaware.gov/AdminCode/title14/500/502.shtml.
Data Systems to Support Instruction
Statewide longitudinal data systems (SLDS) and instructional improvement systems (IIS) enhance the ability of States to effectively manage, use, and analyze education data to support instruction. Race to the Top States are working to ensure that their data systems are accessible to key stakeholders and that the data support educators and decision-makers in their efforts to improve instruction and increase student achievement.
Fully implementing a statewide longitudinal data systemThe State’s fully operational longitudinal data system allows data to be shared among all LEAs, State agencies, Delaware IHEs, and DDOE. During the Race to the Top grant period, the State sought to improve pre-kindergarten through postsecondary (P-20) coordination, thereby increasing the extent to which its longitudinal data system played a key role in monitoring all State education programs. In Year 4,
DDOE leveraged memoranda of understanding (MOUs) with the State’s six IHEs to produce reports linking higher education and K-12 student outcomes. Specifically, in September 2014 the State released its first College Success Report, which focuses on college remediation data. State data demonstrated that more than half of Delaware public school graduates who enrolled in in-State colleges in 2012 were placed in remedial courses. DDOE distributed this report to all LEAs and published the report on its Delaware Goes to College website.16
16 The College Success Report is available online at http://www.delawaregoestocollege.org/remediation-data.

Delaware Year 4: School Year 2013 –2014 Race to the Top 15
Data Systems to Support Instruction
Accessing and using State dataIn Year 4, Delaware continued its focus on making education data available to support education stakeholders’ efforts to improve student achievement. The State directly trained educators and provided them with resources to build their capacity to access State and local student data. The State also used these interactions to gather stakeholder feedback on its Education Insight Portal through which stakeholders access data and information from the State’s longitudinal data system. According to the State, the Education Insight Portal and its longitudinal data system complies with the Family Educational Rights and Privacy Act. The Education Insight Portal is Delaware’s technical answer to a problem Delaware educators regularly confronted prior to Race to the Top: accessing State and local student performance, assessment, and demographic data through a single sign-on system. Throughout the grant period, Delaware worked to meet the Education Insight Portal usage goals established in its Race to the Top application (e.g., 20,000 annual users of and 100,000 annual visits to the Educational Dashboard Portal by the end of SY 2013-2014). The State reported that its original usage goals were unrealistic as only 8,706 teachers and 799 administrators work in Delaware, and that a key challenge in meeting these goals has been that other commercially provided systems are widely used by LEAs in the State. The number of unique Dashboard users decreased to 5,548 in Year 4 (after having 6,779 unique Dashboard users in Year 3). To expand usage, DDOE evaluated commercial systems and analyzed feedback from stakeholders to determine necessary Education Insight Portal enhancements in Year 4. As a result, DDOE began to improve the Education Insight Portal’s Response to Intervention functionality and market the Portal’s unique features. The State also identified additional ways to improve the system’s functionality as an all-encompassing, centralized information portal, such as including the State’s human resource systems.
During fall 2013, Delaware continued to receive State-specific technical assistance from the RSN to develop an Enterprise Architecture Model, which included reviewing the State’s technology enterprise system and integration model. As a result, Delaware should be able to screen and adopt new technologies that are consistent with current systems and to orient incoming staff to the existing infrastructure. This will inform future work at the SEA, including a broader system integration strategy, technical data exchange protocols and a warehouse expansion approach to undergird Delaware’s move to a P-20 workforce data system.
Using data to improve instructionA key component of Delaware’s plan is managing data so that it arrives in the hands of educators in a timely and reliable fashion. In Year 4, the State continued statewide implementation of 90-minute PLCs for educators to collaborate around the use of data to improve instruction;
the State also subsidized the cost for 39 schools to continue to provide data coach support. The State planned to implement the data coach project in Years 2 and 3 only but extended these supports into Year 4 in response to feedback that the coaches played a key role in supporting local data practices. Data coaches facilitated PLCs and provided training to teachers to develop the technical skills required to analyze data and the pedagogical skills to adjust instruction based on data. In January 2014, Delaware was featured in a Department PROGRESS blog story about the State’s deployment of data coaches to participating LEAs and the success of PLCs using those data coaches.17 The data coach model shifted slightly in Year 4 to focus more on the role of LEA and school leadership in PLC facilitation and data stewardship, which as the State began to scale back data coach supports was a shift toward the sustainability of PLCs beyond Delaware’s Race to the Top grant.
Successes and challengesIn Year 4, Delaware continued its focus on making education data available to support education stakeholders in their efforts to improve student achievement. Although the State continued to struggle to meet its Education Insight Portal usage goals, DDOE increased its direct engagement with educators in schools to build teacher capacity to access relevant data through the State’s longitudinal data system. In addition, the State continued to gather feedback from stakeholders to determine enhancements to make to its longitudinal data system and Education Insight Portal and made plans to market the system’s unique features. In Year 5, the State will continue to improve functionality and promote usage of its longitudinal data system and Education Insight Portal at the LEA and school levels.
In Year 4, the State made significant progress against its goal of linking college enrollment and college course completion data available to IHEs and the K-12 education system. The State released and distributed to all LEAs its first College Success Report, which links higher education and K-12 student outcomes with a focus on college remediation data.
The State also supported LEAs in continued implementation of mandatory 90-minute PLCs and subsidized the cost for 39 schools to continue to provide data coach support. Based on the most recent PLC survey data, most participating teachers (70 percent) agreed that PLCs helped them to develop useful skills around the collection and use of data, up from 63 percent in the previous year. In an effort to prepare for sustainability beyond its Race to the Top grant, the State and its data coach vendor shifted the model to focus on increasing LEA and school leaders’ capacity to facilitate PLCs and support educators to use data to drive instruction in Year 4.
17 Available online at http://www.ed.gov/edblogs/progress/2014/01/delaware-and-hawaii-putting-student-data-and-teacher-collaboration-at-the-heart-of-instructional-improvement/.

Delaware Year 4: School Year 2013 –2014 Race to the Top 16
Providing high-quality pathways for aspiring teachers and principalsDelaware initiated projects to create high-quality pathways for aspiring teachers and principals; some were successful in Year 4, while others encountered challenges. In Year 4, Teach For America-Delaware (TFA) and the Delaware Leadership Project experienced continued success in providing teachers and principals for the State’s highest-need schools. TFA placed 32 new teachers statewide, exceeding its enrollment goal of at least 25 new teachers per year. In addition, 80 percent (28 of 35) of TFA’s 2012 cohort continued teaching in Delaware schools, far exceeding the State’s retention goal of 60 percent. In Year 4, 9 of 12 Delaware Leadership Project graduates from cohorts 1 and 2 were serving as school leaders in high-need schools and four aspiring principals in cohort 3 completed their residency year. The Delaware Leadership Project did not enroll 35 to 50 new principals in the State’s highest-need schools by the end of Year 4 as planned; however, the State leveraged this program to continue its focus on attracting high-quality Delaware school leadership candidates. For example, the State and its vendor applied rigorous criteria in selecting candidates for cohort 4 and planned for the recruitment of cohort 5 in SY 2014-2015.
DDOE’s commitment to quality also led it to reassess its work with the Delaware Talent Management Program vendor. In Year 4, the Delaware Talent Management Program provided human capital continuum management services to 7 Delaware charter schools (short of its goal of 10 schools) by combining a certified teacher talent pipeline with other human resource supports. The Delaware Talent Management Program did not successfully fill vacancies within the schools it served and the project’s vendor faced management and expertise-related challenges, resulting in diminished LEA demand for the service. Therefore, the State decided to scale back the amount and type of human capital services provided by the Delaware Talent Management Program in Year 4. These adjustments, combined with the cancellation of other project contracts (STEM Residency and the
Delaware Teaching Fellows) earlier in the grant period, caused the State to fall short of some SY 2013-2014 goals in the area of providing high-quality pathways for aspiring teachers and leaders. The State will continue to pursue these goals during the no-cost extension period by continuing to support TFA-Delaware and the Delaware Leadership Project, and establishing additional alternative certification programs.
Improving teacher and principal effectiveness based on performanceDelaware also focused on continuous improvement of its educator evaluation system to create an environment in which it could leverage evaluation data to inform human capital decisions and grow evaluator capacity.
The State’s educator evaluation system, DPAS-II, is built around five components: (I) planning and preparation, (II) classroom environment, (III) instruction, (IV) professional responsibilities, and (V) student improvement. Educators are assessed annually on Components I through IV by evaluators who measure performance against standards of effective elements of practice, basing their final classification of Satisfactory or Unsatisfactory on observable knowledge and skills. Each educator receives either a Satisfactory or Unsatisfactory rating for each component (I-IV) and the number of satisfactory ratings combined with their student improvement rating determines an educator’s summative classification: Highly Effective, Effective, Needs Improvement, or Ineffective. Component V, student improvement, is weighted so that it is a key factor in determining the final summative rating. For instance, if an educator receives a satisfactory rating for Components I through IV, then they are eligible to receive a Highly Effective, Effective, or Needs Improvement rating, but not an Ineffective rating. In this scenario, if an educator’s Component V rating was Unsatisfactory, their summative rating would be Needs Improvement. If an educator received a Satisfactory Component V rating, the educator’s summative rating would be Effective, while an Exceeds Component V rating would lead to a Highly Effective summative rating.
Great Teachers and Leaders
Race to the Top States are developing comprehensive systems of educator effectiveness by supporting high-quality pathways for aspiring teachers and principals, ensuring equitable access to effective teachers and principals, improving the effectiveness of teacher and principal preparation programs, and providing effective supports to all educators. As part of these efforts, Race to the Top States are designing and implementing rigorous, transparent, and fair evaluation systems for teachers and principals; conducting annual evaluations that include timely and constructive feedback; and using evaluation information to inform professional development, compensation, promotion, retention, and tenure decisions.

Delaware Year 4: School Year 2013 –2014 Race to the Top 17
SY 2013-2014 marked the second year of full implementation of DPAS-II. At the beginning of Year 4, after analyzing student growth data, educators’ evaluation ratings, and educators’ responses to an annual survey about the DPAS-II process, the State developed a Year One Continuous Improvement report about SY 2012-2013 implementation data.18 As reflected in the report, in the first year of implementation approximately 51 percent of educators were rated Highly Effective, 48 percent Effective, and 1 percent Ineffective. Since a meaningful level of differentiation was not evident, DDOE continued to work with evaluators to support improved DPAS-II implementation in Year 4. DDOE signed a new contract with its development coach vendor to provide seven coaches to serve approximately 65 schools during SY 2013-2014. In Year 4, DDOE also released an addendum to the Year One Continuous Improvement report that outlined administrator evaluation results from SY 2012-2013.19 This addendum demonstrated that 97 percent of administrators earned “satisfactory” ratings on all four of the qualitative components of the DPAS-II system.
Throughout Year 4, DDOE continued to solicit feedback on DPAS-II through multiple forums (e.g., Delaware State Education Association and Delaware Association of School Administrator leadership meetings). DPAS-II data and input from these sources led DDOE, with the consent of the Delaware State Board of Education, to make new amendments to regulations governing the State’s educator evaluation system.20 The revised regulations were formally adopted in June 2014 and include such changes as incorporating the potential usage of Short Observations into the teacher appraisal process, shifting the overall summative rating of Needs Improvement to be considered Unsatisfactory instead of Satisfactory, and allowing alternative Component IV measures to be created at the local level.
Starting in early 2013, the State began actively promoting a process by which it would approve LEAs to develop alternative evaluation 18 Delaware’s Year One Continuous Improvement report on DPAS-II implementation
in SY 2012-2013 is available at http://www.doe.k12.de.us/tleu. 19 DPAS-II for Administrators SY 2012-2013 results are also available at
http://www.doe.k12.de.us/tleu.20 In June 2014, the Delaware State Board of Education passed amended
versions of DPAS-II regulations 106A (regarding the Teacher Appraisal Process), 107A (regarding the Specialist Appraisal Process), and 108A (regarding the Administrator Appraisal Process).
Great Teachers and Leaders
systems that the LEAs felt would be more meaningful and effective for evaluating educators. Four charter school LEAs applied together and received an Education Evaluation Waiver from the State to design and implement a locally-developed educator evaluation model. According to the State, any such alternative evaluation system must look similar to DPAS-II at the overall summative rating level and meet the Department’s criteria for a qualifying evaluation system.
To assess LEA implementation of DPAS-II during Year 4, the State audited all LEAs by interviewing administrators and teachers, observing educators, and reviewing evaluator artifacts. The State provided differentiated supports to LEAs as the quality of DPAS-II implementation varied by LEA. DDOE provided extra support to its
“intense” tier LEAs throughout Year 4.
In Year 4, the State continued participating in the RSN’s Quality Evaluation Rollout (QER) Workgroup through which it leveraged relationships with peer States to improve evaluation system implementation. Delaware shared lessons learned regarding its use of data dashboards and scorecards during the RSN’s Data Dashboards and Scorecards: Putting Evaluation Data to Work Webinar in June 2014. In July 2014, DDOE staff participated in the RSN’s Refining Evaluation Systems to Improve Teacher Practice seminar, which allowed States to engage with one another and national experts on enhancing the overall quality of educator evaluation systems. During the seminar, States shared lessons learned in improving rater accuracy in SY 2013-2014, as well as identified strategies to address evaluation implementation challenges.
Ensuring equitable access to effective teachers and principals The Delaware Talent Cooperative, which uses educator evaluation data to make decisions on financial incentives and recognition in high-need schools, is a key driver of the State’s effort to ensure equitable access to effective educators.21 In Year 3, The State recognized its first cohort of 28 educators with retention bonuses, and 25 of those educators returned to their schools in fall 2013 and received the second half of
21 Formerly the Talent Retention Bonus and Talent Attraction projects.
DPAS-II appraisal components
Teacher Specialist Administrator
Component I Planning and Preparation Planning and Preparation Vision and Goals
Component II Classroom Environment The Environment Culture of Learning
Component III Instruction Delivery of Services Management
Component IV Professional Responsibilities Professional Responsibilities Professional Responsibilities
Component V Student Improvement Student Improvement Student Improvement
Delaware Year 4: School Year 2013 –2014 Race to the Top 18
Great Teachers and Leaders
their award for remaining in their high-need school. DDOE used student performance data from SY 2012-2013 to identify a second cohort of educators eligible for retention bonuses and recognized 169 new educators in fall 2013. Although the State significantly increased the number of awards issued, the State fell short of its SY 2013-2014 goal of issuing 600 retention bonuses. With respect to its goal of issuing 240 transfer bonuses by SY 2013-2014, the State remained significantly off track for accomplishing that goal in Year 4. After awarding only two educators with attraction bonuses for transferring to a high-need school in Year 3, the State contracted with an external evaluator to assess how the initiative was being perceived in the field and identify new strategies to improve implementation. The evaluator’s report highlighted opportunities to improve DDOE’s communication around and outreach for the Delaware Talent Cooperative. In December 2013, the State implemented new strategies such as hiring a dedicated recruiter for this project, hosting recruitment events, and increasing the engagement of principals in the recruitment process. In addition, DDOE partnered with the Delaware State Housing Authority to offer a new housing incentive to members of the Delaware Talent Cooperative. The State will continue activities related to ensuring equitable access to effective educators in SY 2014-2015.
DDOE implemented other initiatives to support, create, and promote equitable access to effective educators throughout the Race to the Top grant period. One such initiative is the State’s Educator Recruitment Portal, which is designed to eliminate the need for educators to create separate applications to apply for positions in Delaware schools and LEAs. After launching the portal, the State hired a full-time Deputy Officer of Recruitment and Selection to oversee the portal’s development and marketing in Year 3, resulting in DDOE’s increased capacity to advance the initiative’s work and make key progress toward its goals for Year 4. The State signed up 17 traditional LEAs and 18 charter school LEAs to use the statewide portal by the end of Year 4. According to the State, 2,050 candidates completed an online application for positions posted on the portal, exceeding its goal of 1,000 applicants by SY 2013-2014. The portal’s delayed launch impacted the State’s marketing efforts, but the State made progress in finalizing a logo and identifying a contractor for the marketing campaign in Year 4. Through an approved no-cost extension, the State will continue to work to achieve outstanding goals related to marketing the portal in SY 2014-2015.
In Year 4, Delaware continued its Academic Achievement Awards program, providing bonuses to schools as a reward for exceeding AYP for two or more consecutive years or closing achievement gaps. In fall 2013, Delaware selected and announced Cohort IV award recipients, which included two Reward schools and 15 Recognition schools.
Improving the effectiveness of teacher and principal preparation programsDelaware also envisioned that during the Race to the Top grant period, it would assess and publicly report the effectiveness of local educator preparation programs and use such data to make decisions regarding the programs (e.g., monitoring, providing resources and support).
During SY 2013-2014, two Delaware IHEs that were awarded grants began implementing pilot initiatives. Wilmington University invested in candidate tracking systems that allow its teacher prep programs to track placement, performance, and retention both during their candidacy and once hired by Delaware LEAs. It also began work to develop a yearlong residency for candidates during their senior year, and made initial strides to align residency evaluations to DPAS-II. The University of Delaware made plans to invest in training its faculty around such matters as the CCSS transition. The University of Delaware also investigated how to evaluate and track its candidates prior to graduation and post-placement and started piloting candidate exit exams.
In Year 4, DDOE established a community of practice amongst local education preparation programs and IHEs, through which it provided technical assistance and shared information about new preparation program requirements. Several workgroups within this larger community of practice convened regularly to discuss such topics as the requirements of SB 51, which was signed by Delaware’s Governor in June 2013, and the accompanying Regulation 290, which was officially adopted in July 2014. These two policy changes in Delaware were complemented by the State’s adoption of the Council for the Accreditation of Educator Preparation accreditation system for teacher preparation programs in June 2014. Collectively, the State believes these changes raise the bar for preparation programs and mandates that DDOE monitor the performance of program graduates in Delaware schools.

Delaware Year 4: School Year 2013 –2014 Race to the Top 19
Fostering collaboration between Delaware institutions of higher education (IHEs) and the State as laws around preparation programs change
During summer 2013, Delaware passed Senate Bill 51, which requires annual reporting of preparation program graduates’ effectiveness data. According to the State, the law also increased rigor and expectations for local preparation programs, while mandating that Delaware Department of Education (DDOE) monitor the performance of program graduates in Delaware schools. The changes intend to ensure students have teachers who are prepared to teach college- and career-ready standards, and include increased rigor for entrance into teacher preparation programs, increased data collection, performance assessments, clinical experiences, and content knowledge exams.
Such change can be difficult for all stakeholders involved; therefore in Year 4, the Teacher and Leader Effectiveness Unit created a community of practice amongst the State’s educator preparation programs and IHEs. The group convened December 2013 through March 2014 to receive State-provided technical assistance, share best practices with peers, and learn more about new preparation program requirements. The State adopted Regulation 290 in July 2014, which included such requirements as a DDOE-led educator preparation approval and renewal process. Through its community of practice facilitation, the State engaged in early and ongoing communication with local educator preparation programs and IHEs regarding proposed policy changes. The Teacher and Leader Effectiveness Unit intends to continue facilitating this community of practice in school year 2014-2015, while the State prepares to publicly report teacher preparation program effectiveness data for the first time.
In March 2014, the Department featured Delaware in its PROGRESS blog story, “Delaware Teacher Preparation is Setting a High Bar,” discussing the enhanced teacher preparation program in the State.22
22 Available online at http://www.ed.gov/edblogs/progress/2014/03/delawares-teacher-preparation-is-setting-a-higher-bar/.
rigorous expectations established for teacher preparation programs. In addition, after administering the Teaching, Empowering, Leading and Learning (TELL) Delaware survey to more than 6,000 Delaware educators in Year 3, the State reported that it used the survey’s data widely to inform its work to improve teaching and learning conditions at the State and LEA levels in Year 4.23 As this was the first time the State administered the TELL survey, DDOE considered these data baseline information, and will conduct a second administration of the survey in SY 2014-2015 to determine progress against its goal of 55 percent of teachers citing improvements in teaching conditions by the end of the Race to the Top grant period. The State will continue its Human Capital Analytics efforts in Year 5, including a second administration of the TELL survey and funding to support up to two additional Harvard Strategic Data Fellows.
Providing effective support to teachers and principalsDelaware also set out to provide effective and coherent professional development and supports that would allow teachers and principals to continuously improve their practice and positively impact student learning.
The Vision Network continued to provide support to 28 Delaware schools in Year 4 by delivering comprehensive professional development and related supports to principals and educators in the State. Participating LEAs and schools indicated to the State that they value the comprehensive supports provided by the Vision Network and agreed to share a portion of the cost to continue these supports in SY 2014-2015. Therefore, the State will pay a portion of the cost for the vendor to provide the same services to participating schools in Year 5.
DDOE’s School Administration Managers (SAMs) provide school-based leadership with time-tracking software, feedback on time management, and administrative support to make their primary focus instructional leadership. The State’s vendor deployed SAMs in nine schools in Year 4. Participating schools select one of two SAMs models. The most commonly selected model provides time-tracking software for the school along with a stipend and training for the building’s existing administrative assistant. The other model funds a full-time position to take on operational responsibilities, allowing the principal to spend more time on instructional leadership activities. As in Year 3, the State met targets for increasing the percentage of time that participating principals spent on instructional leadership activities in Year 4.
School Leadership Coaches provide support to school principals and novice principals in high-need schools through intensive research-based leadership training. School Leadership Coaches design the training and support for each of the identified areas of need, which could include financial management, instructional leadership, teacher
23 See http://www.telldelaware.org/results for Year 3 Teaching, Empowering, Leading and Learning (TELL) Delaware survey results.
The State originally planned to link DPAS-II and student achievement results to teacher preparation programs and publicly report teacher preparation program effectiveness data by fall 2012; however, early DPAS-II implementation delays prevented the State from linking such outcomes data as planned. Therefore, the State extended its timeline for achieving this goal to August 2015.
In Year 4, the State continued its partnership with the Harvard Strategic Data Project and hosted a Harvard Strategic Data Fellow who supported DDOE’s work in conducting ongoing analysis of Delaware’s human capital data. These analyses provide critical information about the State’s teaching workforce and inform DDOE’s approach to educator recruitment, placement, development, evaluation, and retention. The State leveraged the Fellow’s Human Capital Analytics publications to help inform practice and policy changes such as revised DPAS-II implementation and the more
Great Teachers and Leaders
Delaware Year 4: School Year 2013 –2014 Race to the Top 20
Great Teachers and Leaders
observation, and/or time management practices. In Year 4, two coaches provided support to 12 schools virtually as the project drew to a close. Survey data reflected that 89 percent of participating principals felt that they gained new knowledge and skills while being supported by the coaches, surpassing the State’s SY 2013-2014 goal of 75 percent. However, DDOE found that the initiative did not deliver supports that were as impactful as other school leadership coaching initiatives, such as development coaches, which focus on DPAS-II implementation.
The State also partnered with Relay National Principals Academy Fellowship to provide rigorous training and support for Delaware principals. Twelve principals participated in the fellowship in Year 4, the majority of whom graduated from the yearlong program. The State plans to leverage Race to the Top funding to continue this partnership in Year 5, allowing 10 additional principals to participate in the rigorous training program, receive one year of credit towards the completion of a master’s degree through the Relay Graduate School of Education, and gain access to additional support through the broader Relay network.
Delaware set out to establish a Professional Development Certification System that would ensure LEA professional development plans are of high quality and have the potential to positively impact student achievement. According to the State, while this full vision was not achieved, during Year 4, DDOE continued to require LEAs to submit professional development plans for approval through its consolidated grant application process. Use of this process continued to allow DDOE to “certify” 100 percent of professional development offerings in the State; however, DDOE remains unable to measure the impact of these offerings on teacher and student outcomes. In Year 4, the State began to consider how it could strengthen its consolidated grant approval process by more closely evaluating how LEAs use funds, assessing efficacy of professional development, and leveraging student achievement results to make decisions around professional development offerings.
Successes and challengesThroughout Year 4, Delaware continued its analysis of data regarding educator recruitment, placement, retention, evaluation and development, and used that data to improve several policies and practices. The State demonstrated a willingness to assess the work of its vendors supporting educator recruitment, placement, retention, and development, and used implementation data and LEA feedback to decide which initiatives to sustain and which to discontinue. For example, the State will continue the work of TFA-Delaware and the Delaware Leadership Project initiatives in Year 5, and establish up to two additional alternative routes to certification to meet its goals for providing high-quality pathways for aspiring teachers and principals.
In addition, during SY 2013-2014, the State’s second year of full DPAS-II implementation for all K-12 educators, the State’s focus on continuous improvement was evident as it produced the Year One Continuous Improvement report, made regulatory adjustments and used existing regulatory authority to provide greater local flexibility for educator evaluation implementation, while maintaining DPAS-II standards. Development coaches also continued as a key support for principals in the State to improve DPAS-II implementation.
Due to earlier project delays, the State was at an early stage of implementation for some of its Great Teachers and Leaders projects in Year 4. These include the statewide Educator Recruitment Portal initiative, which many traditional and charter LEAs signed up to use in Year 4, the Delaware Talent Cooperative, and the State’s efforts to link DPAS-II and student achievement results to teacher preparation programs and publicly report teacher preparation program effectiveness data. The State passed legislation and regulations, which according to the State raise the bar for local preparation programs, and mandate that DDOE monitor the performance of program graduates in Delaware schools. The State will continue implementation of many of its Great Teachers and Leaders projects in Year 5, including the Delaware Talent Cooperative, for which it will continue to intensify recruitment efforts as it directly engages with the 18 schools participating in the initiative.

Delaware Year 4: School Year 2013 –2014 Race to the Top 21
Turning Around the Lowest-Achieving Schools
Race to the Top States are supporting LEAs’ implementation of far-reaching reforms to turn around lowest-achieving schools by implementing one of four school intervention models.24
24 Race to the Top States’ plans include supporting their LEAs in turning around the lowest-achieving schools by implementing one of the four school intervention models:
Turnaround model: Replace the principal and rehire no more than 50 percent of the staff and grant the principal sufficient operational flexibility (including in staffing, calendars/time and budgeting) to fully implement a comprehensive approach to substantially improve student outcomes.
Restart model: Convert a school or close and reopen it under a charter school operator, a charter management organization, or an education management organization that has been selected through a rigorous review process.
School closure: Close a school and enroll the students who attended that school in other schools in the district that are higher achieving.
Transformation model: Implement each of the following strategies: (1) replace the principal and take steps to increase teacher and school leader effectiveness, (2) institute comprehensive instructional reforms, (3) increase learning time and create community-oriented schools, and (4) provide operational flexibility and sustained support.
Partnership Zone schoolsDelaware based its intervention efforts in low-performing schools around its Partnership Zone. The Partnership Zone is composed of schools that the State identified as its lowest achieving. The State funds the Partnership Zone through a combination of Race to the Top, School Improvement Grants (SIG), and State funds. With the support of the State’s School Turnaround Unit, Partnership Zone schools are required to implement one of four intervention models.
The State approved 10 Partnership Zone school intervention plans and signed a MOU with each school—four in Cohort I in Year 1 and six in Cohort II in Year 2. Through the MOU process, LEA and DDOE leaders jointly selected the transformation model and negotiated implementation details. Schools were expected to make AYP after two years of transformation model implementation. Since being designated as Partnership Zone schools, the majority of these schools have shown improvement in student achievement in reading and mathematics.
By the end of SY 2013-2014, all four Cohort I schools and five of the six Cohort II schools met the State’s criteria for exiting Partnership Zone school status. However, one Cohort II school did not meet the exit criteria, and the State re-identified a Partnership Zone school from Cohort I after it regressed in academic performance and did not meet AYP in SY 2013-2014. These two schools were among the six schools identified as the State’s lowest-achieving schools in September 2014. The two LEAs that the Cohort III schools are in must sign new MOUs with DDOE or their options for addressing the challenges faced by these schools will be limited to school closure, reopening the school as a charter or contracting with a private management organization to operate the school, or replacing the principal and rehiring no more than 50 percent of the staff and granting the principal sufficient operational flexibility. These school interventions represent three models besides the transformation model, which the 10 Partnership Zone schools in Cohort I and II selected with the State.
Supporting school leadershipThe School Turnaround Unit provided technical assistance and guidance to the Cohort I and Cohort II Partnership Zone schools
as they implemented the transformation school intervention model during the Race to the Top grant period. The State supported these schools in developing and carrying out detailed implementation plans. The School Turnaround Unit developed and utilized tools and procedures to monitor each Partnership Zone schools’ progress and quality of implementation, ultimately resulting in the majority of these schools meeting AYP within two years. However, as one Cohort I school was re-identified as one of the State’s lowest-achieving schools and one Cohort II school did not meet the criteria for exiting Partnership Zone school status at the end of SY 2013-2014, DDOE concluded that a revised strategy is required to ensure these schools achieve significant and lasting progress. School Turnaround Unit leaders continued an evaluation of the unit’s role at DDOE and developed a new vision for how the State could best support improvement of Delaware’s highest-need schools in Year 4. The State’s plan for advancing work in this area included a key focus on school leadership where new school leaders, with a demonstrated ability to improve schools in need of the highest level of intervention, are being hired and competitively compensated for leading such Delaware schools in SY 2014-2015.
The School Turnaround Unit not only supported Delaware’s 10 Partnership Zone schools, but the State also leveraged this unit to support its Focus schools, schools within the State with underperforming sub-groups of students. In Year 4, DDOE revised its Focus school monitoring plan and instrument; in doing so, the State met Race to the Top commitments to support additional schools at risk of failure while simultaneously meeting the principles of its approved ESEA flexibility request.
In Year 4, Delaware participated in the School Turnaround Performance Management Workgroup, within which the State worked with RSN experts and other States on building strong performance management systems for future work in this area. The RSN also provided individualized technical assistance support to the School Turnaround Unit in determining the appropriate level of support to provide to the State’s lowest-achieving schools, as well as in developing a theory of action, goals and outcome measures, and performance management process for the State’s continued school intervention efforts.

Delaware Year 4: School Year 2013 –2014 Race to the Top 22
Successes and challengesIn Year 4, Delaware continued to leverage its School Turnaround Unit to provide support to its lowest-achieving schools. The State concluded that the strategy it used throughout the original four-year Race to the Top grant period was not sufficient to ensure these schools were no longer the State’s lowest-achieving; therefore, DDOE adjusted its strategy with an increased focus on improving school leadership within schools requiring intervention. The State identified its six lowest-achieving schools in September 2014, and during Year 5, the State will support these schools as they work to improve performance. Despite the State’s efforts to support low-achieving
schools, Cohort III included a re-identified Cohort I school and a Cohort II school that did not meet the criteria to exit Partnership Zone school status, providing some evidence that the State’s original approach to school intervention did not necessarily lead these schools to long-term transformational change. DDOE will enter into a new MOU with two LEAs with Cohort III schools to support school intervention efforts or work with the LEAs to implement the school closure, turnaround model, or restart model in these schools. In Year 5, Delaware will allow Cohort II schools to continue to use Race to the Top funding to support implementation of their approved plans and will support Cohort III’s planning year activities (e.g., leadership development).
Turning Around the Lowest-Achieving Schools
Emphasis on Science, Technology, Education, and Mathematics (STEM)
Race to the Top States are committed to providing a high-quality plan with a rigorous course of study in science, technology, engineering, and mathematics (STEM). In doing so, each State must cooperate with STEM-capable community partners in order to prepare and assist teachers in integrating STEM content across grades and disciplines, in promoting effective and relevant instruction, and in offering applied learning opportunities for students. A focus on STEM furthers the goal of preparing more students for an advanced study in sciences, technology, engineering, and mathematics, including among underrepresented groups such as female students.
State’s STEM initiativesThe STEM Council, a diverse group of stakeholders and educators working to identify science, technology, engineering, and mathematics (STEM) priorities and recommend improvements to enhance STEM education in Delaware, convened quarterly and discussed opportunities to promote STEM in the State. In Year 4, the STEM Council partnered with Ashland Incorporated to design the STEM Educator Award, which recognizes a teacher or team of teachers at both the elementary and secondary levels that demonstrate STEM innovation and excellence through teaching, academic collaboration, and student engagement. The STEM Council will grant STEM Educator Awards to two teachers and/or teams of teachers in November 2014, who will receive cash awards of $7,500. The STEM Council also partnered with Junior Achievement, with funding from the Dow Chemical Company, to launch the “Junior Achievement – It’s My Future” curriculum, an in-school program designed to engage students directly with career information and professionals. Junior Achievement began a two-year pilot program in Year 4, and plans to offer this hands-on, six-week, in-school educational and mentoring program to approximately 3,500 Delaware middle school students. As of early SY 2014-2015, 1,747 students signed up for the course and
1,176 were matched with a mentor who will walk them through the program’s curriculum. The STEM Council and the STEM Business Network, which is led by seven founding companies and designed to connect businesses more directly with classroom teachers and their students, supported this program.
In Year 4, Delaware continued its support of the 28 non-traditional candidates who were placed as certified STEM teachers in Cohorts 1 through 3 of the STEM Residency program, which sought to recruit and provide pre-service training and one-year residency placements for aspiring STEM educators. The program intended to attract candidates with strong content or professional backgrounds in STEM disciplines. Upon program completion, residents received a Master of Arts in Teaching and were placed in traditionally hard-to-staff schools. DDOE discontinued the STEM Residency program in Year 3 due to enrollment falling dramatically short of expectations. Delaware did not meet its goal of 100 STEM teachers through the STEM Residency program (with 28 program candidates ultimately placed). Therefore, the State will continue striving towards this goal through its other alternative certification programs in Year 5 (see Great Teachers and Leaders).
Delaware Year 4: School Year 2013 –2014 Race to the Top 23
Emphasis on Science, Technology, Education, and Mathematics (STEM)
Successes and challengesIn Year 4, the STEM Council partnered with local organizations to create a new incentive to encourage STEM educators to be innovative in their teaching practices, and to create new engaging curricula to expose middle school students to STEM careers. As DDOE reflected on its original vision for the role of the STEM Council, however, the State acknowledged that the Council has not played a central role in
identifying STEM priorities and recommending improvements to better STEM education in the State. When the State discontinued the STEM Residency program in Year 3, it did not meet its goal of placing 100 newly certified STEM teachers. Therefore, the State requested and was approved for a no-cost extension to expand its investment in TFA-Delaware and establish up to two additional alternative routes to certification in SY 2014-2015, which will in part allow it to continue to pursue this goal.
Delaware focused on planning for sustainability as it implemented its Race to the Top reforms in Year 4. The State continued its use of data to drive decision-making, and leveraged such data to identify its highest priority reforms and secured resources to continue implementing education reforms in SY 2014-2015. The State requested and received no-cost extensions to continue key structures that support reform through Year 5, including the units that comprise DDOE’s project management office (the Delivery Unit, Teacher and Leader Effectiveness Unit, and School Turnaround Unit), which will continue to monitor and support SEA and LEA implementation. These units were better integrated into the SEA’s overall structure in Year 4, allowing the State to make continued progress in implementing the CCSS and preparing for the SY 2014-2015 transition to Smarter Balanced assessments; making education data available to support stakeholders to improve student achievement; analyzing and using data to improve the State’s policies and practices around educator recruitment, placement, retention, evaluation, and development; and supporting the State’s lowest-achieving schools.
The State intends to improve the extent to which State performance- and accountability-related data are accessible to local stakeholders through its Education Insight Portal in SY 2014-2015. These data include chronic absenteeism, social-emotional indicators, and data reflecting whether students are off track for graduation. In Year 5, the State also plans to develop district-level, school-level, and parent-level interfaces that are explicitly linked to such accountability measures and conduct stakeholder engagement activities to ensure the interface meets stakeholder needs. In addition, the State plans to continue exploring whether and how it can use aspects of the Academic Performance Framework that it used for charter school accountability for traditional LEAs.
In SY 2014-2015, as the State transitions to Smarter Balanced assessments, it will focus on improving formative assessment
Looking Ahead
Most Race to the Top States developed plans to continue their comprehensive reform efforts for an additional year (through the no-cost extension) and are developing plans to sustain many of their projects beyond the grant period.
practices through Common Ground for the Common Core 2.0 and by providing professional development to teacher leaders participating in the Delaware Dream Team. Relatedly, in Year 5 the State plans to implement a Teacher Leader Project to support implementation of the Next Generation Science Standards, which it adopted in September 2013. Through this project, a select group of educators will receive stipends and intensive training and ongoing support from the State on the use of materials, tools, and strategies aligned to the State’s new standards, and will be expected to share content learned and pedagogical practices with other educators. In Year 5, the State also plans to implement programs geared towards increasing the number of Delaware students ready for college and career. For example, DDOE will work with the College Board to implement a few key initiatives to increase the number of students taking and passing AP courses and exams. The State will also use PSAT and other data to identify students who have demonstrated readiness for AP courses and grant them access to curricula for courses not offered at their schools through the Amplify Computer Science Massive Open Online Course and online courses, with priority going to AP courses in the STEM fields.
The State will also continue its work to improve functionality and promote usage of its longitudinal data system and Education Insight Portal at the LEA and school levels. DDOE plans to continue targeted outreach to teachers and will expand the Education Insight Portal and longitudinal data system to incorporate early learning students (birth through age five) through the collection of data from early learning providers and develop metrics appropriate to this age group. The State will also continue to support LEAs in the implementation of PLCs, for example, by implementing the PLC Support System, a modified version of the data coach project, to continue support for up to 50 schools to improve educator use of data to improve instruction during collaborative planning time. The PLC Support System will also focus on supporting the transition to CCSS and Smarter Balanced assessments.

Delaware Year 4: School Year 2013 –2014 Race to the Top 24
Looking Ahead
Budget
Glossary
As in Year 4, Delaware will continue to analyze data regarding educator recruitment, placement, retention, evaluation, and development in Year 5, and use these data to improve the State’s policies and practices. The State plans to continue some Great Teachers and Leaders projects, such as TFA-Delaware, the Delaware Leadership Project, the Vision Network, and Relay Graduate School of Education’s National Principal Academy Fellowship, and projects that require additional time to meet goals, such as the Delaware Talent Cooperative and the Educator Recruitment Portal. In addition, the State plans to implement a few additional projects (e.g., establishing up to two additional alternative routes to certification and Advancing Educator Compensation and Careers) that build on initiatives DDOE implemented in Years 1 through 4. In Year 5, DDOE also plans to link DPAS-II and student achievement results to teacher preparation programs and publicly report teacher preparation program effectiveness data.
In SY 2014-2015, the State will adjust its educator evaluation system implementation as it transitions to Smarter Balanced assessments. All educators will continue to have multiple measures of student growth for Component V; however, in Year 5 administrators and educators of tested grades and subjects will have a Component V rating that includes measures that are similar to educators teaching non-tested grades and subjects (see Great Teachers and Leaders). In SY 2014-2015, this Component V rating will be the rating of record and used for human capital decisions such as retention, promotion, compensation, and support. During Year 5, DDOE also plans to continue using development coaches to support improved DPAS-II implementation, to develop and refine the State’s student growth measures, and to engage educators in its continuous improvement efforts.
In Year 5, Delaware also plans to continue providing supports to the State’s lowest-achieving schools. A major aspect of its strategy will include a focus on improving school leadership within schools requiring intervention.
For the State’s expenditures through June 30, 2014, please see the APR Data Display at http://www.rtt-apr.us.
For State budget information, see http://www2.ed.gov/programs/racetothetop/state-scope-of-work/index.html.
For the State’s fiscal accountability and oversight report, see http://www2.ed.gov/programs/racetothetop/performance-fiscal-accountability.html.
Alternative routes to certification: Pathways to certification that are authorized under the State’s laws or regulations that allow the establishment and operation of teacher and administrator preparation programs in the State, and that have the following characteristics (in addition to standard features such as demonstration of subject-matter mastery, and high-quality instruction in pedagogy and in addressing the needs of all students in the classroom including English learners and students with disabilities): (1) can be provided by various types of qualified providers, including both institutions of higher education (IHEs) and other providers operating independently IHEs; (2) are selective in accepting candidates; (3) provide supervised, school-based experiences and ongoing support such as effective mentoring and coaching; (4) significantly limit the amount of coursework required or have options to test out of courses; and (5) upon completion, award the same level of certification that traditional preparation programs award upon completion.
Amendment requests: In the event that adjustments are needed to a State’s approved Race to the Top plan, the grantee must submit an amendment request to the Department for consideration. Such
requests may be prompted by an updated assessment of needs in that area, revised cost estimates, lessons learned from prior implementation efforts, or other circumstances. Grantees may propose revisions to goals, activities, timelines, budget, or annual targets, provided that the following conditions are met: the revisions do not result in the grantee’s failure to comply with the terms and conditions of this award and the program’s statutory and regulatory provisions; the revisions do not change the overall scope and objectives of the approved proposal; and the Department and the grantee mutually agree in writing to the revisions. The Department has sole discretion to determine whether to approve the revisions or modifications. If approved by the Department, a letter with a description of the amendment and any relevant conditions will be sent notifying the grantee of approval. (For additional information, please see http://www2.ed.gov/programs/racetothetop/amendments/index.html.)
America COMPETES Act elements: The twelve indicators specified in section 6401(e)(2)(D) of the America COMPETES Act are: (1) a unique statewide student identifier that does not permit a student to be individually identified by users of the system; (2) student-level

Race to the Top 25
Glossary
Delaware Year 4: School Year 2013 –2014
local educational agencies’ (LEAs’) implementation of far-reaching reforms to turn around lowest-achieving schools by implementing school intervention models.
Effective teacher: A teacher whose students achieve acceptable rates (e.g., at least one grade level in an academic year) of student growth (as defined in the Race to the Top requirements). States, LEAs, or schools must include multiple measures, provided that teacher effectiveness is evaluated, in significant part, by student growth (as defined in the Race to the Top requirements). Supplemental measures may include, for example, multiple observation-based assessments of teacher performance.
High-minority school: A school designation defined by the State in a manner consistent with its Teacher Equity Plan. The State should provide, in its Race to the Top application, the definition used.
High-poverty school: Consistent with section 1111(h)(1)(C)(viii) of the ESEA, a school in the highest quartile of schools in the State with respect to poverty level, using a measure of poverty determined by the State.
Highly effective teacher: A teacher whose students achieve high rates (e.g., one and one-half grade levels in an academic year) of student growth (as defined in the Race to the Top requirements). States, LEAs, or schools must include multiple measures, provided that teacher effectiveness is evaluated, in significant part, by student growth (as defined in the Race to the Top requirements). Supplemental measures may include, for example, multiple observation-based assessments of teacher performance or evidence of leadership roles (which may include mentoring or leading professional learning communities) that increase the effectiveness of other teachers in the school or LEA.
Instructional improvement systems (IIS): Technology-based tools and other strategies that provide teachers, principals, and administrators with meaningful support and actionable data to systemically manage continuous instructional improvement, including such activities as instructional planning; gathering information (e.g., through formative assessments (as defined in the Race to the Top requirements), interim assessments (as defined in the Race to the Top requirements), summative assessments, and looking at student work and other student data); analyzing information with the support of rapid-time (as defined in the Race to the Top requirements) reporting; using this information to inform decisions on appropriate next instructional steps; and evaluating the effectiveness of the actions taken. Such systems promote collaborative problem-solving and action planning; they may also integrate instructional data with student-level data such as attendance, discipline, grades, credit accumulation, and student survey results to provide early warning indicators of a student’s risk of educational failure.
enrollment, demographic, and program participation information; (3) student-level information about the points at which students exit, transfer in, transfer out, drop out, or complete P–16 education programs; (4) the capacity to communicate with higher education data systems; (5) a State data audit system assessing data quality, validity, and reliability; (6) yearly test records of individual students with respect to assessments under section 1111(b) of the Elementary and Secondary Education Act (ESEA) (20 U.S.C. 6311(b)); (7) information on students not tested by grade and subject; (8) a teacher identifier system with the ability to match teachers to students; (9) student-level transcript information, including information on courses completed and grades earned; (10) student-level college-readiness test scores; (11) information regarding the extent to which students transition successfully from secondary school to postsecondary education, including whether students enroll in remedial coursework; and (12) other information determined necessary to address alignment and adequate preparation for success in postsecondary education.
American Recovery and Reinvestment Act of 2009 (ARRA): On February 17, 2009, President Obama signed into law the ARRA, historic legislation designed to stimulate the economy, support job creation, and invest in critical sectors, including education. The Department of Education received a $97.4 billion appropriation.
Annual Performance Report (APR): Report submitted by each grantee with outcomes to date, performance against the measures established in its application, and other relevant data. The Department uses data included in the APRs to provide Congress and the public with detailed information regarding each State’s progress on meeting the goals outlined in its application. The annual State APRs are found at www.rtt-apr.us.
College- and career-ready standards: State-developed standards that build toward college and career readiness by the time students graduate from high school.
Common Core State Standards (CCSS): Kindergarten through twelfth grade (K-12) English language arts and mathematics standards developed in collaboration with a variety of stakeholders including governors, chief State school officers, content experts, teachers, school administrators, and parents. (For additional information, please see http://www.corestandards.org/).
The education reform areas for Race to the Top: (1) Standards and Assessments: Adopting rigorous college- and career-ready standards and assessments that prepare students for success in college and career; (2) Data Systems to Support Instruction: Building data systems that measure student success and support educators and decision-makers in their efforts to improve instruction and increase student achievement; (3) Great Teachers and Great Leaders: Recruiting, developing, retaining, and rewarding effective teachers and principals; and (4) Turning Around the Lowest-Achieving Schools: Supporting

Race to the Top 26
Glossary
Delaware Year 4: School Year 2013 –2014
Invitational priorities: Areas of focus that the Department invited States to address in their Race to the Top applications. Applicants did not earn extra points for addressing these focus areas, but many grantees chose to create and fund activities to advance reforms in these areas.
Involved LEAs: LEAs that choose to work with the State to implement those specific portions of the State’s plan that necessitate full or nearly-full statewide implementation, such as transitioning to a common set of K-12 standards (as defined in the Race to the Top requirements). Involved LEAs do not receive a share of the 50 percent of a State’s grant award that it must subgrant to LEAs in accordance with section 14006(c) of the ARRA, but States may provide other funding to involved LEAs under the State’s Race to the Top grant in a manner that is consistent with the State’s application.
No-Cost Extension (Year 5): A no-cost extension provides grantees with additional time to spend their grants (until September 2015) to accomplish the reform goals, deliverables and commitments in its Race to the Top application and approved Scope of Work. Grantees made no-cost extension amendment requests to extend work beyond the final project year, consistent with the Amendment Principles (http://www2.ed.gov/programs/racetothetop/grant-amendment-submission-process-oct-4-2011.pdf ) as well as the additional elements outlined in the Department Review section of the Amendment Requests with No Cost Extension Guidance and Principles document (http://www2.ed.gov/programs/racetothetop/no-cost-extenstion-submission-process.pdf ).
Participating LEAs: LEAs that choose to work with the State to implement all or significant portions of the State’s Race to the Top plan, as specified in each LEA’s agreement with the State. Each participating LEA that receives funding under Title I, Part A will receive a share of the 50 percent of a State’s grant award that the State must subgrant to LEAs, based on the LEA’s relative share of Title I, Part A allocations in the most recent year at the time of the award, in accordance with section 14006(c) of the ARRA. Any participating LEA that does not receive funding under Title I, Part A (as well as one that does) may receive funding from the State’s other 50 percent of the grant award, in accordance with the State’s plan.
The Partnership for Assessment of Readiness for College and
Careers (PARCC): One of two consortia of States awarded grants under the Race to the Top Assessment program to develop next-generation assessment systems that are aligned to common K-12 English language and mathematics standards and that will accurately measure student progress toward college and career readiness. (For additional information, please see http://www.parcconline.org/.)
Persistently lowest-achieving schools: As determined by the State, (1) any Title I school in improvement, corrective action, or restructuring that (a) is among the lowest-achieving five percent of Title I schools in improvement, corrective action, or restructuring or the lowest-achieving five Title I schools in improvement, corrective
action, or restructuring in the State, whichever number of schools is greater; or (b) is a high school that has had a graduation rate as defined in 34 CFR 200.19(b) that is less than 60 percent over a number of years; and (2) any secondary school that is eligible for, but does not receive, Title I funds that (a) is among the lowest-achieving five percent of secondary schools or the lowest-achieving five secondary schools in the State that are eligible for, but do not receive, Title I funds, whichever number of schools is greater; or (b) is a high school that has had a graduation rate as defined in 34 CFR 200.19(b) that is less than 60 percent over a number of years. To identify the lowest-achieving schools, a State must take into account both (1) the academic achievement of the “all students” group in a school in terms of proficiency on the State’s assessments under section 1111(b)(3) of the ESEA in reading/language arts and mathematics combined; and (2) the school’s lack of progress on those assessments over a number of years in the “all students” group. (For additional information, please see http://www2.ed.gov/programs/sif/index.html.)
Qualifying evaluation systems: Educator evaluation systems that meet the following criteria: rigorous, transparent, and fair evaluation systems for teachers and principals that: (1) differentiate effectiveness using multiple rating categories that take into account data on student growth as a significant factor, and (2) are designed and developed with teacher and principal involvement.
Reform Support Network (RSN): In partnership with the Implementation and Support Unit (ISU), the RSN offers collective and individualized technical assistance and resources to grantees of the Race to the Top education reform initiative. The RSN’s purpose is to support the Race to the Top grantees as they implement reforms in education policy and practice, learn from each other and build their capacity to sustain these reforms.
The School Improvement Grants (SIG) program is authorized under section 1003(g) of Title I of the ESEA. Funds are awarded to States to help them turn around persistently lowest-achieving schools. (For additional information, please see http://www2.ed.gov/programs/sif/index.html.)
School intervention models: A State’s Race to the Top plan describes how it will support its LEAs in turning around the lowest-achieving schools by implementing one of the four school intervention models:
• Turnaround model: Replace the principal and rehire no more than 50 percent of the staff and grant the principal sufficient operational flexibility (including in staffing, calendars/time and budgeting) to fully implement a comprehensive approach to substantially improve student outcomes.
• Restart model: Convert a school or close and reopen it under a charter school operator, a charter management organization, or an education management organization that has been selected through a rigorous review process.
Race to the Top 27
Glossary
Delaware Year 4: School Year 2013 –2014
• School closure: Close a school and enroll the students who attended that school in other schools in the district that are higher achieving.
• Transformation model: Implement each of the following strategies: (1) replace the principal and take steps to increase teacher and school leader effectiveness, (2) institute comprehensive instructional reforms, (3) increase learning time and create community-oriented schools, and (4) provide operational flexibility and sustained support.
Single sign-on: A user authentication process that permits a user to enter one name and password in order to access multiple applications.
The SMARTER Balanced Assessment Consortium (Smarter
Balanced): One of two consortia of States awarded grants under the Race to the Top Assessment program to develop next-generation assessment systems that are aligned to common K-12 English language and mathematics standards and that will accurately measure student progress toward college- and career-readiness. (For additional information, please see http://www.k12.wa.us/SMARTER/default.aspx.)
The State Scope of Work: A detailed document for the State’s projects that reflects the grantee’s approved Race to the Top application. The State Scope of Work includes items such as the State’s specific goals, activities, timelines, budgets, key personnel, and annual targets for key performance measures. (For additional information, please see http://www2.ed.gov/programs/racetothetop/state-scope-of-work/index.html.) Additionally, all participating LEAs are required to submit Scope of Work documents, consistent with State requirements, to the State for its review and approval.
Statewide longitudinal data systems (SLDS): Data systems that enhance the ability of States to efficiently and accurately manage, analyze, and use education data, including individual student records. The SLDS help States, districts, schools, educators, and other stakeholders to make data-informed decisions to improve student learning and outcomes, as well as to facilitate research to increase student achievement and close achievement gaps. (For additional information, please see http://nces.ed.gov/Programs/SLDS/about_SLDS.asp.)
Student achievement: For the purposes of this report, student achievement (1) for tested grades and subjects is (a) a student’s score on the State’s assessments under the ESEA; and, as appropriate, (b) other measures of student learning, such as those described in number (2) of this definition, provided they are rigorous and comparable across classrooms; and (2) for non-tested grades and subjects, alternative measures of student learning and performance such as student scores on pre-tests and end-of-course tests; student performance on English language proficiency assessments; and other measures of student achievement that are rigorous and comparable across classrooms.
Student growth: The change in student achievement (as defined in the Race to the Top requirements) for an individual student between two or more points in time. A State may also include other measures that are rigorous and comparable across classrooms.
Value-added models (VAMs): A specific type of growth model based on changes in test scores over time. VAMs are complex statistical models that generally attempt to take into account student or school background characteristics in order to isolate the amount of learning attributable to a specific teacher or school. Teachers or schools that produce more than typical or expected growth are said to “add value.”