Embed Size (px)
Citation preview

In Garver, J.I., and Montario, M.J., Proceedings from the 11th International Conference on thermochronometry, Anchorage Alaska, Sept. 2008. 54
THERMOCHRONOLOGY OF THE KYRGYZ TIEN SHAN REVEALS THE TIMING OF PUNCTUATED LATE TRIASSIC TO LATE CRETACEOUS TETHYIAN SUBDUCTION AND TIBETAN COLLISIONS AND OF CENOZOIC MOUNTAIN BUILDING AS RESPONSE TO
INDIA-EURASIA CONVERGENCE De Grave, J.1*, Buslov, M.M.2, Glorie, S.1, Stockli, D.F.3, Van den haute, P.1, Batalev, V.Y.4, Kislitsyn, R.V.3 & McWilliams, M.O.5 1 Mineralogy & Petrology Department, Ghent University, Krijgslaan 281/S8, B-9000 Ghent, Belgium 2 Geology & Mineralogy Institute, Siberian Branch - Russian Academy of Science, Novosibirsk,Russia 3 Department of Geology, Tectonics and Geochronology, University of Kansas, Lawrence, KS, USA. 4 International Research Center of the Russian Academy of Sciences in Bishkek, Bishkek, Kyrgyzstan 5 Department of Geological & Environmental Sciences, Stanford University, Stanford, CA, USA
* Corresponding author: [email protected] Study area, methodology and geological setting
The Tien Shan are an active intracontinental mountain belt in the Central Asian Orogenic System (CAOS; Fig. 1A). It is mainly formed by east-west trending mountain ranges, separated by intramontane basins. While the eastern Tien Shan is located in China, our work concentrates on the western Tien Shan, which is for a large part situated in the Republic of Kyrgyzstan. While work is ongoing on samples from its entire territory, the results presented here are to a large extent obtained from the granitic basement of the northern Kyrgyz Tien Shan. The Tien Shan – or Celestial Mountains – can be regarded as a mobile belt between the two rigid blocks or micro-plates of Tarim (south), and Kazakhstan-Junggar (north). This mobile belt was formed during the Paleozoic closure of the Turkestan Ocean and the convergence-collision of aforementioned micro-plates (Gao et al. 1998; Chen et al. 1999). The modern Tien Shan orogen is undergoing active tectonic deformation as a distant effect of India – Eurasia convergence (e.g. De Grave et al. 2007). There is in addition ample evidence that in the Mesozoic, the Tien Shan mobile belt was reactivated. This evidence comes from various sources such as sedimentology (Hendrix 2000; Li et al. 2004), structural geology (Allen and Vincent 1997) and paleomagnetic investigations (Cogné et al. 1995). Also thermochronologic studies (fission track and U-Th/He dating) have indicated a Mesozoic (mainly Jurassic) episode of Tien Shan deformation (Sobel and Dumitru 1997, Bullen et al. 2001, Sobel et al. 2006, De Grave et al. 2007). In this study we revisit the Kyrgyz Tien Shan and present apatite fission-track (AFT), apatite (U-Th-Sm)/He (AHe) and K-feldspar 40Ar/39Ar results from a broad area (Fig. 1). Crystalline basement rocks from basement-cored mountain ranges were collected. These samples are mostly granitoid rocks, though a minor amount of metamorphic rocks (gneiss) are also included in this work. Vertical sample profiles across several ranges were taken, while in other cases single sample sites were chosen. The following Tien Shan mountain ranges (more or less listed in a north-south sense) were sampled: Kindil-Las, (Za)ili (both in Kazakhstan), Kyrgyz, Kungey, Terskey, Talas, Suusamyr, Fergana, Jumgöl, Moldo, Zetim Bel, Naryn, Atbashi, Alai, Trans-Alai (all in Kyrgyzstan) (Fig. 1). At several localities zircon U/Pb ages (SHRIMP or LA-MC-ICP-MS) and biotite 40Ar/39Ar ages were obtained to constrain the basement cooling at higher temperature and to serve as benchmarks for low-temperature thermal history modelling. While this work aims at providing a general overview of results, an associated study (Glorie et al., 2008, this volume) zooms in on a single sample profile and presents more detailed insights. Results and discussion
AFT and AHe age results obtained from the Kyrgyz Tien Shan are indicated in Fig. 1B, along with results from
Sobel and Dumitru (1997), Bullen et al. (2001), and Sobel et al. (2006). The AFT ages vary widely, with the oldest ages Triassic (206-253 Ma) and the youngest late Eocene – early Miocene (38-17 Ma). Most ages are nevertheless Jurassic and Cretaceous and they show a clear zonal pattern in the Kyrgyz Tien Shan. This zonal configuration to the east of the Talas-Fergana fault zone exhibits an elongated east-west appearance, more or less mimicking the strike of the dominating east-west mountain ranges. Zones of older ages, mainly Jurassic, are found at the northern and southern edges of the eastern Kyrgyz Tien Shan, while age zones appear to get younger, from Early to Late Cretaceous, when approaching the more centrally located ranges (Fig. 1). This trend of younger age zones culminates in a narrow, distinct zone of Middle to Late Cenozoic ages at some locations in the Kyrgyz and Terskey ranges. These zones represent exhumed basement in a typical transpressive mountain belt.
At three localities Triassic AFT ages are found that seem to be independent of the east-west zonal age pattern. These Triassic samples were retrieved from the Song Kul and Inylchek areas that are characterised by a high-altitude plateau morphology, with all-surrounding mountain ranges. In this perspective these “old” AFT ages could be interpreted as relict ages, preserved at high-altitude terranes that are moreover internally drained, especially in the case of Song Kul, and that seem to have been eroded to a lesser extent. The sampled sites with Late Mesozoic and Cenozoic AFT ages on the other hand, represent the areas subjected to the most intense uplift and denudation during Late Mesozoic and Cenozoic mountain building. All these ages correspond well with punctuated Cimmerian collision-accretion events transpiring at the southern Eurasian margin. During subduction of the Paleo-Tethys and the early Neo-Tethys, the Tibetan blocks of Qiangtang (230-200 Ma) and Lhasa (160-130 Ma), the Pamir-Karakoram-Hindu Kush terrane (100-125 Ma) and the Kohistan-Dras-Ladakh arc (70-80 Ma) collided with Eurasia (Searle et al. 1999; Schwab et al. 2004; Chu et al. 2006; Kapp et al. 2007). The correlation of these distant geodynamic events with cooling ages in the Tien Shan is marked (Fig. 2), and we interpret the Mesozoic cooling ages as denudation of the Mesozoic Tien Shan as a response to tectonic reactivation. This denudation is underscored by the occurrence of coeval molasse deposits in the foreland basins of Junggar and Tarim (south). AHe ages confirm these findings. In most cases the AHe ages correspond to the Mesozoic AFT ages, and range roughly between 245-105 Ma (Triassic-Cretaceous), with many clustering between 160 and 120 Ma (Jurassic-Early Cretaceous). However, also in the case of the AHe results, distinct Cenozoic ages zones (particularly the Terskey and Zaili Range – 10-30 Ma) can be discerned. At the higher temperature spectrum, Triassic to Jurassic K-feldspar Ar-ages are obtained, while Ordovician to Silurian biotite Ar-ages (~400 Ma) and zircon U/Pb SHRIMP ages (420-460 Ma) provide more insights on basement formation and initial cooling.

In Garver, J.I., and Montario, M.J., Proceedings from the 11th International Conference on thermochronometry, Anchorage Alaska, Sept. 2008. 55
Figure 1: A. General setting of the Kyrgyz Tien Shan. B. Age results obtained from the crystalline Tien Shan basement. C. Schematic and tentative AFT age distribution and age zones in the Tien Shan.

In Garver, J.I., and Montario, M.J., Proceedings from the 11th International Conference on thermochronometry, Anchorage Alaska, Sept. 2008. 56
After final subduction of the Neo-Tethys, the Cenozoic continental collision of India with Eurasia ensued and in a distinct zone of the Kyrgyz Tien Shan, Late Cenozoic AFT and AHe ages are found (Figs 1, 2). These ages represent the initiation of Late Cenozoic intracontinental reactivation of the modern Tien Shan mobile belt as a far-field response to the collision. Also in this case, molasse-type deposits are found in the Tarim and Junggar foreland basins as well as in intramontane basins (e.g. Issyk-Kul, Cobbold et al. 1994). This reactivation is mainly constrained to the Miocene up until the present by the AFT and AHe ages obtained in this and other studies (Sobel and Dumitru 1997, Bullen et al.
2001, Sobel et al. 2006). Numerical modelling of the AFT data (AFTSolve by Ketcham et al. 2000) translates the AFT ages and length information into thermal histories or time-Temperature paths (Fig. 2). These models again confirm the interpretation put forward here. This Meso-Cenozoic intracontinental reactivation history, related to convergent tectonic events at the accretional southern Eurasian margin, can be traced over large swaths of Central Asia and the CAOS. This is for instance also the case for the Altai mountain range, north of Tien Shan (De Grave et al. 2007 and 2008).
Figure 2: Meso-Cenozoic AFT, AHe and Kspar Ar ages obtained from the Kyrgyz Tien Shan in relation to subduction of the Tethys Ocean, collision of Cimmerian blocks with Eurasia, molasse deposits in foreland and intramontane basins, and activity of the Talas-Fergana fault zone. Some AFT thermal history models are also shown (Kil = Kindil Las Range, Kun = Kungey Range, Ter = Terskey Range). References: Allen MB and SJ Vincent. 1997. Fault reactivation in the Junggar
region, northwest China: the role of basement structures during Mesozoic-Cenozoic compression. Journal of the Geological Society, London 154: 151–155.
Bullen ME, DW Burbank, JI Garver and K Abdrakhmatov. 2001. Late Cenozoic tectonic evolution of the northwestern Tien Shan: New age estimates for the initiation of mountain building. Geological Society of America Bulletin 113(12): 1544–1559.
Chen C, H Lu, D Jia, D Cai and S Wu. 1999. Closing history of the Southern Tian shan oceanic basin, Western China: an oblique collisional orogeny. Tectonophysics 302: 23–40.
Chu, MF, SL Chung, B Song, D Liu, SY O’Reilly, NJ Pearson, J Ji and DJ Wen. 2006. Zircon U-Pb and Hf isotope constraints on the Mesozoic tectonics and crustal evolution of southern Tibet. Geology 34: 745-748.
Cobbold, PR, E Sadybakasov, JC Thomas. 1994. Cenozoic transpression and basin development, Kyrghyz Tienshan, Central Asia. In: Roure F, N Ellouz, VS Shein, I Skvortsov (Eds)
Geodynamic evolution of sedimentary basins, International Symposium. Moscow: 181-202.
Cogné JP, Y Chen, V Courtillot, F Rocher, G Wang, M Bai and H You. 1995. A paleomagnetic study of Mesozoic sediments from the Junggar and Turfan basins, northwestern China. Earth and Planetary Science Letters 133: 353-366.
De Grave J, MM Buslov and P Van den haute. 2007. Distant effects of India-Eurasia convergence and intracontinental deformation in Central Asia: constraints from AFT thermochronology. Journal of Asian Earth Science 29: 188–204.
De Grave J, P Van den haute, MM Buslov, B Dehandschutter and S Glorie. 2008. Apatite fission-track thermo-chronology applied to the Chulyshman Plateau, Siberian Altai Region. Radiation Measurements 43: 38-42.
Gao J, M Li, X Xiao, Y Tang and G He. 1998. Paleozoic tectonic evolution of the Tienshan orogen, northwestern China. Tectonophysics 287: 213–231.
Glorie S., J De Grave, MM Buslov, P Van den haute, V Batalev, M Elburg. 2008. Tectonic reactivation along inherited faults revealed
In Garver, J.I., and Montario, M.J., Proceedings from the 11th International Conference on thermochronometry, Anchorage Alaska, Sept. 2008. 57
by AFT thermochronology: a case study in the Central Kyrgyz Tien Shan. This volume.
Hendrix MS. 2000. Evolution of Mesozoic sandstone compositions, southern Junggar, northern Tarim, and western Turpan basins, northwest China: a detrital record of the ancestral Tian Shan. Journal of Sedimentary Research 70: 520-532.
Kapp P, PG DeCelles, GE Gehrels, M Heizler and L Ding. 2007. Geological records of the Lhasa-Qiangtang and Indo-Asian collisions in the Nima area of central Tibet. Geological Society of America Bulletin 119: 917-932.
Ketcham RA, RA Donelick, MB Donelick. 2000. AFTSolve: a program for multi-kinetic modelling of apatite fission-track data. Geological Materials Research 2: 1-32.
Li Z, W Song, S Peng, D Wang and Z Zhang. 2004. Mesozoic-Cenozoic tectonic relationships between the Kuqa subbasin and Tian Shan, northwest China: constraints from depositional records. Sedimentary Geology 172: 223–249.
Schwab M, L Ratschbacher, W Siebel, M McWilliams, V Minaev, V Lutkov, F Chen, K Stanek, B Nelson, F Frisch and JL Wooden. 2004. Assembly of the Pamirs: age and origin of magmatic belts from the southern Tien Shan to the southern Pamirs and their relation to Tibet. Tectonics 23: TC4002.
Searle MP, MA Khan, JE Fraser, SJ Gough and MQ Jan. 1999. The tectonic evolution of the Kohistan-Karakoram collision belt along the Karakoram highway trans ect, North Pakistan. Tectonics 18: 929-949.
Sobel ER and TA Dumitru. 1997. Thrusting and exhumation around the margins of the western Tarim Basin during the India-Asia collision. Journal of Geophysical Research 102: 5043–5064.
Sobel ER, M Oskin, D Burbank and A Mikolaichuk. 2006. Exhumation of basement-cored uplifts: example of the Kyrgyz Range quantified with apatite fission track thermochronology. Tectonics 25: TC2008 doi:10.1029/2005TC001809, 17p.

In Garver, J.I., and Montario, M.J., Proceedings from the 11th International Conference on thermochronometry, Anchorage Alaska, Sept. 2008. 58
CENOZOIC COOLING HISTORY OF THE PUNA PLATEAU AND EASTERN CORDILLERA, NW-ARGENTINA: CONSTRAINTS FROM APATITE FISSION-TRACK GEOCHRONOLOGY
AND (U-TH)/HE ANALYSES Deeken, A.1, Hourigan, J.K.2, Sobel, E.1 & Strecker, M.1
1University of Potsdam, Potsdam, Germany 2University of California, Santa Cruz, United States of America
Low-temperature thermochronology of apatites using both the fission-track (FT) and (U-Th)/He methods are used to characterize the cooling patterns of the Puna and Eastern Cordillera in NW-Argentina between 23°S and 24°S. As part of this project, we collected 22 basement samples from 6 sample locations. The sample locations are situated along a ca. 110 km long, ESE-trending line extending from the Eastern Cordillera across the Puna Plateau. The transect is oriented perpendicular to the orogen, and crosses several main thrusts.
The study area is located within a transitional zone of the Andean orogen between the Bolivian Altiplano segment and the Argentine Puna segment. In this transition zone, a number of fundamental changes occur (Allmendinger et al., 1997). These changes regard the geometry of the subducted Nazca plate, the lithospheric thickness, the structural styles of the foreland deformation etc. (Allmendinger et al., 1997). In the study area, the Puna is characterized by wide spaced, E and W vergent thrusts that emplace Ordivician over Tertiary rocks, resulting in a topography of isolated ridges within a broad, flat plain (e.g. Allmendinger et al., 1997; Coutand et al., 2001). The Eastern Cordillera consist of strongly imbricated thrust slivers and thrust-bounded folds, exposing Proterozoic to early Cambrian basement (e.g. Mon and Salfity, 1995). The study aims to decipher the temporal and spatial exhumation pattern of this part of the Argentine Andes.
Preliminary results from this project which is currently under research yield AFT-ages from three of the sample locations in the Eastern Cordillera that range from late Oligocene to middle Miocene ages. AFT-Ages generally increase with elevation, and indicate rapid exhumation. At the westernmost of these sample locations (Cobres Granite) exhumation started no later than 25 Ma. Priliminary modelling results from the easternmost samples (Fundicion Granite) suggest that these were reheated due to reburial by Andean foreland basin strata and that late exhumation started at ca. 14 Ma. Additional (U-Th)/He-data from these samples will enable more robust thermal models. AFT-data combined with (U-Th)/He-data should allow to determine precise cooling histories from the remaining sample locations to the east and to the west. References Allmendinger, R.W., Jordan, T.E., Kay, S.M. and Isacks, B.L. (1997)
The evolution of the Altiplano-Puna Plateau of the Central Andes. Earth and Planetary Science Annual Review 25, 139-174.
Coutand, I., Cobbold, P.R., de Urreiztieta, M., Gautier, P., Chauvin, A., Gapais, D., Rossello, E.A. and López-Gamundí, O. (2001) Style and history of Andean deformation, Puna plateau, northwestern Argentina. Tectonics 20, N0. 2, 210-234.
Mon, R. and Salfity, J.A. (1995) Tectonic Evolution of the Andes of Northern Argentina. in A.J. Tankard, R. Sàrez S., and H.J. Welsink, Petroleum basins of South America: AAPG Memoir 62, 269-283.

In Garver, J.I., and Montario, M.J., Proceedings from the 11th International Conference on thermochronometry, Anchorage Alaska, Sept. 2008. 59
SEEING SUBTLETIES: THE IMPORTANCE OF CHEMICAL COMPOSITION IN AFT ANALYSIS OF OLD AND COMPLEX LANDSCAPES
Dobson, K.J.1, Brown, R.W.1 & Coventry, A.R.1 1Department of Geographical & Earth Sciences, University of Glasgow, Gregory Building, Lilybank Gardens, Glasgow. G12 8QQ.
UK. Email: [email protected]
Quantifying the timing, rate and amount of cooling driven by complex exhumation histories using apatite fission track and (U-Th)/He thermochronometry remains challenging, and the evolution of the Scottish landscape is one such example. Existing studies have identified a number of possible cooling events, but still there remains little consensus about the amount, timing, and spatial distribution of denudation [1, 2, 3]. Here we present a novel application of fission track thermochronology to a suite of crystalline samples. These have a single, complex thermal history, but show significant chemical variability. We aim to highlight the ability of this chemical heterogeneity to provide additional constraint on thermal histories.
Our ability to extract realistic information about the cooling histories relies implicitly on the ability of the annealing algorithms to accurately extrapolate from laboratory to geological timescales, and to correctly represent the behaviour of fission tracks in the individual apatites used in any study. Although the dominant mechanisms governing apatite fission track annealing are time and temperature, apatite chemistry can also exert a significant kinetic control. Annealing studies have been used to correlate annealing behaviour, as indicated by the parameter Dpar [4,5,6] with Cl-, F- and OH- content, and so the routine assessment of the kinetic variability in apatite populations can now be made. The correlation between Dpar and annealing is not fully understood, and for end member values of Dpar the relationship between annealing and composition remains unclear. In addition to Cl and F (and OH), several other chemical substitutions also control annealing behaviour (Mn, Sr, Fe, Na, REE, Si, S, & C [4, 8, 9]), but in most cases these are thought to have a smaller influence than the dependence on Cl and F. While Dpar allows us to monitor the annealing process in many apatites, further work is required before the annealing behaviour represented by more atypical Dpar values can be fully incorporated into the annealing algorithms and modelling techniques. However, for most apatites used for fission track analysis the Dpar kinetic indicator can be used to incorporate the chemical control into forward and inverse modelling techniques [7].
In apatite populations that have chemical heterogeneity, the high Cl apatites will generally have a larger Dpar and have greater resistance to annealing, for a particular time-temperature path, than apatites with lower Cl content. This different annealing response to a given time temperature path can be exploited. Comparison of fission track age and length distributions from different chemical populations within single sample can tighten both the time and temperature constraints on possible thermal histories, provided the correlation between Dpar and annealing is understood. The difference in annealing, and therefore the differences in track length distributions and AFT ages will be greatest in samples that have spent long periods of time within, or close to the partial annealing zone. Chemical composition could therefore be an important tool for understanding slowly cooled, complex and ancient landscapes.
Measurement of Dpar may now be routine in many laboratories, however there are few examples where this chemical information has been used to improve constraint on thermal histories. Here we present a case study that intentionally targeted samples with chemical variability in
order to extract the maximum information about the thermal histories. This study focuses on a suite of samples from the west coast of Scotland, in order to address several questions about regional and local denudation, relief and landscape evolution. These questions include the rate, amount and timing of exhumation following the Caledonian orogeny, and the magnitude and distribution of denudation following the impact of the proto-Icelandic plume and the opening of the North Atlantic. Both questions are the subject of continued debate.
Samples taken along a short horizontal transect though the Etive Intrusive Complex, were used for fission track and geochemical analyses. This granitic complex is one of many complexes associated with the Caledonian orogeny, and was emplaced at approximately 400 Ma, at a depth of between 6 and 8 km [10, 11, 12]. The Etive Complex shows a compositional progression from a granitic suite in the interior of the complex, to dioritic compositions in the marginal facies. Four samples were collected from the four major lithologies, over a 1 km unfaulted horizontal transect through the outer zones of the complex. The short length of the transect and the absence of faulting, hydrothermal alteration and post Caledonian intrusions implies that these samples have experienced a single thermal history since the end of emplacement at ~ 400 Ma. Expansion of this study to incorporate samples along a vertical profile though the complex, together with addition horizontal transects at know elevations is ongoing
Preliminary fission track length data (Figure 1) from the horizontal transect, show that these samples have significant variability in the track length distribution, variability that is difficult to reconcile with a single thermal history. Sample BC02, taken from the most interior part of the complex shows a broad negatively skewed track length distribution, in sharp contrast to the much narrower, symmetrical distribution found in sample BC04. The other two samples (BC03 & BC05) have wide, bimodal distributions. After c-axis projection the shape of the track length distribution of BC02 becomes more symmetrical, the other samples remain largely unchanged.
The differences between the track length distributions must therefore be controlled by apatite composition. Average values of Dpar were determined for every apatite in which horizontal confined tracks were measured. These were calculated from at least 20 individual Dpar measurements, but individual crystals generally showed little variation in Dpar. The apatite populations for all four samples show a wide range of chemical compositions (Figure 1). However, while BC02 shows the predicted positive correlation between track length and Dpar, the relationship between Dpar and annealing behaviour in the other samples is unclear. Inverse modelling of these samples, using Dpar as the kinetic indicator cannot identify thermal histories that can predict the observed distributions.
We will discuss the track length and compositional data, together with ongoing fission track age determination on individual crystal populations, and the thermal history information that can be extracted from this data set. We will highlight the benefits of targeting chemically variable samples, and the biases that current crystal selection techniques may introduce to both crystal age populations and

In Garver, J.I., and Montario, M.J., Proceedings from the 11th International Conference on thermochronometry, Anchorage Alaska, Sept. 2008. 60
track length distributions. Detailed EMPA analyses have been performed on a large number of apatites from these samples, and the chemical substitutions controlling Dpar and the annealing process will be presented.
We suggest that apatite separates that have significant chemically variable can be a highly useful tool in the
interpretation of complex and slowly cooled terrains, and should be exploited. We will illustrate the improved constraint on cooling histories that can be achieved, by considering applications on a range of geological settings, and by addressing the important questions that remain unanswered about the evolution of the Scottish landscape.
Figure 1. Measured track length distributions and Dpar measurements fro the four samples taken the horizontal transect. Samples are shown in order from the interior sample (top) to exterior (bottom). At least 20 Dpar measurements were made for every grain containing confined tracks. All samples were etched in 5M HNO3 for 20 seconds, at a temperature of 21ºC. Mean measured track lengths for these samples are: BC02 = 10.55 ± 2.32 µm, BC03 = 11.31 ± 1.94 µm BC04 = 12.61± 1.67 µm BC05 = 10.72± 2.18 µm. Samples BC03 and BC05 remain bimodal on c-axis correction, sample BC02 become more symmetrical and BC04 remains broadly unchanged. References [1] Lewis C. L. E., Carter A., & Hurford A. J. (1992) Low-
temperature effects of the Skye Tertiary intrusions on Mesozoic sediments in the Sea of Hebrides Basin. Geological Society, London Special Publication. 62, 175-188.
[2] Thomson K., Underhill J. R., Green P. F., Bray R. J., & Gibson H. J. (1999) Evidence from apatite fission track analysis for the post- Devonian burial and exhumation history of the northern Highlands, Scotland. Marine and Petroleum Geology 16, 27-39.
[3] Persano C., Barfod D. N., Stuart F. M., & Bishop P. (2007) Constraints on early Cenozoic underplating-driven uplift and denudation of western Scotland from low temperature thermochronometry. EPSL 263, 404-419.
[4 ] Barbarand J., Carter A., Wood I. & Hurford T. (2003) Compositional and structural control of fission-track annealing in apatite. Chem. Geol. 198(1–2), 107–137.
[5] Carlson et. al. 1999 [6] Donelick R. A., O'Sullivan P. B., & Ketcham R. A. (2005) Apatite
fission-track analysis. Revs. Min. & Pet. 58, 49-94. [7] Ketcham R. A. (2005) Forward and inverse modeling of low-
temperature thermochronometry data. Revs. Min. & Pet. 58, 275-314
[8] Young D. A., Myers A., Munson E., & Conklin N. (1969) Mineralogy and geochemistry of fluorapatite from Cerro de
Mercado, Durango, Mexico., U.S. Geological Survey, Professional Paper 650D 84-93.
[9] Roeder P., MacArthur D., Ma X.-P., Palmer G. & Mariano A. (1987) Cathodoluminiscence and microprobe study of rare earth elements in apatite. Am. Mineral. 72, 801–811
[10] Moazzen, M. & Droop, G. T. R. (2005) Application of mineral thermometers and barometers to granitoid igneous rocks: the Etive Complex, W Scotland Mineralogy and Petrology 83: 27–53
[11] Kokelaar B. P., & Moore I.D. (2006) Classic areas of British geology: Glencoe caldera volcano, Scotland British Geological Survey. 127 pp.
[12] Droop, G.T.R. & Moazzen, M. (2007) Contact metamorphism and partial melting of Dalradian pelites and semipelites in the southern sector of the Etive aureole Scottish J. of Geol. 43, 155-179.
In Garver, J.I., and Montario, M.J., Proceedings from the 11th International Conference on thermochronometry, Anchorage Alaska, Sept. 2008. 61
LANDSCAPE EVOLUTION OF A CRETACEOUS ALKALINE MASSIF ON THE SOUTHEAST OF BRAZIL
Doranti, C. 1, Hackspacher, P.C.1, Glasmacher, U.A.2, Franco, A.O.B. 1, de Godoy, D.F., Ribeiro, M.C.S.1 & Hadler Neto, J.C.3
1Departmento de Petrologia e Metalogenia – IGCE-UNESP, Rio Claro-SP, Brazil; 2Institute of Earth Science , University of Heidelberg, Germany; 3Instituto de Fisica “Gleb Wataghin”, UNICAMP-IFGW, Campinas-SP, Brazil.
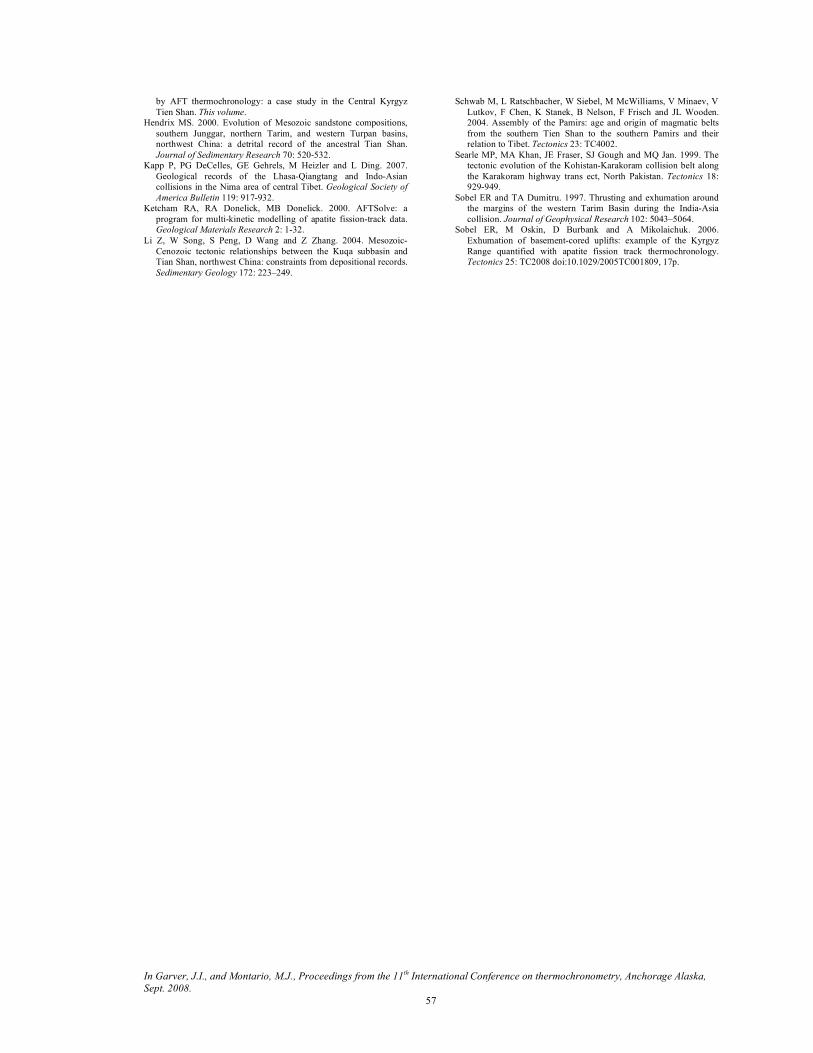
The South American Platform in southeastern Brazil is not a typical passive margin, having a complex evolution and recording a long history of tectonic, magmatic and uplift events, which resulted on the opening of the South Atlantic Ocean. After rifting ceased (ca. 134-114 Ma), epeirogenic uplift (89-65 Ma) of the continental crust commenced in response to the drifting of the South American Platform over a thermal anomaly that was accompanied by intense alkaline magmatism (Almeida, 1967; Zalan & Oliveira, 2005). The Poços de Caldas Alkaline Massif is a consequence of this event, and is one of the largest alkaline bodies in the world, being located in the central-western portion of the magmatic alignement, at the border between Minas Gerais and Sao Paulo States (Figure 1).
The Poços de Caldas Massif with about 800km², is composed mainly of nepheline syenites, phonolites, ankaratrites and volcanoclastic rocks (Almeida, 1964; Horstpeter et al 2002) while the surround area is the crystalline basement, composed mainly of charnockites, orthogneisses, gneisses and granites; on the west side of the massif is the border of the Paraná Basin.
The main morphology of the alkaline massif is a semi-circular plateau with average altitude of 1200 m and
elevations up to 1500-1600 m alongs the edges. Some authors (King, 1956, 1967; Holmes et.al. 1992) consider the circular structure and the elevated surrounding area as a large plateau remnant of an erosional surface resulted from differential erosion in the Late Cretaceous to Paleogene. King (1956) recognized three erosional surfaces, the Early Cretaceous Gondwana Surface (1400m.), the Paleocene Sul Americana Surface (900 m), and the Miocene Velhas Surface (700 m). Ages of the three surfaces were discussed on the base of comparison with other areas in Brazil. However, Almeida (1964) recognized that the Sul Ameircana, that he named Japi Surface, is predominant in the whole area including the area above 1400 m, agreeing that an important tectonis event occurred and uplifted the surface.
The aim of the study is to understand the long-term evolution of the Poços de Caldas Alkaline Massif topography considering these erosional surfaces that exist in the area, using low temperature thermochronology and 3D numerical modeling by applying the computer Code Pecube (Braun 2003).
Figure 1: Location of the Poços de Caldas Alkaline Massif on the SE Brazil.
In Garver, J.I., and Montario, M.J., Proceedings from the 11th International Conference on thermochronometry, Anchorage Alaska, Sept. 2008. 62
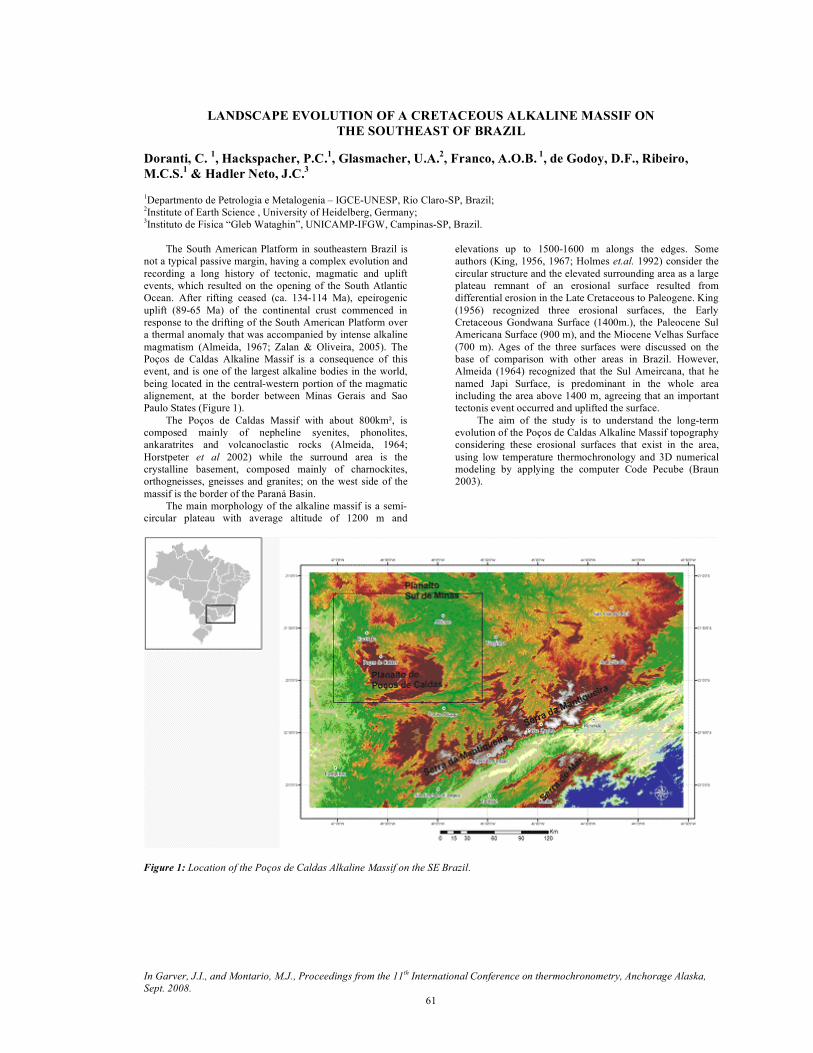
Figure 3: SRTM DEM 3D (Vertical scale 4,25) Perspective of Pocos de caldas Alkaline Massif, view from south to north, and location of the topografic Profile (East to West)\
At the present, we have 18 apatite fission-track ages from rocks collected mainly on the north area of the alkaline massif and its surrounding area. The data show two groups of ages, one is the surrounding area of the massif, where the ages are from the Late Cretaceous, and the second belongs to the alkaline massif area, and resulted in ages, that range from the end of Early Cretaceous to the beginning of the Paleogene. These preliminary results suggest that the oldest surface was formed at the beginning of the Cretaceous, and partially destroyed by the alkaline intrusion from the end of this period, and the recent ages show another erosional event after the intrusion, which shaped the relief that formed another surface at the beginning of the Paleocene. That means the Gondwana surface proposed by King (1956) no longer exist on this area, suggesting that the oldest surface predominant on this area is the Sul-Americana, that was uplifted and partially destroyed on the end of the Late Cretaceous, when it started the elaboration of the Velhas surface proposed by King (1956). Paraguaçu surface was not registered because the apatite fission track data do not have enough resolution (apatite has a relative high closure temperature) to register the morphogenetic process References ALMEIDA, F. F.M. – 1964. Geologia do Estado de São Paulo. IGG,
Boletim N.º 41, 263 p. BRAUN, J. – 2003. Pecube: a new finite-element code to solve the 3D
heat transport equation ncluding the effects of a time-varying, finite amplitude surface topography. Computer and Geosciences 29: 787-794.
FRANCO, A. O. B et al. – 2005. História Térmica do Maciço Alcalino de Poços de Caldas (SP/MG) e Adjacências Através da Análise de Datação por Traços de Fissão em Apatitas. Revista Brasileira de Geociências 35(3): 351-358.
HORSTPETER H.G.J. et al. – 2002. Penecontemporaneous syenitic-phonolitic and basic-ultrabasiccarbonatitic rocks at the Poços de
Caldas alkaline massif, SE Brazil: geologic and geochronologic evidence. Revista Brasileira de Geociências 32(1):15-26.
KING, L.C.- 1956. A geomorfologia do Brasil Oriental. Revista Brasileira de Geografia, v.18, n.2, p.147-265.
MANTESSO-NETO, V.; BARTORELLI, A.; CARNEIRO, C.D.R.; BRITONEVES, B. B. (Ed.). Geologia do continente Sul-Americano: evolução da obra de Fernando Flávio Marques de Almeida. São Paulo: Beca; p. 383-405.
RICCOMINI, C; et al. – 2004. Evolução geológica do rift continental do Sudeste do Brasil. In: MANTESSO-NETO, V.; BARTORELLI, A.; CARNEIRO, C.D.R.; BRITONEVES, B. B. (Ed.). Geologia do continente Sul-Americano: evolução da obra de Fernando Flávio Marques de Almeida. São Paulo: Beca; p. 383-405.
TELLO SAENZ, C.A. et al. 2004. Thermochronology of the SouthAmerican platform in the state of São Paulo, Brazil, through apatite fission tracks. Radiation Measurements, (39) 635 – 640.
ZALAN, P. V., & OLIVEIRA, J. B. A. - 2005. Origem e evolução estrutural do Sistema de Riftes Cenozóicos do Sudeste do Brasil; B. Geociências. Petrobras, Rio de Janeiro, v. 13, n. 2, p. 269-300.

In Garver, J.I., and Montario, M.J., Proceedings from the 11th International Conference on thermochronometry, Anchorage Alaska, Sept. 2008. 63
VARIABLE HELIUM DIFFUSION BEHAVIOR IN APATITE: A CASE STUDY FROM THE NORTHERN SAN ANDREAS TRANSFORM PLATE BOUNDARY
Dumitru, T.A.1 & Unruh, J.R.2 1Department of Geological and Environmental Sciences, Stanford University, Stanford, California 94305 USA
([email protected]) 2William Lettis & Associates, Inc., 1777 Botelho Drive, Walnut Creek, California 94596 USA ([email protected])
Apatite (U-Th)/He analysis of a rock sample
typically involves dating between 2 and ≈10 individual apatite grains. The resulting single-grain He ages should generally be statistically identical, but examples of broadly spread single-grain ages are fairly common. Some of these reflect detrital age effects or analytical difficulties (e.g., high-U inclusions), but others probably reflect real grain-to-grain differences in He diffusion behavior that may be useful recorders of thermochronologic information. Recently, we
completed a structural and tectonic study (Unruh et al., 2007) of the Mt. Diablo anticline east of San Francisco (Fig. 1), where single-grain ages from all seven of our He samples exhibited very broad spreads on the order of 200 to 400% (Fig. 2A). These rocks were heated to ≈75°C late in their histories (Fig. 3), and we infer that this late heating to temperatures near the middle of the He partial retention zone induced the broad age spreads.
Figure 1: Cross sections across Mt. Diablo anticline. Estimates of Pliocene burial temperatures and depths from FT and He data were used to reconstruct the now-eroded upper part of the anticline. Section B crosses exposures of the Coast Range fault, a major older structure folded by the anticline.

In Garver, J.I., and Montario, M.J., Proceedings from the 11th International Conference on thermochronometry, Anchorage Alaska, Sept. 2008. 64
Figure 2: (A) Plot of FT and He ages. For the Great Valley forearc basin samples (structurally above Coast Range fault), all FT ages are older than depositional ages, whereas all He ages are younger, indicating Tmax of these samples (at 3.5 Ma) fell between ~60 and 100°C. For the Franciscan accretionary prism samples beneath the fault, FT ages are highly consistent (mean 61 Ma) and are younger than depositional ages, indicating temperatures >~110–125°C pre–61 Ma, followed by cooling below ~100°C ca. 61 Ma. (B) Plot of degree of late Neogene resetting of He ages (details in Unruh et al., 2007 Data Repository). These values are the approximate percentage of total He lost between times the individual samples cooled below ~85°C ("start age" when He could first be retained by a particular sample) and 3.5 Ma (when all samples experienced Tmax during Neogene burial). Franciscan samples yield consistently younger He ages than Great Valley samples (plot A), but show generally similar degrees of resetting (plot B). This indicates that the younger Franciscan ages are mainly an artifact of the younger start ages of the Franciscan samples (ca. 60 Ma during exhumation) versus the Great Valley samples (ca. 93–141 Ma within sediment source areas). (C) Plot of theoretical He diffusion activation energies (Ea) needed to fit the observed He ages, computed from modeling runs (Fig. 3) assuming a Tmax of 73.7°C at 3.5 Ma for all samples. Almost all grains yield fitted Ea within the narrow range of 32.7 to 33.9 kcal/mol.
Mt. Diablo anticline is a large, active, fault-propagation fold developed over the last 3.5 Ma above the active Mt. Diablo blind thrust fault (Fig. 1). This shortening represents a local contractional step-over in the San Andreas transform plate boundary, and may be a moderate thrust earthquake hazard for nearby cities. Basin filling occurred over the site of the future anticline from the Early Cretaceous until ca. 3.5 Ma, and the detailed stratigraphic record and apatite fission-track (FT) data allow a fairly complete reconstruction of the thermal history. Modeling of FT length distributions indicates maximum burial temperatures (Tmax) of ≈75°C at 3.5 Ma (time of maximum burial/reburial determined from stratigraphic data) (Fig. 3). Another key feature of the area is that two contrasting packages of Cretaceous rocks are exposed, separated by the major Coast Range fault (Fig. 1B and 3). Beneath the fault are blueschist-facies metamorphic rocks of the Franciscan accretionary prism that, based on apatite FT ages, were exhumed at least 8 km in latest Cretac-eous-early Tertiary time by major normal slip along the fault. Above the fault are unmetamorphosed marine strata of the Great Valley forearc basin that were accumulating and subsiding over that same time period.
Apatite in our samples is detrital, mostly sourced from the Sierra Nevada batholith, and mostly of good quality and little-abraded. Unreset apatite FT ages are only slightly older
than depositional ages (Fig. 2A), so detrital effects on He single-grain age patterns should be minor. We determined He ages of seven samples at the Caltech laboratory. For all samples, single-grain He ages are very broadly spread, younger than FT ages, and older than the 3.5 Ma timing of maximum burial/reburial (Fig. 2A).
Mean He ages of Franciscan samples are distinctly younger than mean ages of Great Valley samples (Fig. 2A). This reflects the fact that Franciscan rocks were exhumed mainly in latest Cretaceous-early Tertiary time, whereas Great Valley rocks were never deeply buried (Fig. 3). In order to normalize for differing early histories, we calculated the percent "resetting" of He ages due to He loss from the time He could first started to accumulate in a given sample up until the 3.5 Ma time of maximum burial/reburial (Fig. 2B). After this normalization, all samples, Franciscan and Great Valley, show quite similar spreads in degree of resetting, with most individual grains from each sample 40% to 90% reset (Fig. 2B).
We infer that the large, relatively uniform spreads in degree of resetting reflect real variability in diffusion behavior between different grains all subject to late heating/reheating to ≈75° C. In order to explore the amount of diffusion parameter variation that might be required, we used simplified versions of the best-fit FT models with a

In Garver, J.I., and Montario, M.J., Proceedings from the 11th International Conference on thermochronometry, Anchorage Alaska, Sept. 2008. 65
constant Tmax of 73.7° C at 3.5 Ma as input into He simulation models and varied the assumed 4He diffusion activation energy (Ea). The Ea’s that fit the He ages measured for each grain are plotted in Fig. 2C. These Ea's vary only slightly from grain to grain, falling essentially within a tight band of 32.7 to 33.9 kcal/mol.
Figure 3. Schematic comparison of the burial and unroofing histories of the Franciscan accretionary prism and Great Valley forearc basin (GVG) at Mt. Diablo. The histories of the two units contrast strongly ca. 70 to 40 Ma, then are similar in more recent time. The detachment fault system between the two units was apparently active during the first time period, to accommodate the contrasting histories, then inactive during the second period. The history for the GVG was derived mostly from the basin filling history (e.g., back stripping). This history was then used as input for FT models, which output a fitted provenance age and Tmax (circles); only these two outputs are highly sensitive to the FT data. For the Franciscan samples, the FT models output the general cooling path around 60 Ma and the Tmax at 3.5 Ma (oval and circle); the FT data are not highly sensitive to other segments of the history.
Figure 4: Plot of degree of resetting of single-grain He ages (from Fig. 2B) vs. each grain's "eU" (U plus Th concentrations, weighted by decay rate). eU is a proxy for the rate of production of alpha decay damage in each grain. Shuster et al., (2006) proposed that such damage retards He diffusion by "trapping" He within damaged zones. Such a model predicts a positive correlation (positive slope) in a plot
such as this, with more damaged grains yielding older ages. However, this plot shows no correlation, so the alpha damage model does not explain the wide spread in single-grain He ages observed at Mt. Diablo.
Detailed laboratory heating experiments by Farley (2000) yielded an Ea of 33.0±0.5 kcal/mol for He diffusion in Durango apatite. Less precise work on other apatites has yielded generally similar Ea's. Overall, the fitted Ea's from Mt. Diablo appear to fall easily within the range permitted by current understanding of He diffusion parameters in apatite. We infer that the He ages probably are reliable and are quite compatible with the ≈75° late Neogene Tmax estimated from the FT data.
The thermal history at Mt. Diablo exposed samples to Tmax near the middle of the He partial retention zone (≈75°C) at 3.5 Ma, after considerable He had accumulated. With this favorable history, small spreads in Ea such as those in Fig. 2C can apparently induce very strong spreads in single-grain ages. Therefore, observation of such age spreads may be a useful indicator of similar histories.
We do not know the physical mechanism for the small differences in He diffusion behavior, but it appears to be different from previous proposals. Fitzgerald et al. (2006) proposed that if parent U and/or Th are zoned, partial He loss at roughly 50-85°C may enhance variations in single-grain ages. To test for t his, we visually surveyed the degree of U zoning in about 310 apatite grains on FT external detector prints from our He samples. Roughly 257 grains showed no or slight zoning, 50 moderate zoning, and 3 strong zoning. U zoning does not appear to be prevalent enough in our samples to explain the single-grain age spreads.
Alternatively, Shuster et al. (2006) and Green et al. (2006) proposed that alpha decay of U and Th create alpha radiation damage in the apatite structure that may retard diffusion of He. If samples are then reheated to roughly 50-100°C, grains with lower levels of damage (younger grains and grains with lower U and Th concentrations) will lose more of their He and develop relatively younger ages. In order to test this possibility, we plotted degree of resetting vs. the eU parameter for U and Th concentrations (Fig. 4). This plot does not show the predicted positive correlation, so alpha damage does not explain the age spread we observe. It should be noted that the model of Shuster et al. (2006) might require some minimum amount of alpha damage before inducing detectable variations in single-grain ages. The amounts of alpha damage in our samples are probably low compared to examples cited by Shuster et al. (2006) and Green et al. (2006). Therefore, even though the alpha-damage model does not explain our data, our data do not indicate that the alpha-damage model is incorrect. It should also be noted that the magnitude of differences in single-grain diffusion parameters needed to explain our data (Fig. 2C) are relatively small compared to the alpha-induced differences proposed by Shuster et al. (2006). Reference: (see this paper for complete reference list) Unruh, J.R., T.A. Dumitru, and T.L. Sawyer, 2007, Coupling of early
Tertiary extension in the Great Valley forearc basin with blueschist exhumation in the underlying Franciscan accretionary wedge at Mt. Diablo, California, Geological Society of America Bulletin, v. 119, p. 1347–1367 (and data repository).

In Garver, J.I., and Montario, M.J., Proceedings from the 11th International Conference on thermochronometry, Anchorage Alaska, Sept. 2008. 66
APATITE SINGLE GRAIN (U-TH)/HE DATA FROM HEIMEFRONTFJELLA, RECORD OF FLEXURAL RESPONSE TO GLACIAL LOAD?
Emmel, B.1,2, Jacobs, J.1,2, Crowhurst, P.3 & Daszinnies, M.C.1,4 1Fachbereich Geowissenschaften, Universität Bremen, PF 330440, 28334 Bremen, Germany 2Department of Earth Science, University of Bergen, Allegaten 41, 5007 Bergen, Norway 3CSIRO Petroleum Resources, PO Box 1130, Bentley, WA 6102 Australia 4SINTEF, Strindveien 4, 7465 Trondheim, Norway Introduction
In western Dronning Maud Land (East Antarctica), Heimefrontfjella is the only location were late Paleozoic sedimentary rocks crop out. The surrounding metamorphic basement shows Mesoproterozoic protolith ages and Mesoproterozoic to lower Paleozoic metamorphic, mostly polyphase overprint. The basement/sedimentary rocks unconformity provides a valuable reference surface for the reconstruction of the pre- and post-depositional exhumation history. The easily weathering sedimentary rocks crop out at elevations of c. 2200 m, arguing for a young episode of unroofing. Additionally, these rocks are tilted 1-3° towards the SE (Fig. 1) suggesting tilting of the whole Heimefrontfjella after deposition.
The data and interpretation
Thirty-six AFT ages from Heimefrontfjella are reported from Jacobs and Lisker [1999]. They revealed AFT ages ranging between 172±17 Ma and 81±8 Ma. From 29 samples, mean track lengths were measured varying between 13.48±0.16 µm and 11.96±0.17 µm with corresponding standard deviation between 2.01 µm and 1.32 µm. In order to test the assumption of block tilting in Heimefrontfjella [Jacobs and Lisker, 1999] we plotted the AFT ages of the basement rocks against their present elevations and the calculated relative elevations before block tilting. After rotation the AFT ages show statistically better fits with linear regression lines compared to the original data-set probably indicating that block rotation occurred after closure of the AFT system.
To constraint further the timing of block tilting we dated apatites using the (U-Th)/He method. The single grain ages of zoned apatites (Fig. 2) vary between ca. 130 and 50
Ma. Apatite FT and (U-Th)/He single grain ages were modeled together whereby zoning of the grains was taken into account. We used the program ‘HeFTy v1.3c’ [Ketcham, 2005] to model AFT and (U-Th)/He single grain ages inverse. If possible, 50 good fitting (goodness of fit >0.5) cooling paths were modeled and were tested with the program ‘DECOMP’ [Meesters and Dunai, 2002 a, b]. Model results suggest that samples collected near the outcrop/inland ice boundary show a Cenozoic rock cooling step (Fig. 2) whereas samples farther away record the older cooling history. Hereby the effect of elevation differences on the timing of rock cooling seems to be irrelevant. Thus, we suggest coherence between the rock cooling histories and spatial distribution in respect to the distance to the maximum glacial load.
As the driving mechanism for differential rock cooling we propose flexural isostatic rebound due to glacial load during the development of the intracontinental ice sheet in the hinterland of the Heimefrontfjella region. To compute the potential flexural response of the lithosphere we used a simple finite element model under the assumption of a homogenous crust. Model results (for Te: 10-20 km; glacial load: 3 km) bracket maximum uplift between c. 20-30 m but maximum deflections can reach c. 725 m. We suggest that during the Cenozoic glacial maximum, samples located at the margin of the ice sheet were subjected to maximum deflection. After retreat of the inland ice sheet isostatic compensation and associated enhanced denudation caused the observed Cenozoic rock cooling step. Only minor isostatic compensation affected the samples located at larger distance to the maximum ice load.
Figure 1: Map of Antarctica. The black areas represent outcrops, the grey box highlights the working area. Photograph shows the Late Carboniferous- Early Permian sedimentary rocks tilted by c. 1-3° toward the SE. Abbreviations: DML: Dronning Maud Land.

In Garver, J.I., and Montario, M.J., Proceedings from the 11th International Conference on thermochronometry, Anchorage Alaska, Sept. 2008. 67
Figure 2: Cathodoluminescence images and SEM data of X-ray line-scanning of apatites from the Heimefrontfjella. All apatites show a first order zoning and a second order oscillating variation in uranium and thorium concentrations. Modeled time-temperature path depicts a Cenozoic cooling from below 40° C to surface temperature.
References Jacobs, J., and F. Lisker (1999), Post permian tectono-thermal
evolution of western Dronning Maud Land, East Antarctica: An apatite fission-track approach, Antarct. Sci., 11(4), 451-460.
Ketcham, R.A. (2005), Forward and Inverse Modeling of Low-Temperature Thermochronometry Data, Reviews in Mineralogy and Geochemistry, 58, 275 - 314.
Meesters, A.G.C.A., and T.J. Dunai (2002a), Solving the production-diffusion equation for finite diffusion domains of various shapes part II. Application to cases with α-ejection and nonhomogeneous distribution of the source, Chem. Geol., 186(1-2), 57-73
Meesters, A.G.C.A., and T.J. Dunai (2002b), Solving the production-diffusion equation for finite diffusion domains of various shapes part I. Implications for low-temperature (U-Th)/He thermochronology, Chem. Geol., 186(3-4), 333-344.

In Garver, J.I., and Montario, M.J., Proceedings from the 11th International Conference on thermochronometry, Anchorage Alaska, Sept. 2008. 68
DETRITAL ZIRCON THERMOCHRONOLOGY IN THE CHUGACH–ST. ELIAS OROGEN, SE-ALASKA
Enkelmann, E.1, Garver, J.I.2 & Pavlis, T.L.3
1Earth and Environmental Science Dept., Lehigh University, 31 Williams Dr., Bethlehem, PA, 18015, [email protected] 2Department of Geology, Union College, 807 Union Ave, Schenectady, NY, 12308, [email protected] 3 Department of Geological Sciences, University of Texas at El Paso, Geology 405, 500 West University Blvd., El Paso, Texas 79968, USA
The ongoing oblique collision of the Yakutat terrane with North America formed the highest coastal mountain range in the world, the Chugach–St. Elias orogen in southeast Alaska (Fig. 1A). Because of the high latitude, high relief and maritime climate, the area is heavily glaciated and the ~200 km long and ~10 km wide Bagley Ice field–Seward Glacier system covers most of the orogenic spine (Fig. 1B). Investigation of the long term (>106 yr) exhumation history of the orogen using low-temperature thermochronometers is challenged by the thick ice cover that limits bedrock sampling to the mountain ridges that tower over the massive glaciers. In a new study we use the glaciers as conveyor belts that sample the rocks underneath the glaciers. We present zircons fission track (FT) ages from sand of rivers that drain the glaciers, providing new insight into the exhumation history recorded by rock in the valleys and covered by ice.
This study shows that the Chugach–St. Elias orogen is an excellent example of how natural conditions limit sampling strategies and consequently affect the resulting picture of the exhumation history. The new detrital FT data record an exhumation history that differs significantly from that revealed by bedrock studies (e.g. Spotila et al., 2004; Johnston, 2005; Perry, 2006; Berger et al., 2008, Meigs et al., in press). However, combining these data sets reveals a more comprehensive picture of the exhumation of the Chugach–St. Elias orogen, starting in the Oligocene (~30 Ma) and continuing to the present.
Geological Setting
The Chugach–St. Elias mountain range was formed by the oblique collision and flat-slab subduction of the Yakutat
terrane into the tectonic corner formed by the dextral Fairweather transform fault (east) and the Aleutian subduction zone (Fig. 1A). The Fairweather transform fault formed ~30 Ma and allowed the northward transfer of the Yakutat terrane. This transfer resulted in subduction of 600-1000 km of related oceanic lithosphere that has led the Yakutat terrane, causing the Wrangell volcanic complex (Plafker, 1987). The leading edge of the Yakutat terrane encountered the Aleutian trench between 10 and 5 Ma and has since collided with southeast Alaska (Fig. 1; Plafker et al., 1994).
This part of southern Alaska consists of a complex of terranes amalgamated to North America since the Paleozoic (Fig. 1), including the Paleozoic–Mesozoic Wrangellia terrane, separated by the Border Range fault to the late Mesozoic Chugach terrane. To the south is the Contact fault separating the Chugach from the Paleocene–Early Eocene Prince William terrane. The Contact fault was likely reactivated as the eastward continuation of the dextral Fairweather fault system during Chugach–St. Elias orogenic development (Bruhn et al., 2004). Much of the sedimentary cover to the Yakutat terrane has been scraped off basement rocks and accreted to the fold and thrust belt. The imbricated cover rocks include Eocene–Oligocene Kultieth Formation, the Eocene–Miocene Poul Creek Formation, and the synorogenic fluvial, and glacial marine Miocene–Pleistocene Yakataga Formation that formed in response to orogenic rock uplift since ~6–5 Ma (Lagoe et al., 1993; Plafker et al., 1994).
Figure 1: (A) Tectonic setting in southeast Alaska, plate motion vectors (e.g. Fletcher and Freymueller, 1999). (B) Geological map of the Chugach–St. Elias orogen showing the different accreted terranes. Faults and assumed faults are solid and dashed lines, respectively. BRF: Border Range fault, SCF: Steward Creek fault, CF: Contact fault, CSEF: Chugach–St. Elias fault. Detrital sample locations are shown, grey line indicates the profile shown in Fig. 2.

In Garver, J.I., and Montario, M.J., Proceedings from the 11th International Conference on thermochronometry, Anchorage Alaska, Sept. 2008. 69
Figure 2: Profile through the Chugach–St. Elias orogen summarizing the detrital zircon FT age populations (numbers below surface; Enkelmann et al., in review) and bedrock ages (numbers above the profile; Spotila et al., 2004; Johnston, 2005; Berger et al., 2008. Detrital zircon fission track study
Detrital zircon FT results of ten samples from glacial rivers draining north and south of the Bagley Ice field (Fig. 1) are presented by Enkelmann et al., (in press). Samples located in the Wrangellia and Chugach terrane generally show age populations that get younger towards the south with major changes in age populations across the Border Range fault (Fig. 2). The samples, draining the Bagley Ice field and the area north of it (CH 21, 44, 46, 47) yield age populations ranging from 42-8 Ma. Samples farther north in the Chugach terrane (CH22, 24) yield older populations ranging from 102–30 Ma, and one sample from the Wrangellia terrane north of the Border Range fault yield ages of 120–90 Ma (W23). Significant vertical displacement along the Border Range fault is indicated by the difference of the youngest age populations north of the fault (W23) and south of it (CH22, 24). This result suggests the Wrangellia terrane formed the backstop to the exhumation of the Chugach terrane starting ~30 Ma, coeval with the formation of the Fairweather fault and initiation of Yakutat lithosphere subduction and Wrangell volcanism (Plafker et al., 1994). Two exhumation phases at 20±2 Ma and 11±2 Ma followed as revealed by the Chugach samples CH21, 44, 46 and 47 (Fig. 1B and 2). These two phases of Chugach terrane exhumation coincide with changes in the Pacific plate motion relative to North America at ~20 and ~10 Ma (Stock and Molnar, 1988), and the transition of oceanic plate subduction to flat slab subduction of the Yaktutat terrane at ~10 Ma (e.g. Eberhart-Phillips et al., 2006).
Three samples are located in the Yakutat terrane (Fig. 1B). The drainage areas of these samples consist of the sedimentary rocks of the Kultieth, Poul Creek and Yakataga Formations. Sample YA2 receives material solely from the Yakataga Fm. and provides us cooling information about the rocks that sourced the Yakataga Fm. at the time of its deposition (< 5.6 Ma, Lagoe et al., 1993). The zircon FT age distribution of this sample is amost identical to the samples of the Chugach terrane, suggesting the Chugach terrane as the main source. Based on the youngest age population in YA2 (5.2 Ma), we suggest that the latest exhumation phase in the Chugach–St. Elias orogen started at ~6-5 Ma in concert with the final collision of the Yakutat terrane and the beginning of glacial marine sedimentation of the Yakataga Fm. The backstop shifted southward and the suture between the Chugach and Prince William terrane was reactivated (Contact fault) as the westward continuation of the Fairweather fault zone (Fig. 1). This dextral transpressional fault zone is probably associated with pop–up structures
resulting in locally very rapid exhumation. It is possible that the development of the Bagley Ice field–Seward Glacier system is a consequence of the faulting activity along the Contact fault and therefore it would be younger than 5 Ma. We also predict the fastest exhumation rates along the Fairweather–Contact fault zone where rock weakening due to faulting coincides with strong glacial erosion. The fact that deformed Yakataga Fm. sediments yield ~5 Ma zircon FT ages suggests that cooling ages underneath the Bagley Ice field–Seward Glacier system are younger. Comparing detrital and bedrock results
One of the major advantages of detrital thermochronology over bedrock studies is that rivers collect samples over a large area that might otherwise be inaccessible for bedrock sampling. The well-mixed detrital sample thus represents material from the entire drainage area. In the case of this study, we collected Recent sand samples from rivers that drain the glaciers, at locations close to the ice front. Our detrital samples present therefore mainly material that is scraped off the valley bottoms by the glacier. On the other hand the ice cover limits bedrock sampling to the ridges above the glaciers, a comparison of detrital data with bedrock data can therefore be generally seen as a comparison between the cooling histories recorded by valley samples with ridge samples. That is of major importance considering the effect of topography and exhumation on the perturbation of isotherms in active tectonic areas (e.g. Mancktelow and Graseman, 1997). Particularly cooling through low temperature (i.e. apatite U-Th/He with TC = 65°C, and apatite FT with TC = 100° C) is commonly interpreted as very fast exhumation, but can be typically by explained by the effect of lateral cooling of the topographic relief. The depth of isothermal perturbation depends on the exhumation rate and the vertical and horizontal scale of the surface topography. It has been shown that topography does not affect systems with higher closure temperatures (>200° C, e.g. zircon FT; TC = 240±40° C) but heat advection due to fast exhumation has a significant effect on elevating isotherms (Mancktelow and Graseman, 1997).
Isothermal bending underneath the topography of an exhuming orogen results in cooling histories recorded by samples in valleys (detrital) differing from those displayed by samples taken along ridges (bedrock). As a consequence, the interpretation of thermochronology data from only one data set causes a limited and/or biased view on the exhumation history. Combining the two however, provides a comprehensive picture of the exhumation of the Chugach–St. Elias orogen.
In Garver, J.I., and Montario, M.J., Proceedings from the 11th International Conference on thermochronometry, Anchorage Alaska, Sept. 2008. 70
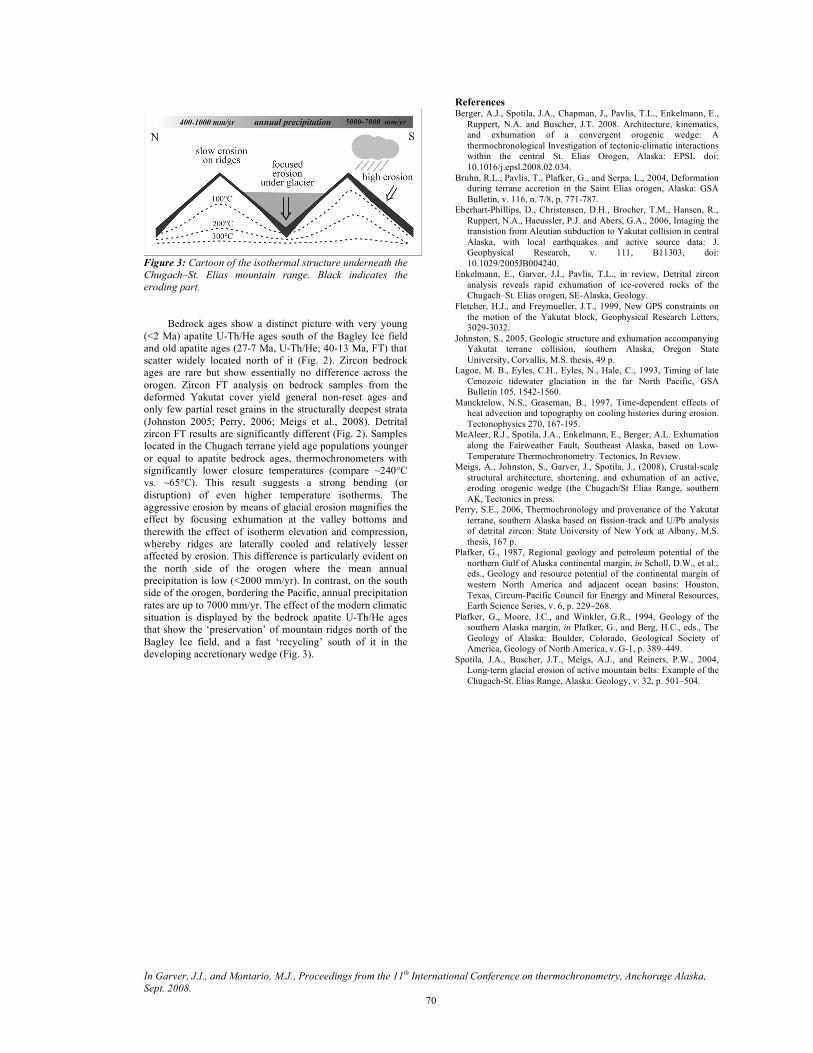
Figure 3: Cartoon of the isothermal structure underneath the Chugach–St. Elias mountain range. Black indicates the eroding part.
Bedrock ages show a distinct picture with very young (<2 Ma) apatite U-Th/He ages south of the Bagley Ice field and old apatite ages (27-7 Ma, U-Th/He; 40-13 Ma, FT) that scatter widely located north of it (Fig. 2). Zircon bedrock ages are rare but show essentially no difference across the orogen. Zircon FT analysis on bedrock samples from the deformed Yakutat cover yield general non-reset ages and only few partial reset grains in the structurally deepest strata (Johnston 2005; Perry, 2006; Meigs et al., 2008). Detrital zircon FT results are significantly different (Fig. 2). Samples located in the Chugach terrane yield age populations younger or equal to apatite bedrock ages, thermochronometers with significantly lower closure temperatures (compare ~240°C vs. ~65°C). This result suggests a strong bending (or disruption) of even higher temperature isotherms. The aggressive erosion by means of glacial erosion magnifies the effect by focusing exhumation at the valley bottoms and therewith the effect of isotherm elevation and compression, whereby ridges are laterally cooled and relatively lesser affected by erosion. This difference is particularly evident on the north side of the orogen where the mean annual precipitation is low (<2000 mm/yr). In contrast, on the south side of the orogen, bordering the Pacific, annual precipitation rates are up to 7000 mm/yr. The effect of the modern climatic situation is displayed by the bedrock apatite U-Th/He ages that show the ‘preservation’ of mountain ridges north of the Bagley Ice field, and a fast ‘recycling’ south of it in the developing accretionary wedge (Fig. 3).
References Berger, A.J., Spotila, J.A., Chapman, J., Pavlis, T.L., Enkelmann, E.,
Ruppert, N.A. and Buscher, J.T. 2008. Architecture, kinematics, and exhumation of a convergent orogenic wedge: A thermochronological Investigation of tectonic-climatic interactions within the central St. Elias Orogen, Alaska: EPSL doi: 10.1016/j.epsl.2008.02.034.
Bruhn, R.L., Pavlis, T., Plafker, G., and Serpa, L., 2004, Deformation during terrane accretion in the Saint Elias orogen, Alaska: GSA Bulletin, v. 116, n. 7/8, p. 771-787.
Eberhart-Phillips, D., Christensen, D.H., Brocher, T.M., Hansen, R., Ruppert, N.A., Haeussler, P.J. and Abers, G.A., 2006, Imaging the transistion from Aleutian subduction to Yakutat collision in central Alaska, with local earthquakes and active source data: J. Geophysical Research, v. 111, B11303, doi: 10.1029/2005JB004240.
Enkelmann, E., Garver, J.I., Pavlis, T.L., in review, Detrital zircon analysis reveals rapid exhumation of ice-covered rocks of the Chugach–St. Elias orogen, SE-Alaska, Geology.
Fletcher, H.J., and Freymueller, J.T., 1999, New GPS constraints on the motion of the Yakutat block, Geophysical Research Letters, 3029-3032.
Johnston, S., 2005, Geologic structure and exhumation accompanying Yakutat terrane collision, southern Alaska, Oregon State University, Corvallis, M.S. thesis, 49 p.
Lagoe, M. B., Eyles, C.H., Eyles, N., Hale, C., 1993, Timing of late Cenozoic tidewater glaciation in the far North Pacific, GSA Bulletin 105, 1542-1560.
Mancktelow, N.S., Graseman, B., 1997, Time-dependent effects of heat advection and topography on cooling histories during erosion. Tectonophysics 270, 167-195.
McAleer, R.J., Spotila, J.A., Enkelmann, E., Berger, A.L. Exhumation along the Fairweather Fault, Southeast Alaska, based on Low-Temperature Thermochronometry. Tectonics, In Review.
Meigs, A., Johnston, S., Garver, J., Spotila, J., (2008), Crustal-scale structural architecture, shortening, and exhumation of an active, eroding orogenic wedge (the Chugach/St Elias Range, southern AK, Tectonics in press.
Perry, S.E., 2006, Thermochronology and provenance of the Yakutat terrane, southern Alaska based on fission-track and U/Pb analysis of detrital zircon: State University of New York at Albany, M.S. thesis, 167 p.
Plafker, G., 1987, Regional geology and petroleum potential of the northern Gulf of Alaska continental margin, in Scholl, D.W., et al., eds., Geology and resource potential of the continental margin of western North America and adjacent ocean basins: Houston, Texas, Circum-Pacific Council for Energy and Mineral Resources, Earth Science Series, v. 6, p. 229–268.
Plafker, G., Moore, J.C., and Winkler, G.R., 1994, Geology of the southern Alaska margin, in Plafker, G., and Berg, H.C., eds., The Geology of Alaska: Boulder, Colorado, Geological Society of America, Geology of North America, v. G-1, p. 389–449.
Spotila, J.A., Buscher, J.T., Meigs, A.J., and Reiners, P.W., 2004, Long-term glacial erosion of active mountain belts: Example of the Chugach-St. Elias Range, Alaska: Geology, v. 32, p. 501–504.
In Garver, J.I., and Montario, M.J., Proceedings from the 11th International Conference on thermochronometry, Anchorage Alaska, Sept. 2008. 71
AN ASSESSMENT OF THE FEASIBILITY OF MONAZITE AS A FISSION-TRACK THERMOCHRONOMETER
Fayon, A.K.1 1Department of Geology and Geophysics, University of Minnesota 310, Pillsbury Dr SE Minneapolis, MN 55455 Email: [email protected] Introduction
Low-temperature thermochronology is one of the most useful tools in constraining late-stage exhumation of rocks in a variety of tectonic settings. Apatite and zircon fission track (FT) and (U-Th)/He thermochronology are widely used, but each technique has its limitations. Monazite FT thermochronology can complement existing techniques and provide key temporal information on dynamic landscape evolution, including the exhumation of young terrains. The ubiquitous occurrence of this mineral and the high uranium concentration makes this phase ideally suited for thermochronologic work, in particular fission-track analysis.
Monazite is a light rare earth element (LREE) phosphate mineral, with the general chemical formula (LREE)PO4. It commonly occurs as an accessory phase which tends to partition U and Th. Monazite is of specific interest because its petrogenesis provides important information regarding metamorphic and magmatic processes. Because of the link between monazite and crustal/orogenic processes, this mineral has been the subject of investigations of in situ U-Th-Pb dating using ion-microprobe and electron microprobe analyses (e.g., Montel et al., 1996). More recently, studies have evaluated the potential of monazite as an (U-Th)/He thermochronometry (Boyce et al., 2005).
A series of experiments were conducted to test the viability of monazite as an FT thermochronometer. Since U concentrations can be determined using electron microprobe techniques, monazite FT thermochronology would be readily available. Monazite crystals were obtained from a sand placer deposit from Cleveland County, North Carolina. Crystals are generally large (> 200µm) and exhibit concentric zoning. The most likely source of the monazite is the Cherryville quartz monzonite, which has been dated at 340-350 Ma by whole rock Rb/Sr methods (Kish and Fullagar, 1977). The U-Th-Pb chemical age of the monazite sand grains, calculated by electron microprobe analyses of numerous grains is 343 ± 5 Ma (Fayon and Baird, 2005), in good agreement with the published whole rock age.
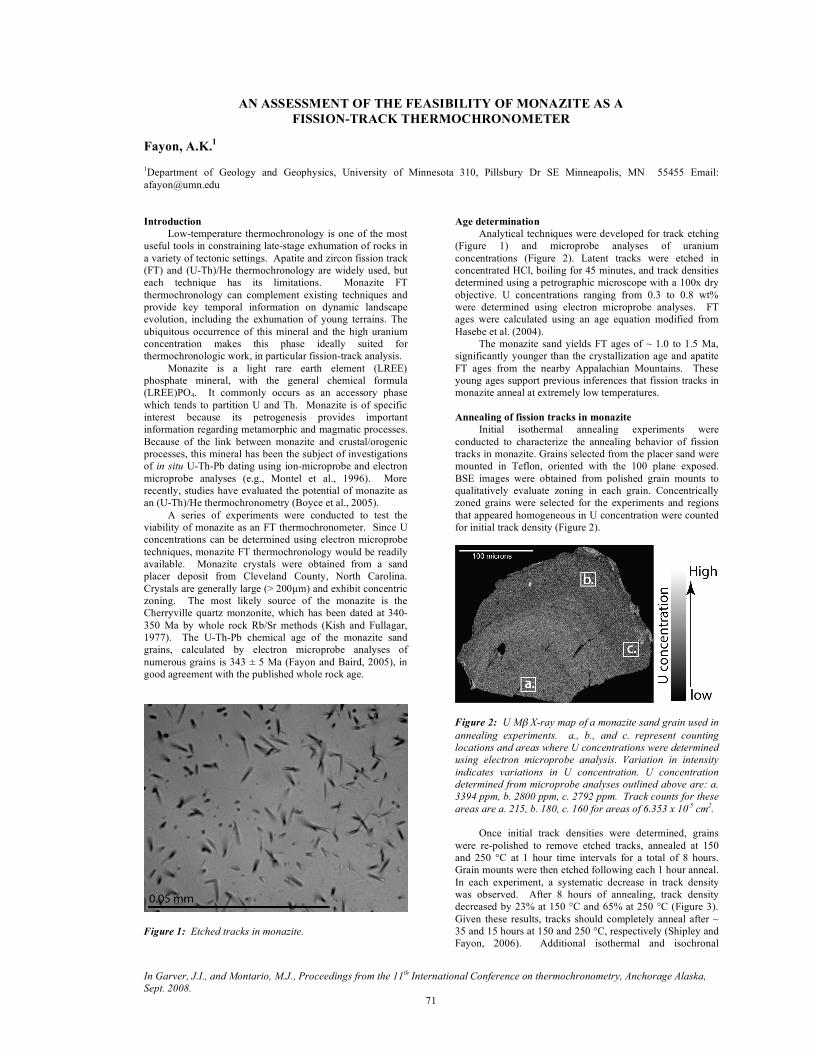
Figure 1: Etched tracks in monazite.
Age determination Analytical techniques were developed for track etching
(Figure 1) and microprobe analyses of uranium concentrations (Figure 2). Latent tracks were etched in concentrated HCl, boiling for 45 minutes, and track densities determined using a petrographic microscope with a 100x dry objective. U concentrations ranging from 0.3 to 0.8 wt% were determined using electron microprobe analyses. FT ages were calculated using an age equation modified from Hasebe et al. (2004).
The monazite sand yields FT ages of ~ 1.0 to 1.5 Ma, significantly younger than the crystallization age and apatite FT ages from the nearby Appalachian Mountains. These young ages support previous inferences that fission tracks in monazite anneal at extremely low temperatures. Annealing of fission tracks in monazite
Initial isothermal annealing experiments were conducted to characterize the annealing behavior of fission tracks in monazite. Grains selected from the placer sand were mounted in Teflon, oriented with the 100 plane exposed. BSE images were obtained from polished grain mounts to qualitatively evaluate zoning in each grain. Concentrically zoned grains were selected for the experiments and regions that appeared homogeneous in U concentration were counted for initial track density (Figure 2).
Figure 2: U Mβ X-ray map of a monazite sand grain used in annealing experiments. a., b., and c. represent counting locations and areas where U concentrations were determined using electron microprobe analysis. Variation in intensity indicates variations in U concentration. U concentration determined from microprobe analyses outlined above are: a. 3394 ppm, b. 2800 ppm, c. 2792 ppm. Track counts for these areas are a. 215, b. 180, c. 160 for areas of 6.353 x 10⁻⁵ cm2.
Once initial track densities were determined, grains were re-polished to remove etched tracks, annealed at 150 and 250 °C at 1 hour time intervals for a total of 8 hours. Grain mounts were then etched following each 1 hour anneal. In each experiment, a systematic decrease in track density was observed. After 8 hours of annealing, track density decreased by 23% at 150 °C and 65% at 250 °C (Figure 3). Given these results, tracks should completely anneal after ~ 35 and 15 hours at 150 and 250 °C, respectively (Shipley and Fayon, 2006). Additional isothermal and isochronal

In Garver, J.I., and Montario, M.J., Proceedings from the 11th International Conference on thermochronometry, Anchorage Alaska, Sept. 2008. 72
experiments on chemically similar monazite are necessary to determine the annealing temperature over geologic timescales.
Summary
The results of the study to date show that monazite FT thermochronology is feasible. Monazite FT ages are in the process of being determined for rocks exposed in the
Grenville Province, Labrador, and in the North American Cordillera. Samples from which monazite has been obtained also contain apatite suitable for FT dating. By obtaining both the apatite and monazite FT ages from one sample, and continuing with annealing experiments, the annealing temperature for fission tracks in monazite will be better constrained.
A.
B.
Figure 3: Track density as a function of annealing time for 150° C (A) and 250° C (B). Each point represents track counts from areas of homogenous U concentrations in 3 to 6 grains. References Boyce J. W., Hodges K. V., Olszewski W. J. and Jercinovic M. J.,
2005, He diffusion in monazite: implications for (U–Th)/He thermochronometry. Geochem. Geophys. Geosyst. 6.
Fayon, A.K, and Baird, G., 2005, No nukes: Determining fission track ages from electron microprobe analysis: Geological Society of America Abstracts with Programs, v. 37, p. 199.
Hasebe, N., Barbarand, J., Jarvis, K., Carter, A., Hurford, A.J., 2004, Apatite fission-track chronometry using laser ablation ICP-MS: Chemical Geology, v. 207, p. 135-145.
Kish, S. A., and Fullagar, P. D., 1977. Plutonic history of the Inner Piedmont near Shelby, North Carolina. Geological Society of America, Abstracts with Programs, v. 9, p. 155.
Montel., J., Foret, S., Veschambre, M., Nicollet, C., Provost, A., 1996. Electron microprobe dating of monazite. Chemical Geology, v. 131, p. 37-53.
Shipley, N. and Fayon, A., 2006, Vanishing Act: Experiments on Fission Track Annealing in Monazite, EOS Transactions (American Geophysical Union Transactions), 87(52).
In Garver, J.I., and Montario, M.J., Proceedings from the 11th International Conference on thermochronometry, Anchorage Alaska, Sept. 2008. 73
PHANEROZOIC GEOTHERMAL GRADIENT VARIATIONS AND EPEIROGENY IN THE SOUTHWESTERN CANADIAN SHIELD (AECL’S UNDERGROUND RESEARCH
LABORATORY, MANITOBA) Feinstein, S.1, Kohn, B.2, Osadetz, K.3, Everitt, R.4 & O’Sullivan, P.5 1Department of Geological and Environmental Sciences, Ben Gurion University of the Negev, P.O. Box 653, Beer Sheva 84 120,
ISRAEL 2School of Earth Sciences, University of Melbourne, Victoria 3010, AUSTRALIA 3Natural Resources Canada, Earth Sciences Sector, Geological Survey of Canada - Calgary, 3303 33rd St. NW, Calgary, Alberta T2L
2A7, CANADA 4Atomic Energy of Canada Limited, Pinawa, Manitoba, R0E 1L0, CANADA (retired) 5Apatite to Zircon Inc., 1075 Matson Road, Viola, ID 83872-9709, USA
AECL’s Underground Research Laboratory (URL) is located on the western flank of the Severn Arch, an extensive exposure of Precambrian crystalline basement that separates the Phanerozoic Williston and Hudson Bay intracratonic basins on the southern Canadian Shield. Deep excavation and extensive drill-coring in the URL provides a unique opportunity for a low-temperature thermochronometry study of the Archean crystalline basement in the southern Canadian Shield. Analysis of a 1.15 km deep apatite fission track (AFT) thermochronology profile at the URL corroborates earlier suggestions of late Neoproterozoic-early Phanerozoic cooling to temperatures below those required for total AFT annealing (Crowley et al., 1985; Crowley and Kuhlman, 1988). In addition however, our AFT time-temperature history models suggest two Phanerozoic heating and cooling episodes that involved significant heat flow variations combined with substantial burial of the Archean shield by Phanerozoic successions that have subsequently been completely eroded. Maximum Phanerozoic temperatures occurred in the late Paleozoic when the geothermal gradient is inferred to have increased to ~47 ± 4.6o C/km (compared to a present day gradient of ~14±2o C/km) and the sedimentary cover was ~800-1100 m thick. A second heating phase occurred during Late Cretaceous-Paleogene time with a more moderately elevated geothermal gradient, ~22 ± 2.1o C/km, and under a somewhat thicker Mesozoic and Cenozoic succession, ~1200 to 1400 m. Our thermal history models along with regional stratigraphic relationships suggest that the Paleozoic succession was completely eroded prior to commencement of Mesozoic sedimentation.
The Phanerozoic thermal history at the URL site is similar to that inferred previously for the epicratonic
Williston Basin, several 100 km's to the west (Osadetz et al., 2002). This implies a common regional thermal history for cratonic rocks underlying both the basin and the currently exposed shield. Further, it suggests that the morphotectonic differences between the Williston Basin and the exposed shield at the URL are due to a dissimilar thermomechanical response to a common Phanerozoic geodynamic history. We tentatively attribute the two Phanerozoic episodes of increased geothermal gradient (heat flow anomaly) and the epeirogenic movements to far-field effects of orogenic processes at the plate margin i.e. the Paleozoic Antler and the Mesozoic Cordilleran orogenies, (e.g. Burgess et al. 1997), and the related deposition and erosion of sedimentary sequences (Kaskaskia and Zuni respectively). References Burgess, PM, Gurnis, M and Moresi, L 1997. Formation of sequences
in the cratonic interior of North America by interaction between mantle, eustatic, and stratigraphic processes. Geol. Soc. Amer. Bull. 109: 1515-1535.
Crowley, KD, Ahern, JL and Naeser CW 1985. Origin and
epeirogenic history of the Williston Basin: evidence from fission-track analysis of apatite. Geology 13: 620-623.
Crowley, KD and Kuhlman, SL 1988. Apatite thermochronometry of
western Canadian Shield: implications for the origin of Williston Basin. Geophysical Research Letters 15: 221-224.
Osadetz, KG, Kohn, BP, Feinstein, S and O’Sullivan, PB 2002. Williston Basin thermal history from apatite fission track thermochronology: implications for petroleum systems and geodynamic history. Tectonophysics 349: 221-249.

In Garver, J.I., and Montario, M.J., Proceedings from the 11th International Conference on thermochronometry, Anchorage Alaska, Sept. 2008. 74
ALONG-STRIKE VARIATION OF THE UPLIFT AND EXHUMATION HISTORY OF THE PYRENEAN OROGEN: CONSTRAINING THE EVOLUTION OF AN
INTRAPLATE OROGEN
Fitzgerald1, P. G., Baldwin1, S.L., Metcalf1, J.R., Muñoz2, J-A, Schwabe,1 E.
Department of Earth Sciences, Syracuse University, Syracuse, NY 13244, USA. ([email protected], [email protected],
[email protected], [email protected]) Group de Geodinàmica i Anàlisi de Conques, Departament de Geodinàmica i Geofisica, Universitat de Barcelona,
Barcelona 08028, Spain; [email protected] Introduction, objectives and strategy
The Pyrenean mountains of Spain and France are a doubly-vergent orogen formed since the Late Cretaceous as a result of convergence between the European and Iberian plates. The Pyrenean orogen extends for ~1500 km from southern France to the Cantabrian ranges of northern Spain. The range consists of a central Axial Zone of uplifted Hercynian Paleozoic basement rocks flanked north and south by fold-thrust belts formed from a Mesozoic-Cenozoic sedimentary cover (Fig. 1). The northern limit of the Axial Zone is defined by the North Pyrenean Fault (NPF), regarded as the Iberian-European plate suture [Choukroune, 1973]. The thrust belts are, in turn flanked by foreland basins, the Aquitaine to the north and the Ebro to the south. The Pyrenees were formed by convergence along a section of previously thinned continental crust. The Pyrenees are an ideal natural laboratory to study the tectonic processes involved in the formation of collisional orogens because of their relatively small size, quality of exposure, preservation of syn-orogenic sedimentary strata and absence of significant late-extensional collapse structures. However, it is the variation in structural style along-strike due to the decreasing amount of shortening from east to west that permits geologic processes associated with
convergence to be evaluated in such detail. Our objective is to relate the along-strike variation in denudation history with the differences in structural style to learn more about the evolution of the Pyrenees and collisional tectonics within this orogen. Variation in structural styles results from the differences in the inherited geometry of pre-existing extensional faults, varying amounts of convergence along the orogen, and a geologic history dominated by Mesozoic extension and transtension followed by Tertiary collision. Extensional faults developed during a Triassic-Cretaceous extensional to transtensional rift system formed during the fragmentation of southern Hercynian Europe and western Tethys [Roest and Srivastava, 1991; Olivet, 1996]. Cenomanian opening of the Bay of Biscay caused counter-clockwise rotation of the Iberian plate that combined with northward movement of the Afro-Iberian plates resulted in oblique collision with the European plate beginning in the late Santonian (~85 Ma). Oblique collision began in the east. Estimates of crustal shortening are ~165 km in the central Pyrenees, decreasing to 103 km in the west-central Pyrenees, 80 km just east of the Pamplona Fault, 50 km in the Basco–Cantabrian fold and thrust belt and 26 km west of the Cantabrian Mountains.
Fig. 1: Structural and geologic sketch map of the Pyrenees showing location of plutons targeted for thermochronology [compiled from Zwart, 1979; Teixell, 1996; Vergés et al., 2002]. Paleozoic metamorphic units and Hercynian granites in the central-western, western and Basque Pyrenees that are part of this study are shown in dark pink. Plutons in the central Pyrenees are shown in light pink.

In Garver, J.I., and Montario, M.J., Proceedings from the 11th International Conference on thermochronometry, Anchorage Alaska, Sept. 2008. 75
Our approach to constrain the timing, amounts and rates of denudation within the Pyrenean orogen is to systematically apply low temperature thermochronology (apatite fission track (AFT), apatite (U-Th)/He dating (AHe) combined with selected 40Ar/39Ar thermochronology) on samples collected from a number of across-strike (north-south) transects. Our approach is systematic in terms of our sampling strategy and the use of vertical sampling profiles, but also with respect to the integration of multiple thermochronometers. In this presentation we compare results from the thrust sheets of the central Pyrenees, notably AFT and (U-Th)/He data from vertical profiles along the ECORS deep-seismic line [Morris et al., 1998; Fitzgerald et al., 1999; Sinclair et al., 2005; Gibson et al., 2007] to results from thrust sheets in the west-central Pyrenees [Jolivet et al., 2007]. This presentation is a companion paper to Metcalf et al (this volume) who apply K-feldspar 40Ar/39Ar thermochronology and multi-diffusion domain modeling to some of the same plutons. Both papers emphasize that thermochronology, while it constrains the thermal history, does not necessarily constrain the timing of thrusting, because thrusting by itself, does not exhume rock. In addition, we present detrital thermochronology on syn-tectonic conglomerates from basins (Sierra de Cis, Senterada and Pobla Basins) south of the central Pyrenees. Granitic cobbles have meaningful central AFT ages that can be compared to data from vertical profiles within the Axial Zone. K-feldspar 40Ar/39Ar thermochronology and multi-diffusion domain (MDD) thermal modeling on one granitic cobble from the Sierra de Cis deposited in the Early Oligocene provides information on Cretaceous cooling. Central Pyrenees (along the line of the ECORS seismic line)
AFT data (LaCourt pluton, Trois Segnieurs pluton) from north of the North Pyrenean fault suggest a transition from relative thermal and tectonic stability to the onset of denudation at ca. 50 Ma at a rate of ca. 300 m/m.y. AFT data from the Nogueres thrust sheet, in the hanging wall of the Garvanie thrust, indicate denudation continued at that same rate from at least 45 Ma to ca. 35 Ma (Riberot pluton), when the denudation rate increased dramatically (km/m.y.) (Marimana pluton). AFT data from the Orri thrust sheet (Maladeta pluton), in the footwall of the Garvanie thrust, suggest burial of that massif and partial annealing of tracks (due to thrusting), followed by rapid denudation (km/m.y.) that slowed dramatically at ca. 32 Ma. Combining AFT data with AHe ages from the Maladeta vertical profile, the rate of denudation remained slow until at least 15 Ma, with later post-orogenic exhumation occurring sometime between 10-0 Ma, likely driven by base-level change. Just south of the Maladeta Massif, across another thrust, AFT data from the Barruera Massif indicate a period of rapid denudation at ca. 22 Ma. Overall the data indicate that separate thrust sheets do not have separate denudation histories, but reflect erosional denudation proceeding from north to south as thrusting to form the Pyrenees propagated southward to create the antiformal stack of the Axial Zone. However, the dramatic increase in denudation rate at ca. 35 Ma, interpreted to reflect erosion following the generation of relief due to thrusting, provides a minimum age for initial movement on the Garvanie thrust.
West-Central Pyrenees We compare the denudation history of two
massifs: the Bielsa pluton that lies in the footwall of the major Gavarnie thrust, and the hanging wall of the Bielsa thrust, and the Nouevielle massif that lies in hanging wall of the major Gavarnie thrust. A minor thrust, the Pic-Long, a branch of the Eaux-Chaudes thrust, separates the Neouevielle from the Gavarnie thrust to the south, while another branch of the Eaux-Chaudes, the Pic-du Midi thrust, bounds the massif to the north. AFT data from a vertical profile in the Neouvielle massif indicates rapid denudation at 30 Ma, dramatically slowing at ~25 Ma. Jolivet et al. (2007) report an AFT age from Neouvielle, and suggest rapid cooling began soon after ~35 Ma. This provides a minimum age for movement along the Gavarnie thrust of ~35 Ma, compatible with similar constraints in the central Pyrenees. AFT data from a vertical profile within the Bielsa massif suggest burial of the massif and partial annealing of tracks (due to burial by thrusting) followed by rapid cooling beginning at 25 Ma and slowing at ~20 Ma. Assuming that denudation follows thrusting, this data supports the southward propagation of thrusting from the Eaux-Chaudes to the Gavarnie, to the Bielsa thrust [e.g., Jolivet et al., 2007] although the timing of denudation of the Bielsa massif is earlier than that proposed by Jolivet [2007] , who proposed out-of-sequence thrusting for the Bielsa thrust.
Syn-tectonic conglomerates, Central Pyrenees
To further constrain the denudation history of the central Pyrenees, we sampled, for detrital thermochronology, syntectonic conglomerates of the South Pyrenean fold and thrust belt. These conglomerates record both the late stages of thin-skinned transport of the South Pyrenean Central Units and the onset of the exhumation of the Pyrenean Axial Zone. Magnetostratigraphic studies constrain the age of the Sierra de Sis and La Pobla de Segur syntectonic conglomerates in Middle-Late Eocene (Bartonian to Priabonian) [Beamud et al., 2003] and the Senterada Basin as middle Oligocene. AFT information on granitic clasts from syn-tectonic conglomerates of the Sis, Pobla and Senterada basins on the southern flank of the Central Pyrenees adds to the extensive thermochronology data set from basement samples, especially as the AFT ages are older, suggesting that these clasts come from eroded upper sections of thrust sheets that form the Pyrenees. If the denudation pattern in each basin was simple and sediment derived from one catchment, we would expect a simple inverted AFT stratigraphy, but this is not the case. For example, in the Sierra de Sis, the lowermost clasts give AFT ages of 43-49 Ma, while clasts stratigraphically above those are older (61-63 Ma). This reversal in age trend reflects a changing source area. However the AFT age sequence in the Sierra de Sis for the three upper groups of samples (63 - 49 - 28 Ma) does represent an inverted AFT stratigraphy and in this case indicates the onset of rapid cooling in the source region at ca. 50 Ma, as indicated by information from the track length distribution.
A plot of AFT age vs. stratigraphic age constrains the rate of exhumation in the source region, assuming that the time from erosion of the sample to deposition is geologically insignificant. Samples that lie on the 1:1 line indicate rapid exhumation. As samples plot further away from the 1:1 line the rate of exhumation is lower, and can be estimated given certain

In Garver, J.I., and Montario, M.J., Proceedings from the 11th International Conference on thermochronometry, Anchorage Alaska, Sept. 2008. 76
assumptions. Interestingly, the data suggests the only truly rapidly exhumed samples are the uppermost samples from the Sierra de Sis, deposited in the Late Oligocene (ca. 27-28 Ma). Thus for the Sierra de Sis region there is a group of slowly cooled samples deposited 50-40 Ma (although the exhumation rate of the source area is unconstrained as mean lengths indicate considerable residence in the apatite partial annealing zone). A change in source region followed, then another group of slowly cooled samples was deposited until ~35 Ma. The exhumation rate of the source region increased dramatically between ~33 and ~28 Ma. This history ties in well with AFT data from vertical profiles along the ECORS line, which also indicates a dramatic increase in denudation rate at about this time. MDD modeling of sample PY-73 (AFT age of 46 Ma) deposited in the Early Oligocene (~33 Ma) in the Cis basin yields quite robust thermal models indicating rapid cooling between ~110 and 90 Ma, perhaps associated with strike-slip motion along the North Pyrenean fault.
References Beamud, E., M. Garcés, L. Cabrera, J. A. Muñoz, and Y.
Almar (2003), A new middle to late Eocene continental chronostratigraphy from NE Spain, Earth and Planetary Science Letters, 216, 501-514.
Choukroune, P. (1973), Phase teconique d’âge variable dans les Pyrénées: évolution du domaine plissé pyrénéen au cours du Tertiaire, C.R. Acad. Sc. Paris, 276, 909-912.
Fitzgerald, P. G., J. A. Muñoz, P. J. Coney, and S. L. Baldwin (1999), Asymmetric exhumation across the Pyrenean orogen: implications for the tectonic evolution of
collisional orogens, Earth and Planetary Science Letters, 173, 157-170.
Gibson, M., H. D. Sinclair, G. J. Lynn, and F. M. Stuart (2007), Late- to post-orogenic exhumation of the central Pyrenees revelaed throughcombined thermochronological data and thermal modeling, Basin Research, 19, 323-334.
Jolivet, M., P. Labaume, M. Brunel, N. Arnaud, and M. Campani (2007), Thermochronology constraints for the propagation sequence of the south Pyrenean basement thrust system (France-Spain), Tectonics, 26, TC5007; doi:5010.1029/2006TC2080.
Morris, R. G., H. D. Sinclair, and A. J. Yelland (1998), Exhumation of the Pyrenean orogen: implications for sediment discharge, Basin Research, 10, 69-85.
Olivet, J.-L. (1996), La cinématique de la plaque Ibérique, Bull. Centres Rech. Explor.-Prod. Elf Aquitaine, 20, 131-195.
Roest, W. R., and S. P. Srivastava (1991), Kinematics of the plate boundaries between Eurasia, Iberia and Africa in the North Atlantic from the late Cretaceous to the present, Geology, 19, 613-616.
Sinclair, H. D., M. Gibson, M. Naylor, and R. G. Morris (2005), Asymmetric growth of the Pyrenees revealed through measurment and modelling of orogenic fluxes, American Journal of Science, 305, 369-406.
Teixell, A. (1996), The Ansó transect of the southern Pyrenees: basement and cover thrust geometries, Journal of the Geological Society, 153, 301-310.
Vergés, J., M. Fernàndez, and A. Martínez (2002), The Pyrenean orogen: pre-, syn-, and post-collisional evolution., in Reconstruction of the evolution of the Alpine-Himalayan orogeny, edited by G. Rosenbaum and G. S. Lister, pp. 57-76.
Zwart, H. J. (1979), The Geology of the Central Pyrenees, Leidse Geologische Mededelingen, 50, 1-74.

In Garver, J.I., and Montario, M.J., Proceedings from the 11th International Conference on thermochronometry, Anchorage Alaska, Sept. 2008. 77
THE SOUTH VIRGIN-WHITE HILLS DETACHMENT FAULT SYSTEM OF SE NEVADA AND NW ARIZONA: APPLYING APATITE FISSION TRACK
THERMOCHRONOLOGY TO CONSTRAIN THE TECTONIC EVOLUTION OF A MAJOR CONTINENTAL DETACHMENT FAULT
Fitzgerald, P.G.1, Duebendorfer2, Faulds, E.M.3, & O'Sullivan, P.4
1Department of Earth Sciences, Syracuse University, Syracuse, NY 13215, USA ([email protected]) 2Department of Geology, Northern Arizona University, Flagstaff, AZ 86011, USA ([email protected] 3Nevada Bureau of Mines and Geology, University of Nevada, Reno, NV 89557, USA ([email protected]) 4Apatite to Zircon Inc., Moscow, ID 83843, USA ([email protected]) Introduction and objectives
The South Virgin-White Hills detachment (SVWHD) is a major continental detachment fault system within the eastern Lake Mead extensional domain of southern Nevada and northwestern Arizona [Duebendorfer and Sharp, 1998]. The SVWHD has an along-strike displacement gradient from ~17 km in the north, to <6 km over its ~60 km length (Fig. 1). Low temperature thermochronology is used to constrain the tectonic evolution of this region, including the role that the SVWHD played during profound Miocene extension, thus providing insight into the along-strike development of detachment fault systems. We integrate new apatite fission track (AFT) thermochronology data from the region south of Lake Mead and the Gold Butte block tilted crustal block with existing thermochronologic, structural and stratigraphic information to address: (1) Is there is a difference in footwall exhumation histories along the strike of the detachment that can be linked to the displacement gradient? (2) Is the slip rate on the SVWHD the same along its length, and can that be explained by a north to south younging for the onset of movement? (3) Do the slip rates on the detachment vary along-strike, as would be expected if the timing of movement on the fault was synchronous along-strike? (4) What constraints can be placed on the initial dip of the detachment? (5) What is the overall thermal history of this region?
Gold Butte block The Gold Butte block, at the northern end of the
SVWHD, is a largely intact tilted crustal block, exposing ca. 17 km of crust in the footwall of the Lakeside Mine fault [Wernicke and Axen, 1988; Fryxell et al., 1992; Brady et al., 2000]. Previous thermochronology in the Gold Butte Block [Fitzgerald et al., 1991; Reiners et al., 2000; Bernet, 2002; Reiners, 2005] document well the timing of the onset of rapid cooling due to tectonic exhumation, as well as the intact nature of at least the upper ~10 km of the crustal block. The pattern of AFT ages plotted vs. paleodepth indicates a clear break between samples with AFT ages older than ~17 Ma, that indicate considerable residence time within an apatite PAZ, and those with AFT ages < ~17 Ma that indicate rapid cooling through the apatite PAZ. The dramatic break in slope in the age-paleodepth profile at ~1.6 km below the nonconformity represents the base of an exhumed PAZ and the onset of rapid cooling due to tectonic exhumation at ca. 17 Ma. Exhumed PRZ's from zircon and titanite (U-Th)/He age - paleodepth and the zircon fission track - paleodepth profiles also indicate the onset of rapid cooling due to tectonic exhumation at ~17 Ma. AFT ages (rapidly cooled samples) versus distance from the sub-Cambrian nonconformity yields a (minimum) slip rate of 8.6 ± 6 km/m.y. (1s) along the Lakeside Mine fault during tectonic exhumation and tilting of the Gold Butte block.
Figure 1: Oblique DEM derived using GeoMapApp (www.marinegeo.org/geomapapp).

In Garver, J.I., and Montario, M.J., Proceedings from the 11th International Conference on thermochronometry, Anchorage Alaska, Sept. 2008. 78
The paleo-geothermal gradient for the mid Miocene (just prior to the onset of extension) is constrained using multiple methods: paleodepth of the base of exhumed AFT, ZFT partial annealing zones, paleodepth of the base of the exhumed zircon and titanite (U-Th)/He partial retention zones, temperature difference between the base of these PAZs and PRZs divided by the paleodepth differences, to yield 18-20°C/km. The original dip on the Lakeside Mine
fault was likely ~60°. A new vector approach, albeit with caveats, to constrain the dip of the fault during tectonic exhumation, using the angle between the vertical exhumation rate and the slip rate is presented.
Figure 2: Simplified geological map of the Gold Butte block of southeastern Nevada and White Hills of northwestern Arizona with AFT ages (Ma). CMF = Cyclopic Mine fault, GWF = Grand Wash fault, LBF = Lost Basin Range fault, LMF = Lakeside Mine fault, MF = Meadview fault, SSF = Salt Spring fault, WF = Wheeler Ridge fault. Geographical features: GRP = Golden Rule Peak, GWT = Grand Wash Trough, LBR = Lost Basin Range, SWR = South Wheeler Ridge, WR = Wheeler Ridge.

In Garver, J.I., and Montario, M.J., Proceedings from the 11th International Conference on thermochronometry, Anchorage Alaska, Sept. 2008. 79
White Hills
The dominant structure is the west-dipping, low-angle, top-to-the-west SVWHD, expressed in the White Hills as the Salt Spring and Cyclopic Mine faults. Between the SVWHD and the largely undeformed Grand Canyon region of the Colorado Plateau, a series of major north-striking normal faults divide the region into two distinct ranges. The Grand Wash fault, with an offset of 3.5 - 5 km down the west and with motion from ca. 16 to 11 Ma, marks the dramatic and scenic edge of the Colorado Plateau. In contrast, the Meadview fault is down-to-the-northeast, has a 100 m wide damage zone implying significant displacement, and separates Proterozoic basement and nonconformably overlying Paleozoic strata of south Wheeler Ridge from Proterozoic basement of the northern Lost Basin Range.
Within the footwall of the SVWHD there is no single (semi-coherent) tilted crustal block with an overlying unconformable sedimentary section and hence samples cannot be plotted according to paleodepth. However, west of the Meadview fault, AFT ages range from ~13 to ~19 (with large errors) Ma and reflect rapid cooling due to tectonic exhumation associated with extension controlled by the SVWHD. A few samples close to Lake Mead have been partially reset by thermal effects induced by hydrothermal activity associated with Miocene magmatism. While there is no exhumed PAZ exposed, results indicate rapid cooling must have been underway by ca. 18 Ma, continuing until at least 13 Ma, consistent with stratigraphic constraints. Slip rate determined by plotting AFT age vs. horizontal distance from the SVWHD for three E-W transects yield slip rates of ca. 1.2 km/m.y. While differential slip is required between the Gold Butte block and the northern White Hills, it is uncertain how many east-trending transverse structures there may be and how much differential slip was accommodated on those. Therefore the displacement gradient along the SVWHD most likely resulted from near-synchronous motion but with differential slip rates along different segments of the SVWHD. It favors growth of the detachment fault by linkage of individual segments.
East of the Meadview and Grand Wash faults AFT ages are all >60 Ma and track length distributions reflect a more complex thermal history with samples residing for considerable time in the apatite PAZ. The most profound break in AFT ages is across the Meadview fault. On the southwest side, rapidly cooled AFT ages of 15-19 Ma contrast an age of 127 Ma on the northeast side, only ~2 km away. This age difference indicates the Meadview fault is one of the more important structures in this region and that any original exhumed PAZ east of the SVWHD in the White Hills region (cf. to the Gold Butte block), has likely been
uplifted and eroded due to movement along the Meadview Fault and the SVWHD. The east-dipping Meadview fault may have served as a major antithetic fault that accommodated exhumation of the footwall of the SVWHD and it would have been most active during peak extension contemporaneous with the SVWHD. AFT ages of ca. 15 Ma in the southern Lost Basin Range compared to an age of ~68 Ma from Garnet Mountain may correspond with the buried trace of the southern extension of the Meadview fault.
A composite AFT-stratigraphic column to constrain the thermal history of the region can be constructed by temporally linking AFT data from the Gold Butte block with data from the White Hills and the western edge of the Colorado Plateau. The thermal history reflects the transition of the Colorado Plateau as a depositional environment, through the Laramide orogeny and a poorly constrained heating event in the Oligocene, to the major cooling event associated with tectonic denudation and Miocene extension in the adjacent Basin and Range province. The marked contrast in AFT ages across some mapped faults in the region also indicates their previously unrecognized significance (e.g., Meadview fault). References Bernet, M. (2002), Exhuming the Alps though time; clues from
detrital zircon fission-track ages, PhD thesis, Yale University, New Haven, Connecticut.
Brady, R. J., B. Wernicke, and J. E. Fryxell (2000), Kinematic evolution of a large-offset continental normal fault system, South Virgin Mountains, Nevada, Geological Society of America Bulletin, 112, 1375-1397.
Duebendorfer, E. M., and W. D. Sharp (1998), Variation in extensional strain along-strike of the South Virgin-White Hills detachment fault: Perspective from the northern White Hills, northwestern Arizona, Geological Society of America Bulletin, 110, 1574-1589.
Fitzgerald, P. G., J. E. Fryxell, and B. P. Wernicke (1991), Miocene crustal extension and uplift in southeastern Nevada: Constraints from apatite fission track analysis, Geology, 19, 1013-1016.
Fryxell, J. E., G. G. Salton, J. Selverstone, and B. Wernicke (1992), Gold Butte crustal section, South Virgin Mountains, Nevada, Tectonics, 11, 1099-1120.
Reiners, P. W. (2005), Zircon (U-Th)/He thermochronometry, in Low-temperature thermochronology: Techniques, Interpretations, and Applications, edited by P. W. Reiners and T. A. Ehlers, pp. 151-179, Mineralogical Society of America, Chantilly.
Reiners, P. W., R. Brady, K. A. Farley, J. E. Fryxell, B. Wernicke, and D. Lux (2000), Helium and argon thermochronometry of the Gold Butte Block, south Virgin Mountains, Nevada, Earth and Planetary Science Letters, 178, 315-326.
Wernicke, B., and G. J. Axen (1988), On the role of isostasy in the evolution of normal fault systems, Geology, 16, 848-861.

In Garver, J.I., and Montario, M.J., Proceedings from the 11th International Conference on thermochronometry, Anchorage Alaska, Sept. 2008. 80
EXHUMATION OF THE PATAGONIAN CORDILLERA: INSIGHTS FROM DETRITAL
THERMOCHRONOLOGIC ANALYSIS OF THE MAGALLANES BASIN, SOUTHERN CHILE
Fosdick, J.C.1, Bernhardt, A.1, Romans, B.W.2, Fildani, A.2 & Graham, S.A.1 1Dept. of Geological & Environmental Sciences, Stanford University, Stanford, California, 94305 2Chevron, Energy Technology Company, Quantitative Stratigraphy Team, San Ramon, California, 94583
The development and subsequent deformation of
foreland basins provides critical information about the kinematics and behavior of fold-thrust belts in orogenic evolution. In the Patagonian Andean orogen between 50-52 °S (Fig. 1), the Magallanes foreland basin developed on pre-orogenic oceanic and attenuated continental crust and records a prolonged period of deep-water marine deposition, prior to basin filling and the cratonward migration of the Tertiary deformation and foreland depocenter (Fildani and Hessler, 2005). Late Cretaceous tectonic shortening resulted in uplift along the western basin margin and initiated a transition to foreland basin sedimentation. Although considerable work has been done to evaluate this transition (Dalziel, 1981; Wilson, 1991; Fildani and Hessler, 2005; Calderón et al., 2007), thermochronologic data might directly tie orogenic uplift with concurrent basin evolution and better constrain the exhumation of the western Cordilleran thrust sheets. Here, we present results from ongoing work that includes apatite and zircon (U-Th)/He thermochronologic and detrital zircon U-Pb data from the Magallanes Basin to assess 1) exhumation and inferred deformational patterns across the sub-Andean fold-thrust belt and 2) potential provenance and age of sediment source exhumation that contributed detrital input to the Cretaceous foreland basin.
The study area is located in the Patagonian Cordillera (Fig. 1) and consists of dissected Paleozoic metamorphic basement, Jurassic through Neogene calc-alkaline plutons of the Patagonian Batholith, and the Mesozoic-Cenozoic Patagonian fold-thrust belt (e.g., Dalziel, 1981; Allen, 1982; Biddle, et al., 1986; Ramos, 1989; Wilson, 1991; Hervé et al., 2007). In recent years, additional stratigraphic and provenance studies, new geochronology, structural studies,
and industry exploration have contributed new data – and inspired new questions - on the dynamic interplay between the Magallanes foreland basin and thrust belt evolution. Remnants of the Jurassic Rocas Verdes marginal basin include the Sarmiento ophiolite and associated metasedimentary and metavolcanic rocks exposed in the western Cordillera (e.g., Calderón et al., 2007 and references therein) (Fig. 1), whereas the eastern sub-Andean fold-thrust belt constitutes the sedimentary fill of the Upper Cretaceous – Neogene retro-arc foreland basin (Fildani and Hessler, 2005; Malumián et al., 2001; Romans, 2008; Crane et el., in press; Hubbard et al., in press) (Fig. 2).
This presentation highlights preliminary zircon (U-Th)/He and U-Pb data from the deep-water phase of Magallanes foreland basin that provides refined constraints on depositional age and exhumational histories in the thrust belt. Continued late Cretaceous foredeep subsidence culminated in the deep-water Cerro Toro Formation, during which time high rates of uplift and denudation of the hinterland fed conglomerate-filled channels in the axis of the deep-water Magallanes basin (Dott et al., 1982; Crane and Lowe, in press; Hubbard et al., in press). Zircon separated from turbidites and interbedded volcanic ash layers suggest continuous input and high erosion rates of potentially arc-related source terrane ca. 84-86 Ma during maximum foredeep subsidence (Bernhardt and Lowe, 2007). Ongoing detrital thermochronologic studies of the foreland basin deposits aim to assess the temporal unroofing patterns of their source terranes, such as the thrust sheets in the western Cordillera and the subAndean fold-thrust belt (e.g., Romans, 2008).
Figure 1: Tectonic setting of the Patagonian Andes modified and compiled from Thomson et al. (2001) and Fildani and Hessler (2005). The study area is indicated by the black box and includes part of the western Cordillera and sub-Andean fold-thrust belt (Fig. 2).

In Garver, J.I., and Montario, M.J. (eds.), Proceedings from the 11th International Conference on thermochronometry, Anchorage Alaska, Sept. 2008. 81
Figure 2: Distribution of apatite (U-Th)/He ages from the subAndean fold-thrust belt and sample locations for combined detrital U-Pb and zircon (U-Th)/He analyses.
The magnitude of deformation in the sub-Andean fold-thrust belt decreases eastward toward the craton and consists of several structural domains that accommodate contrasting styles of shortening (Winslow, 1980; Wilson, 1991). These boundaries may reflect progressive deformation due to an advancing thrust front (e.g., Radic et al., 2007), as documented by basin provenance evolution (Romans, 2008; Fildani et al., in press). Subsequent Eocene to early Oligocene synorogenic deposition documents progressive propagation of the thrust-front into the foreland basin (e.g., Malumián et al., 2001). Unpublished industry seismic data suggest the presence of Miocene (?) deep-seated thrust faults (Harambour, 2002; Mpodozis, 2007) that broadly correspond to these domain boundaries. The significance and age of these structures, however, remain poorly understood in a regional deformational context. Thermochronologic methods are well-suited to recognize vertical uplift along high-angle basement faults that underpin the sub-Andean fold-thrust belt. Our new apatite (U-Th)/He and suggest Miocene exhumation of the thrust belt (Fig. 2) and invite speculation on the role of basement structures in accommodating regional uplift. As such, temporal constraints of exhumation across these structures help assess a spatial progression of retroarc deformation into the foreland and potentially elucidate the age and significance of thrust faults that would otherwise be difficult to identify in the surface geology (e.g., Wobus et al., 2003).
Acknowledgements Research was funded by the Stanford Project on Deep-water Depositional Systems (SPODDS) industrial affiliates, A.I. Levorsen Fund, and the American Alpine Club. The authors gratefully acknowledge insightful contributions from Jeremy Hourigan, Marty Grove, Stephen Hubbard, George Hilley, Trevor Dumitru, Peter DeCelles, Mauricio Calderon, Peter McGregor, and Lisandro Rojas on thermochronologic methodology and the evolution of the Magallanes Basin. References Allen, R.B., 1982, Geología de la Cordillera Sarmiento, Andes
Patagónicos, entre los 50° 00’ y 52° 15’ Lat. S, Magallanes, Chile: Servicio Nacional de Geologia y Mineria, Chile, Boletin (Instituto de Estudios de Poblacion y Desarrollo [Dominican Republic]), v. 38, p. 1-46.
Bernhardt, A., and Lowe, D.R., 2007, Constraining the Controls on the Deposition of Deep-Water Conglomerates, Upper Cretaceous Cerro Toro Formation, Magallanes Basin, Chile: American Geophysical Union Abstracts with Programs, December, 2007.
Biddle, K. T., Uliana, M. A., Mitchum Jr., R. M., Fitzgerald, M. G., and Wright, R. C., 1986, The stratigraphic and structural evolution of the central and eastern Magallanes Basin, southern South America, in Allen, P. A., and Homewood, P., eds., Foreland Basins: International Association of Sedimentologists Special Publications, Oxford, United Kingdom, Blackwell, p. 41�63.
Blisniuk, P.M., Stern, L.A., Chamberlain, C.P., Zeitler, P.K., Ramos, V.A., Sobel, E.R., Haschke, M., Strecker, M.R., Warkus, F., 2006, Links between Mountain uplift, climate, and surface processes in

In Garver, J.I., and Montario, M.J. (eds.), Proceedings from the 11th International Conference on thermochronometry, Anchorage Alaska, Sept. 2008. 82
the southern Patagonian Andes in The Andes – Active Subduction Orogeny: Frontiers in Earth Sciences, eds., Oncken, O, p. 429-440.
Calderón, M., Fildani, A., Herve, F., Fanning, C.M., Weislogel, A., Cordani, U., 2007, Late Jurassic bimodal magmatism in the northern sea-floor remnant of the Rocas Verde basin, southern Patagonian Andes, Journal of the Geological Society, London, v. 162, p. 1011-1022.
Crane, W.H., and Lowe, D.R., in press, Architecture and evolution of the Paine channel complex, Cerro Toro Formation (Upper Cretaceous), Silla Syncline, Magallanes Basin, Chile: Sedimentology.
Dalziel, I.W.D., 1981, Back-arc extension in the southern Andes: A review and critical reappraisal: Royal Society of London Philosophical Transactions, ser. A, v. 300, p. 319-335.
Dott, R.H., Winn, R.D., Jr., and Smith, C.H.L., 1982, Relationship of late Mesozoic and Early Cenozoic sedimentation to the tectonic evolution of the southernmost Andes and the Scotia Arc, in C. Craddock, ed., Antarctic Geoscience: International Union of Geological Sciences, Symposium on Antarctic Geology and Geophysics, University of Wisconsin, Madison, p. 193-202.
Fildani, A. and Hessler, A.M., 2005, Stratigraphic record across a retroarc basin inversion: Rocas Verdes – Magallanes Basin, Patagonian Andes: Geological Society of America Bulletin, v. 117, p. 1596-1614.
Fildani, A., Romans, B.W., Fosdick, J.C., Crane, W.H., and Hubbard, S.M., 2008, Orogenesis of the Patagonian Andes as reflected by basin evolution in southernmost South America, in Spencer, J.E., and Titley, S.R., eds., Circum-Pacific Tectonics, Geologic Evolution, and Ore Deposits: Tucson, Arizona, Arizona Geological Society, Digest 22, p. xx-xxx.
Harambour, S., 2002, Deep-seated thrust faults in the frontal part of the Magallanes fold and thrust belt, Ultima Esperanza, Chile. XV Congreso Geológico Argentino (El Calafate) Acts (CD-ROM) comunicacion n. 383.
Hervé, F., Pankhurst, R.J., Fanning, C.M., Calderón, M., and Yaxley, G.M., 2007, The South Patagonian batholith: 150 my of granite magmatism on a plate margin: Lithos, doi: 10.1016/j.lithos.2007.01.007
Hubbard, S.M., Romans, B.W. and Graham, S.A., in press, Deep-water foreland basin deposits of the Cerro Toro Formation, Magallanes basin, Chile: architectural elements of a sinuous basin axial channel belt: Sedimentology.
Katz, H. R., 1963, Revision of Cretaceous stratigraphy in Patagonian cordillera of Ultima Esperanza, Magallanes Province, Chile: Bulletin of the American Association of Petroleum Geologists, v. 47, n. 3, p. 506-524.
Malumián, N., Panza, J.L., Parisi, C., Naňez, C., Caramés, A., Torre, A., 2001, Hoja Geológica 5172-III, Yacimiento Río Turbio (1:250,000). Servicio Geologico Minero Argentino, Boletin, n. 247, 180 p., Buenos Aires.
Mpodozis, C., Alvarez, P., Elgueta, S., Mella, P., Hervé, F., Fanning, M., 2007, Revised Cretaceous stratigraphy of the Magallanes foreland basin at Seno Skyring: Regional implications of new SHRIMP age data on detrital zircon populations: Geosur 2007 International Congress on the Geology and Geophysics of the Southern Hemisphere, Santiago, Chile.
Radic, J.P., Mpodozis, C., Alvarez, P., 2007, Tectonic evolution of the Magallanes Fold and Thrust Belt between Seno Skyring and Peninsula Brunswick, southernmost Andes: Geosur 2007 International Congress on the Geology and Geophysics of the Southern Hemisphere, Santiago, Chile.
Ramos, V.A., 1989, Andean Foothills structures in northern Magallanes Basin, Argentina. AAPG Bulletin, v. 73, n. 7, p. 887–903.
Ramos, V.A. 2005, Seismic ridge subduction and topography: Foreland deformation in the Patagonian Andes: Tectonophysics, v. 399, p. 73-86.
Romans, B.W., 2008, Controls on distribution, timing, and evolution of turbidite systems in tectonically active settings: Upper Cretaceous Tres Pasos Formation, southern Chile, and Holocene Santa Monica Basin, offshore California: [Ph.D. thesis]: Stanford University.
Romans, B.W., Hubbard, S.M., and Graham, S.A., in press, Stratigraphic evolution of an outcropping continental slope system, Tres Pasos Formation at Cerro Divisadero, Chile: Sedimentology.
Shultz, M.R., Fildani, A., Cope, T.D., and Graham, S.A., 2005, Deposition and stratigraphic architecture of an outcropping ancient slope system: Tres Pasos Formation, Magallanes Basin, southern Chile, in Hodgson, D.M., and Flint, S.S., eds., Submarine Slope Systems: Processes and Products: Geological Society of London, Special Publication 244, p. 27-50.
Thomson, S.N., Hervé, F., and Stockhert, B., 2001, The Mesozoic-Cenozoic denudation history of the Patagonian Andes (southern Chile) and its correlation to different subduction processes: Tectonics, v. 20, p. 693-711.
Wilson, T.J., 1991, Transition from back-arc to foreland basin development in southernmost Andes: Stratigraphic record from the Ultima Esperanza District, Chile: Geological Society of America Bulletin, v. 103, p. 98-111.
Winslow, M.A., 1980, Mesozoic and Cenozoic tectonics of the fold and thrust belt in South America and stratigraphic history of the cordilleran margin of the Magallanes basin [Ph.D thesis]: New York, Columbia University.
Winn, R.D., Jr., and Dott, R.H., Jr., 1979, Deep-water fan-channel conglomerates of late Cretaceous age, southern Chile: Sedimentology, v. 26, no. 2, p. 203-228.
Wobus C.W., Hodges K.V., Whipple K.X., 2003 Has focused denudation sustained active thrusting at the Himalayan topographic front?: Geology v. 31, p. 861–64.

In Garver, J.I., and Montario, M.J. (eds.), Proceedings from the 11th International Conference on thermochronometry, Anchorage Alaska, Sept. 2008. 83
OROGENIC STRAIN RATE FROM THERMOCHRONOLOGY Foster, D.A.1 & Gray, D.R.2 1Department of Geological Sciences, University of Florida, Gainesville, Florida 32611, USA; [email protected] 2School of Earth Sciences, University of Melbourne, Melbourne 3010, Victoria, Australia
Average orogenic strain rates may be calculated when it is possible to date progressive mineral growth during deformation and quantify finite strain. Deformation of accretionary-style thrust sheets in the western Lachlan Orogen occurred by chevron folding and faulting over an eastward propagating décollement. Based on 40Ar/39Ar dates of white micas, which grew below the closure temperature, this deformation started ca. 457 Ma in the west and ended ca. 378 Ma in the east, with apparent “pulses” of deformation ca. 440, 420 and 388 Ma. The 40Ar/39Ar data from thrust sheets in the Bendigo structural zone show that deformation progressed from early buckle folding, which started at 457–455 Ma, through to chevron fold lock-up and thrusting at 441–439 Ma (see figure). Based on retrodeformation, the total average strain for this thrust sheet is −0.67, such that the
bulk shortening across the thrust sheet is 67%. This amount of strain accumulated over a duration of ~16 m.y. gives a minimum strain rate of 1.3 X 10⁻¹⁵ s−1 and a maximum strain rate of 5.0 X 10⁻¹⁵ s−1, based on fan thickness considerations. The total shortening is between ~310 km and ~800 km, which gives a décollement displacement rate between ~19 mm yr−1 (minimum) and ~50 mm yr−1 (maximum). If deformation occurred in pulses ca. 457–455 and ca. 441–439 Ma, then the calculated strain rate would be on the order of 1 X 10⁻¹⁴ s−1. These strain rates are similar to convergence rates in western Pacific backarc basins and shortening rates in accretionary prisms and turbidite-dominated thrust systems as in Taiwan.
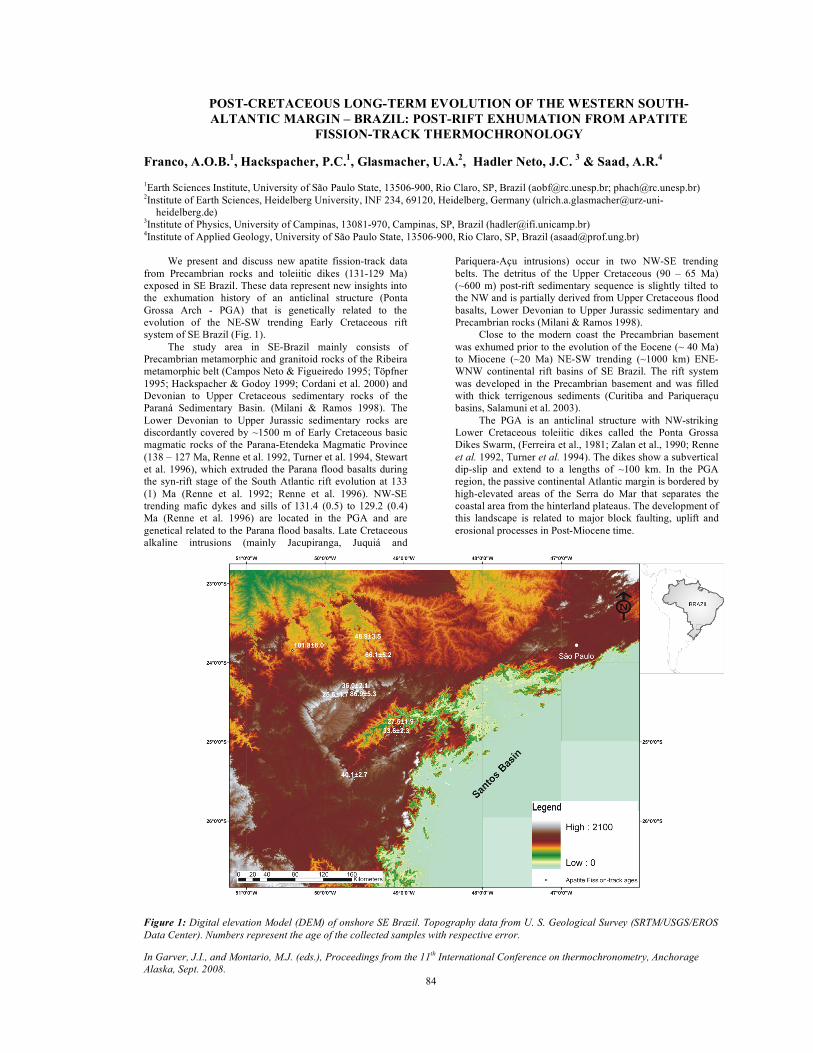
In Garver, J.I., and Montario, M.J. (eds.), Proceedings from the 11th International Conference on thermochronometry, Anchorage Alaska, Sept. 2008. 84
POST-CRETACEOUS LONG-TERM EVOLUTION OF THE WESTERN SOUTH-ALTANTIC MARGIN – BRAZIL: POST-RIFT EXHUMATION FROM APATITE
FISSION-TRACK THERMOCHRONOLOGY Franco, A.O.B.1, Hackspacher, P.C.1, Glasmacher, U.A.2, Hadler Neto, J.C. 3 & Saad, A.R.4 1Earth Sciences Institute, University of São Paulo State, 13506-900, Rio Claro, SP, Brazil ([email protected]; [email protected]) 2Institute of Earth Sciences, Heidelberg University, INF 234, 69120, Heidelberg, Germany (ulrich.a.glasmacher@urz-uni-
heidelberg.de) 3Institute of Physics, University of Campinas, 13081-970, Campinas, SP, Brazil ([email protected]) 4Institute of Applied Geology, University of São Paulo State, 13506-900, Rio Claro, SP, Brazil ([email protected])
We present and discuss new apatite fission-track data
from Precambrian rocks and toleiitic dikes (131-129 Ma) exposed in SE Brazil. These data represent new insights into the exhumation history of an anticlinal structure (Ponta Grossa Arch - PGA) that is genetically related to the evolution of the NE-SW trending Early Cretaceous rift system of SE Brazil (Fig. 1).
The study area in SE-Brazil mainly consists of Precambrian metamorphic and granitoid rocks of the Ribeira metamorphic belt (Campos Neto & Figueiredo 1995; Töpfner 1995; Hackspacher & Godoy 1999; Cordani et al. 2000) and Devonian to Upper Cretaceous sedimentary rocks of the Paraná Sedimentary Basin. (Milani & Ramos 1998). The Lower Devonian to Upper Jurassic sedimentary rocks are discordantly covered by ~1500 m of Early Cretaceous basic magmatic rocks of the Parana-Etendeka Magmatic Province (138 – 127 Ma, Renne et al. 1992, Turner et al. 1994, Stewart et al. 1996), which extruded the Parana flood basalts during the syn-rift stage of the South Atlantic rift evolution at 133 (1) Ma (Renne et al. 1992; Renne et al. 1996). NW-SE trending mafic dykes and sills of 131.4 (0.5) to 129.2 (0.4) Ma (Renne et al. 1996) are located in the PGA and are genetical related to the Parana flood basalts. Late Cretaceous alkaline intrusions (mainly Jacupiranga, Juquiá and
Pariquera-Açu intrusions) occur in two NW-SE trending belts. The detritus of the Upper Cretaceous (90 – 65 Ma) (~600 m) post-rift sedimentary sequence is slightly tilted to the NW and is partially derived from Upper Cretaceous flood basalts, Lower Devonian to Upper Jurassic sedimentary and Precambrian rocks (Milani & Ramos 1998).
Close to the modern coast the Precambrian basement was exhumed prior to the evolution of the Eocene (~ 40 Ma) to Miocene (~20 Ma) NE-SW trending (~1000 km) ENE-WNW continental rift basins of SE Brazil. The rift system was developed in the Precambrian basement and was filled with thick terrigenous sediments (Curitiba and Pariqueraçu basins, Salamuni et al. 2003).
The PGA is an anticlinal structure with NW-striking Lower Cretaceous toleiitic dikes called the Ponta Grossa Dikes Swarm, (Ferreira et al., 1981; Zalan et al., 1990; Renne et al. 1992, Turner et al. 1994). The dikes show a subvertical dip-slip and extend to a lengths of ~100 km. In the PGA region, the passive continental Atlantic margin is bordered by high-elevated areas of the Serra do Mar that separates the coastal area from the hinterland plateaus. The development of this landscape is related to major block faulting, uplift and erosional processes in Post-Miocene time.
Figure 1: Digital elevation Model (DEM) of onshore SE Brazil. Topography data from U. S. Geological Survey (SRTM/USGS/EROS Data Center). Numbers represent the age of the collected samples with respective error.

In Garver, J.I., and Montario, M.J. (eds.), Proceedings from the 11th International Conference on thermochronometry, Anchorage Alaska, Sept. 2008. 85
Previous Apatite Fission-Track (AFT) studies in the
eastern part of PGA done by Vignol-Lelarge et al. (1994) showed significant and rapid uplift at around 86 (4) Ma with 2.5 km of denudation in the Serra do Mar coastal region. Gallagher et al (1994), in a NW-SE transect parallel to PGA, revealed AFT ages spread between 65.1 (4) and 154.4 (15) Ma. These ages are interpreted as differential denudation that occurred across the PGA after (and maybe prior) eruption of the basalt. In the south of the PGA, Gallagher et al. (1995) interpreted the ages of samples collected on the low coastal plain as having been exhumed over the last 100 Ma with an erosion rate lower than 100 m/Ma, while the basalt rocks in the interior escarpments reveal ages of ~ 130 Ma.
In order to reconstruct the post-Cretaceous landscape evolution of the PGA, AFT analysis was carried out on samples collected along a NW-SE transect. The Precambrian basement, the Devonian to Jurassic sedimentary series and the toleiitic dikes of Lower Cretaceous ages were sampled. The low-temperature thermochronology based on apatite fission-track data spreads ages between 101.8 (8.0) Ma and 25.5 (1.7) Ma in the PGA with complex long-term exhumation history since Late Cretaceous time.
The ages around 90 Ma might represent the early exhumation of the Atlantic continental margin. Dynamic topography evolution at this time could be related to the drifting of the South America Plate over a mantle anomaly, the Trindade hot spot. The Late Cretaceous exhumation was accompanied by intense alkaline magmatism in onshore portions (e.g. Poços de Caldas – Cabo Frio lineament) and onshore basaltic magmatism (in Santos and Campos basins). The resulting differentiated topography was the main source-area for the Late Cretaceous sedimentary sequence of the Santos, Campos, and Paraná basin (Zalán & Oliveira, 2005). The younger ages are related to the extensional setting with magmatic activity and fluid movement in the Paleocene (~ 60 Ma) to Miocene (~ 20 Ma). In addition, some of the data point to Post-Miocene exhumation of the Serra do Mar.
Acknowledgments The authors are grateful for financial support from DAAD and FAPESP (00/3960-5; 05/58701-7).
References Campos Neto, M.C. & Figueiredo, M.C.H. 1995. The Rio Doce
orogeny, southeastern Brazil. Journal of South American Earth Sciences. 8(2):143-162.
Cordani, U.G.; Sato,K.; Teixeira,W.; Tassinari,C.C.G.; Basei,M.A.S. 2000. Crustal Evolution of the South American platform. In: Cordani, U.; Milani, E. J.; Thomaz Filho, A.; Campos, D. A. (ed.). Tectonic Evolution of South AmericaPlatform. Rio de Janeiro, RJ, pages 19-40.
Ferreira, F, J, F.; Moraes, R. A. V.; Ferrari, M. P.; Vianna, R. B. 1981. Contribuição ao estudo do Alinhamento Estrutural de Guapiara. In: Simpósio Regional de Geologia, Curitiba, Anais, 3, 226 – 240.
Gallagher, K.; Hawkesworth, C.J; Mantovani, M.S.M. 1994. The denudation history of the onshore continental margin of SE Brazil inferred from apatite fission track data. Journal of Geophysical Research, vol. 99 (B9): 18, 117- 18, 145.
Gallagher, K; Hawkesworth, C. J.; Mantovani, M. S. M. 1995. Denudation, fission track analysis and the long-term evolution of passive margin topography: application to the southeast Brazilian margin. Journal of South American Earth Sciences, 8 (1): 65-77.
Milani, E. J. & Ramos, V. 1998. Orogenias Pós-Paleozóicas no Domínio Sul-Ocidental do Gondwana e os Ciclos de Subsidência da Bacia do Paraná. Revista Brasileira de Geociências. 28 (4): 473 – 484.
Renne, P. R.; Ernesto, M.; Pacca, I. I. G. Coe, R. S.; Glen, J. M.; Prévot, M.; Perrin, M. 1992. The age of Paraná flood volcanism, rifting of Gondwanaland, and the Jurassic -Cretaceous boundary. Science, 258: 975 - 979.
Renne, P. R.; Deckart, K.; Ernesto, M; Féraud, G; Piccirillo, E. M. 1996. Age of Ponta Grossa dike swarm (Brazil), and implications to Parana flood volcanism. Earth and Planetary Science Letters, 144: 199-211.
Salamuni, E. ;Ebert, H. D.; Borges, M. S.; Hasui, Y.; Costa, J. B. S.; Salamuni, R. 2003. Tectonics and sedimentation in the Curitiba Basin, south of Brazil. Journal of South America Earth Science, 15: 901-910.
Stewart, K.; Turner, S.; Kelley, S.; Hawkesworth, C.; Kirstein, L.; Mantovani, M. 1996. 3D, 40Ar-39Ar geochronology in the Paraná continental flood basalt province. Earth and Planetary Science Letters, 143: 95-109.
Töpfner, C. 1996. Brasiliano-Granitoide in den Bundesstaaten São Paulo und Minas Geraiseine vergleichende Studie. Münchner Geologische Hefte A17:258 p.
Turner, S.; Regelous, M.; Kelley, S.; Hawkesworth, S.; Mantovani, M. M. S. 1994. Magmatism and continental break-up in the South Atlantic: high precision Ar/Ar geochronology. Earth and Planetary Science Letters, 121 (3-4): 333-348.
Vignol - Lelarge, M. L. M.; Soliani Jr., E.; Poupeau, G. 1994. Datação pelos traços de fissão do Domínio Meridional da Serra do Mar (Arco de Ponta Grossa - Brasil). In: SBG - Congresso Brasileiro de Geologia, Balneário Camboriú, Anais, 38, 1: 379 – 380.
Zalán, P.V. & Oliveira, J. A. B. 2005. Origem e evolução estrutural do Sistema de Riftes Cenozóicos do Sudeste do Brasil. Boletim de Geociências da Petrobrás, 13 (2): 269-300.
Zalán, P. V., Wolff, S., Conceição, J. C., Marques, A., Astolfi, M. A. M., Vieira, I. S., Appi, V. T. 1990. Bacia do Paraná. In: Origem e Evolução de Bacias Sedimentares. PETROBRAS, Rio de Janeiro: 135 - 164.

In Garver, J.I., and Montario, M.J. (eds.), Proceedings from the 11th International Conference on thermochronometry, Anchorage Alaska, Sept. 2008. 86
TRANS-DIMENSIONAL THERMAL HISTORY MODELLING Gallagher, K.1
1Géosciences Rennes, Université de Rennes 1, Campus de Beaulieu, Rennes 35042, France, [email protected]
Quantifying a thermal history from thermochronological data can be achieved with either a forward or inverse modelling approach. In either case, we are interested in finding thermal histories that can reproduce the observed data adequately, but also in understanding what features of the thermal history are well resolved or not. In most cases we will tend to improve the fit to the data as we introduce more complexity in the thermal history. Generally, we will reach a point where adding even more complexity makes little or no difference to the data fit. Therefore, we might characterise a good model as one that achieves a balance between fitting the data and not being too complex.
In trying to find such models, we need to specify the mathematical form of the thermal history model. This is generally done in terms of a discrete number of time-temperature points (or nodes), and some form of interpolation (usually linear) between these nodes. In terms of the complexity of the thermal history, this will be partly reflected in the number of time temperature points (in as much as a discrete representation of a continuous function is appropriate), as well as how much variability is justified in the thermal history, i.e. the model resolution. In some cases, we have prior geological information (such as stratigraphic age for a sample, or a more or less complete burial history for a well) that can be incorporated into the thermal history. In other situations, we may just have a surface sample from a basement terrain with effectively no prior information on the thermal history. If we deal with multiple samples, from a borehole, a vertical profile or a suite of samples distributed over a large region, it may be that each sample has a different amount of such prior information available, and also both the data quality and the amount of useful thermal history information may vary between samples.
Here, we present a general methodology to allow us to infer thermal histories for multiple samples subject to the philosophical constraints mentioned above. In discussing the method, we focus on single samples and vertical profiles, but the method can be applied to 3D sample distributions. The core of the approach involves a trans-dimensional sampling method, known as reversible jump Markov chain Monte Carlo (rjMCMC). The approach is formulated in a probabilistic (i.e. Bayesian) framework and naturally favours simpler models over more complex ones.
The basic implementation is superficially similar to, but has many advantages over, previous sampling-based methods used in thermal history modelling. Thus, we need to specify range of possible values for time, temperature, temperature gradients, and the number of time-temperature points (this is the prior information) and then iterate over many thermal history models, drawn from these ranges, proposing a new model at each iteration. The trans-dimensional aspect arises because we do not specify in advance how many time-temperature points we use. Rather we sample different numbers of points, and allow the algorithm to assess each model probabilistically. The key aspects in MCMC are: (i) that the proposed model is conditional on the current model; and (ii) how we decide whether to accept a proposed sample or not.
The proposed model is generated from the current model by choosing one of a variety of possible modifications. These are perturbing the temperature or time for a given time-temperature point, changing the value of the temperature gradient (if dealing with a vertical profile), or adding or deleting a time-temperature point in the current thermal history. These last two, known as birth and death moves, respectively, allow us to address the problem of the number of time-temperature points, and so the complexity of the thermal history.
The acceptance criterion incorporates a measure of the data fit (the likelihood), the prior information we have available on the thermal history (which can be very specific or not), and additional terms relating to how we propose a model from the current model. The design of an acceptance criterion has a sound theoretical basis, and provided this is followed, the distribution of the accepted samples represents a complete probability distribution on the thermal history. This distribution then can be used to make inference about the full range of possible thermal histories, as well as allowing us to select single models (e.g. the maximum likelihood, maximum a posterior, or expected models), as well as readily provided direct estimates of uncertainties (e.g. 95% credible intervals).
We present this new methodology with examples from both synthetic and real data, focussing on apatite fission track applications.
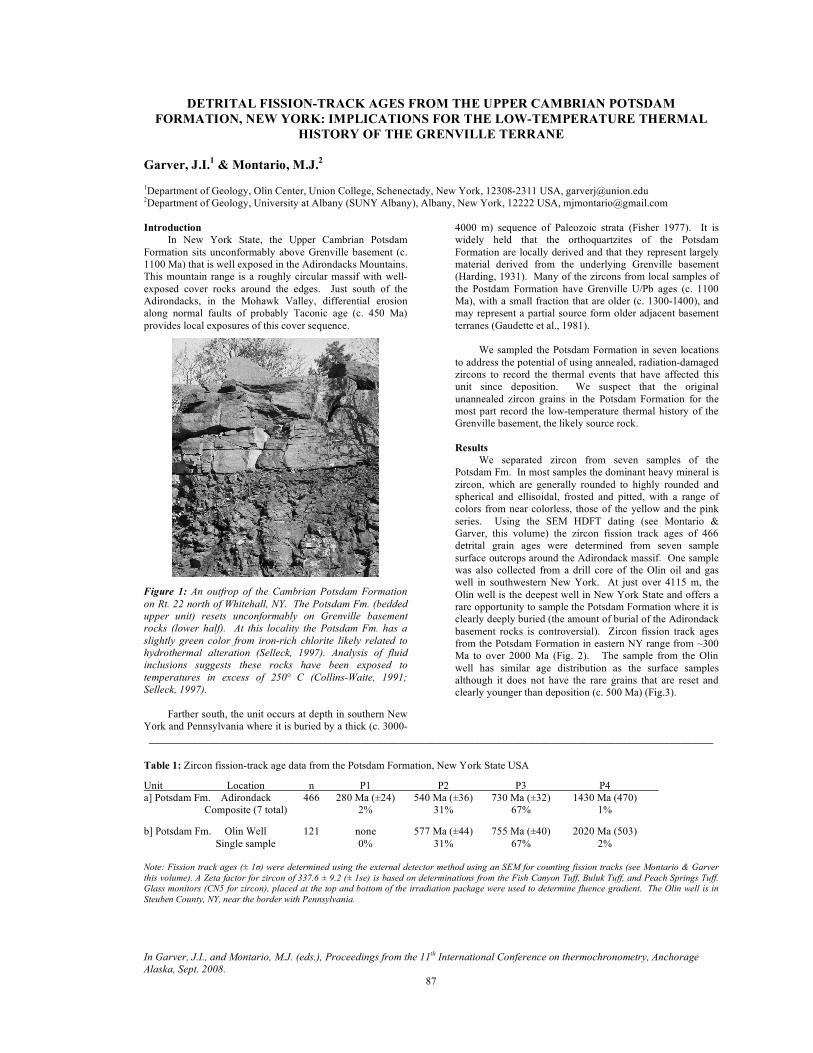
In Garver, J.I., and Montario, M.J. (eds.), Proceedings from the 11th International Conference on thermochronometry, Anchorage Alaska, Sept. 2008. 87
DETRITAL FISSION-TRACK AGES FROM THE UPPER CAMBRIAN POTSDAM FORMATION, NEW YORK: IMPLICATIONS FOR THE LOW-TEMPERATURE THERMAL
HISTORY OF THE GRENVILLE TERRANE
Garver, J.I.1 & Montario, M.J.2
1Department of Geology, Olin Center, Union College, Schenectady, New York, 12308-2311 USA, [email protected] 2Department of Geology, University at Albany (SUNY Albany), Albany, New York, 12222 USA, [email protected] Introduction
In New York State, the Upper Cambrian Potsdam Formation sits unconformably above Grenville basement (c. 1100 Ma) that is well exposed in the Adirondacks Mountains. This mountain range is a roughly circular massif with well-exposed cover rocks around the edges. Just south of the Adirondacks, in the Mohawk Valley, differential erosion along normal faults of probably Taconic age (c. 450 Ma) provides local exposures of this cover sequence.
Figure 1: An outfrop of the Cambrian Potsdam Formation on Rt. 22 north of Whitehall, NY. The Potsdam Fm. (bedded upper unit) resets unconformably on Grenville basement rocks (lower half). At this locality the Potsdam Fm. has a slightly green color from iron-rich chlorite likely related to hydrothermal alteration (Selleck, 1997). Analysis of fluid inclusions suggests these rocks have been exposed to temperatures in excess of 250° C (Collins-Waite, 1991; Selleck, 1997).
Farther south, the unit occurs at depth in southern New York and Pennsylvania where it is buried by a thick (c. 3000-
4000 m) sequence of Paleozoic strata (Fisher 1977). It is widely held that the orthoquartzites of the Potsdam Formation are locally derived and that they represent largely material derived from the underlying Grenville basement (Harding, 1931). Many of the zircons from local samples of the Postdam Formation have Grenville U/Pb ages (c. 1100 Ma), with a small fraction that are older (c. 1300-1400), and may represent a partial source form older adjacent basement terranes (Gaudette et al., 1981).
We sampled the Potsdam Formation in seven locations to address the potential of using annealed, radiation-damaged zircons to record the thermal events that have affected this unit since deposition. We suspect that the original unannealed zircon grains in the Potsdam Formation for the most part record the low-temperature thermal history of the Grenville basement, the likely source rock. Results
We separated zircon from seven samples of the Potsdam Fm. In most samples the dominant heavy mineral is zircon, which are generally rounded to highly rounded and spherical and ellisoidal, frosted and pitted, with a range of colors from near colorless, those of the yellow and the pink series. Using the SEM HDFT dating (see Montario & Garver, this volume) the zircon fission track ages of 466 detrital grain ages were determined from seven sample surface outcrops around the Adirondack massif. One sample was also collected from a drill core of the Olin oil and gas well in southwestern New York. At just over 4115 m, the Olin well is the deepest well in New York State and offers a rare opportunity to sample the Potsdam Formation where it is clearly deeply buried (the amount of burial of the Adirondack basement rocks is controversial). Zircon fission track ages from the Potsdam Formation in eastern NY range from ~300 Ma to over 2000 Ma (Fig. 2). The sample from the Olin well has similar age distribution as the surface samples although it does not have the rare grains that are reset and clearly younger than deposition (c. 500 Ma) (Fig.3).
________________________________________________________________________________________________________ Table 1: Zircon fission-track age data from the Potsdam Formation, New York State USA
Unit Location n P1 P2 P3 P4 a] Potsdam Fm. Adirondack 466 280 Ma (±24) 540 Ma (±36) 730 Ma (±32) 1430 Ma (470) Composite (7 total) 2% 31% 67% 1% b] Potsdam Fm. Olin Well 121 none 577 Ma (±44) 755 Ma (±40) 2020 Ma (503) Single sample 0% 31% 67% 2%
Note: Fission track ages (± 1σ) were determined using the external detector method using an SEM for counting fission tracks (see Montario & Garver this volume). A Zeta factor for zircon of 337.6 ± 9.2 (± 1se) is based on determinations from the Fish Canyon Tuff, Buluk Tuff, and Peach Springs Tuff. Glass monitors (CN5 for zircon), placed at the top and bottom of the irradiation package were used to determine fluence gradient. The Olin well is in Steuben County, NY, near the border with Pennsylvania.

In Garver, J.I., and Montario, M.J. (eds.), Proceedings from the 11th International Conference on thermochronometry, Anchorage Alaska, Sept. 2008. 88
Figure 2: Statistical analysis of the FT ages for zircon of seven samples from the Potsdam Formation that yields peak ages at 280 Ma, 540 Ma, 730 Ma and 1400 (see Table 1). The 280 Ma and 1400 Ma peaks are intriguing, but are made up of very small percentages of the grain population. Discussion
One of the most important observations from these data is that almost all of the grains appear to be older than the age of deposition, and therefore it is likely that they are unreset and reflect the cooling ages of the source rock. The bulk of the grains cooled at c. 550 Ma and c. 740 Ma, and we suggest that to a first order this reflects cooling of the Grenville basement source rock. The composite sample has a young population (only 2%), at c. 280 Ma, which may suggest local resetting in the Carboniferous, which coincides with unroofing following peak Alleghanian burial at 300 Ma (Winsch et al., 2003)
Sediment burial
A key question that has driven this research is the timing of thermal maturation of these strata, which a maximum burial in the late Paleozoic by a minimum of 4 km of strata, and perhaps by as much as 11 km. The Potsdam Formation has overlying strata deposited by three significant pulses of sedimentation in this part of the Appalachians. These pulses are associated with the Taconic (~450 Ma), Acadian (~360 Ma) and Alleghanian (~300 Ma) orogenies. The Taconic Orogeny terminated the passive margin that resulted in the deposition of the Potsdam Formation and overlying Beekmantown Group. Associated with the Taconic Orogeny is the deposition of a 0.5 to 2 km of clastic strata derived from the orogenic belt (see Rickard, 1973; Fisher, 1977). The Devonian Catskill Delta is the foreland basin fill of the Acadian orogeny, involved deposition of a ~1.5-3.0 km-thick clastic wedge (Rickard 1975).
The thickness of strata deposited in NY during the
Alleghanian Orogeny is controversial because none is present, so original thicknesses need to be estimate using indirect means. Estimates range from a thin north-tapering wedge to a thick regionally extensive blanket. Collectively estimates range between 0 to 6 km, and it was likely thicker in south (cf. Meckel, 1970; Johnsson, 1985; Sarwar & Friedman, 1995). Totaling these estimates, the sediment overburden in east central New York (over the Adirondacks) could have been anywhere from 4-11 km immediately following the Alleghanian Orogeny. This means enough sediment may have been present to provide the burial needed to reset the zircon fission track system in most places, given typical geothermal gradients (20-30° C/km). The fact that
most grains appear to be unreset (> 500 Ma) would favor reconstruction of a thin cover (c. 4 km) over the Adirondacks. The lack of reset grains in the Olin well (already at nearly 4 km depth), suggest that cover rocks in southern NY were probably not appreciably thicker in the latest Paleozoic. Hydrothermal Fluids
Hydrothermal fluids have also played an important part in the thermal history of this area, and a significant fluid-rich event is thought to have driven reservoir formation, which is the focus of considerable hydrocarbon exploration in the region (Smith & Nyahay, 2004, Lim et al., 2005). The timing of hydrothermal fluid flow is inferred to coincide with the fault movement, which is largely thought to be Taconic in age (c. 450 Ma – Bradley & Kidd, 1991; Smith 2003; Lim et al., 2005; Smith, 2006). Smith & Nyahay (2004) show that fluids appear to be localized around normal or wrench faults in a locality in the Mohawk Valley. Seismic data show that most of the faults with dolomitization die out as they pass upwards into the mid Ordovician Trenton and Utica Formations, which suggests they were not reactivated during the later Alleghanian or Acadian orogeny (Smith, 2006). Geochemical analysis of fluid inclusions, stable isotopes, and trace elements of matrix and saddle dolomite samples from outcrops in New York formed show these fluids were ~110-170oC saline, Mg and Fe rich brines, probably of subsurface origin (Slater; 2007; Smith 2006). Our data cannot rule confirm or refute a Taconic age for these fluids. These FT grain ages do not show widespread post-depositional resetting, which would be predicted given peak temperatures (locally up to and exceeding 250°C) indicated by fluid inclusions and CAI. As such, we suggest that the widely recognized fluid-rich event in this area was transient, local, and short-lived. Conclusions
It is clear that none of the zircons dated from the Potsdam Formation have had significant resetting of fission tracks. It is intriguing that these grain ages appear to record the thermal evolution of the Grenville terrane. The two pre-depositional populations may give insight into the post-orogenic thermal history of the Grenville terrane. It is possible that the c. 740 Ma corresponds to low-temperature cooling following orogenesis and this age is essentially predicted from extrapolation of higher temperature themochronometers (Heitzler and Harrison, 1998). The c. 550 Ma population likely represents a thermal event related to intrusion and rifting related to the opening of the Iapetus Ocean (Walsh and Aleinikoff, 1999).
These are the oldest detrital ZFT ages reported in the
literature (see Bernet and Garver, 2005). The apparent success of the emerging SEM HDFT dating technique suggests that we can begin to investigate the low-temperature thermal evolution of Precambrain terranes elsewhere. References Bernet, M., and Garver, J.I., 2005, Chapter 8: Fission-track analysis of
Detrital zircon, In P.W. Reiners, and T. A. Ehlers, (eds.), Low-Temperature thermochronology: Techniques, Interpretations, and Applications, Reviews in Mineralogy and Geochemistry Series, v. 58, p. 205-237.
Bird, J.M. and Dewey, J.F., 1970, Lithosphere plate-continental margin tectonics and the evolution of the Appalachian orogen: Bull. Geol. Soc. Amer., v. 81, pp. 1031-1060.
Bradley, D.C., and Kidd, W.S.F, 1991. Flexural extension in collisional foredeeps. Geol. Soc. Amer. Bull., v. 103, pp. 1416-1438.

In Garver, J.I., and Montario, M.J. (eds.), Proceedings from the 11th International Conference on thermochronometry, Anchorage Alaska, Sept. 2008. 89
Fisher, D.W., 1977, Correlation of the Hadrynian, Cambrian, and Ordovician Rocks in New York State: New York State Museum Map and Chart Series No. 25.
Friedman, G. M., and Sanders, J. E. 1982. Time-temperature-burial significance of Devonian anthracite implies former great (?6.5 km) depth of burial of Catskill Mountains, New York. Geology 10:93-96.
Garver, J.I., Reiners, P.R., Walker, L.J., Ramage, J.M., Perry, S.E., 2005, Implications for timing of Andean uplift based on thermal resetting of radiation-damaged zircon in the Cordillera Huayhuash, northern Perú, Journal of Geology, v. 113, n. 2, p. 117-138.
Gaudette, H.E., Vitrac-Michard, A., and Allègre, C.J., 1981, North American Precambrian history recorded in a single sample: high resolution U-Pb systematics of the Potsdam Sandstone detrital zircons, New York State. Earth and Planetary Science Letters, v. 54, p. 248-260.
Harding, W.D., 1931 The Relations of the Grenville sediments and the Potsdam Sandstone in Eastern Ontario. Journal of the Mineralogical Society of America, v. 16, no. 10, pp 430-436
Heitzler, M. and Harrison, M., 1998. The Thermal history of New York basement determined from the 40Ar/39Ar K-feldspar studies. Jour. Geophy. Research, v. 103, n. B12, p. 29795-29814.
Karner, G. D., Steckler, M. S., Omar, G. I., Kohn, B., 1990, Fission-track results from the Newark Basin; implications for hydrothermal events: AGU 1990 fall meeting, Eos, Transactions, American Geophysical Union, v. 71 (43), p. 1606
Kasuya, M. and Naeser, C. 1988. The effect of α-damage on fission track annealing in zircon. Nuclear Tracks and Radiation Measurements, v. 14, p.477-480.
Lim, C., Kidd, W.S.F., Howe, Stephen S., 2005, Late shortening and extensional structures and veins in the western margin of the Taconic Orogen (New York to Vermont): Journal of Geology, v. 113 (4), p. 419-438.
Rickard, L.V., 1973, Stratigraphy and structure of subsurface Cambrian and Ordovician carbonates of New York: New York State Mus. and Sci. Serv., Map and Chart Ser. 18, pp. 57
Rickard, L.V., 1975, Correlation of Silurian and Devonian Rocks in New York State: New York State Museum Map and Chart Series No. 24.
Riley, B.C.D., and Garver, J.I., 2003, Low-temperatures thermal response of radiation damaged detrital zircon: Provenance and post depositional thermal history of Laramide synorogenic sediments, SE Arizona, Geological Society of America Abstracts with Programs, v. 35, n.5, p. 4.
Riley, B.C.D. 2004. Laramide exhumation and heating in southeastern Arizona: Low-temperature thermal history and implications for zircon fission-track systematics. University of Texas at Austin, Austin, Texas, Ph.D. dissertation. 222 pp.
Sarwar G., and Freidman, G.M., 1995, Post-Devonian sediment cover over New York State: Evidence from fluid inclusion, organic maturation, clay diagenesis, and stable isotope studies. Lecture notes in Earth Sciences, 58, Springer Veralg, Berlin, 109 p.
Slater, B. E., 2007. Outcrop Analog for Lower Paleozoic Hydrothermal Dolomite Reservoirs, Mohawk Valley, NY. (Master's, University of Albany, Albany, NY, United States. 104 pp.,
Smith, L.B., Lugert, C.M., Nyahay, R.E., 2003, Integrated characterization of hydrothermal dolomite reservoirs in Trenton-Black River carbonates of New York: AAPG Annual meeting Program, v. 12, p. A160
Smith, L.B., Nyahay, R., 2004 Fault-controlled hydrothermal dolomite reservoirs in Ordovician Trenton Black River carbonates of New York: Abstracts with Programs - Geological Society of America, v. 36 (2), p. 118
Smith, L.B., Jr. 2006. Origin and reservoir characteristics of Upper Ordovician Trenton-Black River hydrothermal dolomite reservoirs in New York. AAPG Bulletin, v. 90, n. 11, p. 1691-1781.
Walsh G.J, & Aleinikoff, J.N., 1999. U-Pb zircon age of metafelsite from the Phinney Hollow Formation: Implications for the development of the Vermont Appalachians. American Journal of Science, v. 299, pp. 157-170
Winsch, R.P., Kunk, M.J., Boyd, J.L., and Aleinikoff, J.N., 2003. P-T-t paths and Differential Alleghanian Loading and Uplift of the Bronson Hill Terrane, south central New England. American Journal of Science, v. 303, p. 410-446.

In Garver, J.I., and Montario, M.J. (eds.), Proceedings from the 11th International Conference on thermochronometry, Anchorage Alaska, Sept. 2008. 90
ALPHA DAMAGE ANNEALING EFFECTS ON APATITE (U-TH)/HE THERMOCHRONOLOGY
Gautheron, C.1, Tassan-Got, L.2, Barbarand, J.3 & Pagel, M.3 1UMR Interactions et Dynamique des Environements de Surface – CNRS-UPS 8148, Université Paris Sud, 91405 Orsay, France,
[email protected] 2Institut de Physique Nucléaire, CNRS/IN2P3, Université Paris Sud, 91405 Orsay, France, [email protected] 3UMR Interactions et Dynamique des Environnements de Surface – CNRS-UPS 8148, Université Paris Sud, 91405 Orsay, France,
[email protected], [email protected]
Apatite (U-Th)/He thermochronology has been
intensively applied to constrain the crustal rock thermal history in the 40-70°C range. Recent data on He diffusion challenge the temperature sensitivity of this method: alpha damages have been proposed as modifying the He diffusion properties through time (Green et al., 2006; Shuster et al., 2006). A trapping model based on the [4He] content has been developed to account for the irradiation damage and its relation with He kinetics (Farley, 2000; Shuster et al., 2006) and it has been shown that this can explain partially the important variation of diffusion coefficients and closure temperatures (Flowers et al., 2007). However, the fading of irradiation damage through time with varying temperatures has not been considered and quantified. This effect can be critical when samples having been exhumed several times are studied. Our approach combines a regional study and alpha production/ejection/diffusion recovery models. We have chosen the Massif Central basement (France) where the relationship between apatite fission-track data and (U-Th)/He data cannot be explained considering present-day models.
The southeastern part of the French Massif Central basement has been considered because 1) the cooling data of the rocks show that they passed slowly across the 110-60°C region, (Barbarand et al., 2001) and 2) rocks have been exhumed at the end of the Variscan orogeny and then buried again by Mesozoic sedimentary deposits. Finally, 3) the area is characterized by three different blocks, which have undergone different thermal histories since the Trias, ending up with a slow cooled exhumation history. The blocks were not buried at similar depth, ranging with a maximum temperature from 60°C to more than 120°C (Barbarand et al., 2001; Séranne et al., 2002).
The mean (U-Th)/He ages from two to four
replicates vary from 39±5 Ma to 160±33 Ma and are in general slightly younger than fission-track ages (45±2 to 208±8 Ma; (Barbarand et al., 2001), as shown on Figure 1). And three samples present a He age older than the FT age for all replicates and three other samples present older He ages for some replicates; see Figure 1.
He ages are generally reproducible among replicates
but some samples present an He age dispersion which is not correlated to crystal size. A quantitative model including α-recoil damage, annealing, and their effect on He diffusion kinetics has been developed and calibrated against data from independent literature. This model has been embedded into a production/ejection/diffusion Monte Carlo model applied to the thermal history deduced from FT length distributions (Gautheron and Tassan-Got, 2008). The defects act as a storage tank in chemical equilibrium with the helium atoms located in the lattice. For their annealing, a treatment of thermal annealing, which is very similar to the one applied to fission tracks has been developed. In addition, the alpha-
irradiation annealing is neglected because it plays only a minor role on recoil damage annealing (<7-8%); see Soulet et al., 2001 for references. The deduced He kinetics parameters are: Eb=31kJ/mol, Ea=109kJ/mol, D0=0.18cm2/s and c=2.6×10⁻⁵(ppm.Ma)-1.
Figure 1: Mean (U-Th)/He ages reported as a function of the fission track ages (Barbarand et al., 2001). The equality line between He and FT ages is reported and the data in majority lie on the right side of the diagram indicating that FT ages are older than He age. And three samples have older He ages than FT.
This model perfectly reproduces the Massif Central data except for the three samples where He ages are older than FT’s, as seen on Figure 2.
The effect of irradiation damage is significant and
the long stay in the He-PRZ (Helium-Partial Retention Zone) amplifies the effect of damage increasing the temperature sensitivity of the (U-Th)/He thermochronometer. In the Massif Central case, the He temperature sensitivity is close to the FT thermochronometer and closure temperature between 80 and 95°C can be deduced, for a cooling rate of 10°C/Ma. However, we show that annealing of irradiation damage play an important role because the samples have undergone a burial phase. Higher closure temperature for the apatite Helium system are recorded; this can be non significant for rapidly and recently exhumed samples but for samples from slow-cooled basement, the production and annealing of alpha damage must be considered to get more realistic thermal histories.

In Garver, J.I., and Montario, M.J. (eds.), Proceedings from the 11th International Conference on thermochronometry, Anchorage Alaska, Sept. 2008. 91
Figure 2: Measured He ages in function of the simulated age using the production/ejection/diffusion Monte Carlo model where the trapping/annealing model is embedded. The (U-Th)/He ages were modeled by including in the simulation the irradiation damage production/annealing model.
References Barbarand, J., Lucazeau, F., Pagel, M. and Séranne, M., 2001. Burial
exhumation history of the southern-eastern Massif Central (France) constrained by apatite fission-track thermochronology. Tectonophysics, 335: 275-290.
Farley, K.A., 2000. Helium diffusion from apatite: general behavior as illustrated by Durango fluorapatite. J. Geophys. Res., 105: 2903-2914.
Flowers, R., Shuster, D., Wernicke, B. and Farley, K.A., 2007. Radiation damage control on apatite (U-Th)/He dates from the Grand Canyon region, Colorado Plateau. Geology, 35: 447-450.
Gautheron, C. and Tassan-Got, L., 2008. A Monte Carlo approach of diffusion applied to thermochronology. submitted to Chemical Geology.
Green, P.F., Crowhurst, P.V., Duddy, I.R., Jaspen, P. and Holford, S.P., 2006. Conflicting (U-Th)/He and fission track ages in apatite: Enhanced He retention, not annealing behaviour. Earth Planet. Sci. Lett., 250: 407-427.
Séranne, M., Camus, H., Lucazeau, F., Barbarand, J. and Quinif, Y., 2002. Surrection et érosion polyphasées de la Bordure cévenole. Un exemple de morphogenèse lente. Bull. Soc. géol. France, 173: 97-112.
Shuster, D., Flowers, R. and Farley, K.A., 2006. The influence of natural radiation damage on helium diffusion kinetics in apatite. Earth Planet. Sci. Lett., 249: 148-161.
Soulet, S., Chaumont, J., Krupa, J.C., Carpéna, J. and Ruault, M.-O., 2001. Determination of the defect creation mechanism in fluroroapatite. Journal of Nuclear Materials, 289: 194-198.
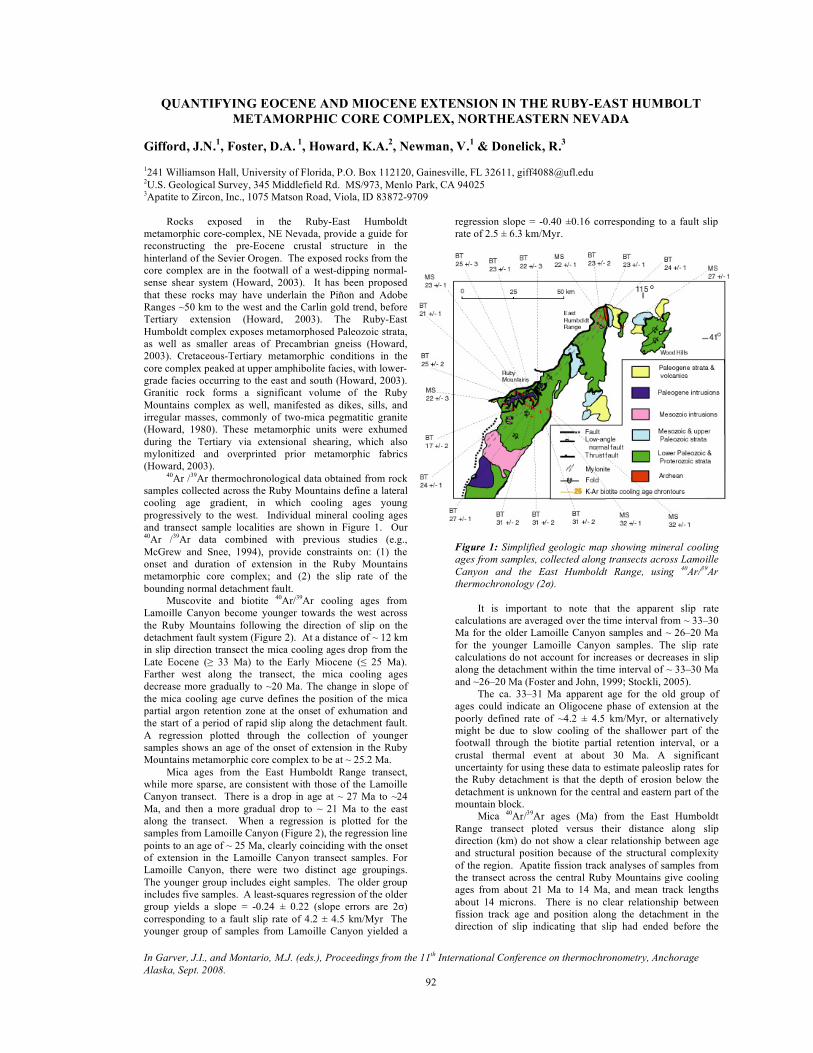
In Garver, J.I., and Montario, M.J. (eds.), Proceedings from the 11th International Conference on thermochronometry, Anchorage Alaska, Sept. 2008. 92
QUANTIFYING EOCENE AND MIOCENE EXTENSION IN THE RUBY-EAST HUMBOLT METAMORPHIC CORE COMPLEX, NORTHEASTERN NEVADA
Gifford, J.N.1, Foster, D.A. 1, Howard, K.A.2, Newman, V.1 & Donelick, R.3 1241 Williamson Hall, University of Florida, P.O. Box 112120, Gainesville, FL 32611, [email protected] 2U.S. Geological Survey, 345 Middlefield Rd. MS/973, Menlo Park, CA 94025 3Apatite to Zircon, Inc., 1075 Matson Road, Viola, ID 83872-9709
Rocks exposed in the Ruby-East Humboldt
metamorphic core-complex, NE Nevada, provide a guide for reconstructing the pre-Eocene crustal structure in the hinterland of the Sevier Orogen. The exposed rocks from the core complex are in the footwall of a west-dipping normal-sense shear system (Howard, 2003). It has been proposed that these rocks may have underlain the Piñon and Adobe Ranges ~50 km to the west and the Carlin gold trend, before Tertiary extension (Howard, 2003). The Ruby-East Humboldt complex exposes metamorphosed Paleozoic strata, as well as smaller areas of Precambrian gneiss (Howard, 2003). Cretaceous-Tertiary metamorphic conditions in the core complex peaked at upper amphibolite facies, with lower-grade facies occurring to the east and south (Howard, 2003). Granitic rock forms a significant volume of the Ruby Mountains complex as well, manifested as dikes, sills, and irregular masses, commonly of two-mica pegmatitic granite (Howard, 1980). These metamorphic units were exhumed during the Tertiary via extensional shearing, which also mylonitized and overprinted prior metamorphic fabrics (Howard, 2003).
40Ar /39Ar thermochronological data obtained from rock samples collected across the Ruby Mountains define a lateral cooling age gradient, in which cooling ages young progressively to the west. Individual mineral cooling ages and transect sample localities are shown in Figure 1. Our 40Ar /39Ar data combined with previous studies (e.g., McGrew and Snee, 1994), provide constraints on: (1) the onset and duration of extension in the Ruby Mountains metamorphic core complex; and (2) the slip rate of the bounding normal detachment fault.
Muscovite and biotite 40Ar/39Ar cooling ages from Lamoille Canyon become younger towards the west across the Ruby Mountains following the direction of slip on the detachment fault system (Figure 2). At a distance of ~ 12 km in slip direction transect the mica cooling ages drop from the Late Eocene (≥ 33 Ma) to the Early Miocene (≤ 25 Ma). Farther west along the transect, the mica cooling ages decrease more gradually to ~20 Ma. The change in slope of the mica cooling age curve defines the position of the mica partial argon retention zone at the onset of exhumation and the start of a period of rapid slip along the detachment fault. A regression plotted through the collection of younger samples shows an age of the onset of extension in the Ruby Mountains metamorphic core complex to be at ~ 25.2 Ma.
Mica ages from the East Humboldt Range transect, while more sparse, are consistent with those of the Lamoille Canyon transect. There is a drop in age at ~ 27 Ma to ~24 Ma, and then a more gradual drop to ~ 21 Ma to the east along the transect. When a regression is plotted for the samples from Lamoille Canyon (Figure 2), the regression line points to an age of ~ 25 Ma, clearly coinciding with the onset of extension in the Lamoille Canyon transect samples. For Lamoille Canyon, there were two distinct age groupings. The younger group includes eight samples. The older group includes five samples. A least-squares regression of the older group yields a slope = -0.24 ± 0.22 (slope errors are 2σ) corresponding to a fault slip rate of 4.2 ± 4.5 km/Myr The younger group of samples from Lamoille Canyon yielded a
regression slope = -0.40 ±0.16 corresponding to a fault slip rate of 2.5 ± 6.3 km/Myr.
Figure 1: Simplified geologic map showing mineral cooling ages from samples, collected along transects across Lamoille Canyon and the East Humboldt Range, using 40Ar/39Ar thermochronology (2σ).
It is important to note that the apparent slip rate calculations are averaged over the time interval from ~ 33–30 Ma for the older Lamoille Canyon samples and ~ 26–20 Ma for the younger Lamoille Canyon samples. The slip rate calculations do not account for increases or decreases in slip along the detachment within the time interval of ~ 33–30 Ma and ~26–20 Ma (Foster and John, 1999; Stockli, 2005).
The ca. 33–31 Ma apparent age for the old group of ages could indicate an Oligocene phase of extension at the poorly defined rate of ~4.2 ± 4.5 km/Myr, or alternatively might be due to slow cooling of the shallower part of the footwall through the biotite partial retention interval, or a crustal thermal event at about 30 Ma. A significant uncertainty for using these data to estimate paleoslip rates for the Ruby detachment is that the depth of erosion below the detachment is unknown for the central and eastern part of the mountain block.
Mica 40Ar/39Ar ages (Ma) from the East Humboldt Range transect ploted versus their distance along slip direction (km) do not show a clear relationship between age and structural position because of the structural complexity of the region. Apatite fission track analyses of samples from the transect across the central Ruby Mountains give cooling ages from about 21 Ma to 14 Ma, and mean track lengths about 14 microns. There is no clear relationship between fission track age and position along the detachment in the direction of slip indicating that slip had ended before the

In Garver, J.I., and Montario, M.J. (eds.), Proceedings from the 11th International Conference on thermochronometry, Anchorage Alaska, Sept. 2008. 93
footwall moved through the apatite partial annealing zone. There is a relationship between sample elevation and apatite fission track age. Samples from elevations of 3300-3400 meters elevation give ages ca. 21-19 Ma and samples from below 2900 m give ages of ca. 14-16 Ma. There is a break in slope at about 16 Ma, suggesting that exhumation though the partial retention zone accelerated in the Middle Miocene. Two lower elevation samples give intermediate fission track ages of ca. 18-19 Ma, but are from adjacent to the range front and were probably displaced relatively downward in the Miocene. The correlation between age and elevation indicates that the Ruby-East Humboldt metamorphic core complex was exhumed through the PAZ after uplift of the Ruby Mountains in the footwall high-angle normal faults that bound the block. Conclusions
The thermochronological data set obtained from the Ruby Mountains metamorphic core complex transect across Lamoille Canyon shown in this study provide several constraints on the exhumation onset and slip rate during the
Eocene and Miocene: (1) The age of the onset of extension in the Ruby Mountains is indicated to be ~25 Ma by the marked break in the slope of the cooling age curve on the age vs. distance diagram constructed from the mica cooling ages (Fig. 2). This thermochronology-based age constraint is in good agreement with the previous thermochronology done in the area (e.g. Dallmeyer et al., 1986; Dokka et al., 1986; Howard, 2003; McGrew and Snee, 1994). Furthermore, (2) the cooling ages from micas show that extension in the Ruby Mountains across Lamoille Canyon continued until at least ~ 20 Ma. (3) Muscovite and biotite 40Ar/39Ar thermochronological data obtained during this study were also used to constrain the slip rate on the detachment fault. These data show that between ~ 26–18 Ma, the averaged slip rate on the detachment was ~ 2.5 ± 6.3 km/m.y. (4) 40Ar/39Ar data from the eastern part of the footwall may indicate an Oligocene phase of extension at a rate of ~ 4.2 ± 4.5 km/m.y. from ~ 33–31 Ma, or record the gradual cooling before the onset of extension. (5) Apatite fission track data indicate that the Ruby Mountains were exhumed as a high-angle fault block after detachment faulting had ended.
Figure 2: Lamoille Canyon muscovite and biotite 40Ar/39Ar data graphed age (Ma) vs. distance in slip direction (km). The blue lines showing least-squares regressions, the yellow arrow showing the age of onset of extension.
Onset of extension
Slip rate = 4.2 ± 4.5
Slip rate = 2.5 ± 6.3

In Garver, J.I., and Montario, M.J. (eds.), Proceedings from the 11th International Conference on thermochronometry, Anchorage Alaska, Sept. 2008. 94
Figure 4: Apatite apparent ages (Ma) plotted vs. Sample elevations References Dallmeyer, R.D., Snoke, A.W., and McKee, E.H., 1986, The
Mesozoic-Cenozoic Tectonothermal evolution of the Ruby Mountains, East Humboldt Range, Nevada: a cordilleran metamorphic core complex: Tectonics, v. 5, p. 931–954.
Dokka, R.K., Mahaffie, M.J., Snoke, A.W., 1986, Thermochronologic evidence of major tectonic denudation associated with detachment faulting, northern Ruby Mountains-East Humboldt Range, Nevada: Tectonics, v. 5, p. 995–1006.
Foster, D.A., Gleadow, A.J.W., Reynolds, S.J., Fitzgerald, P.G., 1993, Denudation of metamorphic core complexes and the reconstruction of the transition zone, West Central Arizona: Constraints from apatite fission track thermochronology: Journal of Geophysical Research, v. 98, p. 2167–2185.
Foster, D.A., and John, B.E., 1999, Quantifying tectonic exhumation in an extensional orogen with thermochronology: examples from the southern Basin and Range Province: In Ring, U., Brandon, M.,
Howard, K.A., 1980, Metamorphic infrastructure in the Northern Ruby Mountains, Nevada: Geological Society of America, Memoir 153, p. 335–347.
Howard, K.A., 2003, Crustal structure in the Elko-Carlin region, Nevada, during Eocene gold mineralization: Ruby-East Humboldt metamorphic core complex as a guide to the deep crust: Economic Geology, v. 98, p. 249–268.
McGrew, A.J., and Snee, L.W., 1994, 40Ar/39Ar thermochronologic constraints on the tectonothermal evolution of the northern East Humboldt Range metamorphic core complex, Nevada: Tectonophysics, v. 238, p. 425–450.
Stockli, D.F., 2005, Application of low-temperature thermochronometry of extensional tectonic settings: Reviews in Mineralogy and Geochemistry, v. 58, p. 411–448.
In Garver, J.I., and Montario, M.J. (eds.), Proceedings from the 11th International Conference on thermochronometry, Anchorage Alaska, Sept. 2008. 95
IMPLICATIONS OF NEW APATITE AND ZIRCON FISSION-TRACK THERMOCHRONOLOGY FOR MESOZOIC AND TERTIARY BASIN MARGIN
EXHUMATION, UPPER ALASKA PENINSULA Gillis, Robert J1, Reifenstuhl Rocky R1, Decker, Paul L2
1Alaska Division of Geological and Geophysical Surveys, 3354 College Rd., Fairbanks AK 99709 2Alaska Division of Oil and Gas, 550 W. 7th Ave., Suite 800, Anchorage, AK 99501 Fifteen new apatite and eleven new zircon fission-track ages from samples collected in two locations across the Bruin Bay fault in south central Alaska span Middle Jurassic to Late Oligocene times and provide new insight into the protracted exhumation of a source area supplying sediment to the major prospective basins of Bristol Bay and Cook Inlet. Markedly different hangingwall, footwall, and along-strike cooling histories may be in part related to episodic, diachronous exhumation of Jurassic intrusive arc rocks. Most zircon fission-track (ZFT) ages from granitic hangingwall rocks at a locality in Katmai National Park suggest rapid cooling occurring between 145 ±7 to 141 ±6 Ma. These ages are partially coeval with deposition of an adjacent thick cobble to boulder conglomerate composed of granitic clasts within upper Naknek Formation footwall rocks. Apatite fission-track (AFT) data from the same samples and their inverse thermal models principally indicate moderately rapid to rapid Eocene cooling occurring from 56.4 ±3.7 to 30.0 ±4.6 Ma, spanning episodes of proximal clastic sedimentation along the western Cook Inlet corridor during Paleocene and Eocene times. Footwall samples from adjacent latest Jurassic Naknek Formation strata yield entirely Cenozoic ages, and therefore have been partially to completely annealed by temperatures near or above ~240°C. ZFT ages range from 56.1 ±2.7 to 41.6 ±2.3 Ma. AFT ages range from 41.7 ±2.7 to 25.0 ±1.6 Ma with generally shorter track lengths and inverse thermal models reflecting slower cooling with respect to adjacent hangingwall rocks. Local igneous reheating and poorly organized sample age distributions complicate interpretations
of footwall cooling ages, but AFT ages ranging from 33.1 to 25.0 Ma may reflect exhumation-related Oligocene cooling. Katmai area cooling ages contrast with those from a locality ~95 km to the southwest north of Becharof Lake, where cooling of hangingwall and footwall rocks below ~110 °C occurred by early Cretaceous time. A ZFT cooling age of 191 ±9 Ma sampled from hangingwall Jurassic arc rock is older than the recognized age of the intrusive arc (176-154 Ma). However, an AFT cooling age of 169 ±7 Ma from the same sample indicates that cooling to shallow crustal temperatures occurred rapidly during Middle Jurassic time. Middle Jurassic Naknek Formation footwall strata yielded a provenance ZFT cooling age of 176 ±10 Ma, suggesting rapid exhumation and deposition of arc-derived detritus. A partially to completely reset Early Cretaceous AFT cooling age of 126 ±6 Ma from the same sample implies annealing due to sedimentary burial to depths at ~110 °C or shallower. Inverse thermal modeling suggests slow cooling throughout Cretaceous and Cenozoic times. Collectively, these data indicate cooling occurred at different times, tempos, and rates along strike of the Bruin Bay fault. At its southernmost exposure near Becharof Lake, hangingwall rocks of the Bruin Bay fault cooled rapidly from above 240 °C to below 110 °C during a single episode in Middle Jurassic time that was likely associated with early slip along the fault. In contrast, hangingwall rocks of the Bruin Bay fault exposed in the Katmai area were exhumed later, and perhaps episodically, during latest Jurassic and Eocene times resulting in deposition of one or more substantial packages of proximal granitic basin fill.
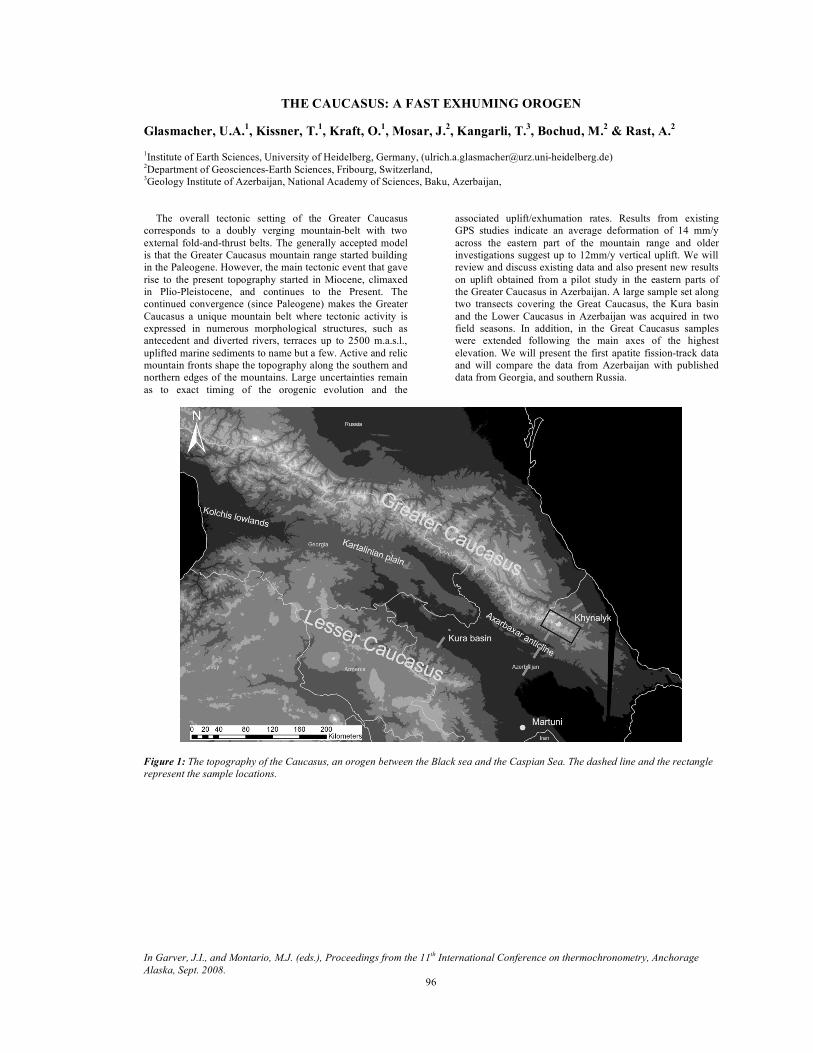
In Garver, J.I., and Montario, M.J. (eds.), Proceedings from the 11th International Conference on thermochronometry, Anchorage Alaska, Sept. 2008. 96
THE CAUCASUS: A FAST EXHUMING OROGEN Glasmacher, U.A.1, Kissner, T.1, Kraft, O.1, Mosar, J.2, Kangarli, T.3, Bochud, M.2 & Rast, A.2 1Institute of Earth Sciences, University of Heidelberg, Germany, ([email protected]) 2Department of Geosciences-Earth Sciences, Fribourg, Switzerland, 3Geology Institute of Azerbaijan, National Academy of Sciences, Baku, Azerbaijan,
The overall tectonic setting of the Greater Caucasus corresponds to a doubly verging mountain-belt with two external fold-and-thrust belts. The generally accepted model is that the Greater Caucasus mountain range started building in the Paleogene. However, the main tectonic event that gave rise to the present topography started in Miocene, climaxed in Plio-Pleistocene, and continues to the Present. The continued convergence (since Paleogene) makes the Greater Caucasus a unique mountain belt where tectonic activity is expressed in numerous morphological structures, such as antecedent and diverted rivers, terraces up to 2500 m.a.s.l., uplifted marine sediments to name but a few. Active and relic mountain fronts shape the topography along the southern and northern edges of the mountains. Large uncertainties remain as to exact timing of the orogenic evolution and the
associated uplift/exhumation rates. Results from existing GPS studies indicate an average deformation of 14 mm/y across the eastern part of the mountain range and older investigations suggest up to 12mm/y vertical uplift. We will review and discuss existing data and also present new results on uplift obtained from a pilot study in the eastern parts of the Greater Caucasus in Azerbaijan. A large sample set along two transects covering the Great Caucasus, the Kura basin and the Lower Caucasus in Azerbaijan was acquired in two field seasons. In addition, in the Great Caucasus samples were extended following the main axes of the highest elevation. We will present the first apatite fission-track data and will compare the data from Azerbaijan with published data from Georgia, and southern Russia.
Figure 1: The topography of the Caucasus, an orogen between the Black sea and the Caspian Sea. The dashed line and the rectangle represent the sample locations.
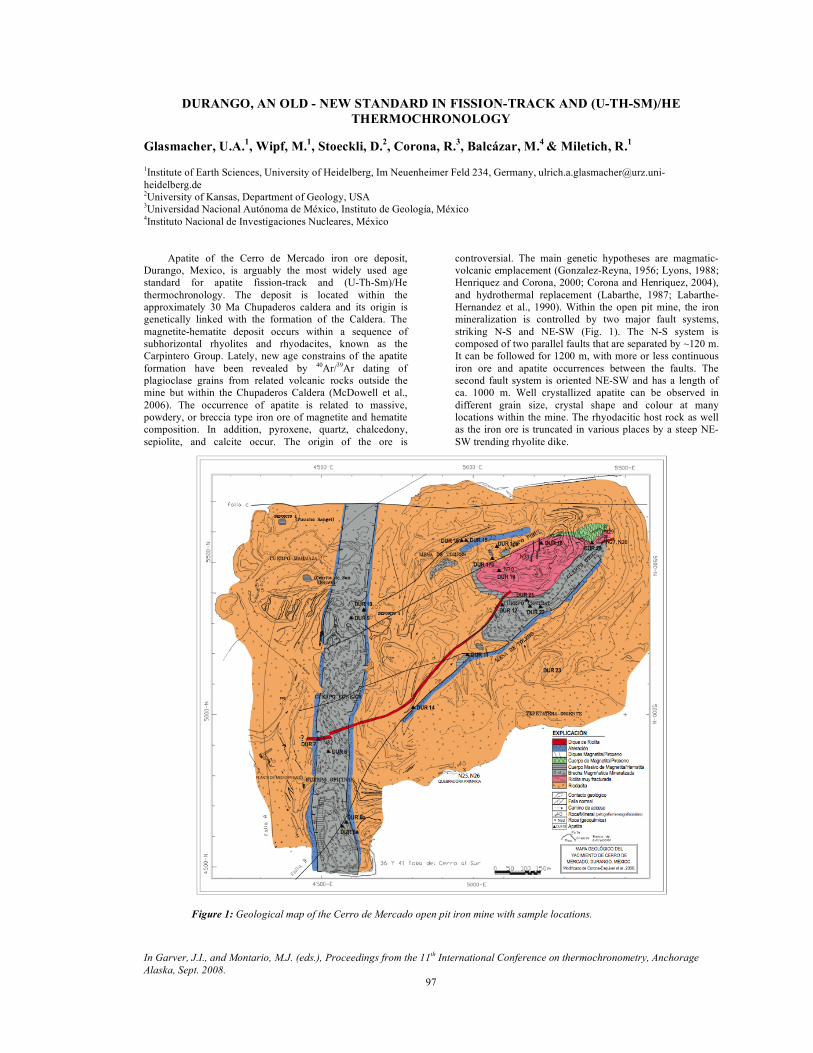
In Garver, J.I., and Montario, M.J. (eds.), Proceedings from the 11th International Conference on thermochronometry, Anchorage Alaska, Sept. 2008. 97
DURANGO, AN OLD - NEW STANDARD IN FISSION-TRACK AND (U-TH-SM)/HE THERMOCHRONOLOGY
Glasmacher, U.A.1, Wipf, M.1, Stoeckli, D.2, Corona, R.3, Balcázar, M.4 & Miletich, R.1
1Institute of Earth Sciences, University of Heidelberg, Im Neuenheimer Feld 234, Germany, [email protected] 2University of Kansas, Department of Geology, USA 3Universidad Nacional Autónoma de México, Instituto de Geología, México 4Instituto Nacional de Investigaciones Nucleares, México
Apatite of the Cerro de Mercado iron ore deposit, Durango, Mexico, is arguably the most widely used age standard for apatite fission-track and (U-Th-Sm)/He thermochronology. The deposit is located within the approximately 30 Ma Chupaderos caldera and its origin is genetically linked with the formation of the Caldera. The magnetite-hematite deposit occurs within a sequence of subhorizontal rhyolites and rhyodacites, known as the Carpintero Group. Lately, new age constrains of the apatite formation have been revealed by 40Ar/39Ar dating of plagioclase grains from related volcanic rocks outside the mine but within the Chupaderos Caldera (McDowell et al., 2006). The occurrence of apatite is related to massive, powdery, or breccia type iron ore of magnetite and hematite composition. In addition, pyroxene, quartz, chalcedony, sepiolite, and calcite occur. The origin of the ore is
controversial. The main genetic hypotheses are magmatic-volcanic emplacement (Gonzalez-Reyna, 1956; Lyons, 1988; Henriquez and Corona, 2000; Corona and Henriquez, 2004), and hydrothermal replacement (Labarthe, 1987; Labarthe-Hernandez et al., 1990). Within the open pit mine, the iron mineralization is controlled by two major fault systems, striking N-S and NE-SW (Fig. 1). The N-S system is composed of two parallel faults that are separated by ~120 m. It can be followed for 1200 m, with more or less continuous iron ore and apatite occurrences between the faults. The second fault system is oriented NE-SW and has a length of ca. 1000 m. Well crystallized apatite can be observed in different grain size, crystal shape and colour at many locations within the mine. The rhyodacitic host rock as well as the iron ore is truncated in various places by a steep NE-SW trending rhyolite dike.
Figure 1: Geological map of the Cerro de Mercado open pit iron mine with sample locations.

In Garver, J.I., and Montario, M.J. (eds.), Proceedings from the 11th International Conference on thermochronometry, Anchorage Alaska, Sept. 2008. 98
During several visits at the mine a representative set of
apatite and other minerals from various locations were sampled (Fig. 1). In addition, samples from the young rhyolitic dike, the rhyodacite wall rock and the rhyolite dome were collected. Mineral processing of the rhyolite dike, the rhyolite dome and the rhyodacite revealed apatite and zircon in good quantity and quality. Apatite and zircon fission-track and (U-Th-Sm)/He ages of the various locations will be presented (Wipf et al., in prep.). Furthermore, confined spontaneous and induced fission-track length data and etch pit size distribution will be shown for different locations. The dependency of defect concentration on the Raman band of Durango apatite will be discussed in relation to irradiation at ambient pressure and high external pressure (Liu et al. 2008, Weikusat et al. 2008). References Corona-Esquivel Rodolfo, y Henríquez, Fernando, 2004, Modelo
magmático del yacimiento de Hierro Peña Colorada, Colima y su relación con la exploración de otros yacimientos
González-Reyna, Jenaro, 1956, Riqueza minera y yacimientos minerales de México: México, D.F., Banco de México, p. 235-242.
Henríquez, F. y Corona Esquivel, R., 2000, Yacimientos de fierro tipo Kiruna en México y comparación con yacimientos chilenos:
Congreso Geológico Chileno, IX, Puerto Varas, Actas vol. 2, p. 118-122.
McDowell, F.W., McIntosh W.C., Farley, K.A., 2005. A precise 40Ar/39Ar reference age for the Durango apatite (U–Th)/He and fission-track dating standard. Chem. Geol. 214, 249-263.
Labarthe, G., Tristán M. y Aguillón, A., 1987, Análisis de la Mina Cerro del Mercado, Dgo.: GEOMIMET No. 150, p. 6-14.
Labarthe-Hernández, Guillermo; Carreón-Sandoval, J.L.; Tristán-González, Margarito; y Aguillón-Robles, Alfredo, 1990, Cerro de Mercado in Ordoñez-Cortés, Jorge, ed., Minas Mexicanas: Tomo 5, p. 71–91.
Liu, J., Glasmacher, U.A., Lang, M., Trautmann, C., Voss, K.-O., Neumann, R., Wagner, G.A., Miletich, R. 2008. Raman spectroscopy of apatite irradiated with swift heavy ions with and without simultaneous exertion of high pressure. Applied Physics A 91, 17–22.
Lyons, J.L., Jr., 1988, Volcanogenic iron oxide deposits, Cerro de Mercado and vicinity, Durango, Mexico: Economic Geology, v. 83, p. 1886–1906.
Weikusat C., Glasmacher, U.A., Miletich, R., Neumann, R., Trautmann, C. 2008. Material change of apatite induced by swift heavy ions - Raman spectroscopy – SHIM-abstract volume
Wipf, M., Stoeckli, D., Glasmacher, U.A., Corona, R., Balcázar, M., Miletich, R. (in prep.) Durango, a new – old standard in fission-track and (U-Th-Sm)/He thermochronology.
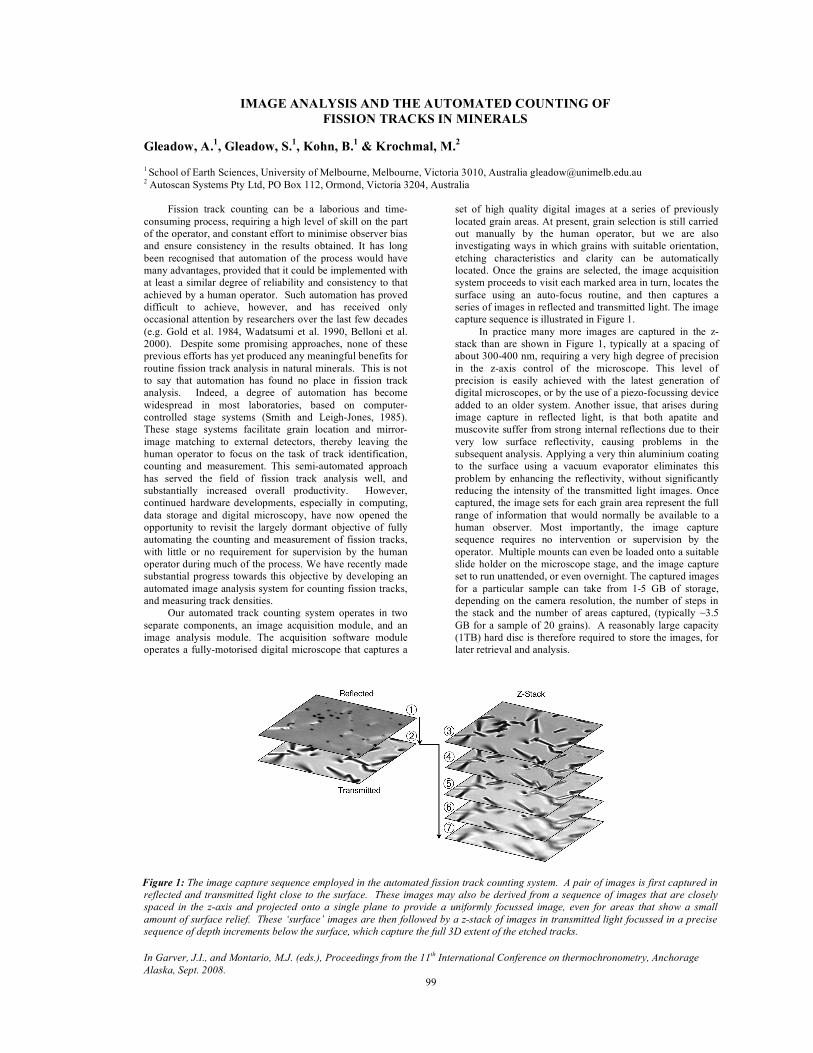
In Garver, J.I., and Montario, M.J. (eds.), Proceedings from the 11th International Conference on thermochronometry, Anchorage Alaska, Sept. 2008. 99
IMAGE ANALYSIS AND THE AUTOMATED COUNTING OF FISSION TRACKS IN MINERALS
Gleadow, A.1, Gleadow, S.1, Kohn, B.1 & Krochmal, M.2 1 School of Earth Sciences, University of Melbourne, Melbourne, Victoria 3010, Australia [email protected] 2 Autoscan Systems Pty Ltd, PO Box 112, Ormond, Victoria 3204, Australia
Fission track counting can be a laborious and time-consuming process, requiring a high level of skill on the part of the operator, and constant effort to minimise observer bias and ensure consistency in the results obtained. It has long been recognised that automation of the process would have many advantages, provided that it could be implemented with at least a similar degree of reliability and consistency to that achieved by a human operator. Such automation has proved difficult to achieve, however, and has received only occasional attention by researchers over the last few decades (e.g. Gold et al. 1984, Wadatsumi et al. 1990, Belloni et al. 2000). Despite some promising approaches, none of these previous efforts has yet produced any meaningful benefits for routine fission track analysis in natural minerals. This is not to say that automation has found no place in fission track analysis. Indeed, a degree of automation has become widespread in most laboratories, based on computer-controlled stage systems (Smith and Leigh-Jones, 1985). These stage systems facilitate grain location and mirror-image matching to external detectors, thereby leaving the human operator to focus on the task of track identification, counting and measurement. This semi-automated approach has served the field of fission track analysis well, and substantially increased overall productivity. However, continued hardware developments, especially in computing, data storage and digital microscopy, have now opened the opportunity to revisit the largely dormant objective of fully automating the counting and measurement of fission tracks, with little or no requirement for supervision by the human operator during much of the process. We have recently made substantial progress towards this objective by developing an automated image analysis system for counting fission tracks, and measuring track densities.
Our automated track counting system operates in two separate components, an image acquisition module, and an image analysis module. The acquisition software module operates a fully-motorised digital microscope that captures a
set of high quality digital images at a series of previously located grain areas. At present, grain selection is still carried out manually by the human operator, but we are also investigating ways in which grains with suitable orientation, etching characteristics and clarity can be automatically located. Once the grains are selected, the image acquisition system proceeds to visit each marked area in turn, locates the surface using an auto-focus routine, and then captures a series of images in reflected and transmitted light. The image capture sequence is illustrated in Figure 1.
In practice many more images are captured in the z-stack than are shown in Figure 1, typically at a spacing of about 300-400 nm, requiring a very high degree of precision in the z-axis control of the microscope. This level of precision is easily achieved with the latest generation of digital microscopes, or by the use of a piezo-focussing device added to an older system. Another issue, that arises during image capture in reflected light, is that both apatite and muscovite suffer from strong internal reflections due to their very low surface reflectivity, causing problems in the subsequent analysis. Applying a very thin aluminium coating to the surface using a vacuum evaporator eliminates this problem by enhancing the reflectivity, without significantly reducing the intensity of the transmitted light images. Once captured, the image sets for each grain area represent the full range of information that would normally be available to a human observer. Most importantly, the image capture sequence requires no intervention or supervision by the operator. Multiple mounts can even be loaded onto a suitable slide holder on the microscope stage, and the image capture set to run unattended, or even overnight. The captured images for a particular sample can take from 1-5 GB of storage, depending on the camera resolution, the number of steps in the stack and the number of areas captured, (typically ~3.5 GB for a sample of 20 grains). A reasonably large capacity (1TB) hard disc is therefore required to store the images, for later retrieval and analysis.
Figure 1: The image capture sequence employed in the automated fission track counting system. A pair of images is first captured in reflected and transmitted light close to the surface. These images may also be derived from a sequence of images that are closely spaced in the z-axis and projected onto a single plane to provide a uniformly focussed image, even for areas that show a small amount of surface relief. These ‘surface’ images are then followed by a z-stack of images in transmitted light focussed in a precise sequence of depth increments below the surface, which capture the full 3D extent of the etched tracks.
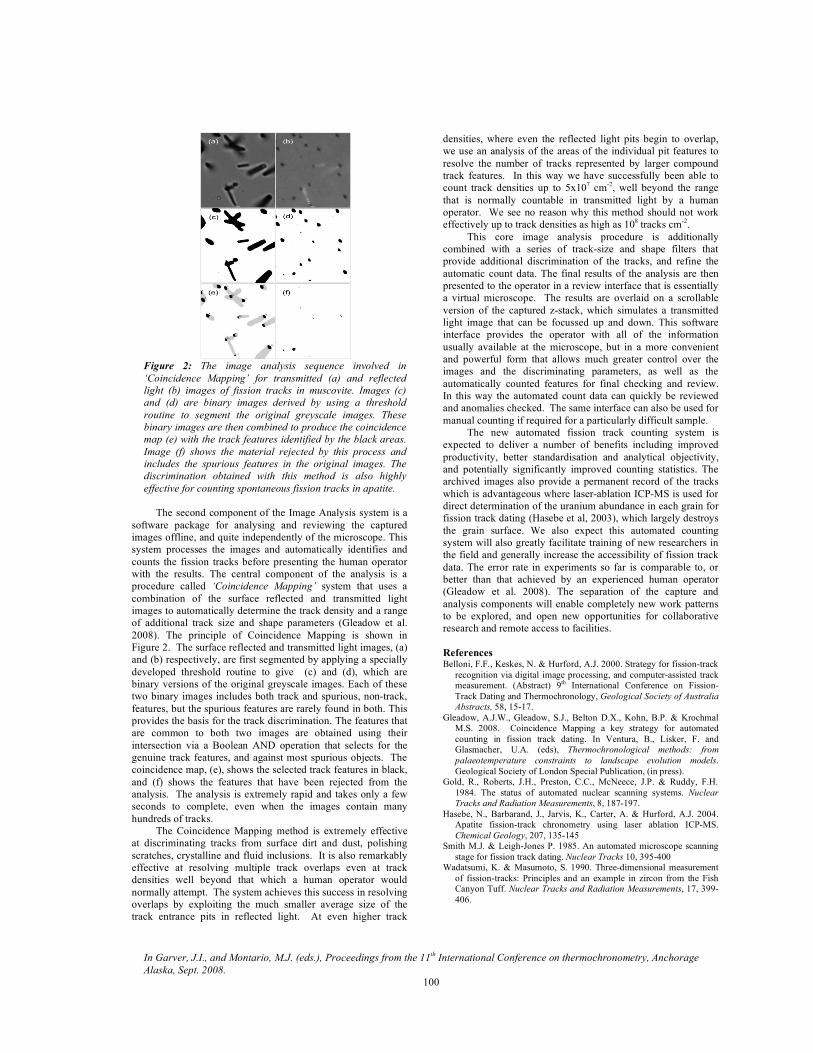
In Garver, J.I., and Montario, M.J. (eds.), Proceedings from the 11th International Conference on thermochronometry, Anchorage Alaska, Sept. 2008. 100
Figure 2: The image analysis sequence involved in ‘Coincidence Mapping’ for transmitted (a) and reflected light (b) images of fission tracks in muscovite. Images (c) and (d) are binary images derived by using a threshold routine to segment the original greyscale images. These binary images are then combined to produce the coincidence map (e) with the track features identified by the black areas. Image (f) shows the material rejected by this process and includes the spurious features in the original images. The discrimination obtained with this method is also highly effective for counting spontaneous fission tracks in apatite.
The second component of the Image Analysis system is a software package for analysing and reviewing the captured images offline, and quite independently of the microscope. This system processes the images and automatically identifies and counts the fission tracks before presenting the human operator with the results. The central component of the analysis is a procedure called ‘Coincidence Mapping’ system that uses a combination of the surface reflected and transmitted light images to automatically determine the track density and a range of additional track size and shape parameters (Gleadow et al. 2008). The principle of Coincidence Mapping is shown in Figure 2. The surface reflected and transmitted light images, (a) and (b) respectively, are first segmented by applying a specially developed threshold routine to give (c) and (d), which are binary versions of the original greyscale images. Each of these two binary images includes both track and spurious, non-track, features, but the spurious features are rarely found in both. This provides the basis for the track discrimination. The features that are common to both two images are obtained using their intersection via a Boolean AND operation that selects for the genuine track features, and against most spurious objects. The coincidence map, (e), shows the selected track features in black, and (f) shows the features that have been rejected from the analysis. The analysis is extremely rapid and takes only a few seconds to complete, even when the images contain many hundreds of tracks.
The Coincidence Mapping method is extremely effective at discriminating tracks from surface dirt and dust, polishing scratches, crystalline and fluid inclusions. It is also remarkably effective at resolving multiple track overlaps even at track densities well beyond that which a human operator would normally attempt. The system achieves this success in resolving overlaps by exploiting the much smaller average size of the track entrance pits in reflected light. At even higher track
densities, where even the reflected light pits begin to overlap, we use an analysis of the areas of the individual pit features to resolve the number of tracks represented by larger compound track features. In this way we have successfully been able to count track densities up to 5x107 cm-2, well beyond the range that is normally countable in transmitted light by a human operator. We see no reason why this method should not work effectively up to track densities as high as 108 tracks cm-2.
This core image analysis procedure is additionally combined with a series of track-size and shape filters that provide additional discrimination of the tracks, and refine the automatic count data. The final results of the analysis are then presented to the operator in a review interface that is essentially a virtual microscope. The results are overlaid on a scrollable version of the captured z-stack, which simulates a transmitted light image that can be focussed up and down. This software interface provides the operator with all of the information usually available at the microscope, but in a more convenient and powerful form that allows much greater control over the images and the discriminating parameters, as well as the automatically counted features for final checking and review. In this way the automated count data can quickly be reviewed and anomalies checked. The same interface can also be used for manual counting if required for a particularly difficult sample.
The new automated fission track counting system is expected to deliver a number of benefits including improved productivity, better standardisation and analytical objectivity, and potentially significantly improved counting statistics. The archived images also provide a permanent record of the tracks which is advantageous where laser-ablation ICP-MS is used for direct determination of the uranium abundance in each grain for fission track dating (Hasebe et al, 2003), which largely destroys the grain surface. We also expect this automated counting system will also greatly facilitate training of new researchers in the field and generally increase the accessibility of fission track data. The error rate in experiments so far is comparable to, or better than that achieved by an experienced human operator (Gleadow et al. 2008). The separation of the capture and analysis components will enable completely new work patterns to be explored, and open new opportunities for collaborative research and remote access to facilities. References Belloni, F.F., Keskes, N. & Hurford, A.J. 2000. Strategy for fission-track
recognition via digital image processing, and computer-assisted track measurement. (Abstract) 9th International Conference on Fission-Track Dating and Thermochronology, Geological Society of Australia Abstracts, 58, 15-17.
Gleadow, A.J.W., Gleadow, S.J., Belton D.X., Kohn, B.P. & Krochmal M.S. 2008. Coincidence Mapping a key strategy for automated counting in fission track dating. In Ventura, B., Lisker, F. and Glasmacher, U.A. (eds), Thermochronological methods: from palaeotemperature constraints to landscape evolution models. Geological Society of London Special Publication, (in press).
Gold, R., Roberts, J.H., Preston, C.C., McNeece, J.P. & Ruddy, F.H. 1984. The status of automated nuclear scanning systems. Nuclear Tracks and Radiation Measurements, 8, 187-197.
Hasebe, N., Barbarand, J., Jarvis, K., Carter, A. & Hurford, A.J. 2004. Apatite fission-track chronometry using laser ablation ICP-MS. Chemical Geology, 207, 135-145
Smith M.J. & Leigh-Jones P. 1985. An automated microscope scanning stage for fission track dating. Nuclear Tracks 10, 395-400
Wadatsumi, K. & Masumoto, S. 1990. Three-dimensional measurement of fission-tracks: Principles and an example in zircon from the Fish Canyon Tuff. Nuclear Tracks and Radiation Measurements, 17, 399-406.
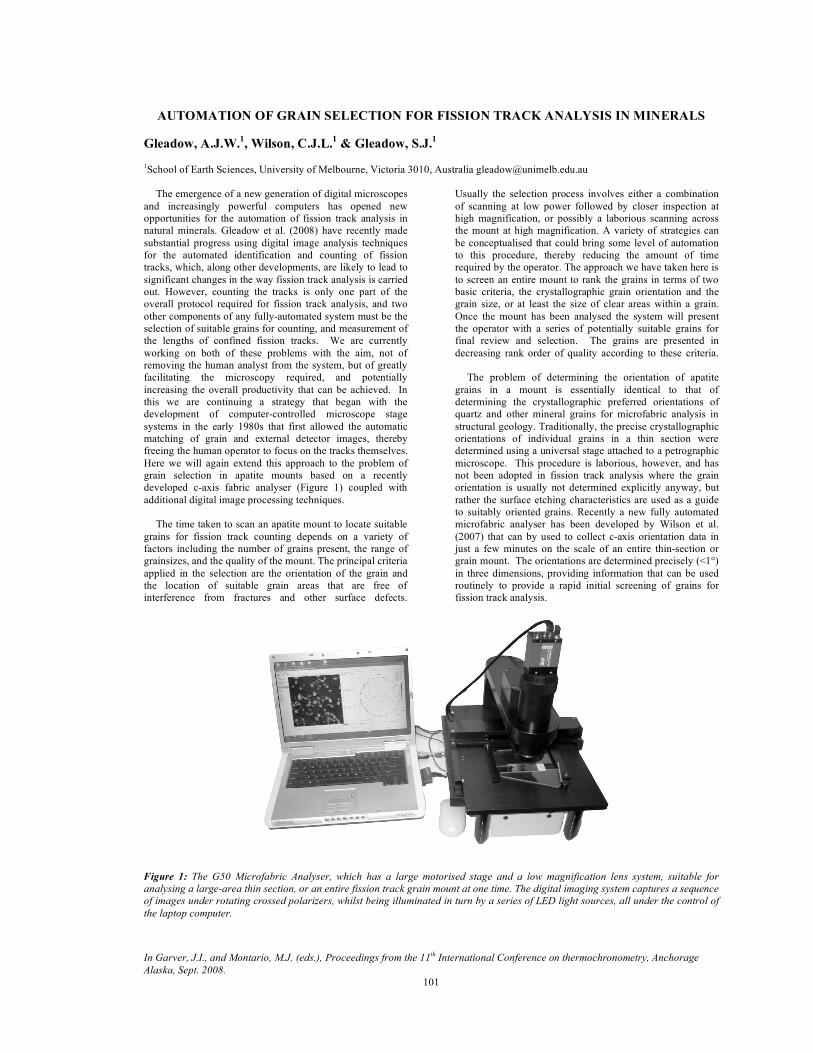
In Garver, J.I., and Montario, M.J. (eds.), Proceedings from the 11th International Conference on thermochronometry, Anchorage Alaska, Sept. 2008. 101
AUTOMATION OF GRAIN SELECTION FOR FISSION TRACK ANALYSIS IN MINERALS Gleadow, A.J.W.1, Wilson, C.J.L.1 & Gleadow, S.J.1 1School of Earth Sciences, University of Melbourne, Victoria 3010, Australia [email protected]
The emergence of a new generation of digital microscopes and increasingly powerful computers has opened new opportunities for the automation of fission track analysis in natural minerals. Gleadow et al. (2008) have recently made substantial progress using digital image analysis techniques for the automated identification and counting of fission tracks, which, along other developments, are likely to lead to significant changes in the way fission track analysis is carried out. However, counting the tracks is only one part of the overall protocol required for fission track analysis, and two other components of any fully-automated system must be the selection of suitable grains for counting, and measurement of the lengths of confined fission tracks. We are currently working on both of these problems with the aim, not of removing the human analyst from the system, but of greatly facilitating the microscopy required, and potentially increasing the overall productivity that can be achieved. In this we are continuing a strategy that began with the development of computer-controlled microscope stage systems in the early 1980s that first allowed the automatic matching of grain and external detector images, thereby freeing the human operator to focus on the tracks themselves. Here we will again extend this approach to the problem of grain selection in apatite mounts based on a recently developed c-axis fabric analyser (Figure 1) coupled with additional digital image processing techniques.
The time taken to scan an apatite mount to locate suitable grains for fission track counting depends on a variety of factors including the number of grains present, the range of grainsizes, and the quality of the mount. The principal criteria applied in the selection are the orientation of the grain and the location of suitable grain areas that are free of interference from fractures and other surface defects.
Usually the selection process involves either a combination of scanning at low power followed by closer inspection at high magnification, or possibly a laborious scanning across the mount at high magnification. A variety of strategies can be conceptualised that could bring some level of automation to this procedure, thereby reducing the amount of time required by the operator. The approach we have taken here is to screen an entire mount to rank the grains in terms of two basic criteria, the crystallographic grain orientation and the grain size, or at least the size of clear areas within a grain. Once the mount has been analysed the system will present the operator with a series of potentially suitable grains for final review and selection. The grains are presented in decreasing rank order of quality according to these criteria.
The problem of determining the orientation of apatite grains in a mount is essentially identical to that of determining the crystallographic preferred orientations of quartz and other mineral grains for microfabric analysis in structural geology. Traditionally, the precise crystallographic orientations of individual grains in a thin section were determined using a universal stage attached to a petrographic microscope. This procedure is laborious, however, and has not been adopted in fission track analysis where the grain orientation is usually not determined explicitly anyway, but rather the surface etching characteristics are used as a guide to suitably oriented grains. Recently a new fully automated microfabric analyser has been developed by Wilson et al. (2007) that can by used to collect c-axis orientation data in just a few minutes on the scale of an entire thin-section or grain mount. The orientations are determined precisely (<1°) in three dimensions, providing information that can be used routinely to provide a rapid initial screening of grains for fission track analysis.
Figure 1: The G50 Microfabric Analyser, which has a large motorised stage and a low magnification lens system, suitable for analysing a large-area thin section, or an entire fission track grain mount at one time. The digital imaging system captures a sequence of images under rotating crossed polarizers, whilst being illuminated in turn by a series of LED light sources, all under the control of the laptop computer.

In Garver, J.I., and Montario, M.J. (eds.), Proceedings from the 11th International Conference on thermochronometry, Anchorage Alaska, Sept. 2008. 102
The c-axis fabric analyser operates by acquiring a series of
images of a grain mount at various orientations between polarizers. Wilen et al. (2003) have outlined the basic optical principles underlying this and other similar automated systems. Two versions of the microfabric analyser are available; one being a modified petrographic microscope (Wilson et al., 2007) for high-resolution work, and the other being a macro-scale instrument capable of measuring an entire mount at one time (Figure 1). The latter has a spatial resolution down to 5 µm that is more than sufficient to analyse the orientations of whole grains. The orientation measurements are spatially linked to their positions within the mount so that the orientation of each apatite grain may be accurately determined. An example of the distribution of c-axis directions for an apatite from the Sudbury intrusion in Canada is shown in Figure 2. These apatites have a high proportion of euhedral grains that are lying with their c-axes close to horizontal in the mount as is often the case for apatites from igneous rocks. In other cases, however, especially for abraded apatite grains from sedimentary rocks, a more random distribution is found.
Figure 2: Stereographic Projection of c-axis directions for 151 apatite grains from the Sudbury Intrusion, Ontario, Canada. The apatite grains in this case are mostly euhedral prismatic crystals that tend to lie horizontally in the mount, hence the high proportion of c-axis directions that are lying at a low angle around the equator. Each c-axis direction is spatially linked to a particular apatite grain and can be used to identify grains that are in a suitable orientation for fission track analysis. The plot is an equal area, lower hemisphere stereographic projection.
The fabric analysis also produces a series of images that
may be further analysed to clearly identify and resolve individual grains from each other. The next stage of the analysis involves application of a ‘watershed segmentation’ filter (e.g. Russ, 2002) to an image of the grains resulting from the microfabric analysis. The purpose of this filter is to separate particles that are touching each other so that discrete areas belonging to a single grain may be identified. Further, this filter has the effect of breaking up large grains that are traversed by visible fractures into separate areas, each of which are more likely to be suitable candidates for fission track imaging and counting than the whole grain. Figure 3 shows an example of this area-based selection.
Figure 3: Processed image of crushed grains of Durango apatite showing the largest clear grain areas in black. Combining this kind of area information with the c-axis orientations from the fabric analyser produces a ranked list of candidate grains for automated fission track imaging and counting.
By combining these approaches a ranked list of accurately located and oriented candidate grains for fission track analysis can be presented to the observer, who is then able to rapidly choose, or reject, each one in sequence at high magnification under the fission track microscope. The task of grain selection is thus greatly facilitated and suitable areas quickly tagged for automated image capture and counting as described by Gleadow et al. (2007). In addition, we are now developing strategies for automatically locating confined fission tracks for length determination, for which knowing the precise grain orientation will be an important preliminary step. Through the use of the microfabric analyser, it should be possible to relate individual track length measurements to the orientation of the host grain with a precision not previously possible. At present the microfabric analysis is applicable only to optically uniaxial minerals and so will also work for zircon, but a biaxial analysis should become feasible in future, opening up its application to other minerals as well. A number of other image analysis approaches and enhancements to the method described here are also possible, making this a fertile field for ongoing research. References Gleadow, A.J.W., Gleadow, S.J., Belton D.X., Kohn, B.P. &
Krochmal M.S. 2008. Coincidence Mapping a key strategy for automated counting in fission track dating. In Ventura, B., Lisker, F. and Glasmacher, U.A. (eds), Thermochronological methods: from palaeotemperature constraints to landscape evolution models. Geological Society of London Special Publication, (in press).
Russ, J.C. 2002. The Image Processing Handbook (Fourth Edition). CRC Press, 732p.
Wilen, L.A., Diprinzio, C.L., Alley, R.B. & Azuma, N. (2003) Development, principles and applications of automated ice fabric analysers. Microscopy Research and Technique 62, 2–18.
Wilson C.J.L., Russell-Head D.S., Kunze K. & Viola G. 2007. The analysis of quartz c-axis fabrics using a modified optical microscope. Journal of Microscopy 227, 30-41.
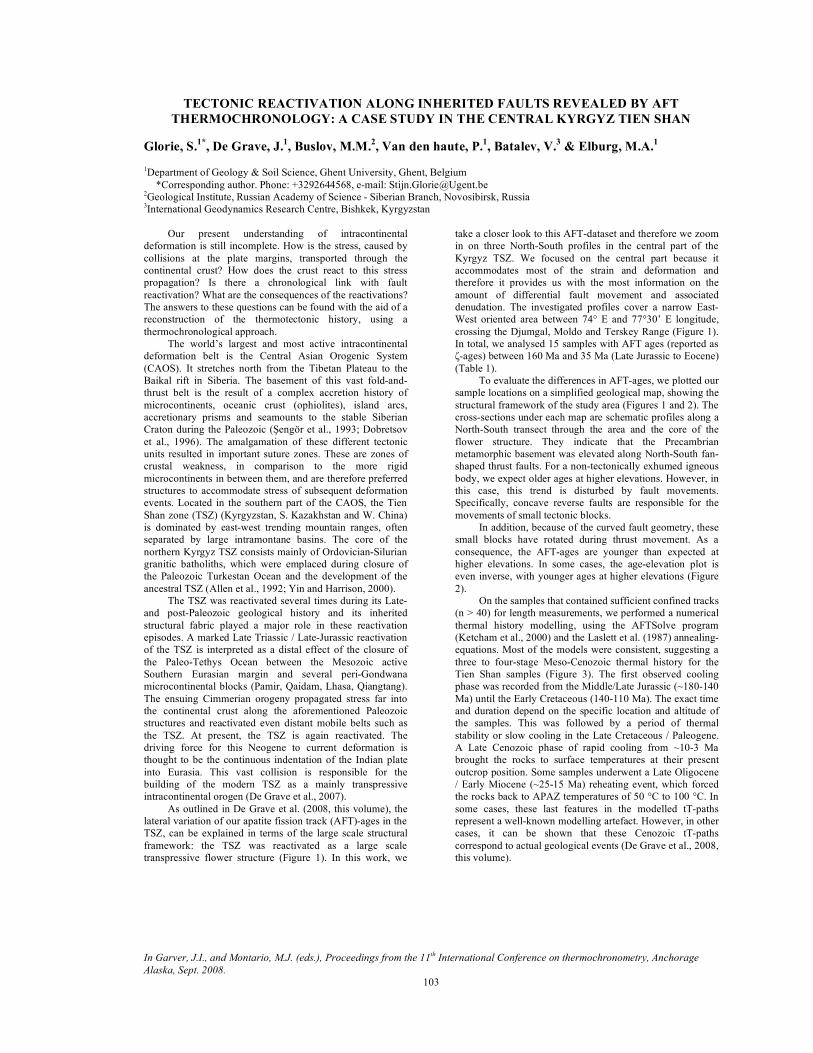
In Garver, J.I., and Montario, M.J. (eds.), Proceedings from the 11th International Conference on thermochronometry, Anchorage Alaska, Sept. 2008. 103
TECTONIC REACTIVATION ALONG INHERITED FAULTS REVEALED BY AFT THERMOCHRONOLOGY: A CASE STUDY IN THE CENTRAL KYRGYZ TIEN SHAN
Glorie, S.1*, De Grave, J.1, Buslov, M.M.2, Van den haute, P.1, Batalev, V.3 & Elburg, M.A.1 1Department of Geology & Soil Science, Ghent University, Ghent, Belgium
*Corresponding author. Phone: +3292644568, e-mail: [email protected] 2Geological Institute, Russian Academy of Science - Siberian Branch, Novosibirsk, Russia 3International Geodynamics Research Centre, Bishkek, Kyrgyzstan
Our present understanding of intracontinental
deformation is still incomplete. How is the stress, caused by collisions at the plate margins, transported through the continental crust? How does the crust react to this stress propagation? Is there a chronological link with fault reactivation? What are the consequences of the reactivations? The answers to these questions can be found with the aid of a reconstruction of the thermotectonic history, using a thermochronological approach.
The world’s largest and most active intracontinental deformation belt is the Central Asian Orogenic System (CAOS). It stretches north from the Tibetan Plateau to the Baikal rift in Siberia. The basement of this vast fold-and-thrust belt is the result of a complex accretion history of microcontinents, oceanic crust (ophiolites), island arcs, accretionary prisms and seamounts to the stable Siberian Craton during the Paleozoic (Şengör et al., 1993; Dobretsov et al., 1996). The amalgamation of these different tectonic units resulted in important suture zones. These are zones of crustal weakness, in comparison to the more rigid microcontinents in between them, and are therefore preferred structures to accommodate stress of subsequent deformation events. Located in the southern part of the CAOS, the Tien Shan zone (TSZ) (Kyrgyzstan, S. Kazakhstan and W. China) is dominated by east-west trending mountain ranges, often separated by large intramontane basins. The core of the northern Kyrgyz TSZ consists mainly of Ordovician-Silurian granitic batholiths, which were emplaced during closure of the Paleozoic Turkestan Ocean and the development of the ancestral TSZ (Allen et al., 1992; Yin and Harrison, 2000).
The TSZ was reactivated several times during its Late- and post-Paleozoic geological history and its inherited structural fabric played a major role in these reactivation episodes. A marked Late Triassic / Late-Jurassic reactivation of the TSZ is interpreted as a distal effect of the closure of the Paleo-Tethys Ocean between the Mesozoic active Southern Eurasian margin and several peri-Gondwana microcontinental blocks (Pamir, Qaidam, Lhasa, Qiangtang). The ensuing Cimmerian orogeny propagated stress far into the continental crust along the aforementioned Paleozoic structures and reactivated even distant mobile belts such as the TSZ. At present, the TSZ is again reactivated. The driving force for this Neogene to current deformation is thought to be the continuous indentation of the Indian plate into Eurasia. This vast collision is responsible for the building of the modern TSZ as a mainly transpressive intracontinental orogen (De Grave et al., 2007).
As outlined in De Grave et al. (2008, this volume), the lateral variation of our apatite fission track (AFT)-ages in the TSZ, can be explained in terms of the large scale structural framework: the TSZ was reactivated as a large scale transpressive flower structure (Figure 1). In this work, we
take a closer look to this AFT-dataset and therefore we zoom in on three North-South profiles in the central part of the Kyrgyz TSZ. We focused on the central part because it accommodates most of the strain and deformation and therefore it provides us with the most information on the amount of differential fault movement and associated denudation. The investigated profiles cover a narrow East-West oriented area between 74° E and 77°30’ E longitude, crossing the Djumgal, Moldo and Terskey Range (Figure 1). In total, we analysed 15 samples with AFT ages (reported as ζ-ages) between 160 Ma and 35 Ma (Late Jurassic to Eocene) (Table 1).
To evaluate the differences in AFT-ages, we plotted our sample locations on a simplified geological map, showing the structural framework of the study area (Figures 1 and 2). The cross-sections under each map are schematic profiles along a North-South transect through the area and the core of the flower structure. They indicate that the Precambrian metamorphic basement was elevated along North-South fan-shaped thrust faults. For a non-tectonically exhumed igneous body, we expect older ages at higher elevations. However, in this case, this trend is disturbed by fault movements. Specifically, concave reverse faults are responsible for the movements of small tectonic blocks.
In addition, because of the curved fault geometry, these small blocks have rotated during thrust movement. As a consequence, the AFT-ages are younger than expected at higher elevations. In some cases, the age-elevation plot is even inverse, with younger ages at higher elevations (Figure 2).
On the samples that contained sufficient confined tracks (n > 40) for length measurements, we performed a numerical thermal history modelling, using the AFTSolve program (Ketcham et al., 2000) and the Laslett et al. (1987) annealing-equations. Most of the models were consistent, suggesting a three to four-stage Meso-Cenozoic thermal history for the Tien Shan samples (Figure 3). The first observed cooling phase was recorded from the Middle/Late Jurassic (~180-140 Ma) until the Early Cretaceous (140-110 Ma). The exact time and duration depend on the specific location and altitude of the samples. This was followed by a period of thermal stability or slow cooling in the Late Cretaceous / Paleogene. A Late Cenozoic phase of rapid cooling from ~10-3 Ma brought the rocks to surface temperatures at their present outcrop position. Some samples underwent a Late Oligocene / Early Miocene (~25-15 Ma) reheating event, which forced the rocks back to APAZ temperatures of 50 °C to 100 °C. In some cases, these last features in the modelled tT-paths represent a well-known modelling artefact. However, in other cases, it can be shown that these Cenozoic tT-paths correspond to actual geological events (De Grave et al., 2008, this volume).

In Garver, J.I., and Montario, M.J. (eds.), Proceedings from the 11th International Conference on thermochronometry, Anchorage Alaska, Sept. 2008. 104
Figure 1: (above) Overview map of the sampled areas and their location on the tectonic flower structure (De Grave et al., 2008). (below) Simplified geological map of the easternmost transect, accompanied by a sketch of the depth-profile, based on Geologial maps of Kyrgyzstan 1:200.000 (1965); Thompson et al. (2002); Buslov et al. (2003).
Djumgal Moldo
Terskey
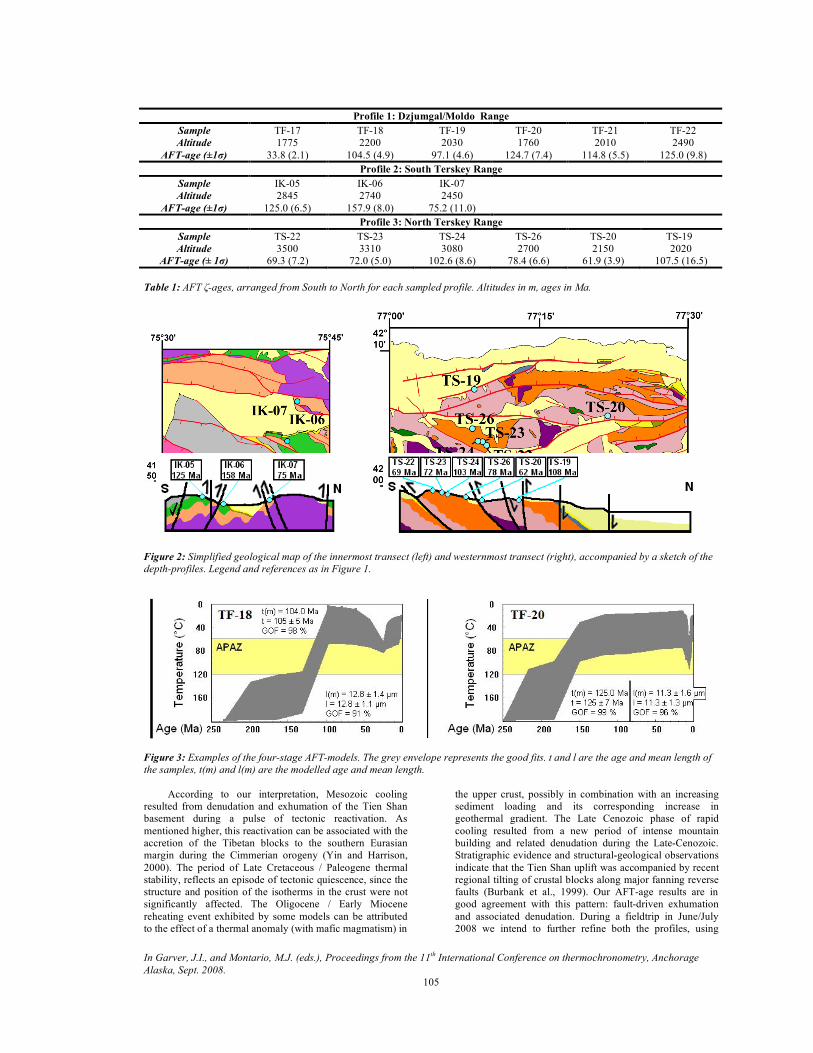
In Garver, J.I., and Montario, M.J. (eds.), Proceedings from the 11th International Conference on thermochronometry, Anchorage Alaska, Sept. 2008. 105
Profile 1: Dzjumgal/Moldo Range
Sample TF-17 TF-18 TF-19 TF-20 TF-21 TF-22 Altitude 1775 2200 2030 1760 2010 2490
AFT-age (±1σ) 33.8 (2.1) 104.5 (4.9) 97.1 (4.6) 124.7 (7.4) 114.8 (5.5) 125.0 (9.8) Profile 2: South Terskey Range
Sample IK-05 IK-06 IK-07 Altitude 2845 2740 2450
AFT-age (±1σ) 125.0 (6.5) 157.9 (8.0) 75.2 (11.0) Profile 3: North Terskey Range
Sample TS-22 TS-23 TS-24 TS-26 TS-20 TS-19 Altitude 3500 3310 3080 2700 2150 2020
AFT-age (± 1σ) 69.3 (7.2) 72.0 (5.0) 102.6 (8.6) 78.4 (6.6) 61.9 (3.9) 107.5 (16.5) Table 1: AFT ζ-ages, arranged from South to North for each sampled profile. Altitudes in m, ages in Ma. Figure 2: Simplified geological map of the innermost transect (left) and westernmost transect (right), accompanied by a sketch of the depth-profiles. Legend and references as in Figure 1.
Figure 3: Examples of the four-stage AFT-models. The grey envelope represents the good fits. t and l are the age and mean length of the samples, t(m) and l(m) are the modelled age and mean length.
According to our interpretation, Mesozoic cooling resulted from denudation and exhumation of the Tien Shan basement during a pulse of tectonic reactivation. As mentioned higher, this reactivation can be associated with the accretion of the Tibetan blocks to the southern Eurasian margin during the Cimmerian orogeny (Yin and Harrison, 2000). The period of Late Cretaceous / Paleogene thermal stability, reflects an episode of tectonic quiescence, since the structure and position of the isotherms in the crust were not significantly affected. The Oligocene / Early Miocene reheating event exhibited by some models can be attributed to the effect of a thermal anomaly (with mafic magmatism) in
the upper crust, possibly in combination with an increasing sediment loading and its corresponding increase in geothermal gradient. The Late Cenozoic phase of rapid cooling resulted from a new period of intense mountain building and related denudation during the Late-Cenozoic. Stratigraphic evidence and structural-geological observations indicate that the Tien Shan uplift was accompanied by recent regional tilting of crustal blocks along major fanning reverse faults (Burbank et al., 1999). Our AFT-age results are in good agreement with this pattern: fault-driven exhumation and associated denudation. During a fieldtrip in June/July 2008 we intend to further refine both the profiles, using

In Garver, J.I., and Montario, M.J. (eds.), Proceedings from the 11th International Conference on thermochronometry, Anchorage Alaska, Sept. 2008. 106
structural observations and our existing AFT-data-set. Using a sampling strategy at a higher spatial resolution, we will further enhance this dataset. In this way, we will be able to add more information to our model, which will lead to a better understanding of the Meso-Cenozoic tectonic evolution of the TSZ. References Allen, M.B., Windley, B.F., Zhang Chi (1992). Palaeozoic collisional
tectonics and magmatism of the Chinese Tien Shan, Central Asia. Tectonophysics, 220, 89-115.
Burbank, D.W., McLean, J.K., Bullen, M., Abdrakhmatov, K.Y., Miller, M.M. (1999). Partitioning of intramontane basins by thrust related folding, Tien Shan, Kyrgyzstan. Basin Research, 11, 75-92.
Buslov, M.M., Klerkx, J., Abdrakhmatov, K., Delvaux, D., Batalev, V. Yu., Kuchai, O.A., Dehandschutter, B., Muraliev, A. (2003). Recent strike-slip deformation of the northern Tien Shan. In: Storti, F., Holdsworth, R.E., Salvini, F. (Eds). Intraplate Strike-Slip Deformation Belts. Geological Society London, Special Publication, 210, 53-64.
De Grave, J., Buslov, M.M., Van den haute, P. (2007). Distant effects of India-Eurasia convergence and Mesozoic intracontinental deformation in Central Asia: Constraints from apatite fission-track thermochronology. Journal of Asian Earth Sciences, 29 (2-3), 188-204.
De Grave, J., Buslov, M., Glorie, S., Stockli, D., Batalev, V., Van den haute, P. (2008). Timing of Tethyian subduction and Tibetan
collisions revealed by punctuated Triassic to Cretaceous reactivation of the Tien Shan orogen and Cenozoic exhumation as a far-field response to India-Eurasia convergence. This volume.
Dobretsov, N.L., Buslov, M.M., Delvaux, D., Berzin, N.A., Ermikov, V.D. (1996). Meso- and Cenozoic tectonics of the Central Asian mountain belt: effects of lithospheric plate interaction and mantle plumes. International Geology Review, 38, 430-466.
Geological maps of Kyrgyzstan, 1:200.000. (1965). Ministry of Geology of the USSR and Kyrgyz Academy of Sciences, sheets K43-15, K43-18, K43-21, K43-22.
Ketcham, R.A., Donelick, R.A., Donelick, M.B. (2000). AFTSolve: A program for multi-kinetic modeling of apatite fission-track data. Geological Materials Research, 2 (1), 1-32.
Laslett, G.M., Green, P.F., Duddy, I.R., Gleadow, A.J.W. (1987). Thermal annealing of fission tracks in apatite. 2. A quantitative analysis. Chemical Geology (Isotopes Geoscience Section), 65, 1-13.
Şengör, A.M.C., Natal’in, B.A., Burtman, V.S. (1993). Evolution of the Altaid tectonic collage and Palaeozoic crustal growth in Eurasia. Nature, 364, 299-307.
Thompson, S.C., Weldon, R.J., Rubin, C.M., Abdrakhmatov, K., Molnar, P., Berger, G.W. (2002). Late Quaternary slip rates across the central Tien Shan, Kyrgyzstan, central Asia. Journal of Geophysical Research, 107 B9, 32 pp.
Yin, A., Harrison, T.M. (2000). Geological evolution of the Himalayan-Tibetan orogen. Annual Review in Earth and Planetary Sciences, 28, 211-280.

In Garver, J.I., and Montario, M.J. (eds.), Proceedings from the 11th International Conference on thermochronometry, Anchorage Alaska, Sept. 2008. 107
DIFFERENTIAL EXHUMATION OF THE EXTERNAL CRYSTALLINE MASSIFS IN THE WESTERN AND CENTRAL ALPS: CONSTRAINTS FROM THE MONT BLANC AND
GOTTHARD TUNNELS
Glotzbach, C.1, Reinecker, J.1, Danišík, M.1, Rahn, M.2, Frisch, W.1 & Spiegel, C.3 1Institute of Geoscience, University of Tübingen, Germany, e-mail: [email protected] 2Institute of Mineralogy-Geochemistry, University of Freiburg, Germany 3FB 5 – Geosciences, University of Bremen, Germany
Two transects along deep tunnels (Mont Blanc and Gotthard) and corresponding surface profiles were sampled in the external crystalline massifs (ECM) of the Mont Blanc, Gotthard and parts of the Aar massif (Fig. 1). Samples were dated with the ZFT, AFT and AHe method. The resulting two-dimensional sample transects along the tunnels were used to derive lateral and temporal differences in exhumation rates. The exhumation histories were compared with estimates for adjacent regions and used to investigate the impact of climatic and tectonic forcing on the evolution and exhumation of the Alpine orogen.
Tunnel and corresponding surface samples form
horizontal and vertical sample profiles are interpreted by
means of age-elevation profiles (Fig. 2), replenished by thermal modeling suggesting different exhumation histories for the two transects:
(1) Exhumation of the central Aar and Gotthard massif was fast at ~15 Ma (~1.0 km/Myr) and continuously decreased to moderate rates. Since ~9 Ma, the central Aar and Gotthard massifs are exhumed at a steady rate ~0.5 km/Myr. (2) Exhumation of the Mont Blanc massif was episodic, with rapid exhumation before ~6.5 Ma (~2.5 km/Myr), followed by slow exhumation and again fast exhumation after ~3 Ma (>1 km/Myr).
Figure 1: Geological sketch map of the NW Alps and generalized geological profiles of the tunnel transects with sample locations.

In Garver, J.I., and Montario, M.J. (eds.), Proceedings from the 11th International Conference on thermochronometry, Anchorage Alaska, Sept. 2008. 108
Figure. 2: AER plots of ZFT, AFT and AHe data from the Gotthard and Mont Blanc transects (Glotzbach et al. 2008a).
Comparing these exhumation rates with those derived from other external massifs (Fig. 3) clear differences and similarities of their exhumation histories are visible: (1) Rapid exhumation around ~6.5 Ma is observed only in the Mont Blanc massif, which was probably caused by thrusting. (2) All external massifs are characterized by moderate exhumation rates (~0.5 km/Myr) between 6 and 4-3 Ma, demonstrating that exhumation of the external massifs at that time was not accelerated by climate and/or tectonics. Therefore, processes such as the Messinian base level drop at 5.5 Ma (Krijgsman et al., 2002) and the intensification of the Atlantic Gulf Stream at 4.6 Ma (Haug et al., 2005), which may have led to an increase in precipitation in the Alps, did not accelerate exhumation in the external massifs. (3) Except the central Aar and Gotthard massifs all other massifs show a nearly contemporaneous increase in exhumation rates around 3 Ma, which we explain by both
tectonic and climatic forces. Normal faulting along the Rhône-Simplon Fault in the SW Aar massif led to tectonic denudation, which may be related to the change from orogen-parallel to orogen-perpendicular extension of the Alps (Reinecker et al., this volume). A change toward cooler and more variable climate and initiation of Northern Hemisphere glaciation since ~3 Ma may have caused higher rates of erosion, exhumation and uplift. We suggest that acceleration of exhumation rates in the Mont Blanc massif at ~3 Ma was caused by this climate change, whereas the central Aar and Gotthard massifs were not significantly influenced by these tectonic and climate changes. In addition, we conclude that the observed increase in sediment flux to the Alpine forelands around 5 Ma cannot be explained by accelerated exhumation and erosion of the external massifs (Fig. 3). Instead we suggest that the main erosion period of the external crystalline massifs started at ~3 Ma.
Figure 3: Exhumation history of the external massifs for the last 8 Myr and contemporaneous geodynamic events (from Glotzbach et al. 2008a). Exhumation histories are deduced from thermochronological data of different authors: Mont Blanc (Glotzbach et al., 2008a), SW Aar (Reinecker et al., this volume), Gotthard (Glotzbach et al., 2008b), Argentera (Bogdanoff et al., 2000), Pelvoux (Seward et al., 1999), Belledone (Lelarge, 1993). Note that the given exhumation history owns an error in age of ±0.5 Ma (average 1σ error of used AFT ages). Timing of geodynamic events are: MSC (Messinian salinity crisis) (Krijgsman et al., 2002), Jura folding (Becker, 2000), orogen-perpendicular extension and normal faulting (Fügenschuh and Schmid, 2003; Sue et al., 2007), Alpine glaciation (e.g., Muttoni et al., 2003), increase in the Atlantic Gulf Stream (Haug et al., 2005), increased sediment flux to forelands (Kuhlemann, 2000).

In Garver, J.I., and Montario, M.J. (eds.), Proceedings from the 11th International Conference on thermochronometry, Anchorage Alaska, Sept. 2008. 109
Thermochronological data from the Lötschberg tunnel and from the Simplon tunnel are presented by Reinecker et al (this volume) and Pignalosa et al (this volume), respectively, in addition estimations about the shape of palaeo-isotherms along these tunnel transects are presented by Spiegel et al. (this volume). References Becker A. (2000): The Jura Mountains - an active foreland fold-and-
thrust belt?, Tectonophysics, 321: 381-406. Bogdanoff S., A. Michard, M. Mansour and G. Poupeau (2000):
Apatite fission track analysis in the Argentera massif: evidence of contrasting denudation rates in the External Crystalline Massifs of the Western Alps, Terra Nova, 12: 117-125.
Fügenschuh B. and S. M. Schmid (2003): Late stages of deformation and exhumation of an orogen constrained by fission-track data: A case study in the Western Alps, Geol. Soc. Am. Bul., 115: 1425-1440.
Glotzbach C., J. Reinecker, M. Danišík, M. Rahn, W. Frisch and C. Spiegel (2008a): Neogene exhumation history of the Mont Blanc massif, Western Alps. – Tectonics, doi:10.1029/2008TC002257, in press.
Glotzbach C., C. Spiegel, J. Reinecker, M. Rahn and W. Frisch (2008b): What perturbs isotherms? An assessment using fission track thermochronology and thermal modelling along the Gotthard transect, Central Alps. – in Lisker et al. (eds): Thermochronological methods: from paleotemperature constraints
to landscape evolution models, Geological Society of London, Special Publications, in press.
Haug G. H., A. Ganopolski, D. M. Sigman, A. Rosell-Mele, G. E. A. Swann, R. Tiedemann, S. L. Jaccard, J. Bollmann, M. A. Maslin, M. J. Leng and G. Eglinton (2005): North Pacific seasonality and the glaciation of North America 2.7 million years ago, Nature, 433: 821-825.
Krijgsman W., B.-V. M.-M., R. Flecker, F. J. Hilgen, T. J. Kouwenhoven, D. Merle, F. Orszag-Sperber and J.-M. Rouchy (2002): The onset of the Messinian salinity crisis in the Eastern Mediterranean (Pissouri Basin, Cyprus), Earth Planet. Sci. Lett., 194: 299-310.
Kuhlemann J. (2000): Post-collisional sediment budget of circum-Alpine basins (Central Europe), Mem. Ist. Geol. Mineral. Univ. Padova, 52: 1-91.
Lelarge L. (1993): Thermochronogie par la méthode des traces de fission d'une marge passive (Dôme de Ponta Grossa, SE Brésil) et au sein d'une chaîne de collision (zone externe de l'Arc alpin, France), Unpublished thesis, Université Joseph Fourier, Grenoble.
Muttoni G., C. Carcano, E. Garzanti, M. Ghielmi, A. Piccin, R. Pini, S. Rogledi and D. Sciunnach (2003): Onset of major Pleistocene glaciations in the Alps, Geology, 31: 989-992.
Seward D., M. Ford, J. Burgisser, H. Lickorish, E. A. Williams and L. D. Meckel (1999): Preliminary results of fission-track analyses in the southern Pelvoux area, SE France, paper presented at 3rd Workshop on Alpine Geological Studies, Mem. Sci. Geol. Padova.
Sue C., B. Delacou, J. D. Champagnac, C. Allanic, P. Tricart and M. Burkhard (2007): Extensional neotectonics around the bend of the Western/Central Alps: an overview, Int. J. Earth Sci., 96: 1101-1129.

In Garver, J.I., and Montario, M.J. (eds.), Proceedings from the 11th International Conference on thermochronometry, Anchorage Alaska, Sept. 2008. 110
MICROPROBE ASSISTED ZONED ALPHA CORRECTIONS IN ZIRCON (U-TH)/HE CHRONOLOGY
Gombosi, D.J.1,2, Barbeau, Jr., D.L.2, Hourigan, J.K.3 & Zhao, D.2
1Department of Earth Sciences, Syracuse University, Syracuse, NY, 13244, [email protected] 2Department of Geological Sciences, University of South Carolina, Columbia, SC, [email protected] 3Department of Earth and Planetary Sciences, University of California Santa Cruz, Santa Cruz, CA 95060, [email protected]
Significant efforts have been made to reduce the often-large scatter that occurs in (U-Th)/He age measurements. One possibility for poor reproducibility of ages is caused by zonation of U and Th within crystals. Standard α-ejection correction (Farley et al., 1996; Farley, 2002; Reiners, 2005) assumes homogenous compositions of Th and U within a given crystal when accounting for the quantity of 4He lost through α-ejection. Hourigan et al. (2005) used numerical modeling to demonstrate that depleted or enriched zones of Th and U cause significant variation in He ages, and demonstrated the applicability of laser-ablation inductively coupled plasma mass-spectrometry (LA-ICP-MS) to measure the Th and U concentrations and distributions in zoned zircons in order to correct their ages.
We continue work based upon the model of Hourigan et al. (2005) by adapting the technique for electron microprobe analysis (EMPA). Although EMPA has inferior precision and detection limits when compared to ICP-MS, EMPA has several advantages: LA-ICP-MS instrumentation is expensive and often dedicated to specific analytical systems, whereas many institutions have the use of EMPA for other geologic investigations. EMPA is non-destructive, whereas LA-ICP-MS delivers significant damage to the grain. EMPA can analyze a wide variety of secondary elements simultaneously if additional geochemical work is desired.
In this study, the relevant dimensions of studied igneous zircons were measured prior to mounting. After polishing, target zircons were imaged using X-ray mapping and cathode luminescence (CL). Both qualitative mapping methods provided a guide for directing quantitative line-scan assessment of the grains yet some studied zircons had U or Th concentrations below EMPA X-ray mapping detection limits and/or insufficient contrast between rim and core thus
CL imaging was primarily used as a guide rather than X-ray mapping. Using quantitative wavelength dispersive spectrometry (WDS) U and Th concentration profiles were then acquired parallel to the C-axis on the target grains. Using the CL maps as a guide, zones of U and Th perpendicular to the C-axis were identified and values assigned to them based upon the measured zoned values from the WDS scan. Under the assumption of symmetric zonation about the C-axis, a rim-to-rim C-axis-perpendicular profile was developed for use as a proxy depth profile. Grains were removed from the mounting medium and re-measured to allow calculation of the post-polishing surface area to volume ratio (β). Each grain was then analyzed with standard (U-Th)/He degassing and dissolution procedures. Using the new β value and synthetic depth profiles of Th and U, the Hourigan et al. (2005) model was then employed to apply the zoned α-ejection correction to these raw ages. References Farley, K.A.., 2002, (U-Th)/He dating: techniques, calibrations, and
applications: in Porcelli, D., Ballentine, C.J., and Wieler, R. (Eds.), Noble Gasses In Geochemistry and Cosmochemistry, Reviews in Mineralogy and Geochemistry, v. 47, p.819-844.
Farley, K.A., Wolf, R.A., and Silver, L.T., 1996, The effects of long alpha-stopping distances on (U-Th)/He ages: Geochimica et Cosmochimica Acta, v. 60, no. 21, p.4223-4229.
Hourigan, J.K., Reiners, P.W., and Brandon, M.T., 2005, U-Th zonation-dependent alpha-ejection in (U Th)/He chronometry: Geochimica et Cosmochimica Acta, v. 69, no. 13, p.3349-3365.
Reiners, P.W., 2005, Zircon (U-Th)/He Thermochronometry: in Reiners, P.W. and Ehlers, T.A. (Eds.), Low-Temperature Thermochronology: Techniques, Interpretations, and Applications, Reviews in Mineralogy and Geochemistry, v. 58, p.151-176.

In Garver, J.I., and Montario, M.J. (eds.), Proceedings from the 11th International Conference on thermochronometry, Anchorage Alaska, Sept. 2008. 111
LOW-TEMPERATURE THERMOCHRONOLOGY, EXHUMATION, AND LONG-TERM LANDSCAPE MORPHOGENESIS IN THE WESTERN
CANTABRIAN MOUNTAINS, NW SPAIN Grobe, R.1, Alvarez-Marrón, J.2, Glasmacher, U. A.1 & Menéndez-Duarte, R.3 1Institute of Geosciences, University of Heidelberg, Im Neuenheimer Feld 234, 69120 Heidelberg, Germany, contact:
[email protected] 2Earth Sciences Institute, CSIC, Barcelona, Spain 3INDUROT, University of Oviedo, Spain
Recently questions concerning the manner of morphogenesis of landforms is controlled by the coupling of exogenic and endogenic processes and in what way low-thermochronology can contribute to unravel them has been the issue of many research efforts (Beaumont et al. 2000; Braun 2002; Burbank and Anderson 2001; Burbank 2002; Ehlers and Farley 2003; Ehlers 2005; Braun et al. 2006). The present study aims to quantify the complex post-orogenic history of cooling, denudation, and exhumation of a Variscan crustal segment, exemplified by the Cantabrian Mountains (Fig. 1).
The substratum of the Cantabrian Mountains (Fig. 2), that are located in NW Spain, in the western continuation of the Pyrenees, represents the eroded relict of a mountain range built during the Variscan orogeny (Perez-Estaun et al. 1991), and that had been possibly peneplained by the Permian-Triassic. In the Mesozoic, this region was modified by rifting and opening of the Bay of Biscay, while in Paleogene-Neogene times it was affected by the convergence of the
Iberian Plate with the Eurasian Plate. The long-term history of formation of the present topography with maximum heights of up to 2,648 m is not well established and is the subject of current research.
The study area is characterized by diverse morphologies. On the one hand there is a sector with long wavelength topography and low amplitudes that is used to distinguish the rate of landform evolution, in terms of an increase or a decrease in relief. On the other hand, there is another sector with short wave length topography and abrupt relief, due to deeply incised river valleys, that is used to determine exhumation rates.
Low-temperature thermochronology, i.e. apatite fission-track (AFT) dating, modelling of time-temperature (t-T) paths are used to constrain the post-Variscan exhumation history. Furthermore, the thermochronological data will be utilised to determine the long-term landscape evolution by 3-D thermokinematic modelling with Pecube (Braun 2002).
Figure 1: The study area, NW Spain.

In Garver, J.I., and Montario, M.J. (eds.), Proceedings from the 11th International Conference on thermochronometry, Anchorage Alaska, Sept. 2008. 112
Figure 2: Geological map of the area with apatite fission-track ages. (map modified after “Mapa geológico de Espana, 2004”)

In Garver, J.I., and Montario, M.J. (eds.), Proceedings from the 11th International Conference on thermochronometry, Anchorage Alaska, Sept. 2008. 113
The study is based on an overview sampling of 21 samples taken within specified intervals over the entire area (Fig 2). AFT ages range from 247 (±27) Ma (Permian) to 78 (±4) Ma (Late Cretaceous). The age-elevation relationships show negative slopes that are indicative of a decrease in relief (Braun 2002). Mean horizontal confined track lengths vary between 10.4 (±1.8) µm and 12.8 (±1.8) µm. C-axis oriented etch pit diameters range from 1.3 (±0.2) µm to 1.6 (±0.2) µm. The time-temperature (t-T) paths for selected samples were modelled by applying the computer code HeFTy with independent geological constraints. References Beaumont, C., Munoz, J.A., Hamilton, J., and Fullsack, P., 2000.
Factors controlling the Alpine evolution of the central Pyrenees inferred from a comparison of observations and geodynamical models, Jour. Geophysical Research, 105, 8121-8145.
Braun, J., 2002a. Quantifying the effect of recent relief changes on age-elevation relationships. EPSL 200, 331-343.
Braun, J., 2002b. Estimating exhumation rate and relief evolution by spectral analysis of age–elevation datasets. Terra Nova 14, 210–214.
Braun, J., 2003. Pecube: a finite-element code to solve the 3D heat transport equation including the effect of a time-varying, finite amplitude surface topography. Computers & Geosciences 29, 787-794.
Braun, J., 2006. Recent Advances and Current Problems in Modelling Surface Processes and their Interactions with Tectonics and Crustal Deformation. Buiter, S.J.H. and Schreurs, G. eds. Analog and Numerical Modelling of Crustal-scale Processes, Special Publication of the Geological Society of London, v. 253, pp.307–325.
Burbank, D.W., and Anderson, R.S., 2001, Tectonic Geomorphology: Blackwell Scientific, Oxford, 270 p.
Burbank, D.W., 2002, Rates of erosion and their implications for exhumation: Mineralogical Magazine, Vol. 66(1), pp. 25-52.
Ehlers, T.A., Farley, K.A., 2003 (Invited), Apatite (U-Th)/He Thermochronometry: methods and applications to problems in tectonics and surface processes, EPSL-Frontiers, v. 206, p. 1-14.
Ehlers, T.A., 2005, Crustal thermal processes and thermochronometer interpretation. Reviews in Mineralogy and Geochemistry, v. 58, p. 315-350.
Pérez-Estaún, A., Martinez-Catalán, J.R. and Bastida, F. (1991). Crustal thickening and deformationsequence in the footwall to the suture of the Variscan belt of northwest Spain. Tectonophysics, 191, p. 243-253.

In Garver, J.I., and Montario, M.J. (eds.), Proceedings from the 11th International Conference on thermochronometry, Anchorage Alaska, Sept. 2008. 114
TECTONIC REACTIVATION OF THE SOUTH-ATLANTIC MARGIN, SOUTHEASTERN BRAZIL, DURING THE PALEOGENE TIME: APATITE FISSION
TRACK ANALYSIS AND (U-TH)/HE SYSTEMATICS Hackspacher1, P.C., Saad, A.R.2, Ribeiro, M.C.S.1, Godoy, D.F.1 & Hadler Neto, J.C.3
1Institut of Geosciences and Earth Sciences, State University of São Paulo, 13506-900, Rio Claro, SP, Brazil ([email protected],
[email protected], [email protected] ) 2Institute of Applied Geology, University of São Paulo State, 13506-900, Rio Claro, SP, Brazil ([email protected]) 3Institute of Physics, University of Campinas, 13081-970, Campinas, SP, Brazil ([email protected])
Abstract
The South American Platform at the southeastern Brazilian coastline suffered different tectonic imprint during the Phanerozoic, before, during and after the South-Atlantic break-up. Since the Lower Cretaceous different geological and geomorphological processes/features were printed: the Paraná flood basalts, alkaline intrusions, Cretaceous and Eocen sedimentary basins, uplift related to crustal heating and tectonic denudation. Between the Lower Paleogene and the Miocene a strong NW-SE crustal extension fragmented Precambrian terranes 2000 km along the Brazilian coastline, between Rio de Janeiro and Porto Alegre forming asymmetric horst and graben structures.
Apatite Fission Track Thermochronology and (U-Th)/He systematics are presented to model the tectonic evolution during the Paleogene. Boths methods shows a distribution of values around 65-60 Ma along the southeastern Brazilian coastline with a strong relation to the Continental Rift of Southeastern Brazil (CRSB).
Introduction The Phanerozoic geological and geomorphological
history of the southern border of the São Francisco Craton (SFC) and Ribeira Belt (Almeida et al. 1977) (Fig.1) can be
associated to: i) subsidence of the Paraná basin with uplift of the borders; ii) tectono-magmatic reactivations; iii) opening of the South Atlantic; iv) Mesozoic and Cenozoic rifts e; v) Quaternary uplift associated the neotectonics reactivations (Hackspacher et al. 2007).
During the Cretaceous and later, the West Gondwana Paleocontinent suffered a polycyclic history not well understood. Precambrian rocks of these entities are marked through reliefs surrounding the southern border of the SFC with important brittle tectonic and geomorphological features related to different epochs, example of extensive plateau uplift in relation to the sea level (Atlantic Plateau).
Between the Mantiqueira and the Serra do Mar Mountain range (Fig. 1) Eocene sediments were deposit along NE-SW structures, 2000km along segmented small basins, denominated as Continental Rift of Southeastern Brazil (CRSB) (Riccomini, 1989), extending until the offshore.
The southeastern Brazilian coastline was studied through geological and geomorphological remarks and modeled by apatite fission track ages distribution (Fig.2) and (U-Th)/He systematic. The relation between geological aspects, relief and thermal anomalies permits recognize tectonic brittle features associated to the deformations in the lithosphere during the Paleogene.
Figure 1: Regional geologic context of the Continental Rift of Southeastern Brazil (CRSB). 1) Early Cretaceous tholeiitc volcanic rocks of the Serra Geral Formation; 2)Paleozoic sedimentary rocks of the Paraná Basin; 3)Precambrian basement rocks; 4) Cenozoic basins of the CRSB (1- Itaboraí Basin, 2-Barra de São João Graben, 3-Macacu Basin, 4-Volta Redonda basin, 5- Resende Basin, 6-Taubaté Basin, 7-São Paulo Basin, 8-Sete Barras Graben, 9-Pariqüera-Açu Formation, 10-Alexandra Formation and Guraqueçaba Graben, 11- Curitiba Basin, 12-Cananéia Graben); 5) Precambrian shear zones; 6) Mesozoic to Cenozoic alkaline rocks, Poços de Caldas Massif. After Melo et al. (1985).

In Garver, J.I., and Montario, M.J. (eds.), Proceedings from the 11th International Conference on thermochronometry, Anchorage Alaska, Sept. 2008. 115
Methodology Apatite Fission-track Analysis
The apatite grains were concentrated, polished, etched to reveal spontaneous fission tracks. The apatite mounts were covered with muscovite sheets for fission track themochronology using External Detector Method. Fast thermal neutron irradiations were performed in IPEN/CNEN – Nuclear Reactor – São Paulo, Brazil. Th-films and natural U-doped glasses were used, as described in (Iunes et al., 2002). The muscovite sheets were etched in order to reveal the induced fission-tracks. Analysis of spontaneous and induced fission tracks were counted thorough out the methods outlined in Hadler Neto et al. (2001) and Tello (1998). The apatite fission-track ages were calculated using the methods proposed by Wagner & Van den Haute (1992). The 238U spontaneous fission decay constant ( λf = (8,37±0,17)x10-17a-1) used in our equation was carried out by Guedes et al. (2003) using neutron dosimetry based on natural U thin films (Iunes et al., 2002). The corrected ages were obtained using the two-parameter equation given by Guedes et al. (2004). Throughout this method, a kinetic model is developed to describe the relationship between fission-track mean diameter shortening and surface fission-track density reduction in samples with thermal overprint. The thermal history modelling was performed using the software THA (Thermal History Analysis), developed by
Hadler Neto al. (2001). This software is based on the theorical models developed by Green et.al. (1986), Laslett et al. (1987) and Duddy et al. (1988), modified by Tello (1994). This code generates randomly thermal histories through Monte Carlo boxes, whose t-T limits are time-temperature intervals previously defined by geological hypothesis. Each thermal history has the own theorical fission-track length histogram and within the χ2 test it is compared with the experimental histogram. Whenever the χ2 test succeeds the thermal history is originated and it is kept by the software in a text file (*.dat), plotted in a curve using any statistical software (eg. Origin®, Excel®). This procedure is repeated as many as necessary and it is defined by the user. The used data are partially found in Hackspacher et al. (2007). The Apatite Fission Track Ages Distribution Map
The Apatite Fission Track Ages Distribution Map (Fig.2) was calculated up corrected apatite fission track ages. The forms of representation and the methodology were based on the works on global reference systems of Braghin & Silva (1996) and Silva (1999).
The map was obtained using topographical sheets 1:250.000, gotten through the ARCVIEW software using a specifically projected method of interpolation to create digital land models (Hackspacher et al. 2007).
Figure 2: Map showing the distribution of Apatite Fission Track Ages

In Garver, J.I., and Montario, M.J. (eds.), Proceedings from the 11th International Conference on thermochronometry, Anchorage Alaska, Sept. 2008. 116
(U-Th)/He Systematics The (U-Th)/He systematics is based on the production of the
4He during U and Th series decay. Partial diffusive loss of helium from apatite occurs over temperatures of ~40-90ºC (Wolf et al. 1997). This temperature range, termed the “helium partial retention zone” (PRZ) can be used as a base for denudation estimation (e.g. House et al. 1998, House et al. 2000, Stöckli et al. 2000). Thus (U-Th)/He thermochronology extends sample cooling histories to lower temperatures than fission tracks analysis alone and can provide checks on thermal histories derived from fission track-lengths models. For the (U-Th)/He ages we used the analytical procedures used at the Kansas University, Lawrence (USA) and analysis done by Prof. Dr. Daniel Stöckli.
Results The fission track ages (Fig.2) are heterogeneous distributed,
but indicates the existence of NE-SW trend around the Taubaté Basin at 65 Ma. The NE-SW alignment between the Mantiqueira and the Serra do Mar Mountain range detaches the sharp change between ages of 120 (West) and 65 Ma (East), correlate to the east side of CRSB (Riccomini 1989), extending until the offshore. The relief associated to age distribution, shows a morphotectonic control with evidences of active elements in the nature that had conditioned the sedimentation and relieves associates to the tectonic uplift followed by erosive processes during the early Paleogene.
(U-Th)/He ages on apatite of gneisses and granitic rocks east of the Taubaté Basin register values around 60 Ma (Ribeiro, 2007) and reinforce the trend. Ages distribution demonstrates the thermal instability of the South American Platform in this region, reflecting the alternation of blocks with different histories (Tello et al. 2003, Hackspacher et al. 2004). Discussion and Conclusions
The correlation between the Apatite Fission Track ages map (Fig.2) and (U-Th)/He ages shows a distribution of values around 65-60 Ma east and west of the CRSB in contrast with older values south of the SFC. These younger ages mark a sharp limit, interpreted as a thermal marker in all the Southeastern Brazil. This epoch is correlated to an extensional tectonic with formation of brittle structures as horst and grabens. The beginning of the Paleogene was marked by processes of breaking of the South American Surface at the eastern part of the Mantiqueira Mountain range, with tectonic blocks in NE-SW direction as in the Serra do Mar Mountain range, among others. Chronocorrelates deposits are presented over all region. Younger apatite fission track ages can be explained through the association uplift/erosion, with values that reach around 3km.
Acknowledgements To the FAPESP, CNPq and Capes/DAAD (Grants 00/03960-5, 300785/2005-4 and 274/06 respectively) for the financial support.
References Almeida, F.F.M. de, Hasui, Y.,Brito Neves, B.B. de, Fuck, R.A. 1977. As
províncias estruturais brasileiras. In: SBG- Simpósio de Geologia do Nordeste, 8: 363-391.
Braghin, M.A. & Silva, A.B. 1996. Geração de zonas diferenciadas de proximidade em relação a dados estruturais. In: SBG, Congresso Brasileiro de Geologia, Anais, 39, 3: 57 – 61.
Duddy, I. R.; Green, P. F.; Laslett. 1988. Thermal annealing of fission tracks in apatite.2: Variable temperature behaviour, Chemical Geology (Isotope Geoscience Section), 73: 25 – 38.
Green, P.F., Duddy I.R., Gleadow A.J.W., Tingate, P.R. and Laslett, G.M., 1986. Thermal annealing of fission tracks in apatite, 1. A
quantitative description. Chemical Geology (Isot. Geosci. Sect.), 59: 237-253.
Guedes, S., Hadler N., J.C., Sarkis, J.E.S., Oliveira, K.M.G., Kakazu, M.H., Iunes, P.J., Saiki, M., Tello S., C.A., Paulo, S.R. 2003. Spontaneous-fission decay constant of 238U measured by nuclear track techniques without neutron irradiation. J. Radioanal. Nucl. Chem. 258: 117-122.
Guedes, S., Hadler N., J.C., Iunes, P.J., Tello, C.A. 2004. Kinetic model for the relationship between confined fission-track length shortening and fission-track age reduction in minerals. Nucl. Instr. Meth. B 217: 627-636.
Hackspacher, P.C., Godoy, D.F., Ribeiro, L.F.B., Hadler Neto, J.C., Franco, A.O.B. 2007. Modelagem Térmica e Geomorfologia da Borda Sul do Cráton de São Francisco: Termocronologia por Traços de Fissão em Apatita. Revista Brasileira de Geociências 37(4 - suplemento): 928-938.
Hackspacher, P.C., Ribeiro, L.F.B., Ribeiro, M.C.S., Fetter, A.H., Hadler Neto, J.C., S. Tello, C.A., Dantas, E.L. 2004. Consolidation and break – up of the South American platform in Southeastern Brazil: tectonothermal and denudation histories. Gondwana Research, 7: 91 – 101.
Hadler Neto, J.C., Paulo, S.R., Iunes, P.J., Tello S.C.A., Balestrieri, M.L., Bigazzi, G., Curvo, E.A.C., Hackspacher, P.C. 2001. A PC compatible Brazilian software for obtaining thermal histories using apatite fission track analysis. Radiation Measurements, 34: 149-154.
House, M.A., Farley, K.A., Stockli, D., 2000, Helium chronometry of apatite and titanite using Nd-YAG laser heating: Earth and Planetary Science Letters, 183: 365-368.
House, M.A., Wernicke, B.P., Farley, K.A., 1998. Dating topography of the Sierra Nevada, California, using apatite (U-Th)/He ages. Nature, 396: 66-69.
Iunes, P.J., Hadler N., J.C., Bigazzi, G., Tello S., C.A., Guedes, S., Paulo, S.R. 2002.Durango apatite fission-track dating using length-based age corrections and neutron fluence measurements by natural thorium thin films and U-doped glasses calibrated through natural uranium thin films. Chemical Geology. 187: 201-211.
Laslett, G.M., Kendall, W.S., Gleadow, A.J.W. and Duddy, I.R. 1987. Bias in measurement of fission -track length distributions. Nuclear Tracks, 6: 79-85.
Melo, M. S., Riccomini, C., Hasui, Y., Almeida, F.F. M., Coimbra, A.M. 1985. Geologia e evolução do sistema de bacias trafogênicas continentais do sudeste do Brasil. Revista Brasileira de Geociências 15: 193-201.
Ribeiro, M.C.S.2007. Termocronologia e história denudacional da Serra do Mar e implicações no controle deposicional da Bacia de Santos. Institut of Geosciences and Earth Sciences, State University of São Paulo. PhD-Thesis. 211 p.
Riccomini, C. 1989. O Rift Continental do Sudeste do Brasil. Institut of Geosciences, University of São Paulo. PhD Thesis. 256 p. Silva, A. 1999. Sistemas de Informações Geo-referenciadas: Conceitos e Fundamentos. Unicamp,1: 236.
Stöckli, D.F., Farley, K.A. and Dumitru, T.A., 2000, Calibration of the (U-Th)/He thermochronometer on an exhumed normal fault block in the White Mountains, eastern California and western Nevada. Geology, 28 (11): 983-986.
Tello Saenz, C.A. 1994. Termocronologia de algumas regiões brasileiras através da análise de traços de fissão em apatitas. Institute of Physics, University of Campinas. Master Thesis.103p.
Tello, C.A. S. 1998. Estudo de annealing de traços de fissão em apatitas, tanto em seções basais quanto em seções sem orientação preferencial, análise dos comprimentos dos traços de fissão. Institute of Physics, University of Campinas. PhD Thesis. 111p.
Tello, C.A. S., Hackspacher, P.C., Hadler, N.J.C., Iunes, P.J., Guedes, O.S., Paulo, S.R., Ribeiro, L.F.B. 2003. Recognition of Cretaceous, Paleocene and Neogeno Activities, Through AFTA, in Precambrian areas of The Southeast Brazil: Association with the South Atlantic Ocean Opening. Journal South American Earth Sciences, 15: 765-774.
Wagner, G. & Van Den Haute, P. 1992. Fission Track Dating. Kluwer Academic Publishers, 283 p.
Wolf, R.A., Farley, K.A., Silver, L.T., 1997. Assessment of Wolf, R.A., Farley, K.A., Silver, L.T., 1996. Helium diffusion and low temperature thermochronometry of apatite. Geochim. Cosmochim. Acta 60: 4231–4240.