Embed Size (px)
Citation preview

Degradation of Thiamethoxam via Photocatalysis: Kinetics, Mineralization, and Toxicity
A Major Qualifying Project Report Submitted to the Faculty of
WORCESTER POLYTECHNIC INSTITUTE
In partial fulfillment of the requirements for the Degree of Bachelor of Science, Chemical Engineering
Submitted By:
Melanie Laberge Rebecca Rollinson
Advised By:
Professor Terri Camesano Professor Marie-Noelle Pons
Submission Date:
April 25, 2013
Email:

ii
Acknowledgements
We would like to acknowledge Marie-Noelle Pons, Phillippe Arnoux, and Orfan Zahraa for their help and guidance while we were conducting our experiments in France. We would also like to acknowledge Terri Camesano and Robert Thompson for their help interpreting our data and developing our results. Lastly, we would like to thank Maroua Jguirim for helping us feel comfortable and welcome in France and at ENSIC.

iii
Abstract The goal of this project was to characterize the photocatalytic degradation of the pesticide
thiamethoxam and the effects of the additives ammonium nitrate, humic acid, and river water on
this degradation by measuring reaction kinetics, degree of mineralization, and toxicity.
Experimental results were obtained for these methods via high performance liquid
chromatography, total organic carbon (TOC) and total nitrogen (TN) analysis, and a lettuce test,
respectively. Reaction rate coefficients were found to be approximately 0.0054 min-1. Nearly all
samples decreased in TOC and increased in TN after degradation. Base thiamethoxam was
shown to increase in toxicity after degradation. Overall, humic acid was found to be the most
efficient additive for this reaction.

iv
Table of Contents Acknowledgements ......................................................................................................................... ii
Abstract .......................................................................................................................................... iii
Table of Contents ........................................................................................................................... iv
Table of Figures ............................................................................................................................. vi
Table of Tables ............................................................................................................................. vii
1.0 Introduction ............................................................................................................................... 1
2.0 Background ............................................................................................................................... 3
2.1 Pesticides ............................................................................................................................... 3
2.1.1 Thiamethoxam ................................................................................................................ 4
2.2 Treatment Techniques ........................................................................................................... 5
2.2.1 Advanced Oxidation Processes (AOPs) ......................................................................... 5
2.3 Heterogeneous Photocatalysis ............................................................................................... 7
2.3.1 Photocatalysis via TiO2 .................................................................................................. 8
2.3.2 Transformation Products ................................................................................................ 9
2.4 Enhancing Photocatalysis: Coupling Reactions and Additives........................................... 10
3.0 Methodology ........................................................................................................................... 11
3.1 Solution Preparations .......................................................................................................... 11
3.2 Reactor ................................................................................................................................ 12
3.3 Reactor Procedure ............................................................................................................... 13
3.4 Reactor Cleaning Procedure ................................................................................................ 14
3.5 Kinetic Rate Testing ............................................................................................................ 14
3.5.1 Sampling Procedure ...................................................................................................... 14
3.5.2 High Performance Liquid Chromatography ................................................................. 15
3.6 Mineralization Testing: Total Organic Carbon and Total Nitrogen .................................... 16
3.6.1 Total Organic Carbon and Total Nitrogen Test Procedure ........................................... 16
3.7 Toxicity Test Procedure ...................................................................................................... 16
4.0 Results and Discussion ........................................................................................................... 18
4.1 Kinetics Results ................................................................................................................... 18
4.2 Total Organic Carbon .......................................................................................................... 21
4.3 Total Nitrogen ..................................................................................................................... 22

v
4.4 Toxicity ............................................................................................................................... 24
5.0 Conclusions ............................................................................................................................. 26
5.1 Thiamethoxam ..................................................................................................................... 26
5.2 Additives ............................................................................................................................. 27
5.2.1 Ammonium Nitrate ....................................................................................................... 27
5.2.2 River Water ................................................................................................................... 27
5.2.3 Humic Acid................................................................................................................... 28
5.3 Future Work ........................................................................................................................ 28
Works Cited .................................................................................................................................. 29
Appendix A – Calibration Curves................................................................................................. 33
Appendix B – Proof of Concept.................................................................................................... 34
Appendix C – Efficiency of Reactor Cleaning ............................................................................. 36
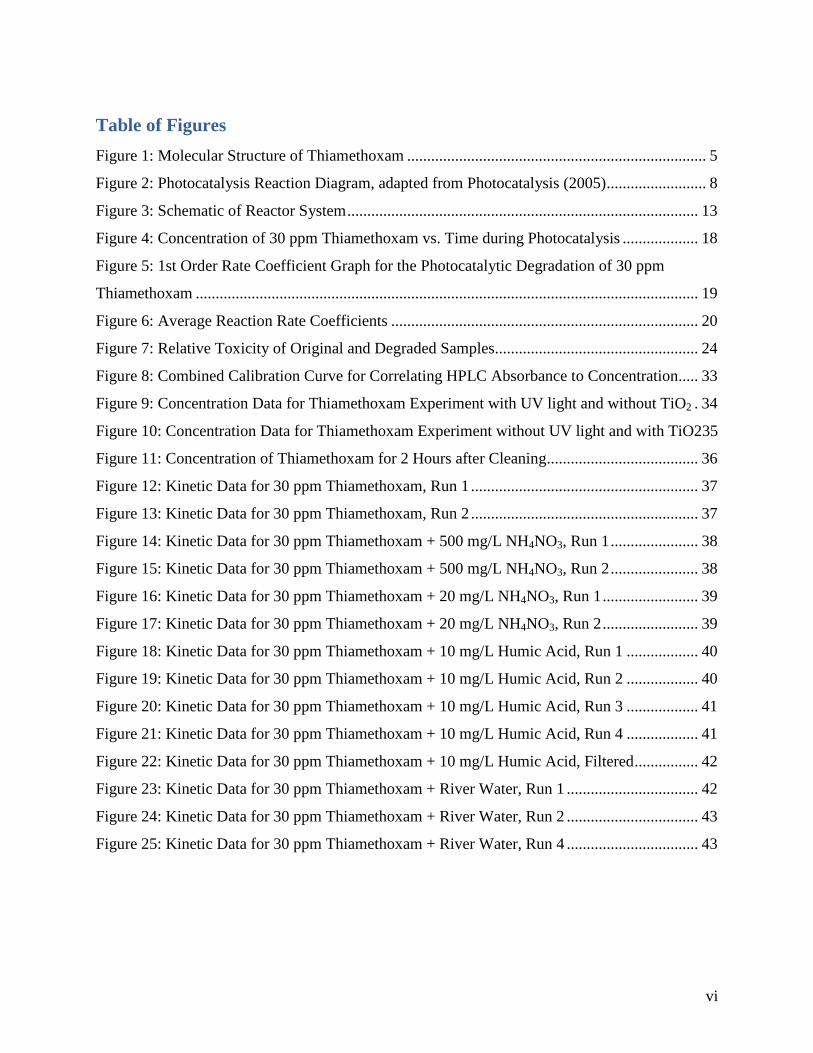
Appendix D – Kinetic Rate Results .............................................................................................. 37
Appendix E – Raw Data ............................................................................................................... 44
vi
Table of Figures Figure 1: Molecular Structure of Thiamethoxam ........................................................................... 5
Figure 2: Photocatalysis Reaction Diagram, adapted from Photocatalysis (2005) ......................... 8
Figure 3: Schematic of Reactor System ........................................................................................ 13
Figure 4: Concentration of 30 ppm Thiamethoxam vs. Time during Photocatalysis ................... 18
Figure 5: 1st Order Rate Coefficient Graph for the Photocatalytic Degradation of 30 ppm
Thiamethoxam .............................................................................................................................. 19
Figure 6: Average Reaction Rate Coefficients ............................................................................. 20
Figure 7: Relative Toxicity of Original and Degraded Samples ................................................... 24
Figure 8: Combined Calibration Curve for Correlating HPLC Absorbance to Concentration..... 33
Figure 9: Concentration Data for Thiamethoxam Experiment with UV light and without TiO2 . 34
Figure 10: Concentration Data for Thiamethoxam Experiment without UV light and with TiO235
Figure 11: Concentration of Thiamethoxam for 2 Hours after Cleaning ...................................... 36
Figure 12: Kinetic Data for 30 ppm Thiamethoxam, Run 1 ......................................................... 37
Figure 13: Kinetic Data for 30 ppm Thiamethoxam, Run 2 ......................................................... 37
Figure 14: Kinetic Data for 30 ppm Thiamethoxam + 500 mg/L NH4NO3, Run 1 ...................... 38
Figure 15: Kinetic Data for 30 ppm Thiamethoxam + 500 mg/L NH4NO3, Run 2 ...................... 38
Figure 16: Kinetic Data for 30 ppm Thiamethoxam + 20 mg/L NH4NO3, Run 1 ........................ 39
Figure 17: Kinetic Data for 30 ppm Thiamethoxam + 20 mg/L NH4NO3, Run 2 ........................ 39
Figure 18: Kinetic Data for 30 ppm Thiamethoxam + 10 mg/L Humic Acid, Run 1 .................. 40
Figure 19: Kinetic Data for 30 ppm Thiamethoxam + 10 mg/L Humic Acid, Run 2 .................. 40
Figure 20: Kinetic Data for 30 ppm Thiamethoxam + 10 mg/L Humic Acid, Run 3 .................. 41
Figure 21: Kinetic Data for 30 ppm Thiamethoxam + 10 mg/L Humic Acid, Run 4 .................. 41
Figure 22: Kinetic Data for 30 ppm Thiamethoxam + 10 mg/L Humic Acid, Filtered ................ 42
Figure 23: Kinetic Data for 30 ppm Thiamethoxam + River Water, Run 1 ................................. 42
Figure 24: Kinetic Data for 30 ppm Thiamethoxam + River Water, Run 2 ................................. 43
Figure 25: Kinetic Data for 30 ppm Thiamethoxam + River Water, Run 4 ................................. 43

vii
Table of Tables Table 1: Summary of Test Conditions .......................................................................................... 11
Table 2: Total Organic Carbon of Original and Degraded Samples ............................................. 21
Table 3: Total Nitrogen of Original and Degraded Samples ........................................................ 23

1
1.0 Introduction With 4.5 billion pounds of pesticides being applied in the United States annually, the use of these
chemicals, and the environmental impacts of doing so, are widespread (Weiss et. al, 2004). Once
introduced to a field, pesticides can leach into groundwater or collect in runoff, affecting local
drinking water and wildlife. As a result, many of the environmental impacts of these chemicals
are currently being investigated. One such chemical under investigation is thiamethoxam, a
relatively new pesticide, and the first second-generation neonicotinoid to enter the market.
Thiamethoxam is widely used because of its efficacy at low doses, variety of application
methods, and long half-life (Maienfisch et al, 2001). However, these characteristics also make
thiamethoxam an environmental concern, particularly because of its high toxicity to honeybees,
which can negatively impact the natural crop pollination process (Henry et al, 2012; Cresswell,
2011).
Due to the many hazardous side effects of pesticides in drinking water, scientists are currently
investigating several degradation methods. One of the most promising groups of methods being
studied is Advanced Oxidation Processes, or AOPs, which introduce hydroxyl radicals to the
system that unselectively attack organic molecules, mineralizing them into water and carbon
dioxide (Malato, 2002). Photocatalysis is an AOP that uses ultraviolet light and a catalyst to
generate these radicals. Titanium dioxide is a particularly popular catalyst for this process, as it is
relatively inexpensive and one of the most active materials available (Devipriya & Yesodharan,
2005). To increase the efficiency of the process, some scientists are investigating the use of
additives that naturally occur in water which increase the production of hydroxyl radicals. These
additives include substances such as humic acids, carbonates, and nitrates (Ukpebor, Halsall,
2011).
The photocatalytic degradations of several pesticides under various conditions have been
extensively studied (Malato et. al, 2002; Konstantinou et. al, 2001; Oller et. al, 2006). However,
due to its fairly recent introduction to the market, thiamethoxam’s behavior during photocatalysis
has been relatively under-studied. The purpose of this research was to address this gap by not
only studying thiamethoxam’s photocatalytic degradation via TiO2, but also the effects of adding
ammonium nitrate, humic acid, and natural river water to the solution. In these experiments, a

2
UV lamp and PC-500 TiO2 bounded onto cellulose paper by SiO2 were used to degrade 30 ppm
thiamethoxam. Kinetics, mineralization, toxicity, and the effects of the three additives on this
degradation were analyzed.

3
2.0 Background As mentioned in the previous section, although thiamethoxam’s photocatalytic degradation
remains relatively understudied, the photocatalytic degradation of several other pesticides has
been thoroughly examined. In this chapter, this research is reviewed by first placing
thiamethoxam, a relatively new pesticide, in the context of other pesticides. Then, different
methods currently used to treat pesticides are discussed, with emphasis placed on Advanced
Oxidation Processes and how photocatalysis falls into this category. Finally, previous research
on the photocatalytic degradation of other pesticides via TiO2 is reviewed, including relevant
studies that examined the effects of additives on this process.
2.1 Pesticides There are over 20,000 different pesticides with around 900 different active ingredients available
for purchase and use. According to Weiss, Amler, & Amler (2004), these pesticides are used as
“insecticides, miticides, fumigants, woods preservatives, and plant growth regulators” among
other uses (p. 1030). There are four main categories of active ingredients used in pesticides: 1)
carbamates and organophosphates, 2) organochlorides, 3) pyrethroids, and 4) neonicotinoids.
Carbamates and Organophosphates work by inhibiting acetylcholinesterase which then impairs
the organisms’ nervous system function. Organochlorides depolarize nerve membranes and
therefore disrupt nervous system function. Pyrethroids change the permeability of organisms’
membranes to sodium ions which ultimately impairs nervous system function (Weiss, et. al.,
2004, p. 1031). Neonicotinoids, a type of pesticide derived from nicotine and the focus of this
study, bind to the nicotinic acetylcholine receptors in insects, displacing tritiated imidacloprid,
and killing the insect. It is effective on select insects including “aphids, whiteflies, thrips, leaf
miners, beetles, and some lepidopteran species” (Nauen, et al., 2003, p. 56). The first
neonicotinoids were made available in 1991, and they are used in many different applications,
from seed treatment to stem applications (Zabar, Komel, Fabjan, Kralj, & Trebse, 2012, p. 293).
Pesticides are generally used in agriculture to produce larger crop yields with less human effort,
but they are also used to reduce the risk and frequency of insect-borne diseases. According to
Weiss et al. (2004), 4.5 billion pounds of chemicals are applied in the United States annually (p.
1030). 2.5 billion pounds of this total are herbicides and insecticides applied to only corn and
soybean crops (Reimer & Propoky, 2012, p. 362). According to Reimer & Prokopy (2012), there

4
are three distinct groups of commercial pesticide applicators: industrial weed management,
agricultural pest management, and aerial application, as well as private applicators (p. 363).
Pesticides become an environmental issue when they enter surface waters, which can occur
during the application process, disposal process, through soil leaching, or as condensation from
the atmosphere (Ukpebor & Halsall, 2012, 656). Effort must be put into removing these
contaminants from the environment as pesticides tend to be highly stable, bioaccumulative, and
toxic to many species (Devipriya, Yesodharan, 2004; Ormad et al. 2007).
2.1.1 Thiamethoxam
Thiamethoxam was the first second-generation neonicotinoid. Synthesized in 1991,
thiamethoxam is effective against both chewing and sucking insects, and was introduced to
market in 1998 by Novartis Agribusiness, a precursor to the Swiss company, Syngenta Crop
Protection (Maienfisch et al, 2001, “Discovery”). Thiamethoxam is highly stable, with an
“estimated half-life at room temperature [of] 200-300 days” at pH 7 (Maienfisch et al, 2001,
“Chemistry”). It also exhibits a “relatively high water solubility” of 4.1 g/L at room temperature,
and is relatively non-toxic to birds, fish, and mammals. However, a study conducted by
entomologist Mickaël Henry and colleagues and presented in the March 30, 2013 issue of
Science, found that thiamethoxam may be toxic to bees. According to the Chemical &
Engineering News article that followed the story, bees that had been exposed to “sublethal
doses” of the pesticide were “twice as likely to die while foraging,” suggesting that the pesticide
“may contribute to colony collapse disorder” (Bomgardner, 2012). Because of the results of this
study, France considered banning the pesticide in June of 2012, but decided more research was
needed before passing the ban.
As shown in Figure 1, a molecule of thiamethoxam contains two organic rings and 5 nitrogen
atoms. Thiamethoxam’s complex structure makes it difficult to predict a mechanism for
photocatalytic degradation (Kegley et al., 2010).

5
Figure 1: Molecular Structure of Thiamethoxam
2.2 Treatment Techniques To ameliorate the water pollution resulting from pesticide use, different treatment techniques
have been developed over the years. The goal of basic water treatment practices is to degrade or
remove the majority of the contaminants. One of the industry standards for pesticide removal
involves oxidizing the pesticides using chlorine, however, the intermediates and by-products
generated by these reactions can sometimes be extremely harmful and carcinogenic. Water
treatment plants will also introduce coagulants such as aluminum sulfate to floc out the
pesticides. Furthermore, adsorption onto activated carbon is an option for those plants that are
large enough to sustain the high cost of purchasing the carbon (Ormad, et al., 2007, p. 98).
2.2.1 Advanced Oxidation Processes (AOPs)
Other degradation techniques being investigated involve the employment of Advanced Oxidation
Processes (AOPs), which are defined by Quiroz, Bandala and Martínez-Huitle as, “processes
involving the generation of highly reactive oxidizing species able to attack and degrade organic
substances” (2011, p. 685) By these processes, the pesticides are not only removed but may also
be completely mineralized. Mineralization is the process of breaking down chemicals into carbon
dioxide and water. There are four groups of AOPs: ozone/ozonation processes, electro chemical
oxidation, heterogeneous photocatalysis, and homogeneous photocatalysis (Quiroz, et al., 2011).
In ozone processes, ozone is dissolved into the contaminated water, where it breaks down to
produce free radicals that readily react with pesticides (Chen, Lin, Kuo, 2013). Because of this,
ozone can degrade pesticides via two pathways: direct reactions between ozone and the molecule

6
or indirect reactions caused by the free radicals produced during the breakdown of ozone
(Ormad, et al., 2007, p. 104). This method is not dissimilar to chlorination in theory, but
ozonation does not create secondary pollutants when dissolved. However, it is often limited by
the instability of ozone and the high cost of generating it.
Electrochemical oxidation uses an anode to oxidize water, allowing degradation of the pesticide
at the anode, where hydroxyl radicals are adsorbed (Quiroz, et al., 2011). Because the anode is
the primary surface for degradation, the anode material is very important, with its efficiency
directly proportional to the efficiency of the degradation. The weaker the attraction is between
the anode and hydroxyl radicals, the more efficiently the pesticides can degrade, as the organic
compounds have more access to the highly reactive radicals. Direct electrochemical oxidation is
effective in a wide range of treatment conditions and does not necessitate any further reagents for
complete oxidation and mineralization. Electrochemical oxidation can also be coupled with
oxidizing reagents such as hydrogen peroxide for a stronger effect.
Photocatalytic processes offer many advantages including fast reaction rates, cheap and readily
available catalyst options, a lack of generated harmful polycyclised products, and effectiveness at
very small concentrations of contaminant (Devipriya, Yesodharan, 2004). Heterogeneous
photocatalysis involves a stationary catalyst, generally TiO2, in the presence of UV light,
wherein the irradiated catalyst produces an “electron/hole pair” that induces redox reactions in
the water at the catalyst’s surface (Quiroz, et al., 2011). Homogenous photocatalysis involves the
same generic process as heterogeneous photocatalysis, but in this case the catalyst is suspended
into the water.
The most notable examples of homogeneous photocatalysis are Fenton and Fenton-like
reactions. In Fenton reactions, combinations of ferrous salts and hydrogen peroxide or another
hydroxyl radical generator are applied to a solution (Quiroz, et al., 2011). The reaction can take
place with or without the presence of UV light. It has been found that homogenous
photocatalysis is more efficient than heterogenous photocatalysis, but the filtering process to
remove the catalyst offsets this efficiency with added cost (Devipriya, Yesodharan, 2004, 313).
Also, scale up for such processes is much more difficult than that of heterogeneous processes
because the light distribution within the tank is more complex and must be assessed.
Heterogenous photocatalysis will be the main focus of this study.

7
2.3 Heterogeneous Photocatalysis In heterogeneous photocatalysis, a stationary oxide-producing catalyst is irradiated with an
energy source to create highly reactive free radical hydroxyls. This process begins with Reaction
1, as reviewed by Devipriya & Yesodharan (2004):
The catalyst often acts as a semi-conductor, which means that the particles contain voids which
cannot conduct electricity, unlike metals (Linsebigler, et al., 1995, p.739). When the particles of
the catalyst absorb sufficient energy from a light source, electrons will jump across these voids,
from the ground state to an excited state, or in other words, from the valence band to the
conduction band. As the electron jumps to the conduction band, it generates a reciprocal positive
gap in the valence band, which can be seen in Reaction 2 (Linsebigler, et al., 1995). The
irradiated electrons may travel to the surface of the particle, where they will interact with species
adsorbed onto the particle. Charge is then transferred from the excited electrons and positively
charged holes to substances adsorbed onto the surface of the catalyst. In the presence of water,
hydroxyl groups will collect this charge, producing hydroxyl radicals. These hydroxyl radicals
may leave the surface of the catalyst or remain adsorbed.
A proposed generation process for hydroxyl radicals is presented in Reactions 2-3b (Devipriya,
Yesodharan, 2004).
Here, oxygen that has been adsorbed to the surface of the catalyst receives the electrons from the
excited particles and is reduced to a superoxide radical. The now positively charged TiO2
particles can oxidize water on their surfaces into hydroxyl radicals. This mechanism shows that
the presence of molecular oxygen, O2, is imperative in photocatalytic processes with TiO2
(Devipriya, Yesodharan, 2004).

8
Figure 2 shows a visual representation of the photoactivation reaction and its products.
As hv (light) hits the particle, an electron jumps across the band gap to the conduction band,
leaving a positively charged hole in its place, represented by the “energy gap”. The electron can
then be used to reduce an adsorbed compound, O2 in Figure 2, while the hole can be used to
oxidize an adsorbed compound, most commonly water or OH-.
2.3.1 Photocatalysis via TiO2
Photocatalysis via TiO2 is a well-researched process. This is evidenced by the thousands of
published studies “related to the degradation of toxic and hazardous substances in water”
(Miguel et al, 2012). A large number of these studies focus on hazardous soluble pesticides,
which can enter freshwater supplies via agricultural runoff. In particular, there is great interest in
assessing the capabilities of solar processes to degrade and mineralize these toxic chemicals,
which would greatly reduce the costs involved.
TiO2 is an ideal catalyst for solar photocatalysis studies for several reasons. Most importantly,
TiO2 is active within the range of natural sunlight. It is also relatively cheap and has been proven
to be the most active catalyst in many studies (Devipriya & Yesodharan, 2005). In addition, it is
Reduction
Ex: O2 + e
- O
2
- ⋅
Oxidation
Ex: H2O + cat.+
OH⋅ + cat.
O2-⋅
OH⋅
O2 H2O
Conduction Band (-)
Valence Band (+)
Energy Gap
ENERGY
Figure 2: Photocatalysis Reaction Diagram, adapted from Photocatalysis (2005)
hv (light)

9
relatively stable under harsh conditions, and can be used in fixed bed or suspension studies,
making it adaptable to many types of experiments and reactors.
2.3.2 Transformation Products
Ideally, solar photolysis would be able to completely degrade and mineralize harmful chemicals
in the environment, completely eliminating the need for human intervention. However,
photolysis and photocatalysis, even in cases when complete degradation is possible, often lead to
numerous sometimes toxic transformation products instead of mineralization. In fact, in some
cases these procedures can leave the solution more toxic than it was originally. For example, in
their paper, “Degradation and Detoxification of 4-nitrophenol by Advanced Oxidation
Technologies and Bench-scale Constructed Wetlands,” J.A Herrera-Melián and her colleagues
found that smaller concentrations of the intermediates produced from photocatalysis of 4-
nitrophenol, a pollutant produced by various manufacturing industries, were more toxic to
duckweed than larger concentrations of the original pollutant (2012).
One of the main difficulties of studying photocatalytic degradation of pesticides arises from the
fact that there are so many different transformation products created. While many attempts have
been made to propose mechanisms and structures for some of these transformation products, the
complex structures of the initial chemical as well as the complexity of the reactions makes this
process difficult (Malato, S. et al, 2002). In addition, due to the differing structures of the
multitude of pesticides studied, the transformation products discovered from one pesticide can be
different from those of another. Further complicating the matter, the procedures and equipment
used in photocatalytic studies tend to vary, which can also result in the observation of different
degradation times and transformation products. According to Ukpebor and Halsall, the
transformation products observed during their study of the pesticides fenitrothion and diazinon
varied from those of other studies of the same pesticides (2011). In their paper, “Effects of
Dissolved Water Constituents on the Photodegradation of Fenitrothion and Diazinon”, they
attributed these differences to differences in procedure used, such as different sources of light
and variations in water composition.

10
2.4 Enhancing Photocatalysis: Coupling Reactions and Additives
Photocatalytic degradations, particularly the mineralization portions, can be incomplete and very
slow. To remedy this, researchers recommend coupling photocatalytic reactions with other water
treatment methods such as photo-Fenton and constructed wetlands (Herrera-Melián, J.A. et al,
2012). Photo-Fenton procedures tend to be faster and in some cases, more effective. However,
this process is much more expensive. Unlike the TiO2, the iron and hydrogen peroxide involved
in photo-Fenton reactions must be replaced throughout the experiment. The amount of material
needed will vary based on operating conditions and equipment, and may not be cost prohibitive
in all cases. For example, in their paper, “Photocatalytic Treatment of Water-soluble Pesticides
by Photo-Fenton and TiO2 using Solar Energy,” Malato and his colleagues argue that the amount
of iron needed to degrade and mineralize the pesticides was so small, it could be discharged
safely into the environment, eliminating any filtration costs (2002).
Yet another method to increase the effectiveness and efficiency of photocatalytic processes is to
introduce naturally occurring oxidizers such as hydrogen peroxide (H2O2), nitrates (NO3-),
carbonates (CO3-2), and dissolved organic content, or DOC. Adding these additives allows
scientists to study photodegradation under more natural conditions, thus helping them analyze
what really happens when pesticides and other such chemicals are introduced to the environment.
These substances are naturally found in freshwater in small amounts, and are capable of
producing OH radicals, which can speed up photodegradation. However, the particles of DOC
can also have a shielding effect, slowing down the reaction (Ukpebor & Halsall, 2011).
Therefore, it is important to filter larger particles out of solution to counteract any shielding.

11
3.0 Methodology In the previous chapter, Advanced Oxidation Processes were reviewed as a potential method to
degrade pesticides, with emphasis placed on heterogeneous photocatalytic reactions that used
TiO2. Previous research studying the accelerative effects of additives on this process was also
reviewed. This research forms the basis for the experimental methods presented in this chapter.
These methods include a discussion of solution preparations, reactor conditions and procedures,
and an overview of the three types of studies conducted on the solutions: reaction kinetics,
mineralization, and toxicity.
3.1 Solution Preparations Base solutions of 30 ppm thiamethoxam were prepared from an original solution of 100 ppm
thiamethoxam in ultrapurified water by diluting with additional ultrapurified water. For the
ammonium nitrate solutions, solid ammonium nitrate was dissolved completely into the base
solution before being placed in the reactor. For the humic acid solutions, humic acid, which is
only partially soluble in water, was added and left to mix for about an hour. Filtered and
unfiltered samples containing humic acid were tested in the reactor. To make the river water
solution, the original solution was diluted with natural river water collected from the Meurthe
River instead of ultrapurified water. The following table shows data on all of the solutions run
through the reactor and the conditions under which they were tested.
Table 1: Summary of Test Conditions
Solution Description Reactor Conditions Experiment Length (min)
30 ppm thiamethoxam Catalyst 1 + UV 390 510
30 ppm thiamethoxam Catalyst 2 + UV 450 300 2805
30 ppm thiamethoxam UV only 2885 30 ppm thiamethoxam Catalyst 1 only 215
30 ppm thiamethoxam + 500 mg/L KNO3 Catalyst 1 + UV 375 540
30 ppm thiamethoxam + 500 mg/L NH4NO3 Catalyst 1 + UV 460 465
30 ppm thiamethoxam + 500 mg/L NH4NO3 Catalyst 2 + UV 370 440
30 ppm thiamethoxam + 20 mg/L NH4NO3 Catalyst 2 + UV 460

12
440
30 ppm thiamethoxam + 10 mg/L Humic Acid (unfiltered) Catalyst 2 + UV
435 440 450 450
30 ppm thiamethoxam + 10 mg/L Humic Acid (filtered) Catalyst 2 + UV 425
30 ppm thiamethoxam + river water Catalyst 2 + UV
465 405 440 405
3.2 Reactor
The reactor used in this experiment was designed by researchers at École Nationale Supérieure
des Industries Chimiques in Nancy, France. The main feature of this reactor was the reactor
chamber. In this rectangular glass receptacle, the sample being tested was exposed to UV light
and the TiO2 catalyst simultaneously, thus causing the photocatalytic reaction to occur. This
rectangular glass receptacle was open to the air, further facilitating the oxidation process, but
allowing for significant evaporation, which impacted some of the degradation results. The
receptacle contained a 48 cm glass slide with TiO2 paper folded over it. The UV light was
positioned directly above the reactor chamber for maximum exposure.
The reactor also contained a peristaltic pump that cycled the solution continuously through the
reactor chamber, allowing for sustained exposure to the catalyst and UV light, and thus
continuous degradation of the solution. To collect samples for periodic HPLC testing, a Florence
flask open to the air served as a sampling reservoir, minimizing evaporation. Approximately 6
feet of connecting tubing were used to contain the circulating solution as it cycled between the
reactor chamber, sampling reservoir, and the pump. A diagram of the system used is provided in
Figure 3.

13
3.3 Reactor Procedure To prepare the reactor chamber, a piece of photocatalytic TiO2 bound with SiO2 paper was cut
with scissors to slightly larger than the reactor chamber size, approximately 48 x 4 cm. The ends
of the catalyst paper were wrapped around a clean glass plate. The paper and glass plate were
then thoroughly rinsed using ultrapurified water to remove any loose pieces of catalyst which
could later become dislodged, affecting the reaction and damaging the HPLC’s column. Once
thoroughly rinsed, the catalyst paper and glass plate were placed into the bottom of the reactor
chamber.
The peristaltic pump was set to operate at Speed 2 which equates to approximately 255 mL/min.
Solutions of approximately 250 mL per experiment were cycled for 60 minutes without UV
light, allowing time for adsorption of the solution’s constituents to the catalyst. After 60 minutes,
the UV light was turned on and left on for the remainder of the experiment. The exceptions to
this were the two experiments without catalyst and without UV light (Appendix B). The length
of time that the solution was exposed to light varied depending on the rate of the reaction,
allowing more time for slower reactions, so that the solution could more fully degrade. Shorter
reactions were sampled for HPLC testing every 10-15 minutes, while longer reactions were
sampled every 30-60 minutes. Sampling procedure is discussed in Section 3.4, Reactor Cleaning
Procedure.
Figure 3: Schematic of Reactor System

14
3.4 Reactor Cleaning Procedure The reactor was cleaned shortly before each new experiment was conducted. To do this,
ultrapurified water was pumped through the reactor twice for approximately 5 minutes with the
catalyst installed but the light off, and then drained out. This procedure was conducted before
each experiment for the first month. On the 31st of January, a test was conducted to ensure that
all residual thiamethoxam was being removed between experiments. Ultrapurified water was
added to the reactor and left to cycle in the presence of the catalyst and UV light for 130 minutes.
Samples were taken every 10 minutes and run through the HPLC to determine the concentration
of any residual thiamethoxam. Results from this test can be found in Appendix C. After this test,
the cleaning procedure for the reactor changed. For every experiment after the 31st, ultrapurified
water was pumped through the reactor once for approximately 10 minutes with the catalyst in
place and the UV light on, and then drained out.
3.5 Kinetic Rate Testing
3.5.1 Sampling Procedure 2 mL samples were taken from the sampling reservoir of the reactor using a long-needled
syringe. From these samples, approximately 50 microliters were injected into the HPLC via a
smaller syringe for testing (see Section 3.5.2). After testing, the remainder of the thiamethoxam
solution was added back into the reactor. The sampling syringe and the vial were rinsed once
with ultrapurified water between samples. The vial was dried completely between samples using
paper towels.
For the unfiltered humic acid and river water experiments, the samples were filtered through a
0.22 micron syringe filter before being placed in the vial. This was to ensure no particles of
humic acid entered the HPLC. The filter and filter syringe were rinsed once with ultrapurified
water between samples.
After the reactor had been run for the full duration of the experiment, the entire contents of the
reactor were collected and stored in dark glass bottles in a refrigerator for further analyses.

15
3.5.2 High Performance Liquid Chromatography
High Performance Liquid Chromotagraphy (HPLC) is a useful and efficient means for separating
components in a mixture. HPLC involves the interactions between three phases: a mobile phase,
a stationary phase, and the sample to be separated, as with all chromatography. The mobile phase
is passed through a separating column, often packed with some sort of granules or thin film
(Umber, 2012) under very high pressure (up to 400 atm), rendering this method much more
efficient than normal gravity-induced column chromatography (Clark, 2007). One of the benefits
of HPLC is that the high pressure of the column also permits the use of smaller packing granules
with increased surface area, which allow for increased interactions between the three phases as
they pass through the column (Clark, 2007).
The HPLC column used in this research was run in reversed phase. Reversed phase HPLC
features non-polar packing and a polar solvent, meaning that polar components are more
attracted to the solvent and pass through the column more quickly than nonpolar materials. The
retention time of components in a solution can vary depending on differences in system pressure
and temperature, mobile phase feed rate, and the compositions of both the mobile and solid
phases.
Many different types of detectors may be used to identify the separated materials leaving the
column, but the most common is an UV-Vis spectrophotometer. This detector can identify the
retention time of a material by producing a peak on a time line as the material passes by. The
area under this peak corresponds to the material’s concentration in the solution and can be
correlated using calibration curves.
HPLC Procedure The HPLC machine was prepared before each experiment. The mobile phase liquid was purged
from the system using the automatic purge feature, to ensure that no air bubbles were trapped in
the tubing. The mobile phase pumps were turned on and the pressure in the system was allowed
to equilibrate. The pumps were set to pump at 0.150 mL/min of 1.5 volume % glacial acetic acid
in ultrapurified water and 0.150 mL/min HPLC-grade acetonitrile. After they had equilibrated,
the UV-Vis spectrophotometer was zeroed. Approximately 40 microliter samples were injected
using a 50 microliter syringe, which was rinsed three times with acetonitrile between samples.

16
3.6 Mineralization Testing: Total Organic Carbon and Total Nitrogen
Often, the transformation products of photocatalytic reactions are difficult to track and
characterize. Rather than measuring individual molecules of products, it is more common for
scientists to measure total organic carbon (TOC) or total nitrogen (TN) of the sample instead.
However, these mass balances can still fail to reach stoichiometric agreement. In particular, the
degradation of these chemicals sometimes leads to the production of nitrogen gas, which escapes
the system, leaving nitrogen unbalanced (Oller et al, 2006). Despite this, researchers have been
attempting to improve transition product tracking indirectly by measuring NH4+ or NO3-
concentrations. However, balance of nitrogen still remains difficult for a number of
photocatalytic processes.
3.6.1 Total Organic Carbon and Total Nitrogen Test Procedure
Approximately 40 mL of each degraded test solution were placed in a tall thin flask and affixed
with a permeable cap. The bottles were labeled and processed with a Shimadzu VCH machine,
where they were tested for inorganic carbon content by first exposing the solution to a strong
acid and measuring the amount of CO2 released using a CO2 detector. After this, organic carbon
was measured by burning the solution and measuring the CO2 released with the same detector.
Nitrogen was also detected by first combusting all nitrogen to form NO and NO2. These
compounds were then exposed to ozone, which allowed for nitrogen concentration detection by
chemiluminescence.
3.7 Toxicity Test Procedure Toxicity tests were performed according to the procedure presented by Cobb & Byberg (2012). Two circles of absorbent paper were placed in the bottom of short glass jars and filled with
around 3 mL of each solution. Both original and degraded solutions were tested. Positive and
negative controls were also included. The positive control contained Vittel mineral water and the
negative control contained the same water with 5 g/L of NaCl. Twelve lettuce (Lactuca sativa)
seeds were placed on the absorbent paper and the jar was covered with aluminum foil. Four
small holes were made in the top of the foil to allow proper aeration and each covered glass jar
was sealed in a plastic bag. The samples were left to germinate in the dark in a cabinet for 5

17
days. After 5 days, the samples were removed and measured. The entire length and the root
portion of the sprout were recorded.
Relative toxicity was the main means by which the toxicity of each sample was compared.
Degraded samples were compared not only to the positive and negative controls but also against
their original solutions. Determining the change in relative toxicity for each solution helped
identify clearly which solutions became more or less toxic after degradation. Toxicology
calculations were made as presented by Equation 1.
𝑅𝑇 = 𝐿𝑃𝑜𝑠𝑖𝑡_𝐶𝑜𝑛𝑡𝑟𝑜𝑙−𝐿𝑆𝑎𝑚𝑝𝑙𝑒
𝐿𝑃𝑜𝑠𝑖𝑡_𝐶𝑜𝑛𝑡𝑟𝑜𝑙−𝐿𝑁𝑒𝑔𝑎𝑡_𝐶𝑜𝑛𝑡𝑟𝑜𝑙 (Equation 1)
In Equation 1, RT is the relative toxicity, LSample is the average length of seedlings in the
samples, Lposit_control is average length of seedlings in the positive control sample, and Lnegat_control
is the average length of seedlings in the negative control.

18
4.0 Results and Discussion Base solutions of 30 ppm thiamethoxam and solutions containing 30 ppm thiamethoxam as well
as added nitrates, humic acid, and river water were degraded in a batch reactor in the presence of
an immobilized TiO2 catalyst and UV light. The data was examined to determine the kinetic rate
coefficient for each experiment, and the solutions were tested for dissolved organic carbon and
nitrogen content. Finally, toxicity of the degraded solutions was assessed using a lettuce test.
4.1 Kinetics Results As expected, the thiamethoxam degradation reaction best fit a pseudo-first order rate law, which
is typical for photocatalytic degradation of many pesticides (Devipriya & Yesodharan, 2004; Sur
et al., 2005; Zabar et al., 2012). From the HPLC data collected during each experiment, the
reaction rate coefficient for each reaction could be determined as the slope of the straight line on
a plot of the natural log of concentration with respect to time. Figures 4 and 5 are examples of
the graphs generated from the HPLC data, showing the concentration data from a degradation of
base thiamethoxam. Kinetic data from the rest of the experiments can be found in Appendix D.
Figure 4: Concentration of 30 ppm Thiamethoxam vs. Time during Photocatalysis
In Figure 4, the time before zero represents the 60 minutes during which the UV light was off
and the solution was allowed to adsorb to the catalyst. The decrease in concentration of
0
5
10
15
20
25
30
35
40
-100 0 100 200 300 400 500
Con
cent
ratio
n (m
g/L
)
Time (min)

19
thiamethoxam during this time indicates that adsorption was occurring. In this example, the
concentration of thiamethoxam was reduced to less than 3 ppm in 450 minutes.
Figure 5: 1st Order Rate Coefficient Graph for the Photocatalytic Degradation of 30 ppm Thiamethoxam
Figure 5 shows the data from Figure 4, manipulated as a plot of the natural log of the
concentration (C/C0, where C0 is the original concentration of thiamethoxam) versus time. Under
these conditions, the concentration data forms a straight line, as is expected for a first order or
pseudo first order equation. The rate coefficient for this experiment was found to be 0.0054
min-1, as determined by the slope of the graph.
Average rate coefficients were determined for each different solution tested with the same piece
of catalyst using the method described above. Figure 6 summarizes these rate coefficients. The
base solution of 30 ppm thiamethoxam degraded with a first order rate coefficient of 0.0054
min-1. There were then two solutions with additives that degraded slightly faster, the 500 mg/L
ammonium nitrate and 10 mg/L humic acid, and two that degraded slightly slower, the 20mg/L
ammonium nitrate and the solution made with river water.
y = -0.0054x R² = 0.9871
-3.00
-2.50
-2.00
-1.50
-1.00
-0.50
0.000 100 200 300 400 500
Ln(
C/C
0)
Time (min)

20
Figure 6: Average Reaction Rate Coefficients
The highest and lowest rate coefficients resulted from the two ammonium nitrate solutions. The
0.0062 min-1 rate coefficient achieved by the 500 mg/L solution could be attributed to the large
amount of oxidizers added to the system. It is possible that the 0.0052 min-1 rate coefficient of
the 20mg/L solution could be due to the small amount of additive added, which may have
actually adsorbed on the catalyst, inhibiting the reaction rather than accelerating it.
Humic acid is a better additive for this reaction than ammonium nitrate, as it had a greater impact
on the rate coefficient at a lower concentration. The river water performed better than the 20
mg/L ammonium nitrate, possibly due to a small amount of humic acid in the water.
However, even the largest increase was only about a 0.001 difference in the rate coefficient.
While this small increase in reaction rate coefficient made very little difference in overall
reaction time for the small-scale reactor used in this research, it may have a significant impact on
vessel size or retention time in larger-scale operations.
0.000
0.001
0.002
0.003
0.004
0.005
0.006
0.007
30 ppmThiamethoxam +
500 mg/LNH4NO3
30 ppmThiamethoxam +10 mg/L Humic
Acid
30 ppmThiamethoxam
30 ppmThiamethoxam +
River Water
30 ppmThiamethoxam +
20 mg/L NH4NO3
Rat
e C
oeff
icie
nt (m
in-1
)

21
4.2 Total Organic Carbon The results from the Total Organic Carbon (TOC) tests for several additives are shown in Table
2. It can be seen that TOC decreased in most cases, an indication that mineralization occurred.
The two largest decreases were for the 48-hour experiment of base thiamethoxam and the 8-hour
experiment with the humic acid additive.
Table 2: Total Organic Carbon of Original and Degraded Samples
Sample Description Initial TOC
(mg C/L)
Final TOC
(mg C/L)
% change
30 ppm Thiamethoxam 11.61 9.3595 -19.4
30 ppm Thiamethoxam (48-hour run) 11.61 7.809 -32.7
30 ppm Thiamethoxam + 500 mg/L NH4NO3 12 8.912 -25.7
30 ppm Thiamethoxam + 20 mg/L NH4NO3 13.5 14.955 10.0
30 ppm Thiamethoxam + 10 mg/L Humic Acid 13.84 9.3318 -32.6
30 ppm Thiamethoxam + River Water 14.51 14.8675 2.5
The humic acid solution displayed nearly the same decrease in TOC as the 48-hour base
thiamethoxam test, but in only 8 hours. This suggests that humic acid is very effective as an
additive for this reaction, particularly when considering the small amount that needed to be
added to achieve this result. The effectiveness of humic acid could be due to it generating a
larger number of free radicals during photocatalysis, and thus accelerating the degradation
process. It has been found in previous research that partially degraded humic acid absorbs much
more UV energy than its original form (Uyguner and Bekbolet, 2005), which may have allowed
the compounds to be more reactive and thus more likely to mineralize. Furthermore, degradation
containing humic acid occurs more quickly at lower pH’s (Bekbolet and Ozkosemen, 1996).
While the pH of the degradation experiments was not recorded, it can be assumed that the pH
decreased with the addition of humic acid, which in turn increased the reaction rate and allowed
for more complete mineralization.
The 48-hour experiment showed the largest decrease in TOC, which may infer that longer
reaction times could result in larger degrees of mineralization. The longer test length allowed the

22
thiamethoxam to degrade completely, which was not observed in any 8-hour test. However, the
continuing presence of organic content in the solution suggests that the thiamethoxam is
degrading into other organic compounds, not mineralizing completely. Longer tests should be
conducted overall to see how the solutions will degrade, and further analysis and identification of
degradation byproducts should be undertaken to determine the final composition. This
information could be used determine proper additional treatment if toxic compounds still exist
after photocatalytic degradation.
The TOC of the sample with river water and the 20 mg/L NH4NO3 solution showed a slight
increase, unlike all other solutions tested. The 20 mg/L NH4NO3 solution was the slowest tested
reaction. The slowness of the reaction may have allowed thiamethoxam to break down into other
organic substances, but hindered the further breakdown of these byproducts, resulting in an
increase in TOC. The river water’s higher TOC could be due to the possible presence of many
unidentified organic substances in the water, which may have reacted differently than the
components of other solutions tested. However, this increase was small, therefore it is possible
that some of the new products formed from the photocatalysis of the river water also degraded. A
longer test should be conducted to see how mineralization progresses given more time. In
addition, the composition of the river water should be assessed before experimentation to better
understand its degradation and final composition.
4.3 Total Nitrogen Table 3 summarizes the results from the Total Nitrogen (TN) tests. In most cases, the total
nitrogen increased between the original and degraded samples, which is generally a sign
mineralization did not occur. However, this increase in nitrogen is most likely due to the fact that
only some of the nitrogen in thiamethoxam originally can be detected due to the character of the
bonds and rings of its structure. The thiamethoxam solution should have contained 7.20 mg/L N
based on its molecular composition, but only 5.56 mg/L N were originally detected by this
method. As the thiamethoxam degraded and broke apart into different nitrogen-containing
compounds, they were able to be identified by the TN detector, making it seem as if the total
nitrogen was increasing. A study conducted by Low, McEvoy, and Matthews (1991) agreed with
this hypothesis, proving that 15 different nitrogen-containing pesticides degrade to both nitrate
and ammonia in the presence of TiO2 and UV light. An official study sponsored by Shimadzu

23
found that ammonium and nitrate are both readily detected by the TN test method (Walker,
Stojowski, & Clifford, 2001). However, if the original measurement of total nitrogen was
inaccurate, it is impossible to say whether or not any of this nitrogen escaped as N2 during
degradation.
Table 3: Total Nitrogen of Original and Degraded Samples
Sample Description Initial TN (mg
N/L)
Final TN (mg
N/L)
% change
30 ppm Thiamethoxam 5.56 7.16 28.82
30 ppm Thiamethoxam (48-hour run) 5.56 7.55 35.96
30 ppm Thiamethoxam + 500 mg/L NH4NO3 170.00 166.90 -1.82
30 ppm Thiamethoxam + 20 mg/L NH4NO3 13.46 17.29 28.42
30 ppm Thiamethoxam + 10 mg/L Humic Acid 5.85 7.21 23.18
30 ppm Thiamethoxam + River Water 7.89 9.82 24.41
The solution with 500 mg/L NH4NO3 was the only solution which showed a decrease in total
nitrogen. This solution was also the fastest, according to its kinetic rate constant, which means
that it may have degraded the thiamethoxam degradation byproducts in this solution more
thoroughly than that of the other solutions. This may have allowed N2 gas to form which would
have left the system and showed a decrease in total nitrogen. It is also possible that the original
count for total nitrogen was more accurate for the ammonium nitrate solution, because
ammonium and nitrate are both readily detected by the TN test method (Walker, Stojowski, &
Clifford, 2001). This makes it more likely that any N2 gas escaping would have been accurately
accounted for.
This test does not identify which compounds are being formed or whether they are plant-helpful
or plant-harmful substances. Further tests to identify the compounds that have been synthesized
should be conducted to fully characterize the degradation process, and whether it is more
harmful or more helpful to the ecosystem.

24
4.4 Toxicity To test for toxicity, lettuce seeds were germinated in each original and degraded test solutions for
5 days. The positive control seeds were grown in mineral water, while the negative control seeds
were grown in a salt solution of 5 mg/L NaCl. After 5 days, the lettuce seedlings were measured
and their lengths recorded and averaged. Their relative toxicities were calculated according to the
methods described in Chapter 3, Toxicity Test. Figure 7 shows the relative toxicities of the
original and degraded solutions as compared to the positive and negative controls.
Figure 7: Relative Toxicity of Original and Degraded Samples
In Figure 7, the positive control has a relative toxicity 0, while the negative control has a relative
toxicity of 1. All samples with relative toxicities less than 0 grew the lettuce seeds better than the
mineral water. All samples with relative toxicities greater than 0 resulted in shorter overall
seedlings than those grown with mineral water, suggesting increasing toxicity.
Two of the tested solutions, 10 mg/L humic acid, and 20 mg/L NH4NO3, decreased in toxicity
after being degraded. The biggest drop in toxicity was recorded for the 10 mg/L humic acid
solution, with final toxicity being nearly 5 times less toxic than the original solution. The final
toxicity of the 20 mg/L NH4NO3 solution was nearly 3 times less toxic than its original solution.
The observed decreases in toxicity may be partially contributed to the presence of additives, in
-1
-0.5
0
0.5
1
1.5
30 ppm Thiamethoxam +10 mg/L Humic Acid
30 ppm Thiamethoxam +20 mg/L NH4NO3
30 ppm Thiamethoxam +500 mg/L NH4NO3
30 ppm Thiamethoxam
Original
Degraded

25
that these additives potentially also oxidized some toxic byproducts of thiamethoxam
degradation. This unselective oxidation may have reduced the toxicity of the solution overall. In
addition, a study conducted by Lobit et al in 2006 found that ammonium nitrate was not toxic to
plants in small concentrations (101).
In contrast, the original base thiamethoxam solution increased in toxicity after being degraded. In
this case, the increase in toxicity did not impact the plants very significantly, with relative
toxicities around the same as the positive control. However, the increase in toxicity infers that
new compounds that are more toxic than the original pesticide were formed during the
degradation process, and these new compounds were not fully degraded during the length of the
experiment conducted. It will be important for further research to identify these newly formed
compounds in order to better understand their implications on plant and animal life in real-world
applications.
It is also important to note that the original base 30 ppm thiamethoxam solution was significantly
less toxic than not only the positive control, but also all other solutions, original and degraded.
From this, it can be inferred that either the additives themselves or the interactions these
additives had with thiamethoxam before photocatalysis raised the toxicity of these solutions even
before degradation. The addition of ammonium nitrate increased the toxicity of the original
solutions the most drastically. The most toxic solution tested was the 500 mg/L NH4NO3
solution, the degraded sample of which was still more toxic than the negative control.
Most likely, the addition of ammonium ions at such a large concentration poisoned the solution
for the lettuce plants. In fact, this finding is in agreement with the results of a study conducted by
Lobit et al in 2006 on the effects of ammonium nitrate on avocado plant development. In the
study, they found that “increasing the proportion of ammonium in in solution decreased
vegetative growth” (101). Further, they cite Crowley’s work in 1997 when they argue that “NH4+
has been shown to decrease root growth and root hair formation” (102). Indeed, when measuring
the lettuce sprouts from the tests, it was noted that the roots grown in the 500 mg/L NH4NO3
solution were brown, brittle, and very weak.
Quantitative toxicity data on the river water solutions and the original 500 mg/L NH4NO3
solution could not be determined due to inconclusive results from the positive and negative

26
controls. It can be inferred that the degradation process reduced the toxicity of the original 500
mg/L NH4NO3 solution, as was the case for the 20 mg/L NH4NO3 solution. Additionally, the
river water solutions were able to be compared on the basis of the real lengths of the lettuce
sprouts, instead of using the relative toxicity formula (Equation 1, Section 3.7). However, the
results are qualitative at best and should not be compared to the rest of the toxicity data. These
experiments were not repeated due to the time constraints of this project, but they should be
repeated and verified in the future for more quantitative data that can be compared readily with
the other experimental data.
There is an important distinction to be made when considering future applications for this
toxicity test and photocatalysis of thiamethoxam via TiO2. It can be inferred from the results of
this test that solutions with a relative toxicity less than zero may have contained compounds
which promoted better plant growth than in the mineral water, but does not by any means ensure
that these solutions are any cleaner, and perhaps not even less toxic, than the mineral water.
While some of the degraded solutions may improve the ability to grow lettuce plants, they may
still contain compounds harmful to other species. Further testing should be done to determine the
composition of these degraded solutions and to determine exactly what is causing promoted or
repressed plant growth.
5.0 Conclusions The goal of this project was to characterize the photocatalytic degradation of the pesticide
thiamethoxam and the effects of the additives ammonium nitrate, river water, and humic acid on
this degradation by measuring reaction kinetics, degree of mineralization, and toxicity. This
section of the paper provides: 1) a discussion of the key points of this research as they relate to
the degradation of base thiamethoxam, 2) a summary of the main results obtained from the
addition of each additive, and 3) recommendations for future work.
5.1 Thiamethoxam Thiamethoxam degraded at a rate of 0.0054 min-1. It showed indications of mineralization, as
TOC decreased. In fact, the longer the test was run, the more TOC decreased. On the other hand,
as experiment length increased, TN increased. This was attributed to the nitrogen in
thiamethoxam becoming more detectable as it degraded. Interestingly, solution toxicity increased

27
during the degradation of thiamethoxam, which may have important implications for its effects
on the environment and merits further research.
5.2 Additives
5.2.1 Ammonium Nitrate
The results for ammonium nitrate were very different between the 500 mg/L solution and the 20
mg/L solution. Highlights from both concentrations are provided below.
20 mg/L
The 20 mg/L solution resulted in the slowest rate. It did not show indications of mineralization;
instead, there were increases in both TOC and TN. These increases were attributed to the slow
rate, perhaps caused by adsorption to the catalyst. This solution decreased in toxicity after
degradation. At small concentrations, research shows that ammonium nitrate is beneficial to
plants, which may have promoted growth in the lettuce plants, unlike the 500 mg/L solution.
500 mg/L
The 500 mg/L solution resulted in the fastest rate. This was attributed to the sheer volume of
oxidizing additive used. It showed indications of mineralization; there were decreases in both
TOC and TN. These decreases were attributed to the fast reaction rate, which allowed the
solution to degrade to a larger degree in an 8-hour experiment. This solution decreased in
toxicity after degradation, but still remained the most toxic solution. Research has shown that at
large concentrations, ammonium is toxic to plants.
5.2.2 River Water
The solution made with river water degraded more slowly than the base thiamethoxam solution.
It did not show indications of mineralization; instead, there were increases in both TOC and TN.
The toxicity tests for this additive were inconclusive; however, solutions appeared to increase in
toxicity after degradation. These phenomena were attributed to unknown compounds that may
have been present in the river water.

28
5.2.3 Humic Acid
The humic acid solution degraded more quickly than the base thiamethoxam solution with a rate
coefficient of 0.006 min-1. It also showed indication of mineralization. In fact, it exhibited the
largest decrease in TOC for all 8 hour tests. The increase in reaction rate and degree of
mineralization were attributed to humic acids’ high reactivity in UV/TiO2 systems. Further, it
also showed the largest decrease in toxicity after degradation, at five times less than its original
toxicity. Overall, humic acid was the most effective additive for this reaction system and merits
further research.
5.3 Future Work There are 4 recommendations for future work:
• Better reactor design – the reactor chamber was open to the air, allowing for a greater
degree of evaporation, which made it difficult to assess concentrations, particularly for
longer tests.
• Run tests longer – the 48-hour base thiamethoxam test was the only test to fully degrade
thiamethoxam. It would be interesting to see how the other additives degrade over a
longer time period as well.
• Study the components of river water for better analysis – if the composition of the river
water was known before degradation, the results after degradation would have been
easier to analyze.
• Do tests in triplicate – due to strict time constraints while in France, all these tests were
conducted in duplicate. More repetition would result in greater statistical significance.

29
Works Cited
Bekbölet, M., & özkösemen, G. (1996). A Preliminary Investigation on the Photocatalytic
Degradation of a Model Humic Acid. Water Science and Technology, 33(6), 189-194.
Bomgardner, Melody (06/11/2012). "Bee-Linked Pesticide Under Fire". Chemical &
Engineering News (0009-2347), 90(24), p.9.
Chen, J. Y., Lin, Y. J., & Kuo, W. C. (2013). Pesticide Residue Removal from Vegetables by
Ozonation. Journal of Food Engineering, 114(3), 404. DOI:10.1016/j.jfoodeng.2012.08.033
Clark, J. (2007). High Performance Liquid Chromatography - HPLC. Retrieved 01/15, 2012,
from http://www.chemguide.co.uk/analysis/chromatography/hplc.html
Cobb, Jesse Elton, Byberg, Rebecca Lynn. (2012). Photocatalytic Degradation of a Series of
Direct Azo Dyes using Immobilized TiO2. Worcester, MA: Worcester Polytechnic Institute.
Cresswell, J. E. (2011). A Meta-Analysis of Experiments Testing the Effects of a Neonicotinoid
insecticide (imidacloprid) on honey bees. Ecotoxicology, 20(1), 149-157.
Devipriya, S., & Yesodharan, S. (2005). Photocatalytic Degradation of Pesticide Contaminants
in Water. Solar Energy Materials and Solar Cells, 86(3), 309-348.
DOI:10.1016/j,solmat.2004.07.013
Henry, M., Beguin, M., Requier, F., Rollin, O., Odoux, J. F., Aupinel, P., ... & Decourtye, A.
(2012). A Common Pesticide Decreases Foraging Success and Survival in Honey Bees.
Science, 336(6079), 348-350.
Herrera-Melián, J. A., Martín-Rodríguez, A. J., Ortega-Méndez, A., Araña, J., Doña-Rodríguez,
J. M., & Pérez-Peña, J. (2012). Degradation and Detoxification of 4-nitrophenol by
Advanced Oxidation Technologies and Bench-Scale Constructed Wetlands. Journal of
Environmental Management, 105, 53. DOI:10.1016/j.jenvman.2012.03.044

30
Kegley, S.E., Hill, B.R., Orme S., Choi A.H., PAN Pesticide Database, Pesticide Action
Network, North America (San Francisco, CA, 2010), http:www.pesticideinfo.org.
Konstantinou, I. K., Zarkadis, A. K., & Albanis, T. A. (2001). Photodegradation of Selected
Herbicides in Various Natural Waters and Soils under Environmental Conditions. Journal of
Environmental Quality, 30(1), 121-130.
Lhomme, L., Brosillon, S., & Wolbert, D. (2008). Photocatalytic Degradation of Pesticides in
Pure Water and a Commercial Agricultural Solution on TiO2 Coated Media. Chemosphere,
70(3), 381-386. DOI:10.1016/j.chemosphere.2007.07.004
Linsebigler, A. L., Lu, G., & Yates Jr, J. T. (1995). Photocatalysis on TiO2 Surfaces: Principles,
Mechanisms, and Selected Results. Chemical Reviews, 95(3), 735-758.
Lobit, P., Lopez-Perez, L., Cardenas-Navarro, R., Castellanos-Morales, V., & Ruiz-Corro, R.
(2007). Effect of Ammonium/Nitrate Ratio on Growth and Development of Avocado Plants
under Hydroponic Conditions. Canadian Journal of Plant Science, 87(1), 99-103.
DOI:10.4141/P06-029
Low, G. K., McEvoy, S. R., & Matthews, R. W. (1991). Formation of Nitrate and Ammonium
Ions in Titanium Dioxide Mediated Photocatalytic Degradation of Organic Compounds
Containing Nitrogen Atoms. Environmental Science & Technology, 25(3), 460-467.
Maienfisch, P., Angst, M., Brandl, F., Fischer, W., Hofer, D., Kayser, H., ... & Widmer, H.
(2001). Chemistry and Biology of Thiamethoxam: a Second Generation Neonicotinoid. Pest
Management Science, 57(10), 906-913.
Maienfisch, P., Huerlimann, H., Rindlisbacher, A., Gsell, L., Dettwiler, H., Haettenschwiler, J.,
Sieger, E., & Walti, M. (2001). The Discovery of Thiamethoxam: a Second‐Generation
Neonicotinoid. Pest Management Science, 57(2), 165-176.
Malato, S. (2002). Photocatalytic Treatment of Water-Soluble Pesticides by Photo-Fenton and
TiO2 using Solar Energy. Catalysis Today, 76(2-4), 209-220. DOI:10.1016/S0920-
5861(02)00220-1

31
Miguel, N., Ormad, M., Mosteo, R., & Ovelleiro, J. (2012). Photocatalytic Degradation of
Pesticides in Natural Water: Effect of Hydrogen Peroxide. International Journal of
Photoenergy, 2012 DOI:10.1155/2012/371714
Nauen, R., Ebbinghaus-Kintscher, U., Salgado, V. L., & Kaussmann, M. (2003). Thiamethoxam
is a neonicotinoid precursor converted to clothianidin in insects and plants. Pesticide
Biochemistry and Physiology, 76(2), 55-69.
Oller, I., Gernjak, W., Maldonado, M. I., Pérez-Estrada, L. A., Sánchez-Pérez, J. A., & Malato,
S. (2006). Solar Photocatalytic Degradation of Some Hazardous Water-Soluble Pesticides at
Pilot-Plant Scale. Journal of Hazardous Materials, 138(3), 507-517.
Ormad, M. P., Miguel, N., Claver, A., Matesanz, J. M., & Ovelleiro, J. L. (2008). Pesticides
Removal in the Process of Drinking Water Production. Chemosphere, 71(1), 97-106.
DOI:10.1016/j.chemosphere.2007.10.006
Photocatalysis. (2005). Retrieved 03/13, 2013, from http://dev.nsta.org/evwebs/1952/
photocatalysis.htm
Quiroz, M. A., Bandala, E. R., & Martínez-Huitle, C. A.(2011). Advanced Oxidation Processes
(AOPs) for Removal of Pesticides from Aqueous Media, Pesticides - Formulations, Effects,
Fate, Margarita Stoytcheva (ed.), ISBN: 978-953-307-532-7, InTech, DOI: 10.5772/13597.
available from: Http://www.intechopen.com/books/pesticides-formulations-effects-
fate/advanced-oxidation-processes-aops-for-removal-of-pesticides-from-aqueous-media
Reimer, A. P., & Prokopy, L. S. (2012). Environmental Attitudes and Drift Reduction Behavior
among Commercial Pesticide Applicators in a U.S. Agricultural Landscape. Journal of
Environmental Management, 113, 361. DOI:10.1016/j.jenvman.2012.09.009
Sur, B., De Laurentiis, E., Minella, M., Maurino, V., Minero, C., & Vione, D. (2012).
Photochemical Transformation of Anionic 2-nitro-4-chlorophenol in Surface Waters:
Laboratory and Model Assessment of the Degradation Kinetics, and Comparison with Field

32
Data. The Science of the Total Environment, 426, 296-303.
DOI:10.1016/j.scitotenv.2012.03.034
Ukpebor, J. E., & Halsall, C. J. (2012). Effects of Dissolved Water Constituents on the
Photodegradation of Fenitrothion and Diazinon. Water, Air, & Soil Pollution, 223(2), 655-
666. DOI:10.1007/s11270-011-0890-x
Umber, J. (2012). Chromatographie Liquide Haute Performance (HPLC). Retrieved 01/15, 2013,
from http://www.ac-nancy-metz.fr/enseign/physique/chim/Jumber/HPLC/
Chromatographie_en_phase_liquide.htm
Uyguner, C. S., & Bekbolet, M. (2005). Evaluation of Humic Acid Photocatalytic Degradation
by UV–Vis and Fluorescence Spectroscopy. Catalysis Today, 101(3), 267-274.
DOI:10.1016/j.cattod.2005.03.011
Walker, K. R., Stojowski, L., & Clifford, R. H. (2010). Total Nitrogen Analysis: A New
Perspective on TOC. Retrieved 04/22, 2013, from http://www2.shimadzu.com/apps/
appnotes/totalnit.pdf
Wallace, D. F., Hand, L. H., & Oliver, R. G. (2010). The Role of Indirect Photolysis in Limiting
the Persistence of Crop Protection Products in Surface Waters. Environmental Toxicology
and Chemistry / SETAC, 29(3), 575-581. DOI:10.1002/etc.65
Weiss, B., Amler, S., & Amler, R. W. (2004). Pesticides. Pediatrics, 113(4 Suppl), 1030.
Zabar, R., Komel, T., Fabjan, J., Kralj, M., & Trebse, P. (2012). Photocatalytic Degradation with
Immobilised TiO2 of Three Selected Neonicotinoid Insecticides: Imidacloprid,
Thiamethoxam and Clothianidin. Chemosphere, 89(3), 293-301.
DOI:10.1016/j.chemosphere.2012.04.039

33
Appendix A – Calibration Curves In order to be able to determine the concentration of thiamethoxam from the HPLC detector, a
calibration curve needed to be created which could correlate the area under the curve generated
by the HPLC to a specific concentration of thiamethoxam. Solutions ranging from 0.5 to 100
ppm thiamethoxam were prepared and analyzed with the HPLC. Figure 8 shows the data
collected from two calibration tests with a linear trend line fit to them.
Figure 8: Combined Calibration Curve for Correlating HPLC Absorbance to Concentration
The slight variations in recorded area between the two sets of tests may be the result of pressure
fluctuations in the machine, as only the flow rate of the mobile phase could be controlled.
Pressure fluctuations have been noted to range from 128 bar to over 140 bar between tests,
however for the calibration tests, the pressures were 128 and 132 bar. The equation of the linear
trend line was determined to be y=4*10-6x – 5.229. This equation was used to convert all
subsequent recorded areas into concentrations of thiamethoxam.
y = 4E-06x - 5.229 R² = 0.9916
0
20
40
60
80
100
120
0 5,000,000 10,000,000 15,000,000 20,000,000 25,000,000 30,000,000 35,000,000
Con
cent
ratio
n (m
g th
iam
etho
xam
/L)
Area (a.u.)

34
Appendix B – Proof of Concept Before beginning experiments using the TiO2 catalyst and UV light, it was important to
determine the necessity of both elements for effective degradation. Two experiments were
completed, one using only UV light and one using only the catalyst. Their results are presented
in Figures 9 & 10.
Figure 9 shows the degradation of thiamethoxam in the presence of only UV light during a study
which was conducted over 2 days.
Figure 9: Concentration Data for Thiamethoxam Experiment with UV light and without TiO2
These data show that the concentration of thiamethoxam increased over the test period instead of
staying the same or decreasing. This is most likely due to evaporation of water during the test
run. From this, it can be inferred that photolysis alone is not an effective means of degradation
for this pesticide. The experiment should be studied in a more closed reactor to obtain more
conclusive results on the degradation rate of thiamethoxam in the presence of only UV light.
Figure 10 shows the degradation results of thiamethoxam in the presence of the immobilized
TiO2 catalyst but without any UV light.
0
5
10
15
20
25
30
35
40
45
50
0 200 400 600 800 1000 1200 1400 1600 1800 2000
Con
cent
ratio
n (m
g/L
)
Time (min)

35
Figure 10: Concentration Data for Thiamethoxam Experiment without UV light and with TiO2
These data show that with only a catalyst present, the concentration stays approximately the
same throughout the experiment.
From these two experiments, it can be concluded that effective degradation of thiamethoxam in
this specific reactor cannot be achieved with the presence of only a TiO2 catalyst or only UV
light.
0
5
10
15
20
25
30
35
40
0 50 100 150 200 250
Con
cent
ratio
n (m
g/L
)
Time (min)

36
Appendix C – Efficiency of Reactor Cleaning A test was conducted to ensure that the reactor was being effectively cleaned between runs. Most
importantly, it was hypothesized that thiamethoxam which had adsorbed onto the catalyst might
desorb into circulating ultrapurified water in the presence of UV light. If thiamethoxam was
present or desorbed into the reactor, it would need to be degraded completely between runs to
render the reactor clean. Figure 11 shows the thimethoxam concentration data collected over the
course of 130 minutes while the reactor ran with only pure water.
Figure 11: Concentration of Thiamethoxam for 2 Hours after Cleaning
The data showed that the concentration of thiamethoxam in the reactor hovered around 0 for
most of the two-hour test. Negative concentrations can be attributed to the imprecision of the
calibration curve used on the HPLC data. Concentrations much higher than zero were considered
outliers, because of their infrequency and lack of trend. From this data, it was concluded that the
reactor was sufficiently clear of thiamethoxam as to be considered clean and ready for a new
experiment.
-2
-1.5
-1
-0.5
0
0.5
1
1.5
2
0 20 40 60 80 100 120 140
Con
cent
ratio
n T
hiam
etho
xam
(mg/
L)
Time (min)
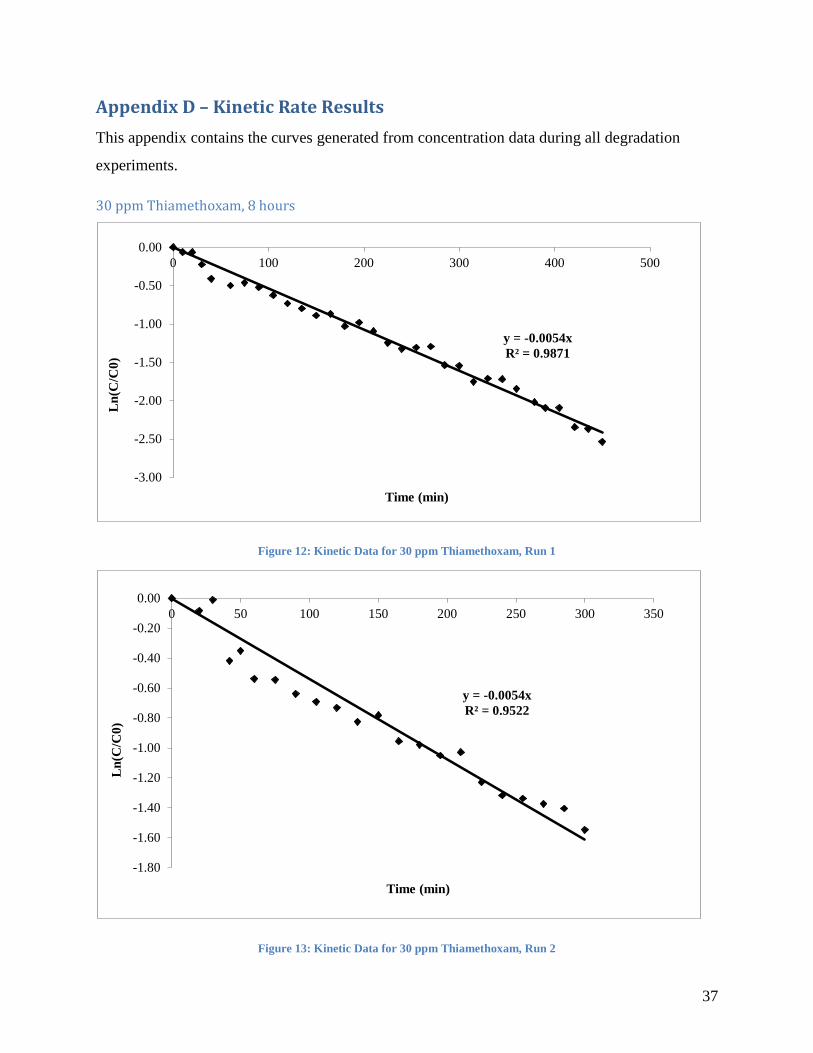
37
Appendix D – Kinetic Rate Results This appendix contains the curves generated from concentration data during all degradation
experiments.
30 ppm Thiamethoxam, 8 hours
Figure 12: Kinetic Data for 30 ppm Thiamethoxam, Run 1
Figure 13: Kinetic Data for 30 ppm Thiamethoxam, Run 2
y = -0.0054x R² = 0.9871
-3.00
-2.50
-2.00
-1.50
-1.00
-0.50
0.000 100 200 300 400 500
Ln(
C/C
0)
Time (min)
y = -0.0054x R² = 0.9522
-1.80
-1.60
-1.40
-1.20
-1.00
-0.80
-0.60
-0.40
-0.20
0.000 50 100 150 200 250 300 350
Ln(
C/C
0)
Time (min)

38
500 mg/L NH4NO3
Figure 14: Kinetic Data for 30 ppm Thiamethoxam + 500 mg/L NH4NO3, Run 1
Figure 15: Kinetic Data for 30 ppm Thiamethoxam + 500 mg/L NH4NO3, Run 2
y = -0.0066x R² = 0.9879
-3.00
-2.50
-2.00
-1.50
-1.00
-0.50
0.000 50 100 150 200 250 300 350 400
ln(C
/C0)
Time (min)
y = -0.0058x R² = 0.9685
-3.00
-2.50
-2.00
-1.50
-1.00
-0.50
0.000 50 100 150 200 250 300 350 400 450 500
ln(c
onc)
Time (min)

39
20 mg/L NH4NO3
Figure 16: Kinetic Data for 30 ppm Thiamethoxam + 20 mg/L NH4NO3, Run 1
Figure 17: Kinetic Data for 30 ppm Thiamethoxam + 20 mg/L NH4NO3, Run 2
y = -0.005x R² = 0.9837
-2.50
-2.00
-1.50
-1.00
-0.50
0.000 50 100 150 200 250 300 350 400 450 500
LN
(C/C
0)
Time (min)
y = -0.0053x R² = 0.9817
-2.50
-2.00
-1.50
-1.00
-0.50
0.000 50 100 150 200 250 300 350 400 450 500
Ln(
C/C
0)
Time (min)
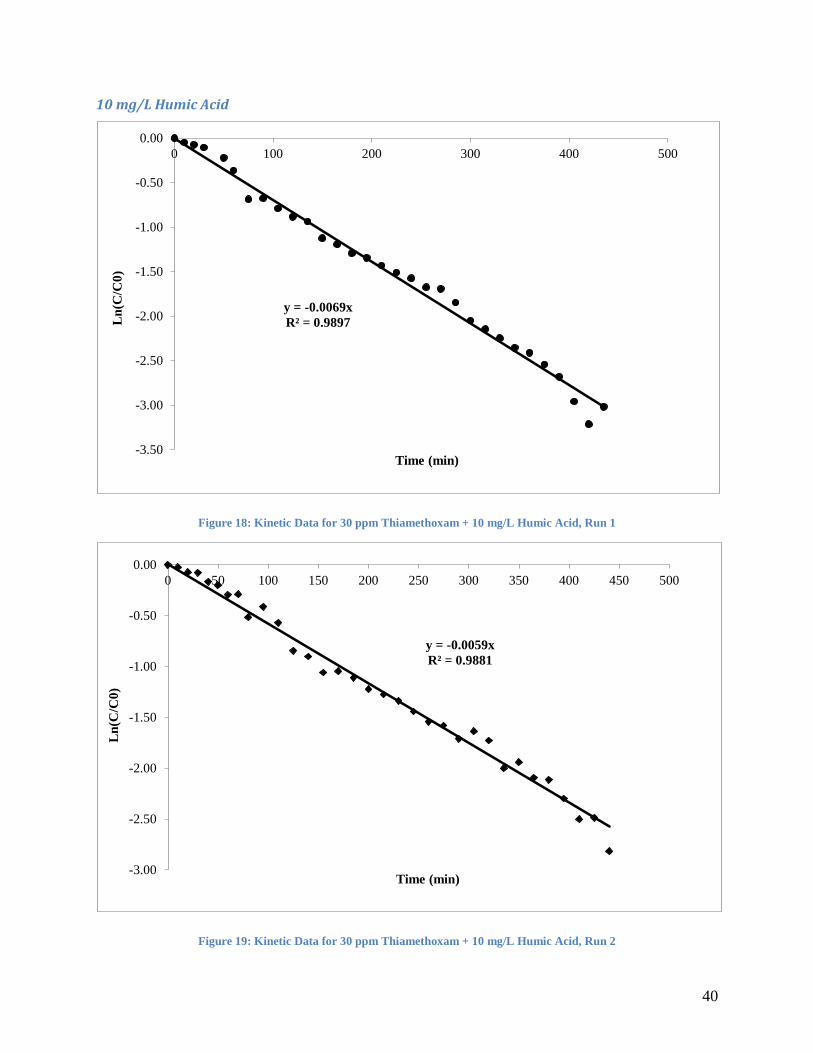
40
10 mg/L Humic Acid
Figure 18: Kinetic Data for 30 ppm Thiamethoxam + 10 mg/L Humic Acid, Run 1
Figure 19: Kinetic Data for 30 ppm Thiamethoxam + 10 mg/L Humic Acid, Run 2
y = -0.0069x R² = 0.9897
-3.50
-3.00
-2.50
-2.00
-1.50
-1.00
-0.50
0.000 100 200 300 400 500
Ln(
C/C
0)
Time (min)
y = -0.0059x R² = 0.9881
-3.00
-2.50
-2.00
-1.50
-1.00
-0.50
0.000 50 100 150 200 250 300 350 400 450 500
Ln(
C/C
0)
Time (min)

41
Figure 20: Kinetic Data for 30 ppm Thiamethoxam + 10 mg/L Humic Acid, Run 3
Figure 21: Kinetic Data for 30 ppm Thiamethoxam + 10 mg/L Humic Acid, Run 4
y = -0.0066x R² = 0.9826
-4.00
-3.50
-3.00
-2.50
-2.00
-1.50
-1.00
-0.50
0.000 100 200 300 400 500
Ln(
C/C
0)
Time (min)
y = -0.0049x R² = 0.9925
-2.50
-2.00
-1.50
-1.00
-0.50
0.000 100 200 300 400 500
Ln(
C/C
0)
Time (min)

42
Figure 22: Kinetic Data for 30 ppm Thiamethoxam + 10 mg/L Humic Acid, Filtered
River Water Solution
Figure 23: Kinetic Data for 30 ppm Thiamethoxam + River Water, Run 1
y = -0.0057x R² = 0.9882
-3.00
-2.50
-2.00
-1.50
-1.00
-0.50
0.000 50 100 150 200 250 300 350 400 450
LN
(C/C
0)
Time (min)
y = -0.0062x R² = 0.9953
-3.00
-2.50
-2.00
-1.50
-1.00
-0.50
0.000 50 100 150 200 250 300 350 400
Ln(
C/C
0)
Time (min)

43
Figure 24: Kinetic Data for 30 ppm Thiamethoxam + River Water, Run 2
Figure 25: Kinetic Data for 30 ppm Thiamethoxam + River Water, Run 4
y = -0.0047x R² = 0.9904
-2.00
-1.80
-1.60
-1.40
-1.20
-1.00
-0.80
-0.60
-0.40
-0.20
0.000 50 100 150 200 250 300 350 400 450
Ln(
C/C
0)
Time (min)
y = -0.0049x R² = 0.9832
-1.40
-1.20
-1.00
-0.80
-0.60
-0.40
-0.20
0.000 50 100 150 200 250 300
Ln(
C/C
0)
Time (min)

44
Appendix E – Raw Data All raw data, including kinetics, TOC/TN, and lettuce testing can be accessed by contacting Terri
Camesano at [email protected].