Embed Size (px)
Citation preview

Degradation of Adenine on the Martian Surface in the Presence of Perchlorates andIonizing Radiation: A Reflectron Time-of-flight Mass Spectrometric Study
Sándor Góbi1,2, Alexandre Bergantini1,2, and Ralf I. Kaiser1,21 Department of Chemistry, University of Hawaii at Mānoa, Honolulu, HI 96822, USA
2W.M. Keck Laboratory in Astrochemistry, University of Hawaii at Mānoa, Honolulu, HI 96822, USA; [email protected] 2016 December 22; revised 2017 March 2; accepted 2017 March 5; published 2017 March 29
Abstract
The aim of the present work is to unravel the radiolytic decomposition of adenine (C5H5N5) under conditionsrelevant to the Martian surface. Being the fundamental building block of (deoxy)ribonucleic acids, the possibilityof survival of this biomolecule on the Martian surface is of primary importance to the astrobiology community.Here, neat adenine and adenine–magnesium perchlorate mixtures were prepared and irradiated with energeticelectrons that simulate the secondary electrons originating from the interaction of the galactic cosmic rays with theMartian surface. Perchlorates were added to the samples since they are abundant—and therefore relevant oxidizerson the surface of Mars—and they have been previously shown to facilitate the radiolysis of organics such asglycine. The degradation of the samples were monitored in situ via Fourier transformation infrared spectroscopyand the electron ionization quadruple mass spectrometric method; temperature-programmed desorption profileswere then collected by means of the state-of-the-art single photon photoionization reflectron time-of-flight massspectrometry (PI-ReTOF-MS), allowing for the detection of the species subliming from the sample. The resultsshowed that perchlorates do increase the destruction rate of adenine by opening alternative reaction channels,including the concurrent radiolysis/oxidation of the sample. This new pathway provides a plethora of differentradiolysis products that were identified for the first time. These are carbon dioxide (CO2), isocyanic acid (HNCO),isocyanate (OCN−), carbon monoxide (CO), and nitrogen monoxide (NO); an oxidation product containingcarbonyl groups (R1R2–C=O) with a constrained five-membered cyclic structure could also be observed.Cyanamide (H2N–C≡N) was detected in both irradiated samples as well.
Key words: astrochemistry – methods: laboratory: solid state – planets and satellites: surfaces – techniques:spectroscopic
1. Introduction
During the past decades, attempts to untangle the chemicalfate of organics on the Martian surface have been of primaryimportance to the planetary science and astrobiology commu-nities. Organic compounds might accumulate on the surface ofMars owing to two different sources: in situ formation (Orgel2004; Cleaves et al. 2006; Roy et al. 2007; ten Kate 2010)and/or delivery via interplanetary dust particles (Flynn 1996;Moores & Schuerger 2012) and by meteoritic infall (Botta &Bada 2002; Callahan et al. 2011; Pearce & Pudritz 2016).However, after their deposition to the surface, these organicsare continuously exposed to energetic solar photons andgalactic cosmic rays (GCRs), leading to their radiolyticdestruction. Having a subtle atmosphere with an averagepressure of 7 mbar (Armstrong et al. 2004), Mars also lacks amagnetic field (Acuña et al. 1999), allowing energetic GCRparticles to reach the Martian surface. Previously, the effect ofGCRs has generally been neglected as their energy flux is sixorders of magnitude lower than the flux of solar UV photons(Molina-Cuberos et al. 2001; Cockell & Raven 2004; Dartnellet al. 2007). Liquid water that might be present in the shallowsubsurface (1–3 cm) in the form of thin films that remain stableeven below the freezing point of bulk water (Shivak & Pavlov2012; Kereszturi & Góbi 2014) may also facilitate thedestruction of organics with a half-life of �106 years at 273 Kvia hydrolysis. Nonetheless, photons are effectively absorbedin the upper few tens of nanometers of the dust particles(Muñoz-Caro et al. 2006), while GCRs can penetrate the firstfew meters of the Martian soil (Pavlov et al. 2012). This makes
GCRs the primary candidate that accounts for the destruction oforganics in the deeper subsurface of Mars. When the calculateddestruction rates of organics are compared to the rates ofcontinuous exogenous delivery, it has been concluded thatorganics should still be present (Turner et al. 2016). However,according to the recent findings from the Curiosity Rover, theconcentration of indigenous organics is orders of magnitudelower than expected (in the ppb region; Freissinet et al. 2015;Miller et al. 2016), implicating the presence of active oxidationagent(s) that effectively facilitate(s) the radiolytic decomposi-tion of organics (Lasne et al. 2016). These conclusions werealso supported by a Surface Enhanced Raman Scattering studythat could not detect nucleobases in the Martian meteorite RBT04262 even in trace amounts (Callahan et al. 2013). The role ofoxidizers in the radiolytic decay of organic compounds on theMartian surface/subsurface is the most widely acceptedexplanation and was proposed based on the results of theViking (Biemann et al. 1976; Biemann & Bada 2011) andPhoenix Landers (Sutter et al. 2009) along with the dataobtained by the Curiosity Rover (Leshin et al. 2013; Ming et al.2014). Perchlorates -( )ClO4 are considered to be the mosteffective oxidants (Hecht et al. 2009; Glavin et al. 2013), withconcentrations that can be as high as 1.0% by weight (Davilaet al. 2013). They are likely formed via heterogeneousphotochemical (Smith et al. 2014), photocatalytic (Carrier &Kounaves 2015), or radiation-induced surface reactions withincarbon dioxide (CO2)-bearing ices (Kim et al. 2013; Wilsonet al. 2016).Numerous studies have attempted to explain the scarcity of
organic compounds on the Martian surface by investigating
The Astrophysical Journal, 838:84 (21pp), 2017 April 1 https://doi.org/10.3847/1538-4357/aa653f© 2017. The American Astronomical Society. All rights reserved.
1

their radiolytic destruction under simulated Martian conditions.Among these organics, nucleobases—the fundamental buildingblocks of ribonucleic acid (RNA) and deoxyribonucleic acid(DNA)—have also been the focus of interest in the pastdecades, resulting in laboratory experiments carried out withadenine (C5H5N5) samples (Table 1). Adenine—formally thepentamer of the hydrogen cyanide (HCN) molecule—is knownto be resistant against energetic irradiation as it can undergorapid radiationless deactivation involving conical intersectionsfrom its excited states accessed via the nπ* transition (Perunet al. 2005; Barbatti et al. 2015; Improta et al. 2016), making itslack of detection on Mars especially intriguing. An early workon the radiolysis of organics was carried out by Oró & Holzer(1979). The authors found that the presence of oxygen greatlyincreases the destruction rate of the organic compoundsadenine (C5H5N5), glycine (H2NCH2COOH), and naphthalene(C10H8). These organic samples did not show any change whenirradiated by broadband UV photons (200–300 nm). However,under oxygen-rich atmospheres, 99% of the sample moleculeswere destroyed using the same irradiation doses. The authorseventually concluded that the combined effect of energeticirradiation and the presence of oxidants are both fundamentallynecessary for the degradation of organic molecules on Mars.Guan et al. (2010) probed the photostability of several organics—glycine (H2NCH2COOH), xanthine (C5H4N4O2), hypox-anthine (C5H4N4O), adenine (C5H5N5), guanine (C5H5N5O),urea ((H2N)2–C=O), carbon suboxide polymer ((C3O2)n), andHNC polymer ((HCN)n)—during the ESA BIOPAN 6 mission.Their half-lives ranged from a few days to a few tens of daysfor the most photo-resistant molecules (adenine, guanine,hypoxanthine). Fifteen powdered organic compounds wereradiolyzed by 200–280 nm UV-C photons in the work ofSchuerger et al. (2011) when they examined the evolution ofmethane (CH4) upon irradiation under inert and Mars-analogatmospheres. They found that 1 g of adenine (C5H5N5) yields amoderate amount of 0.040 nmol of methane (CH4) after 1 hr ofirradiation. Thin layers of nucleobases adsorbed on magnesiumoxide (MgO) and forsterite (Mg-rich end-member of olivine,Mg2SiO4) were also investigated (Fornaro et al. 2013), and theresults confirmed the high intrinsic photostability of suchmolecules. Although molecular destruction seemed to occur onboth surfaces for uracil (C4H4N2O2), this was in contrast to thebehavior of the other three studied molecules. The UVirradiation caused only the excitation of the adenine(C5H5N5) vibrations, whereas cytosine (C4H5N3O) and hypox-anthine (C5H4N4O) proved to be even more photo-resistant.Nevertheless, according to their results, magnesium oxide(MgO) and forsterite (Mg2SiO4) surfaces have no protectiveeffect against UV irradiation; they may even have a catalyticeffect on the degradation. The decomposition rate of thin filmsof adenine (C5H5N5) on the magnesium fluoride (MgF2)window was also determined when radiolyzed by 115–300 nmUV photons under vacuum by Saïagh et al. (2014); theirradiation products—similarly to all above-mentioned studies—were not determined. Poch et al. (2014) also investigated theUV radiolysis of thin films of adenine (C5H5N5) under inertatmosphere, and they found evidence for the formation ofamines (−NH2), isocyanides (R–N=C), and nitriles (R–C≡N)in an extended conjugated system (like –C=C–C=N–). In alater work, these authors also examined the role of a silicatelayer (nontronite smectite clay being the most abundant
phyllosilicate on Mars), leading to the conclusion that it doeshave a photo-protective effect; the destruction rates of glycine(H2NCH2COOH) and adenine (C5H5N5) decreased by a factorof five (Poch et al. 2015). The only occasion when adeninesamples were irradiated by energetic electrons to simulateGCRs was the work done by Evans et al. (2011). This studyused neat adenine (C5H5N5) samples and studied the effect ofthe radiolysis of a thin oxygen (O2) ice deposited on the pre-irradiated adenine film as well. In the first case, formation ofnitriles (R–C≡N) could be observed, whereas the irradiation ofthe adenine sample covered by oxygen ice yielded epoxides(C–O–C) and a carbonyl-bearing compound (R1R2–C=O)besides the nitriles.There have been also efforts made to shed light on the
decomposition mechanism of perchlorate samples, concludingthat upon irradiation they yield atomic oxygen (O), which laterquickly recombines into its molecular form (O2; Turneret al. 2016), providing an oxidizing environment for thesurrounding organic molecules. A later work also found analternative pathway resulting in chlorine dioxide (ClO2) asidefrom oxygen, which may further accelerate the decompositionof organics as it is an even more proficient oxidant (Góbiet al. 2016b). It has also been previously shown that twoparallel decay mechanisms coexist when amino acids areirradiated in the presence of magnesium perchlorate hexahy-drate (Mg(ClO4)2·6H2O): the radiolytic decomposition of theorganic molecule by the energetic electrons and the oxidationof the molecule and its irradiation products by oxygen formedupon the irradiation of neighboring perchlorate units (Góbiet al. 2016a). It is important to note that the most stable form ofmagnesium perchlorate under Martian conditions is hexahy-drate (Chevrier et al. 2009; Toner et al. 2014). Increasedformation rates of oxidized products such as carbon dioxide(CO2) confirmed the conclusion that the active oxygenoriginating from radiolysis of perchlorate -( )ClO4 accountsfor the elevated rates of decomposition as well. Furthermore,the detailed decomposition mechanism of glycine and the effectof the organics–perchlorate ratio were studied in a recent paperutilizing the PI-ReTOF-MS method (Góbi et al. 2017).Although these previous works unraveled the detailedmechanisms on the destruction of the simplest amino acid—glycine (H2NCH2COOH)—on Mars, the destruction ofnucleobases in the presence of an oxidizer under conditionsprevalent in Mars have never been investigated so far.Here, we aim to detect the decomposition and oxidation
products of adenine (C5H5N5) in the absence/presence ofperchlorates by means of Fourier Transformation InfraredSpectroscopy (FTIR) and state-of-the-art single photon photo-ionization reflectron time-of-flight mass spectrometry (PI-ReTOF-MS; Jones & Kaiser 2013; Maity et al. 2014; Tarczayet al. 2016). PI-ReTOF-MS has the unique advantage thatfragmentation of the sublimed and ionized species are negligiblein almost all cases, meaning that only the parent molecular ionscan be observed (Abplanalp et al. 2015; Turner et al. 2015); it isalso possible to discriminate between the structural isomers of amolecular formula based on their different ionization energies(Abplanalp et al. 2015). Therefore, the present PI-ReTOF-MSstudy represents an ideal approach to explore and to identify theradiolytic oxidation products of adenine (C5H5N5) exposed toenergetic electrons in the presence of perchlorates.
2
The Astrophysical Journal, 838:84 (21pp), 2017 April 1 Góbi, Bergantini, & Kaiser

Table 1Summary of Previous Experimental Results of the Radiolysis of Adenine Films under Simulated Martian Conditions
Adenine Sample Atmosphere (mbar) Temperature (K) Type of Radiation Admixtures Products References
Absorbed on powderedquartz (SiO2)
10−3 and various levelsof oxygen (O2)
<263, 298 UV, 200–300 nm K Not specified Oró & Hol-zer 1979
Thin layers on magnesiumfluoride (MgF2) window
Not specified 251–303 Solar UV K Not specified Guan et al. 2010
1.:L 1.: Nitriles (R–C≡N)130±14 nm thick layer on asilver (Ag) substrate
8×10⁻¹¹ 11.4±0.3 5 keV e− 2.: 500 nm thick O2 ice ontop of the sample
2.: Nitriles (R–C≡N), epoxides (C–O–C), carbonylfunctional group (R1R2–C=O)
Evans et al. 2011
6.9±0.11.: Pure argon (Ar)
Powder 2.: Mars analog(95.3% CO2)
293 UV-C, 200–280 nm K Monitoring only methane (CH4) formation Schuergeret al. 2011
3.: Pure nitrogen (N2)Adsorbed on magnesium oxide(MgO) and forsterite(Mg2SiO4)
10−2–10−3 Not specified UV, 185–2000 nm K Not specified Fornaro
et al. 2013
Thin layers on MgF2 window 10−4 Not specified 115–300 nm K Not specified Saïagh et al. 2014Thin layers on MgF2 window 6±1, nitrogen (N2) 218±2 UV, 190–400 nm K Amine functional groups (–NH2), isocyanides (R–
N=C) and/or nitriles (R–C≡N) involved in anextended conjugated system (as –C=C–C=N–).
Poch et al. 2014
Thin layers on MgF2 window 6±1(N2) 218±2 UV, 190–400 nm Nontronite phyllosilicate Same as in Poch et al. 2014 Poch et al. 2015
3
TheAstro
physica
lJourn
al,
838:84(21pp),
2017April
1Góbi,
Bergantini,
&Kaiser

2. Experiment
The experiments were conducted in a contamination-freeultra-high vacuum (UHV) stainless steel chamber that can beevacuated to a base pressure of a few 10−11 mbar using oil-freemagnetically suspended turbomolecular pumps and dry scrollbacking pumps (Jones & Kaiser 2013; Maity et al. 2014;Tarczay et al. 2016). A polished silver mirror is mounted onto acold finger made of oxygen-free high conductivity copper(OFHC) using indium foil to ensure thermal conductivity. Thecold finger is cooled by a closed-cycle helium refrigerator(Sumitomo Heavy Industries, RDK-415E) while the temper-ature can be maintained by the help of a heater connected to aprogrammable temperature controller. The entire setup is freelyrotatable within the horizontal center plane and translatable inthe vertical axis via UHV compatible bellows and adifferentially pumped rotational feedthrough. The silver mirroris used as a substrate and can be cooled down to 5.5±0.1 K. Itshould be pointed out that this temperature is well below that ofthe surface of 160 to 240 K, and therefore does not representthe Martian environment. Nevertheless, these experimentsserve as a proof-of-concept study to unravel the decaymechanism of adenine (C5H5N5) as well as the formationpathways of irradiation products like isocyanic acid (HNCO)when irradiated with energetic electrons. A schematic view ofthe simulation chamber discussing its geometry, the relativeposition of the instruments, and a general description of theexperimental procedure can be found in Jones & Kaiser (2013).
Films with a nominal thickness of 1 μm on the silversubstrates were prepared by using pure adenine (C5H5N5,Sigma Aldrich, 99+%) and its 1:1 mixture with magnesiumperchlorate hexahydrate (Mg(ClO4)2·6H2O, Sigma Aldrich,99.0+%, Table 2). By knowing the volume of the solutionadded onto the substrate, the average density and area of thesolid sample and the average sample thicknesses could also becalculated. The samples were prepared by utilizing the methodestablished in our previous work (Góbi et al. 2016a). Briefly,pure adenine (for the neat adenine samples) or adenine withMg(ClO4)2·6H2O in a 1:1 molar ratio (for the adenine–Mg(ClO4)2·6H2O 1:1 mixture samples) were dissolved indistilled water (H2O), then 0.250–0.390 ml of these solutions(Table 2) was placed onto the surface of the silver substrates.The solvent was evaporated by heating the samples up to323–333 K. The samples were then inserted into the mainchamber; after its evacuation, the chamber was warmed up fortwo days to eliminate water and residual gases. It is importantto point out that their temperature never exceeded 320 K,ensuring that none of the sample material is lost during this“bakeout” process. The substrates with the sample films onthem were then cooled down to 5.5±0.1 K and bombardedisothermally with 5 keV electrons for 3 hr at a current of265–290 nA over an area of 1.5±0.3 cm2 at an angle ofincidence of 70° relative to the surface normal (Table 2). Theemission current was measured before and after irradiationutilizing a Faraday cup (Kimball Physics, FC-71) mountedinside the main chamber.
Based on the average electron currents, the samples wereexposed to 1.79–1.95×10¹⁴ electrons during the irradiation.Monte Carlo (CASINO) simulations (Drouin et al. 2007) werealso performed to estimate the average dose absorbed by themolecules in the sample and were found to be 335–340 eV peradenine (C5H5N5) molecule and 820 eV per Mg(ClO4)2·6H2O
molecule. These doses correspond to about six to sevenhundred million years of exposure time 2–3 cm below theMartian surface (Pavlov et al. 2012). It is worth noting that thethickness of the samples of about 1100 nm was significantlylarger than the calculated average penetration depth of theelectrons (180–200 nm, Table 2), verifying that the electronsinteracted only with the deposited sample molecules but notwith the silver substrate itself. It should be emphasized that thehigh electron current (therefore the high dose) was neededbecause of the already-mentioned resistant nature of adenine(C5H5N5) to energetic irradiations, and preliminary experi-ments made by Evans et al. (2011) showed that lower doses donot destroy the adenine molecule and yield the radiolysisproducts to a sufficient degree. A blank experiment (a samplecontaining only Mg(ClO4)2·6H2O) was also carried out inorder to monitor potential contaminants.The electron radiolysis of the samples was monitored online
and in situ by means of an FTIR spectrometer (Nicolet 6700) inthe range of 4000–650 cm−1 at a resolution of 4 cm−1. Eachspectrum was collected for two minutes, resulting in a set of 90infrared spectra during the radiation exposure for both systems.To detect the species sublimed into the gas phase, an electronionization quadrupole mass spectrometer (EI-QMS, ExtrelModel 5221) operating in residual gas analyzer mode wasutilized in the mass range of 1–100 m/z; the electron impactenergy was set to 70 eV. After irradiating the sample, it waskept at 5.5±0.1 K for one additional hour to make sure itreaches the state of equilibrium; then, temperature-programmeddesorption (TPD) studies were conducted by warming them upto 300 K at a rate of 1.0 K min−1. Once the sample reached300 K, it was kept at this temperature for an additional 3 hr tolet the irradiation products diffuse out of the sample and intothe gas phase completely. During the TPD process, thesubliming molecules were monitored using the PI-ReTOF-MS instrument (Jordan TOF Products Inc.; Jones & Kai-ser 2013) by ionizing them via single photon ionization withcoherent vacuum ultraviolet (VUV) light. Pulsed VUV lightwith a wavelength of 118.2 nm (10.49 eV) was generated bynonlinear four-wave mixing utilizing xenon (Xe) gas as thenonlinear medium (Hilbig & Wallenstein 1981; Maity et al.2014). Fully detailed discussion of the PI-ReTOF-MStechnique, the VUV laser generation by four-wave mixing,and applicability of this method to astrophysically relevantsamples can be found in previous papers presented by ourgroup (Maity et al. 2014; Abplanalp et al. 2015, see also theirSupplementary Information and Appendix). PI-ReTOF-MSmeasurements of Mars-relevant samples were discussed inGóbi et al. (2017).
3. Results
3.1. Infrared Spectrum of the Adenine and Adenine–Magnesium Perchlorate Hexahydrate Samples
3.1.1. Neat Adenine Samples
The FTIR spectra of the neat adenine (C5H5N5) and adenine–magnesium perchlorate hexahydrate (Mg(ClO4)2·6H2O) mix-ture in the range of 4000 and 650 cm−1 are shown in Figure 1.The assignments of adenine (C5H5N5) vibrational modes aresummarized in Table 3; these features have been well-known fordecades, and our spectra of the neat adenine sample (Figure 1(a))shows excellent agreement with those of previous works
4
The Astrophysical Journal, 838:84 (21pp), 2017 April 1 Góbi, Bergantini, & Kaiser

(Nowak et al. 1996; Mohamed et al. 2009; Evans et al. 2011). Abroad and intense band can be observed in the 3450–2890 cm−1
region of the neat adenine (C5H5N5) sample; this originatesprimarily from the N–H and C–H stretching vibrations of theadenine molecule. Namely, the following vibrational modesaccount for this absorption feature: the very weak antisymmetricand a doublet of the symmetric stretching vibrations of the amine(–NH2) group (νas NH2 at 3426 cm−1 and νs NH2 at 3294 and3260 cm−1) as well as the stretching vibrations of the N–H andC–H moieties (ν N(9)–H at 3354 cm−1, ν C(8)–H between 3190and 3000 cm−1, and ν C(2)–H) in the range of 2995–2890 cm−1),respectively. The numbers in parentheses mark the label of therespective atom before them; see also Figure 1(a) for the atomiclabeling of the most stable N(9)–H tautomer of the adenine(C5H5N5) molecule. Similarly to the glycine (H2NCH2COOH)molecule—although to a lesser extent—a broad band ofcombinational bands and overtones can also be seen between2885 and 2435 cm−1; the broadening of all the vibrational modesmentioned above is likely caused by the Fermi resonancebetween the N–H and C–H stretching vibrations and thesecombinational bands (Góbi et al. 2016a). In the mid-IR region,the bending mode of the –NH2 group (β NH2, 1690 cm
−1) andthe stretching modes of the C–N and C–C bonds of the six-membered ring of the molecule (ν CN (R6) and ν CC (R6) at1619 and 1600 cm−1 respectively) can be identified; both peaksare exceptionally strong. Note that (R5) and (R6) denote whether
the respective vibrational mode occurs in the five- or six-membered ring of the adenine molecule. Further, ring vibrationmodes with lower intensities can also be detected at lowerwavelengths: the C–N stretching vibrations of the five- and six-membered rings (ν CN (R5) at 1509, 1338, 1257, 1235, 1165,and 1131 cm−1 and ν CN (R6) at 1485 and 1315 cm−1), the C–Cvibration of the six-membered ring (ν CC (R6), 1459 cm−1), andthe C(6)–N(10) stretching vibration (ν C(6)N(10), 1374 cm−1). Itis worth noting that all these modes are coupled: their PotentialEnergy Distributions (PEDs) show that numerous vibrationalmodes may contribute to these vibrations and even the mostsignificant one can have a contribution less than 20% (Table 3;for the complete PEDs, see the work of Mohamed et al. 2009).The bending mode of the C–H moieties can be found at 1424 (βC(2)H) and 1280 cm−1 (β C(8)H), whereas the same mode forthe N–H group (β N(9)H) is at 1066 cm−1. At wavelengths of918 and 892 cm−1, vibrations of the N–C–N blocks of the five-(β NCN (R5)) and six-membered rings (β NCN (R6)) of theadenine (C5H5N5) molecule can also be detected. Other peaks inthe low-frequency region belong to the rocking vibration of the –NH2 group (ρ NH2, 1029 cm
−1), wagging of C–H moieties (ωC(2)H at 946 cm−1 and ω C(8)H at 852 cm−1), and the torsionaland breathing motions of the six-membered ring (τ R6 and R6breath at 799 and 727 cm−1, respectively).Changes were induced in the IR spectrum of the neat adenine
(C5H5N5) sample when irradiated with energetic electrons. The
Table 2Summary of Adenine and Adenine–Mg(ClO4)2·6H2O 1:1 Sample Preparation Details and the CASINO Simulations Performed on the
Electron Radiolysis Experiments
Adenine Adenine–Mg(ClO4)2·6H2O 1:1
Mass of adenine (g) 0.0383±0.0001 0.0103±0.0001Mass of Mg(ClO4)2·6H2O (g) 0.0000±0.0000 0.0270±0.0001Mass of solvent H2O (g) 50.02±0.01 25.68±0.01Mg(ClO4)2·6H2O to adenine molar ratio K 1.07±0.01Volume of solution used (mL) 0.390±0.005 0.250±0.005Average density of film (g cm−3) 1.49±0.01 1.82±0.02a
Average thickness of sample (nm) 1160±160 1170±260Molar masses of molecules in film (g mol−1) 135.13 135.13b 236.50±0.51d
331.30c
Sample surface area (cm2) 1.72±0.10 1.72±0.10Number of molecules in sample (×1017) 13.3±1.7 4.48±0.69b
4.79±0.73c
Angle of incidence (°) 70 70Irradiated area (cm2) 1.5±0.3 1.5±0.3Irradiation time (s) 3600±2 3600±2Applied electron current (nA) 265±20 290±20Number of electrons generated (×1016) 1.79±0.14 1.95±0.13Initial energy of the electrons (keV) 5.00 5.00Average backscattered energy of the electrons (keV) 3.32±0.07 3.38±0.06Average transmitted energy of the electrons (keV) 0.00±0.00 0.00±0.00Fraction of backscattered electrons (%) 35.6±2.5 37.5±2.4Fraction of transmitted electrons (%) 0.0±0.0 0.0±0.0Simulated average penetration depth (nm) 200±15 180±10Number of exposed molecules (×1016) 20.1±0.4 6.05±1.27b
6.47±1.36c
Dose per molecule (eV) 340±77 335±75b
820±180c
Notes.a To calculate the average value, the density of Mg(ClO4)2·6H2O was approximated to be 1.98±0.03 g cm−3 (Lewis 2007).b Adenine.c Mg(ClO4)2·6H2O.d Average value calculated by weighting the molar masses of adenine and Mg(ClO4)2·6H2O with their experimentally determined molar ratios.
5
The Astrophysical Journal, 838:84 (21pp), 2017 April 1 Góbi, Bergantini, & Kaiser

spectra before and after the irradiation evidently differ fromeach other (Figure 1(a)); this is in complete accordance withradiolysis studies of adenine samples done previously (Table 1).In general, all bands decrease—and some even broaden and/orshift toward lower/higher frequencies—suggesting that theadenine (C5H5N5) molecules are being efficiently destroyedduring the irradiation. The broadening may be an evidence forthe formation of radiolysis products as well as the degradationof the crystal structure of adenine (amorphization). Besides thisubiquitous phenomenon, there is only one new and extremelyweak signal that can be observed at 2213 cm−1 belonging to the
stretching vibration of the nitrile moiety (ν C≡N; Figures 1(a)and (c)) of an organic nitrile with a general formula of R–C≡N.The appearance of this functional group was predicted based onthe previous electron irradiation study of adenine (C5H5N5;Evans et al. 2011).
3.1.2. Adenine–Magnesium Perchlorate Hexahydrate Samples
The FTIR spectrum of the adenine (C5H5N5)–magnesiumperchlorate hexahydrate (Mg(ClO4)2·6H2O) 1:1 sample isdisplayed in Figure 1(b), whereas the assignment of itsvibrational modes is summarized in Table 3. Fundamental
Figure 1. Infrared spectra of the (a) neat adenine and (b) adenine–Mg(ClO4)2·6H2O 1:1 mixture prior to (black line) and after irradiation (red line). Panels (c) and (d)display selected areas of (a) and (b) showing the deconvoluted absorption peaks of the irradiation products with the following band positions: (c) 2213 cm−1 (“R–CN”), (d) 2252 cm−1 (HNCO), 2205 cm−1 (VIII), 2168 cm−1 (OCN−), and 2139 cm−1 (CO). The inset in Figure 1(a) shows the N(9)–H tautomer of the adenine withthe atomic labels.
6
The Astrophysical Journal, 838:84 (21pp), 2017 April 1 Góbi, Bergantini, & Kaiser
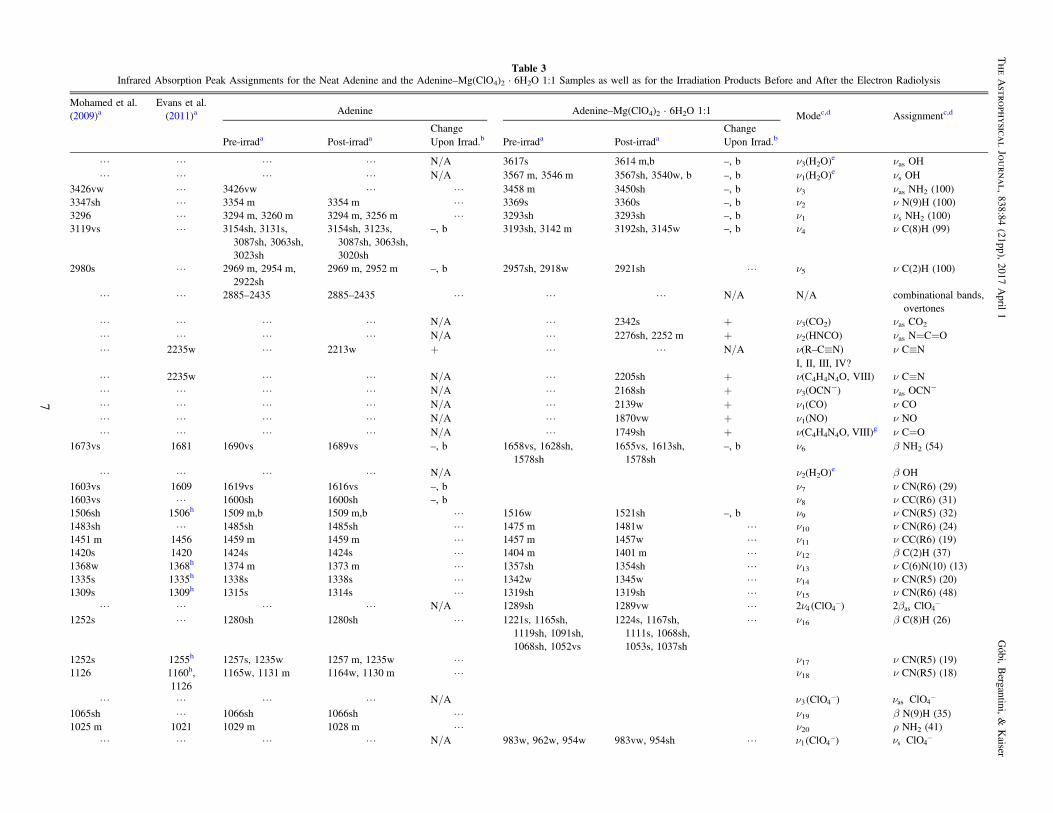
Table 3Infrared Absorption Peak Assignments for the Neat Adenine and the Adenine–Mg(ClO4)2·6H2O 1:1 Samples as well as for the Irradiation Products Before and After the Electron Radiolysis
Mohamed et al.(2009)a
Evans et al.(2011)a Adenine Adenine–Mg(ClO4)2·6H2O 1:1 Modec,d Assignmentc,d
Pre-irrada Post-irradaChangeUpon Irrad.b Pre-irrada Post-irrada
ChangeUpon Irrad.b
L L L L N/A 3617s 3614 m,b –, b ν3(H2O)e νas OH
L L L L N/A 3567 m, 3546 m 3567sh, 3540w, b –, b ν1(H2O)e νs OH
3426vw L 3426vw L L 3458 m 3450sh –, b ν3 νas NH2 (100)3347sh L 3354 m 3354 m L 3369s 3360s –, b ν2 ν N(9)H (100)3296 L 3294 m, 3260 m 3294 m, 3256 m L 3293sh 3293sh –, b ν1 νs NH2 (100)3119vs L 3154sh, 3131s,
3087sh, 3063sh,3023sh
3154sh, 3123s,3087sh, 3063sh,3020sh
–, b 3193sh, 3142 m 3192sh, 3145w –, b ν4 ν C(8)H (99)
2980s L 2969 m, 2954 m,2922sh
2969 m, 2952 m –, b 2957sh, 2918w 2921sh L ν5 ν C(2)H (100)
L L 2885–2435 2885–2435 L L L N/A N/A combinational bands,overtones
L L L L N/A L 2342s + ν3(CO2) νas CO2
L L L L N/A L 2276sh, 2252 m + ν2(HNCO) νas N=C=OL 2235w L 2213w + L L N/A ν(R–C≡N) ν C≡N
I, II, III, IV?L 2235w L L N/A L 2205sh + ν(C4H4N4O, VIII) ν C≡NL L L L N/A L 2168sh + ν3(OCN
−) νas OCN−
L L L L N/A L 2139w + ν1(CO) ν COL L L L N/A L 1870vw + ν1(NO) ν NOL L L L N/A L 1749sh + ν(C4H4N4O, VIII)
g ν C=O1673vs 1681 1690vs 1689vs –, b 1658vs, 1628sh,
1578sh1655vs, 1613sh,1578sh
–, b ν6 β NH2 (54)
L L L L N/A ν2(H2O)e β OH
1603vs 1609 1619vs 1616vs –, b ν7 ν CN(R6) (29)1603vs L 1600sh 1600sh –, b ν8 ν CC(R6) (31)1506sh 1506h 1509 m,b 1509 m,b L 1516w 1521sh –, b ν9 ν CN(R5) (32)1483sh L 1485sh 1485sh L 1475 m 1481w L ν10 ν CN(R6) (24)1451 m 1456 1459 m 1459 m L 1457 m 1457w L ν11 ν CC(R6) (19)1420s 1420 1424s 1424s L 1404 m 1401 m L ν12 β C(2)H (37)1368w 1368h 1374 m 1373 m L 1357sh 1354sh L ν13 ν C(6)N(10) (13)1335s 1335h 1338s 1338s L 1342w 1345w L ν14 ν CN(R5) (20)1309s 1309h 1315s 1314s L 1319sh 1319sh L ν15 ν CN(R6) (48)
L L L L N/A 1289sh 1289vw L n -( )2 ClO4 4 b -2 ClOas 4
1252s L 1280sh 1280sh L 1221s, 1165sh,1119sh, 1091sh,1068sh, 1052vs
1224s, 1167sh,1111s, 1068sh,1053s, 1037sh
L ν16 β C(8)H (26)
1252s 1255h 1257s, 1235w 1257 m, 1235w L ν17 ν CN(R5) (19)1126 1160h,
11261165w, 1131 m 1164w, 1130 m L ν18 ν CN(R5) (18)
L L L L N/A n -( )ClO3 4 n -ClOas 4
1065sh L 1066sh 1066sh L ν19 β N(9)H (35)1025 m 1021 1029 m 1028 m L ν20 ρ NH2 (41)
L L L L N/A 983w, 962w, 954w 983vw, 954sh L n -( )ClO1 4 n -ClOs 4
7
TheAstro
physica
lJourn
al,
838:84(21pp),
2017April
1Góbi,
Bergantini,
&Kaiser

Table 3(Continued)
Mohamed et al.(2009)a
Evans et al.(2011)a Adenine Adenine–Mg(ClO4)2·6H2O 1:1 Modec,d Assignmentc,d
Pre-irrada Post-irradaChangeUpon Irrad.b Pre-irrada Post-irrada
ChangeUpon Irrad.b
939s 944h 946s 946s L 949sh 949vw, b L ν21 ω C(2)H (100)913s 914h 918 m 918 m L 916w, b 916sh L ν22 β NCN(R5) (54)872sh L 892w 893w –, b 871sh 871sh L ν23 β NCN(R6) (51)846sh 850 852w 851w –, b ν24 ω C(8)H (100)797w 800 799w 799w L 797w 797w L ν25 τ R6 (81)723 m 723 727 m 727 m L 727w, b 724w, b L ν26 R6 breath (22)
Notes.a Wavenumber in cm−1, vs: very strong, s: strong, m: medium, w: weak, vw: very weak, sh: shoulder, b: broad, –: no signal.b–/+: decrease/increase of signal, b: broadening upon irradiation, N/A: not applicable.
c Assignment of the adenine vibrations based on Mohamed et al. (2009), level of theory used: MP2/6-31G(d). Only the vibrational modes with the biggest PED contributions (in parentheses after the vibrational mode,given in percentage) are listed; see full PED in reference. Type of vibrational modes: ν: stretching, β: bending (scissoring), ρ: rocking, ω: wagging, τ: torsional, s: symmetric, as: antisymmetric; 2βas -ClO4 denotes thefirst overtone of the antisymmetric bending vibration of the -ClO4 unit. The number in parentheses after the atom shows its label; see the inset in Figure 1(a) for the atomic labeling of the adenine molecule. (R5): five-membered ring, (R6): six-membered ring. N/A: not applicable,?: tentative assignment.d Assignment of other species are based on the following references: Miller & Wilkins (1952), Bishop et al. (2014), and Hanley et al. (2015) for Mg(ClO4)2·6H2O; Gerakines et al. (1995) for CO and CO2; Fateley et al.(1959) and Stirling et al. (1994) for NO; Broekhuizen et al. (2004) and Bennett et al. (2010) for OCN−; Lowenthal et al. (2002), and Broekhuizen et al. (2004) for HNCO; Seki & Ikariya (2009) for VIII.e Vibrations of crystalline water in Mg(ClO4)2·6H2O.f Formed in the irradiated neat adenine sample.g Formed in the irradiated adenine–Mg(ClO4)2·6H2O 1:1 mixture sample.h Reassigned modes.
8
TheAstro
physica
lJourn
al,
838:84(21pp),
2017April
1Góbi,
Bergantini,
&Kaiser

differences are observed when comparing the FTIR spectra ofthe neat and mixture samples. Most importantly, the character-istic broad band of the combinational bands and overtones of thevibrational modes of neat adenine (C5H5N5) between 2885 and2435 cm−1 disappears in the mixture sample; furthermore, mostof the peaks are shifted toward lower or higher wavelengths, andseveral new absorption peaks can be detected. One of these newsignals can be assigned to the antisymmetric (νas OH,3617 cm−1) and symmetric (νs OH, 3567 and 3546 cm−1)stretching vibrations of the O–H functional group of thecrystalline water in magnesium perchlorate hexahydrate (Mg(ClO4)2·6H2O). The other, more prominent new absorptionfeature belongs to the antisymmetric (n -ClOas 4 , in the region of1310–990 cm−1) and symmetric vibrations (n -ClOas 4 , between990 and 940 cm−1) of the perchlorate unit (Miller & Wilkins1952; Bishop et al. 2014; Hanley et al. 2015). A weak shoulderis also detectable at 1289 cm−1 caused by the second harmonicof the antisymmetric bending vibration of the perchlorate unit( b -2 ClOas 4 ). The position and shape of the perchloratevibrational band also agrees well with our previous results(Góbi et al. 2016a, 2016b, 2017). It is worth noting that multiplevibrational modes of the adenine (C5H5N5) molecule overlapwith this particularly intense band of the perchlorate unit
-( )ClO4 ; these are the stretching vibrations of the C–Nmolecules in the five-membered ring (ν CN (R5)), the bendingmotions of C–H (β C(8)H) and N–H (β N(9)H) moieties, therocking of the –NH2 group (ρ NH2), and the wagging of a C–Hbond (ω C(2)H). The best example for the aforementionedchange in band positions is the stretching vibration of the –NH2
functional group; its maximum moves by +32 cm−1 to3458 cm−1 in the mixture sample. This phenomenon—similarlyto the case of glycine (H2NCH2COOH, (Góbi et al. 2016a))—might be explained by the possible formation of hydrogen bondswith the oxygen atoms of crystalline water in magnesiumperchlorate hexahydrate (Mg(ClO4)2·6H2O), although to asmaller extent, almost all modes are shifted at leastby±10–20 cm−1 compared to the neat adenine (C5H5N5)samples. The bending vibration of crystalline water (β OH)can be detected at around 1624 cm−1, which is also superposedby some of the adenine (C5H5N5) vibrational modes, namely the–NH2 bending (β NH2) and C–N and C–C vibrations of the six-membered ring (ν CC (R6) and ν CN (R6)), causing them tomerge into one absorption peak with exceptionally highintensity. The last apparent difference between the neat sampleand the mixture with magnesium perchlorate hexahydrate (Mg(ClO4)2·6H2O) is the merger of two peaks resulting in ashoulder of the broad perchlorate absorption feature: the bendingmotion of the NCN atoms in the six-membered ring (β NCN(R6)) and the wagging of one of the C–H group (ω C(8)H).
Similar conclusions can be drawn if the sample containingboth adenine (C5H5N5) and magnesium perchlorate hexahy-drate (Mg(ClO4)2·6H2O) is irradiated with high-energyelectrons: besides the ubiquitous decrease of the fundamentals,broadening, and shift of the reactant peaks—due to thedegradation and amorphization of the crystal structure—theformation of new species can also be observed. However, incontrast to the neat samples, this phenomenon is moreemphasized; numerous new and intense carriers emerge uponirradiation particularly in the region of 2400–2050 cm−1
(Figure 1b). The broadening is especially prominent in thecase of the –NH2 (νas NH2, peak maximum at 3450 cm−1 after
irradiation), N–H (ν N(9)H, 3360 cm−1), and C–H (ν C(8)Hand ν C(2)H, at 3145 and 2921 cm−1, respectively) stretchingvibrations at wavelengths between 3500 and 2900 cm−1. Thesame holds true for the region of 1850–1310 cm−1 comprisingtwo new emerging signals, and the already well-knownabsorptions of the stretching modes of the C–N (ν CN (R5)at 1521 and 1345 cm−1 after irradiation, ν CN (R6) at 1481 and1319 cm−1) and C–C vibrations of the five- and six-memberedrings, the bending motions of the –NH2 (β NH2) and O–Hmoieties (β OH, both of them at around 1655 cm−1 along withother C–C and C–N vibrations), and that of one C–H group (βC(2)H at 1401 cm−1).The aforementioned new absorption signals can be found at
2342 cm−1, between 2310 and 2060 cm−1, and as a shoulder inthe range of 1850–1730 cm−1. The first one can be assigned as theantisymmetric stretching vibration of the carbon dioxide (CO2)molecule (Gerakines et al. 1995), whereas the last one belongs toa carbonyl stretching vibration (ν C=O) of a hitherto unknownadenine (C5H5N5) irradiation product (denoted as species VIIIthereafter, Table 3; see also Section 4.1.2) and possibly to thestretching vibration of the nitrogen monoxide (NO) molecule (νNO, 1870 cm−1 (Fateley et al. 1959; Stirling et al. 1994)). Thesecond feature consists of multiple peaks that can be deconvolutedas seen in Figure 1(d); the maxima of these peaks are at 2252,2205, 2168, and 2139 cm−1. These can be assigned to theN=C=O antisymmetric vibration of the HNCO (isocyanic acid,Lowenthal et al. 2002; Broekhuizen et al. 2004) molecule (νasNCO), the stretching vibration of the C≡N (ν CN) in an organicnitrile molecule (R–C≡N, similarly to the neat adenine samplealthough it is likely caused by species VIII, the antisymmetricstretching vibration of the OCN− (isocyanate) ion (νas OCN
−,Broekhuizen et al. 2004; Bennett et al. 2010)), and the stretchingvibration of the CO (carbon monoxide) molecule (Gerakineset al. 1995). The formation of new irradiation products agrees wellwith the findings of Evans et al. (2011); they also identified theR–C≡N and R–C=O groups as well as the presence of nitrogenmonoxide (NO) at 1870 cm−1, although the latter was assigned tothe stretching vibration of the carbonyl group as well. It is alsolikely that the general broadening of the adenine (C5H5N5) peaksupon irradiation is at least partially caused by the formation ofother new radiolysis products, similarly to the case of irradiatedglycine (H2NCH2COOH)—magnesium perchlorate hexahydrate(Mg(ClO4)2·6H2O, (Góbi et al. 2016a, 2017)), where ammonia(NH3) and methylamine (CH3NH2) were both observed.
3.2. TPD Profiles of Adenine and Adenine–MagnesiumPerchlorate Hexahydrate Samples
3.2.1. Species Related to the Electron Radiolysis of the Adenine–Nitrogen Monoxide, Cyanamide, and Cyanoimidogen Radical
Figure 2(a) shows the EI-QMS TPDs of m/z=28 (black),32 (red), and 44 (blue), whereas Figures 2(b)–(f) reveal the PI-ReTOF-MS TPDs of m/z=30 (Figure 2(e)), 40 (Figure 2(c)),42 (Figure 2(d)), 67, 69 (Figure 2(b)), and 135 (Figure 2(f)).The species with the lowest mass-to-charge ratio in the PI-ReTOF-MS spectrum (30) is nitrogen monoxide (NO,Figure 2(e), ionization energy (IE)=9.2643±0.0002, (Ebataet al. 1983)), which starts subliming at 250 K and appears onlyin the sample containing oxygen atoms upon irradiation(adenine (C5H5N5)–magnesium perchlorate hexahydrate (Mg(ClO4)2·6H2O) 1 :1 mixture); its presence is also confirmed
9
The Astrophysical Journal, 838:84 (21pp), 2017 April 1 Góbi, Bergantini, & Kaiser

by its IR signal (see Section 3.1.2 and Table 3). This is incontrast to the value obtained by previous PI-ReTOF-MS TPDinvestigations that successfully produced nitrogen monoxidein situ by electron radiolysis of solid nitromethane (CH3NO2)ices (Kaiser & Maksyutenko 2015; Maksyutenko et al. 2016).They found that the irradiation product nitrogen monoxidestarts subliming at around 150 K and the elevated sublimationtemperature in the current study implies that this species formsby the oxidation of adenine (C5H5N5) or its irradiation product(s) and is presumably associated with the heating of the sample(Section 4.1.2).
In contrast to nitrogen monoxide (NO), the signal of the parentmolecular ion of the adenine (C5H5N5, IE=8.2±0.03, (Schwellet al. 2006)) at m/z=135 can only be detected in neat adenineand completely disappears in the mixture sample due to theoxidation reactions as detailed below; its sublimation starts atapproximately 280K (Figure 2(f)). It is worth noting that adeninedoes not undergo dissociative photoionization below IEs of 12 eV(Pilling et al. 2007), thus none of its fragments is expected to showup in the PI-ReTOF-MS TPD profiles. There are two signals thatcan be attributed to the radiolytic destruction of adenine (C5H5N5)and can be detected at m/z=40 (Figure 2(c)) and 42(Figure 2(d)). Whereas the latter possibly belongs to cyanamide(H2N–C≡N, IE=10.4 eV (Guimon et al. 1989)), the former is a
likely fragmentation product of cyanamide formed by H2-loss(cyanoimidogen, N–C≡N), justified by their almost identical peakposition and shape although its appearance and ionization energiesupon photoionization are unknown. It is important to point out thatthis species cannot account for the FTIR signal at 2213 and2205 cm−1 in the neat and mixture samples as its absorbs at higherwavelengths (2264 cm−1, King & Strope 1971). The same holdstrue for the new IR band at 2252 cm−1 in the mixture sample; asthe signal of cyanamide in the PI-ReTOF-MS spectrum becomeseven smaller compared to that of the neat adenine (C5H5N5)sample, it cannot account for the appearance of an intense newabsorption peak in the FTIR spectrum. The lower PI-ReTOF-MSsignal in the adenine–magnesium perchlorate hexahydrate (Mg(ClO4)2·6H2O) 1:1 mixture also implies that cyanamide may alsobe oxidized in the presence of an oxidizing agent; see Figures 3and 4 and Section 4.1 for more details on its possible formationmechanisms. Their sublimation temperature also shifted towardhigher temperatures that can be caused by the different molecularenvironment, the presence of magnesium perchlorate hexahydrate.The other irradiation products detected by means of the FTIRspectrometer have IEs too high to be ionized by the photoioniza-tion energy used; these are 14.0142±0.0003 (CO, Ermanet al. 1993), 11.759±0.006 (OCN radical, Ruscic & Berkowitz
Figure 2. EI-QMS of the neat adenine sample (a) and PI-ReTOF-MS (b)–(f) TPD profiles of neat Mg(ClO4)2·6H2O (black line, the data presented in Góbi et al.2016b), neat adenine (blue) and the adenine–Mg(ClO4)2·6H2O 1:1 mixture (red) samples. The panels show the species with the following m/z values: (a) 28 (CO,black), 32 (O2, red), and 44 (CO2 blue), (b) 67 (35ClO2, solid line) and 69 (37ClO2, dashed line), (c) 40 (NCN), (d) 42 (H2N-CN), (e) 30 (NO), and (f) 135 (adenine).The asterisk in panel (a) shows a masked artifact caused by the saturation of the detector due to the extremely intense O2 peak signal.
10
The Astrophysical Journal, 838:84 (21pp), 2017 April 1 Góbi, Bergantini, & Kaiser
1994), 11.595±0.005 (HNCO, Ruscic & Berkowitz 1994), and13.774±0.003 eV (CO2, Parr & Taylor 1974).
3.2.2. Species Related to the Oxidation of Adenine in the Adenine–Magnesium Perchlorate Hexahydrate Samples
Carbon monoxide (CO, m/z=28, black), molecular oxygen(O2, m/z=32, red), and carbon dioxide (CO2, m/z=44, blue)molecules are all clearly visible in the EI-QMS of the irradiatedadenine (C5H5N5)–magnesium perchlorate hexahydrate (Mg(ClO4)2·6H2O) 1:1 mixture (Figure 2(a)). This finding thusnicely complements the PI-ReTOF-MS measurements as the IEsof these species are higher (12.0697±0.0002 eV (Tonkynet al. 1989) for O2; see Section 3.2.1 for those of the other twospecies) than the photoionization energy used (10.49 eV) andtherefore they could not be detected via the latter method. Thecarbon dioxide (CO2) signal has a similar sublimation profile tothe one found in a previous experiment that used electronirradiation of carbon dioxide (CO2)–hydrocarbon ice mixtures toproduce carboxylic acids (R–COOH, Kim & Kaiser 2010); itspresence is also confirmed by the FTIR spectrum of the sample(Figure 1(b)).
The molecular oxygen (O2) has two maxima in its TPD profile,the first at around 55K being close to the sublimation temperatureof the neat oxygen ices (Bennett et al. 2014), indicating that it iscaused by the subliming unreacted oxygen molecules. Althoughthis signal could not be detected previously in irradiated samplescontaining perchlorates (Góbi et al. 2016a, 2016b, 2017), this canbe explained by the approximately 20 times higher dose exploitedhere (820 versus 40 eV per magnesium perchlorate hexahydrate(Mg(ClO4)2·6H2O) molecule), allowing for the formation ofsignificantly more molecular oxygen as well as the more thoroughdestruction of the structure of the sample, which thus cannotwithhold the volatiles at higher temperatures. The secondsublimation event of oxygen has a broad profile and starts atabout 200K; it has a remarkably similar shape to the one that
could be obtained by irradiating neat magnesium perchloratehexahydrate (Mg(ClO4)2·6H2O) samples and can be assigned tothe oxygen released during the thermal decomposition of variouschlorine oxides (ClxOy; x=1, 2, y=1–7) formed upon theelectron irradiation of the perchlorate unit (Góbi et al. 2016b). Thisis also in coincidence with the second maxima (at around 285 K)of the 35- (35ClO2, m/z=67) and 37-chlorine dioxide (37ClO2,m/z=69) signals in the adenine (C5H5N5)—magnesium per-chlorate hexahydrate (Mg(ClO4)2·6H2O) 1 :1 mixture sample(Figure 2(b)), indicating their formation by the decomposition ofthe higher chlorine oxides.The first maxima of the chlorine dioxide isotopologue
signals could be obtained at about 190 K caused by thesemolecules formed in situ in the sample upon irradiation asfound previously (Góbi et al. 2016b). This finding is alsojustified by the fact that this peak is proportionally more intensein the mixture samples (Figure 2(b), red) than that of the neatperchlorate -( )ClO4 samples used in our earlier work(Figure 2(b), black). This may be due to the fact that thedoses used in the current experiment was about 20 timeshigher, resulting in a more effective in situ formation ofchlorine dioxide (ClO2) due to the more complete destructionof the perchlorate -( )ClO4 unit and higher chlorine oxides(ClxOy, x=1, 2, y=1–7) upon irradiation. Alternatively, thefirst sublimation event might be caused by the moleculessubliming from the upper, irradiated, and therefore alterated(amorphized) layer, whereas the second, broader band may beaccounted for by the molecules that diffused to the deeper,intact layers of the sample in the early stages of the TPD phase,which allows them to sublime at higher temperatures. It isimportant to point out that none of these species (O2, CO2,ClO2) mentioned above can be found in the irradiated neatadenine (C5H5N5) samples.The signal of carbon monoxide could also be observed in the
EI-QMS spectrum, likely predominantly from the carbon
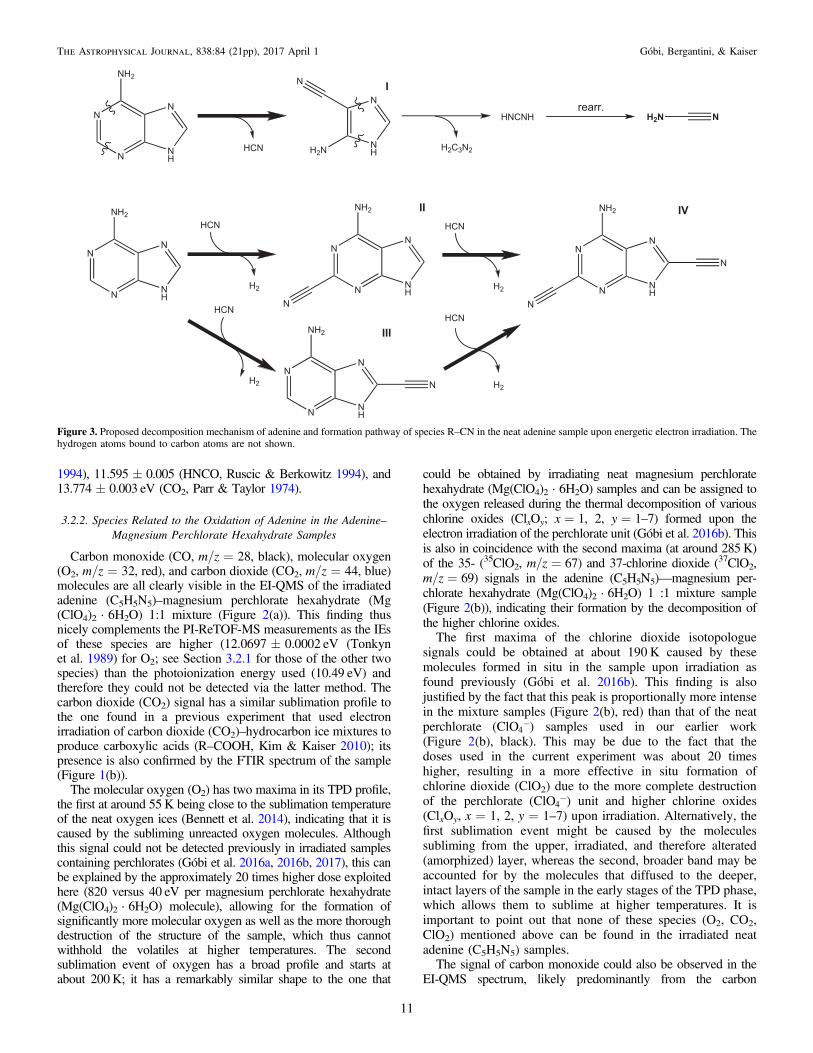
Figure 3. Proposed decomposition mechanism of adenine and formation pathway of species R–CN in the neat adenine sample upon energetic electron irradiation. Thehydrogen atoms bound to carbon atoms are not shown.
11
The Astrophysical Journal, 838:84 (21pp), 2017 April 1 Góbi, Bergantini, & Kaiser

Figure 4. Proposed decomposition pathway of adenine and formation pathways of the irradiation products in the adenine–Mg(ClO4)2·6H2O 1:1 mixture sampleupon energetic electron irradiation. Species VI in parentheses shows the unobserved derivative of molecule V. The hydrogen atoms bound to carbon atoms are notshown.
12
The Astrophysical Journal, 838:84 (21pp), 2017 April 1 Góbi, Bergantini, & Kaiser

monoxide (CO) directly with smaller contributions from thefragmentation upon 70 eV electron ionization of isocyanic acid(HNCO), and other species formed upon irradiation. In summary,a plethora of different radiolysis products can be observed in bothsamples as summarized in Table 4. These show that thevibrational modes of an organic nitrile group (R–C≡N) and thepresence of cyanamide (H2N–C≡N) and its photofragmentcyanoimidogen radical (N–C≡N) in the PI-ReTOF-MS spectrumcan be detected in the neat adenine (C5H5N5) samples uponirradiation. The formation of oxidized products can be seen in theFTIR spectrum of the irradiated adenine–magnesium perchloratehexahydrate (Mg(ClO4)2·6H2O) mixture sample besides cyana-mide and the cyanoimidogen radical such as carbon dioxide(CO2), nitrogen monoxide (NO), isocyanate anion (OCN−),isocyanic acid (HNCO), carbon monoxide (CO), and chlorinedioxide (ClO2) isotopes, and species VIII with a thus-farunknown structure discussed in Section 4.1.2 in detail. Some ofthese can also be detected with different methods, for instance thenitrogen monoxide (NO) via PI-ReTOF-MS and carbon dioxide(CO2) with the help of EI-QMS. The molecular oxygen (O2)forming upon the radiolysis of the magnesium perchloratehexahydrate (Mg(ClO4)2·6H2O) can also be monitored by theEI-QMS device as has been previously shown in earlier radiolysisstudies as well (Góbi et al. 2016b; Turner et al. 2016).
4. Discussion
4.1. Decay Mechanisms of Adenine
4.1.1. Neat Adenine Samples
The proposed decomposition mechanism of the irradiated neatadenine (C5H5N5) is shown in Figure 3. According to earlierdecomposition studies (Rice & Dudek 1967; Schwell et al. 2006;Chen et al. 2011; Minaev et al. 2014), the first step of the adeninemolecule decomposition is the cleavage of the N(1)–C(6) andC(2)–N(3) bonds resulting in the loss of a hydrogen cyanide(HCN) molecule. This latter species may then take part in anucleophile substitution on carbon atoms C(2) and/or C(8) ofanother intact adenine molecule yielding 2-cyano adenine (II,C6H4N6) and 8-cyano adenine (III, C6H4N6) or might even lead tothe eventual formation of 2, 8-dicyano adenine (IV, C7H3N7,Evans et al. 2011). It is important to note that II and III aredetected precursors in prebiotic adenine formation (Voet &
Schwartz 1983; Miller & Cleaves 2007). The other irradiationproduct of the hydrogen cyanide loss is 1H-5-aminoimidazol-4-carbonitrile (I, C4H4N4, formally the tetramer of HCN), which canfurther lose a carbodiimide (HNCNH) after the breakage ofthe N(1)–C(5) and N(3)–C(4) bonds to form the radical H2C3N2
(Rice & Dudek 1967; Schwell et al. 2006; Chen et al. 2011;Minaev et al. 2014). The carbodiimide can quickly rearrange intoits more stable tautomer cyanamide (H2N–C≡N, Maier et al.1996) and can be detected via the PI-ReTOF-MS method. It isstraightforward to assume that I, II, and III, (and presumably IV)may all account for the R–C≡N absorption peak at 2213 cm−1 inthe FTIR spectrum of the irradiated neat adenine (C5H5N5)sample.
4.1.2. Adenine–Magnesium Perchlorate Hexahydrate Samples
According to the FTIR, EI-QMS, and PI-ReTOF-MS results,a completely different radiolysis mechanism becomes predomi-nant in the presence of an oxidizing agent as revealed inFigure 4. In the first step, the adenine (C5H5N5) molecule reactswith an active oxygen atom (O) originating from the radiolysisof magnesium perchlorate hexahydrate (Mg(ClO4)2·6H2O).The oxygen atom attacks the C(2) atom of adenine, yielding2-oxo adenine (or isoguanine, V, C5H5N5O); this product isexpected to be the preferred over the alternative oxidationproduct 8-oxo adenine (VI, C5H5N5O), which could not bedetected in oxidized samples (Ibañez et al. 2015). Furthermore,the decomposition products of VI cannot be observed, contraryto those of species V, and its omission from the decompositionscheme was also confirmed by kinetic studies (Section 4.3.2).Molecule V then can either be oxidized further into the dioxo-
derivative (2,8-dioxo adenine, VII, C5H5N5O2, (Ibañezet al. 2015)) or lose an isocyanic acid (HNCO) and/or carbonmonoxide (CO)molecule, resulting in the formation of I, which isalso an irradiation product molecule during the neat adenine(C5H5N5) radiolysis as discussed in Section 4.1.1. It should bepointed out that the isocyanic acid (HNCO) or carbon monoxide(CO) loss by the cleavage of bonds N(1)–C(6) and C(2)–N(3) inmolecule V during irradiation is very similar to the firstdegradation step in the irradiated neat adenine sample. After this,VII can be oxidized to yield 1H-5-aminoimidazol-2-oxo-4-carbonitrile (VIII, C4H4N4O). The evidence for the presence ofVIII in the sample is the new arising shoulder in the FTIRspectrum of the mixture sample at roughly 1750 cm−1 assigned tocarbonyl stretching vibration (ν C=O). It is imperative to notethat the carbonyl stretching bands generally lie at lowerwavelengths (below 1700 cm−1); a vibrational frequency thishigh implies a constrained cyclic structure such as the five-membered ring in a 2-imidazolidinone-like (C3H6N2O) molecule.In an earlier work, Seki & Ikariya (2009) obtained a similarcarbonyl vibrational absorption feature when they successfullysynthesized 1,3-dimethyl-2-imidazolidinone (C5H12N2O) on acti-vated silica surfaces. Alternatively, VII could also account for thisabsorption peak having a similar ring structure as VIII; however,it is straightforward to assume that it can take part in similardegradation reactions like the adenine (C5H5N5) molecule and Valong with the loss of isocyanate (HNCO) and carbon monoxide(CO) verified by the kinetic study (Section 4.3.2). Eventually,VIII can also lose an isocyanic acid (HNCO) and/or carbonmonoxide (CO) after the breakage of the N(1)–C(5) and C(2)–N(3) bonds to yield 2-amino-propanedinitrile (or aminomalonitrile,IX, C3H3N3, formally trimer of the HCN molecule), which isanother important molecule in prebiotic nucleobase formation
Table 4Irradiation Products Detected in the Neat Adenine and the Adenine–Mg(ClO4)2·6H2O 1:1 Samples via the FTIR, PI-ReTOF-MS, and EI-QMS
Techniques
Method Adenine Adenine–Mg(ClO4)2·6H2O 1:1
FTIR R–C=N CONOOCN−
HNCOCO2
C4H4N4O (VIII)PI-ReTOF-MS N–C=N NO
H2N–C=N N–C=NH2N–C=N35ClO237ClO2
EI-QMS K COO2
CO2
13
The Astrophysical Journal, 838:84 (21pp), 2017 April 1 Góbi, Bergantini, & Kaiser

(Voet & Schwartz 1983; Raulin et al. 1984). Although theformation of IX was also confirmed by the kinetic fits(Section 4.3.2), these are expected to be slow reactions as(contrary to species VIII) it could not be observed either in EI-QMS or via PI-ReTOF-MS. Furthermore, its weak IR absorptionpeak is likely masked by the dominant species VIII at2205 cm−1. Other species such as I could also partly accountfor this nitrile stretching mode besides VIII in the irradiatedmixture sample; however, it is assumed to be quickly oxidizedinto VIII as stated above. This was also corroborated by thekinetic fits (Section 4.3.2).
The carbon monoxide (CO) formed during the radiolysis of themixture sample can easily be oxidized further, therefore it likelyaccounts for the formation of carbon dioxide (CO2) as it wasobserved in earlier organic radiolysis works as well (Góbiet al. 2016a). Besides, the other irradiation product, isocyanic acid(HNCO), can transform into the isocyanate (OCN−) anion asshown previously (Broekhuizen et al. 2004). It should be notedthat nitrile-bearing compounds (R–C≡N) were also successfullyconverted into isocyanates (Hudson & Moore 2004); however,based on the kinetic study (Section 4.3.2) this should beconsidered a minor pathway only. The last species forming uponirradiation is nitrogen monoxide (NO), which can be detected viathe FTIR and PI-ReTOF-MS methods and may have severalpossible sources. The most likely of these origins is the directoxidation of the adenine molecule (C5H5N5, see Figure 2(f) forthe lack of its signal in the mixture sample) or oxidation ofhydrogen cyanide (HCN) forming along with species I during thefirst step of the electron radiolysis scheme of neat adenine, i.e.,without oxidation (Figure 3). Alternatively, the oxidation ofcyanamide (H2N–C≡N) might also yield nitrogen monoxide(NO); this would explain the decrease in its signal intensity (andthat of its fragment; Figures 2(c) and (d)) in the PI-ReTOF-MSspectrum as well. It is highly likely that nitrogen monoxideoriginates from more than one of the above-mentioned possiblesources as it has a bimodal PI-ReTOF-MS TPD profile(Figure 2(e)) with the second peak occurring at the same timeas the adenine sublimation event in the neat sample. This impliesthat this second signal of nitrogen monoxide may be assigned tothe oxidation of adenine molecules, which remained intact afterthe electron irradiation of the mixture sample.
Nitrogen monoxide could also be formed by the oxidation ofthe imidogen (NH) radicals as the other product of the carbonmonoxide (CO) loss of species V, VII, and VIII. However, itwould result in a much higher number of nitrogen monoxidemolecules in the radiolyzed samples than the experimentallyobtained value (see mass balances in Section 4.2.2), as it shouldbe comparable to the number of carbon monoxide moleculesthat form together with the imidogen radicals. The strongestevidence for the source of nitrogen monoxide (NO) can begiven based on the findings of Evans et al. (2011). Accordingto their results, nitrogen monoxide could be observed whenmolecular oxygen (O2) was deposited on a pre-irradiatedadenine (C5H5N5) sample and was irradiated with energeticelectrons. As the thickness of the oxygen layer was higher thanthe penetration depth of the electrons (500 nm), the adeninemolecules were not exposed to the energetic electrons;however, ozone (O3) was formed in the irradiated oxygen iceas detected via the FTIR and EI-QMS methods. This reactivespecies could then diffuse down to the deeper parts of thesample and react with the products formed during the pre-irradiation of adenine, yielding nitrogen monoxide (NO) along
with other species such as epoxides (C–O–C) and organics witha carbonyl functional group (R1R2–C=O). This implies thatnitrogen monoxide emerges by the oxidation of the speciesformed during the neat adenine (C5H5N5) radiolysis, and itsformation does not require the irradiation of the adenine sampleitself at the same time, as is the case for the mixture sample.Although the second pathway (Figure 4) is more likely to
occur in the mixture sample, the original radiolysis mechanism(Figure 3) can still take place, allowing for the detection of theirproducts such as cyanamide (H2N–C≡N) as well as theoxidation product nitrogen monoxide (NO). However, as it hasbeen previously pointed out, they can also be oxidized,therefore their concentration in the sample decreases, as canbe observed in the PI-ReTOF-MS spectrum of the mixturesample (Figures 2(c) and (d)). This means that although theneat adenine (C5H5N5) sample decomposes via a purelyradiolytic mechanism that starts with bond breakages andfragmentation (Figure 3), another competing reaction mech-anism becomes dominant in the presence of perchlorates
-( )ClO4 —the one involving oxidation reactions as the first (andlater) reaction step(s) according to Figure 4.
4.2. Mass Balances
4.2.1. Neat Adenine Samples
The number and percentage of the decomposed adenine(C5H5N5) in both the neat and mixture samples can be evaluatedbased on their infrared absorption bands (Table 5) and depicts afirst-order exponential decay fitted via Equation (1):
= -( ) ( ) ( )I t I e0 , 1k ti
where I(t) is the number of the molecules’ band area (in cm−1) ata given time (t, in s), I(0) is the band area at the beginning of theradiolysis (in cm−1), and ki is the decay rate constant of the ithvibrational mode that is to be determined (in s−1). Once the kivalues are obtained by fitting, the ratio of the decomposedmolecules to the number of exposed ones (i.e., Ii(60)/Ii(0)) can becalculated and averaged over all IR vibrational modes. Since thenumber of exposed adenine molecules is also known((2.01±0.43)×1017), the absolute number of decomposedones can also be calculated ((1.80±0.39)×1017). By compar-ing these two numbers to each other, it can be concluded that89.4%±4.9% of the exposed adenine molecules decayed in theneat sample. Since the exact structure of the forming organicnitrile (R–C≡N, likely caused by species I, II, III, and IV) andtherefore the integrated absorption coefficient of its vibrationalband at 2213 cm−1 is unknown, the number of molecules in thesample cannot be determined.
4.2.2. Adenine–Magnesium Perchlorate Hexahydrate Samples
The corresponding values for the adenine (C5H5N5)–magnesiumperchlorate hexahydrate (Mg(ClO4)2·6H2O) 1:1 mixture sampleare (5.99±1.26)×1016 and (6.05±1.27)×1016 indicating thatpractically all adenine molecules (99.1%±1.3%) were destroyedwithin the penetration depth of the electrons. When comparing it tothe value obtained for the neat sample (Section 4.2.1), it can befirmly concluded that the presence of the oxidizing agent enhancesthe destruction of the organic compound, which is in completeaccordance with the findings of previous similar studies withorganics (Góbi et al. 2016a, 2017). The number of destroyed
14
The Astrophysical Journal, 838:84 (21pp), 2017 April 1 Góbi, Bergantini, & Kaiser

magnesium perchlorate hexahydrate (Mg(ClO4)2·6H2O) mole-cules can also be determined besides the exposed ones; these are(6.41±1.35)×1016 and (6.47±1.36)×1016, i.e., (99.0%±2.1%) of the exposed molecules were decayed within thepenetration depth of the electrons.
Since the integrated band areas and absorption coefficientsare known for the forming species, their number in the samplecan also be estimated (Table 5); for instance, for the carbondioxide (CO2), the signal at 2342 cm−1 is 7.6×10⁻¹⁷ cmmolecule−1 (Gerakines et al. 1995), resulting in (2.72±0.18)×1016 molecules in the sample after irradiation. Theseare 7.8×10⁻¹⁷ cm molecule−1 (Lowenthal et al. 2002) andtherefore (2.85±0.19)×1016 molecules for isocyanic acid(HNCO, 2252 cm−1), 1.3×10⁻¹⁶ cm molecule−1 for thecyanate ion (OCN−, 2168 cm−1) (Broekhuizen et al. 2004)meaning (1.27±0.38)×1015 molecules, 1.1×10⁻¹⁷ cmmolecule−1 for carbon monoxide (CO, 2139 cm−1) (Gerakineset al. 1995) accounting for (2.88±0.19)×1016 molecules,and 6.8×10⁻¹⁸ cm molecule−1 for nitrogen monoxide (NO,1870 cm−1) (Stirling et al. 1994) corresponding to(1.47±0.73)×1014 molecules in the sample. Note that thenumber of nitrogen monoxide molecules is two orders ofmagnitude lower than that of the carbon monoxide moleculesconfirming that the former could not be formed via theoxidation of imidogen (NH) radicals forming as co-product ofthe CO loss (Section 4.1.2). Although the absorption coefficientof species VIII (C4H4N4O) for its carbonyl stretching vibration(ν C=O) at around 1749 cm−1 is unknown, it should be similarto other aldehydes/ketones that have absorption coefficients inthe range of 1.4–1.8×10⁻¹⁷ cm molecule−1 (Kaiseret al. 2014). Therefore, the assumption of a value of(1.6±0.2)×10−17 cm molecule−1, which is equal to(4.06±0.26)×1016 molecules in the irradiated sample, isstraightforward; this is in agreement with the findings of thekinetic study as well (Section 4.3.2).
By adding up the number of carbon, nitrogen, and oxygenatoms in these species, one can compare them to the totalnumber of these elements originating from the decayed adenine(C5H5N5) or—in the case of oxygen atoms (O)—from themagnesium perchlorate hexahydrate (Mg(ClO4)2·6H2O) mole-cules. The formation of carbon dioxide (CO2), isocyanic acid(HNCO), cyanate ion (OCN−), carbon monoxide (CO), nitrogenmonoxide (NO), and species VIII requires (2.01±0.16)×1017
carbon and (1.92±0.13)×1017 nitrogen atoms. These twoaccount for the 67.0%±15.1% and 64.2%±14.2% of the totalnumber of carbon and nitrogen atoms originating from thedecomposed adenine (C5H5N5) molecules. Note that both thetotal resource of carbon and nitrogen atoms equal(3.00±0.63)×1017, as every adenine molecule has five ofeach. If it is assumed that every destroyed perchlorate unit
-( )ClO4 yields only one oxygen atom (O), then the number ofthe latter produced is much lower than the number required forthe formation of the above-mentioned species (cf.(6.41±1.35)×1016 and (1.54±0.10)×1017). Alternatively,one might also investigate that the radiolysis product chlorate
-( )ClO3 may be decayed further into chlorite ( -ClO2 ) meaningthat one irradiated perchlorate unit yields two oxygen atoms.However, even if it were assumed that all chlorates transform tochlorites completely, it would result in (1.28±0.27)×1017
oxygen atoms, which is still below the number required for theformation of the products discussed above and cannot explainthe huge molecular oxygen (O2) signal that can be observed inthe EI-QMS TPD at about 55K (Figure 2(a)), therefore anothersource of oxygen must be present as well. This contradiction canbe resolved if the oxygen atoms of the crystalline watermolecules are also taken into account; as every magnesiumperchlorate has six crystalline water molecules, the total oxygenresource easily offsets the required number of oxygen atoms.This seemingly contradicts the findings of Turner et al. (2016)since they found that the oxygen originates exclusively from theperchlorate unit -( )ClO4 . However, it must be pointed out that the
Table 5Mass Balance of the Neat Adenine and the Adenine–Mg(ClO4)2·6H2O 1:1 Samples as well as that of the Irradiation Products Determined from their Experimental
IR Decay/Growth Curves
Process Decay Product Number of Molecules Produced/Decomposed During Irradiation
Adenine Adenine–Mg(ClO4)2·6H2O
C H N X5 5 5 (1.80±0.39)×1017 (5.99±1.26)×1016
Fraction of adenine degraded 89.4%±4.9% 99.1%±1.3% +- -ClO ClO O4 3 O K (4.52±0.95)×1017d
+H O 2H O2 (5.16±1.09)×1017e
Number of molecules in sample after irradiation C4H4N4O (VIII)a K (4.06±0.26)×1016
CO K (2.88±0.19)×1016
HNCO K (2.85±0.19)×1016
CO2 K (2.72±0.18)×1016
OCN− K (1.27±0.38)×1015
NO K (1.47±0.73)×1014
Carbon balanceb K 67.0±15.1%Nitrogen balanceb K 64.2%±14.2%Oxygen balancec K 34.0%±7.5%d
29.8%±5.8%e
Notes.a C4H4N4O corresponds to species VIII in Figure 4.b Fraction of carbon or nitrogen atoms originating from adenine destruction that are needed for radiolysis product formation.c Fraction of oxygen atoms originating from adenine and crystalline water destruction that are needed for radiolysis product formation.d If the reaction +- -ClO ClO O4 3 is regarded exclusively besides the destruction of water.e If the reaction +- -ClO ClO O3 2 is also considered.
15
The Astrophysical Journal, 838:84 (21pp), 2017 April 1 Góbi, Bergantini, & Kaiser

dose used for this current experiment was approximately 20 timeshigher (820±180 versus 39±2 eV/(Mg(ClO4)2·6H2O) mole-cule), which may be high enough to destroy the water moleculessurrounding the perchlorate units. Moreover, the formation ofmolecular oxygen (O2) was previously observed in irradiatedwater ices (H2O; Zheng et al. 2006a and 2006b). This approachstill assumes that the perchlorate unit loses only one oxygen atomto yield chlorates -( )ClO3 .
Evidence for crystalline water destruction can be found inthe FTIR spectrum, where the gradual decrease of the waterantisymmetric (νas OH, 3617 cm−1) and symmetric (νs OH,3567 and 3546 cm−1) stretching vibrations can be observed,implying that the crystalline water was also completelydestroyed within the penetration depth of the electrons uponirradiation. This means (3.88±0.82)×1017 water moleculesdecayed, resulting in the new value of the total oxygen resource((4.52±0.95)×1017 atoms), meaning that the speciesformed account for the 34.0%±7.5% of oxygen atoms (O)originating from both the perchlorate -( )ClO4 unit as well asthe crystalline water (H2O). It should be noted that the totaloxygen resource equals (5.16±1.09)×1017 oxygen atoms ifthe complete destruction of chlorates -( )ClO3 further intochlorites ( -ClO2 ) is also investigated. In this case, the speciesdiscussed above would account for the 29.8%±5.8% of theoxygen atoms formed upon irradiation. Unfortunately, thenumber of oxygen molecules in the sample cannot bequantified by their weak IR stretching signal at 1550 cm−1
(Vandenbussche et al. 1999) as it is completely masked by thehuge absorption band of the reactant adenine, therefore itcannot be decided which of the alternatives regarding theoxygen source described above are more likely to occur.
The unreacted oxygen then sublimes during the TPD andleaves the sample at 55 K as molecular oxygen (O2); they canbe detected via EI-QMS (Figure 2(a)). It is worth noting thatthis peak has a considerably larger signal strength than theother oxygen peaks at higher temperatures as the latter might becaused by the oxygen related to the thermal degradation ofvarious metastable chlorine oxide (ClxOy) compounds formedupon the electron irradiation of the sample (see also Section 3.2and Góbi et al. (2016b)). Lastly, an estimate of the number ofchlorine dioxide molecules can also be given based on the PI-ReTOF-MS signals. The integrated ion counts of nitrogenmonoxide (NO) and chlorine dioxide (35ClO2) peaks are known(812 and 5277) as well as their photoionization cross-section atthe photoionization energy of 10.49 eV (2.74×10⁻¹⁸ cm2
(Watanabe et al. 1967) and 5×10⁻¹⁸ cm2 (Fleschet al. 1999)). If the integrated ion counts of chlorine dioxideis corrected by the ratio of the ionization cross-sectionsyielding 2892, then the number of molecules can be calculatedby knowing the number of nitrogen monoxide molecules in thesample ((1.47±0.73)×1014); the value of (5.24±0.26)×1014 can be obtained, making up 8.2%±2.1% of thenumber of perchlorate units -( )ClO4 destroyed. It is importantto note, however, that since the other chlorine-bearingmolecules cannot be quantified, in contrast to carbon, nitrogen,and oxygen, the mass balance cannot be given for chlorine.Furthermore, quantitative information cannot be extracted fromthe EI-QMS due to the peak saturation at 55 K, which hindersthe correct integration of signals.
4.3. Adenine Destruction Rates and Product Formation Rates
4.3.1. Neat Adenine Samples
The integrated IR band areas of the adenine (C5H5N5) in bothsamples gradually decrease upon irradiation, and one selectedsignal (that of the ν CN(R6) and ν CC(R6) vibrational modes ataround 1600 cm−1) is plotted in Figures 5(a) and 6(a). The changein band area versus time is also plotted for the magnesiumperchlorate hexahydrate (Mg(ClO4)2·6H2O); in this case theselected signal was the broad band between 1200 and 900 cm−1
(the n -ClOas 4 and n -ClOas 4 vibrational modes); this is displayedin Figure 6(b). All of these show a (pseudo) first-order radiolyticdecay, meaning that the data points can be fitted with Equation (1).The decay rate constant determined for the neat adenine (C5H5N5)sample with a mechanism summarized in Figure 3 in Section 4.1.1is found to be (2.20±0.53)×10−4 s−1, which is in goodagreement with the one obtained by Evans et al. (2011) at thesame temperature ((1.65±0.37)×10−4). The kinetic profile ofthe sole irradiation product, the alkyl nitrile compound (R–C≡Nat 2213 cm−1, possibly caused by species I, II, III, and IV,Figure 5(b)), can be fitted with the growth curve (2):
= -- º-- ( ) ( ) ( )I t A e1 , 2k t
R C N,2210 cm 1 i
where A is a constant and it is proportional to the number ofadenine (C5H5N5) molecules in the sample. Its formation rateconstant (ki) is equal to (7.47±3.10)×10−5 s−1, which alsocompares to the value of this irradiation product according toEvans et al. (2011) ((4.53±0.58)×10−5 s−1).
4.3.2. Adenine–Magnesium Perchlorate Hexahydrate Samples
The pseudo first-order decomposition rate constant of adenine(C5H5N5) for the mixture sample is (5.08±1.30)×10−4 s−1,i.e., a more than twofold increase in the decay rate constant whenthe oxidizing agent is present in the sample. This corresponds to ahalf-life of adenine of approximately 6.5 × 10⁷ years uponbombardment by GCR particles at 2–3 cm below the surface (or6.5 × 108 years in the depth of 5–10 cm; Pavlov et al. 2012). Itshould be noted that this is comparable to the rate of hydrolysis bythe thin water films in the shallow subsurface at the averageMartian temperatures of 250K (Levy &Miller 1998). The relativeincrease in the reaction rate constant at 10 K in the presence ofperchlorates is comparable to the one found for glycine–magnesium perchlorate hexahydrate (Mg(ClO4)2·6H2O) mix-tures (+99%±26%, Góbi et al. 2016a). This can be explained bythe well-investigated decomposition of perchlorates -( )ClO4 intoatomic oxygen (O, Turner et al. 2016) and other oxidants such aschlorine dioxide (ClO2, Góbi et al. 2016b), which then can reactwith the surrounding organic molecules enhancing their radiolyticdecomposition. As has been mentioned already, the destructionrate constant of the perchlorate units -( )ClO4 can also beevaluated using Equation (1), and it is found to be((4.30±0.54)×10−4 s−1).In order to determine the formation rate constants of the
irradiation products, such as carbon dioxide (CO2), isocyanic acid(HNCO), cyanate anion (OCN−), carbon monoxide (CO), andspecies VIII (C4H4N4O), the first-order kinetic fit cannot beapplied as they take part in multiple complex, higher-orderreactions. This is also reflected in their kinetic profiles, if plotted(Figures 6(c)–(g)), which do not follow the growth curve(Equation (2)) in contrast to the only irradiation product speciesR–C≡N of the neat adenine (C5H5N5) sample. By utilizing a set
16
The Astrophysical Journal, 838:84 (21pp), 2017 April 1 Góbi, Bergantini, & Kaiser

of 11 coupled differential equations according to the proposeddecay mechanism of adenine in the presence of magnesiumperchlorate hexahydrate (Mg(ClO4)2·6H2O, Section 4.1.2), theycan be fitted numerically (Frenklach et al. 1992); all the equationsand the resulting formation rate constants are summarized inTable 6. After solving these equations, it can be seen that thedestruction of the perchlorate molecule (reaction R11) follows aunimolecular decay and its rate constant (k11) is found to be(3.83±0.01)×10−4 s−1), which is within the uncertainty limitsof the value determined with the use of Equation (1)((4.30±0.54)×10−4 s−1). In contrast to this, as the adenine(C5H5N5) molecule reacts with oxygen (reaction R1) while beingoxidized to species V, it takes part in a bimolecular reaction,which has a rate constant of (6.12±0.25)×10−15 s−1 (k1).
According to R1, it can also be concluded that the pseudo (orapparent) first-order rate constant ¢( )k1 can be obtained bymultiplying k1 with the average number of free oxygen atoms inthe sample (n[O]av=(4.54±2.90)×1011) according to thesteady-state approximation. It is also important to note that sincethe number of oxygen atoms at a given time could not bemeasured directly by the experimental methods used, andfurthermore, due to the fact that the differential equation solvercan only determine their product ¢k1 , both the values of k1 and n[O]av do not have real physical meaning. Moreover, the higher-order and pseudo first-order values have the same units (both aregiven in s−1) as the number of molecules is a dimensionlessvalue. Nevertheless, ¢k1 does have a physical meaning and itsvalue can be calculated: ¢ = ´ - -( )k 2.78 0.11 10 s1
4 1.
Figure 5. (a) Decay curve of the IR band at 1619–1600 cm−1 (ν CN(R6) and ν CC(R6) vibrations of the adenine molecule) and (b) growth curve of the IR band at2213 cm−1 (ν CN vibration of species “R–CN”) of the neat adenine sample upon energetic electron irradiation.
Table 6Decay Rate Constants (in s−1) of the Neat Adenine and the Adenine–Mg(ClO4)2·6H2O 1:1 Samples as well as the Formation Rates of the Irradiation Products Based
on their Experimental IR Decay/Growth Curves
Reaction Rate Constant Valuea (Pseudo) First-order ValueNumber Equation
R1 + C H N O V5 5 5 k1 (6.12±0.25)×10−16 (2.78±0.11)×10−4
R2 + V O VII k2 (3.79±0.93)×10−14 (1.72±0.42)×10−2
R3 +V HNCO I k3 K (1.64±1.58)×10−2
R4 + +IV CO NH k4 K (1.48±1.11)×10−2
R5 + I O VIII k5 (5.52±1.67)×10−16 (2.51±0.76)×10−4
R6 +VII HNCO VIII k6 K (2.41±0.33)×10−4
R7 + +VIIIVII CO NH k7 K (3.42±0.03)×10−4
R8 + +IXVIII CO NH k8 K (5.36±0.09)×10−5
R9 +- +HNCO OCN H k9 K (7.31±0.07)×10−6
R10 + CO O CO2 k10 (3.16±0.83)×10−16 (1.44±0.38)×10−4
R11 +( ) · ( ) ·Mg ClO 6H O Mg ClO 6H O O4 2 2 3 2 2 k11 K (3.83±0.01)×10−4
Note.a Second-order reaction rates; its corresponding pseudo first-order rate can also be obtained (see main text).
17
The Astrophysical Journal, 838:84 (21pp), 2017 April 1 Góbi, Bergantini, & Kaiser

Figure 6. Decay curves of the IR bands (a) at 1628–1578 cm−1 (ν CN(R6) and ν CC(R6) vibrations of the adenine molecule, respectively), (b) at 1119–954 cm−1
(n -ClOas 4 and n -ClOs 4 vibrations of the Mg(ClO4)2·6H2O molecule), growth curves of the IR bands (c) at 1749 cm−1 (ν C=O vibration of the C4H4N4O, moleculeVIII), (d) at 2252 cm−1 (νas N=C=O vibration of the HNCO molecule), (e) 2139 cm−1 (ν CO vibration of the CO molecule), (f) 2342 cm−1 (νas CO2 vibration of theCO2 molecule), (g) 2165 cm−1 (νas OCN
− vibration of the OCN− ion) of the adenine-Mg(ClO4)2·6H2O 1:1 mixture sample upon energetic electron irradiation.
18
The Astrophysical Journal, 838:84 (21pp), 2017 April 1 Góbi, Bergantini, & Kaiser
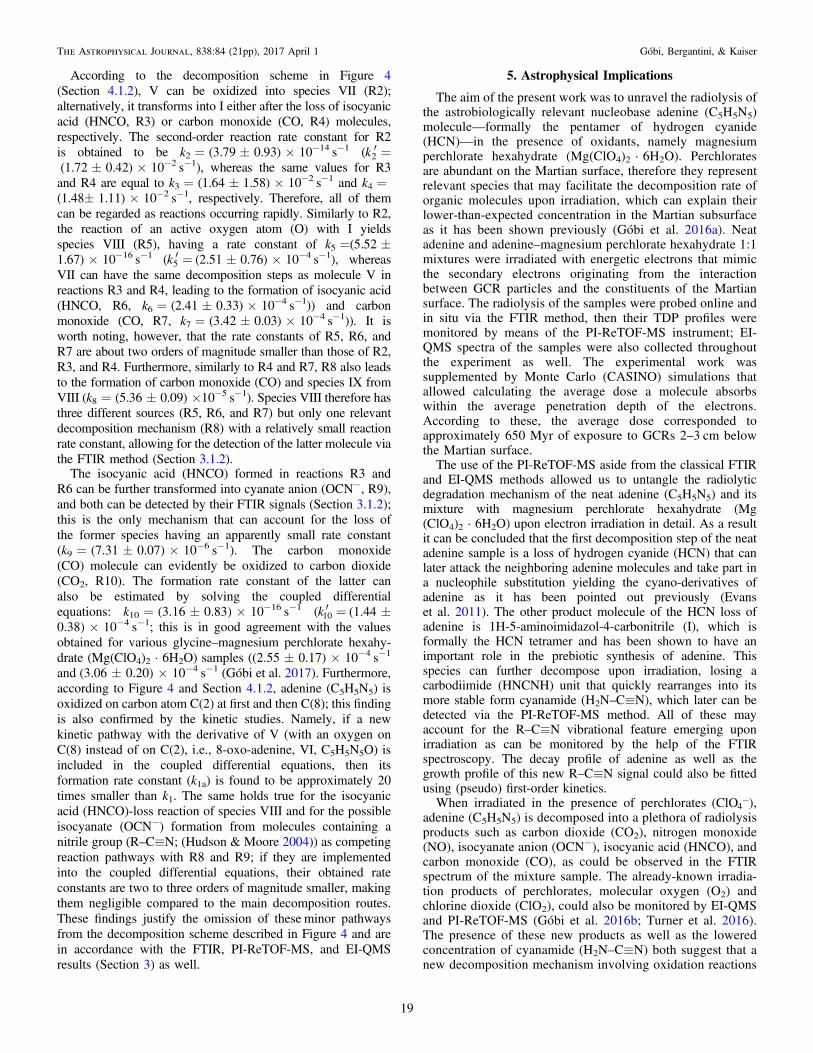
According to the decomposition scheme in Figure 4(Section 4.1.2), V can be oxidized into species VII (R2);alternatively, it transforms into I either after the loss of isocyanicacid (HNCO, R3) or carbon monoxide (CO, R4) molecules,respectively. The second-order reaction rate constant for R2is obtained to be k2=(3.79±0.93)×10−14 s−1 ( ¢ =k2(1.72±0.42)×10−2 s−1), whereas the same values for R3and R4 are equal to k3=(1.64±1.58)×10−2 s−1 and k4=(1.48±1.11)×10−2 s−1, respectively. Therefore, all of themcan be regarded as reactions occurring rapidly. Similarly to R2,the reaction of an active oxygen atom (O) with I yieldsspecies VIII (R5), having a rate constant of k5=(5.52±1.67)×10−16 s−1 ( ¢ =k5 (2.51±0.76)×10−4 s−1), whereasVII can have the same decomposition steps as molecule V inreactions R3 and R4, leading to the formation of isocyanic acid(HNCO, R6, k6=(2.41±0.33)×10−4 s−1)) and carbonmonoxide (CO, R7, k7=(3.42±0.03)×10−4 s−1)). It isworth noting, however, that the rate constants of R5, R6, andR7 are about two orders of magnitude smaller than those of R2,R3, and R4. Furthermore, similarly to R4 and R7, R8 also leadsto the formation of carbon monoxide (CO) and species IX fromVIII (k8=(5.36±0.09)×10−5 s−1). Species VIII therefore hasthree different sources (R5, R6, and R7) but only one relevantdecomposition mechanism (R8) with a relatively small reactionrate constant, allowing for the detection of the latter molecule viathe FTIR method (Section 3.1.2).
The isocyanic acid (HNCO) formed in reactions R3 andR6 can be further transformed into cyanate anion (OCN−, R9),and both can be detected by their FTIR signals (Section 3.1.2);this is the only mechanism that can account for the loss ofthe former species having an apparently small rate constant(k9=(7.31±0.07)×10−6 s−1). The carbon monoxide(CO) molecule can evidently be oxidized to carbon dioxide(CO2, R10). The formation rate constant of the latter canalso be estimated by solving the coupled differentialequations: k10=(3.16±0.83)×10−16 s−1 ( ¢ =k10 (1.44±0.38)×10−4 s−1; this is in good agreement with the valuesobtained for various glycine–magnesium perchlorate hexahy-drate (Mg(ClO4)2·6H2O) samples ((2.55±0.17)×10−4 s−1
and (3.06±0.20)×10−4 s−1 (Góbi et al. 2017). Furthermore,according to Figure 4 and Section 4.1.2, adenine (C5H5N5) isoxidized on carbon atom C(2) at first and then C(8); this findingis also confirmed by the kinetic studies. Namely, if a newkinetic pathway with the derivative of V (with an oxygen onC(8) instead of on C(2), i.e., 8-oxo-adenine, VI, C5H5N5O) isincluded in the coupled differential equations, then itsformation rate constant (k1a) is found to be approximately 20times smaller than k1. The same holds true for the isocyanicacid (HNCO)-loss reaction of species VIII and for the possibleisocyanate (OCN−) formation from molecules containing anitrile group (R–C≡N; (Hudson & Moore 2004)) as competingreaction pathways with R8 and R9; if they are implementedinto the coupled differential equations, their obtained rateconstants are two to three orders of magnitude smaller, makingthem negligible compared to the main decomposition routes.These findings justify the omission of these minor pathwaysfrom the decomposition scheme described in Figure 4 and arein accordance with the FTIR, PI-ReTOF-MS, and EI-QMSresults (Section 3) as well.
5. Astrophysical Implications
The aim of the present work was to unravel the radiolysis ofthe astrobiologically relevant nucleobase adenine (C5H5N5)molecule—formally the pentamer of hydrogen cyanide(HCN)—in the presence of oxidants, namely magnesiumperchlorate hexahydrate (Mg(ClO4)2·6H2O). Perchloratesare abundant on the Martian surface, therefore they representrelevant species that may facilitate the decomposition rate oforganic molecules upon irradiation, which can explain theirlower-than-expected concentration in the Martian subsurfaceas it has been shown previously (Góbi et al. 2016a). Neatadenine and adenine–magnesium perchlorate hexahydrate 1:1mixtures were irradiated with energetic electrons that mimicthe secondary electrons originating from the interactionbetween GCR particles and the constituents of the Martiansurface. The radiolysis of the samples were probed online andin situ via the FTIR method, then their TDP profiles weremonitored by means of the PI-ReTOF-MS instrument; EI-QMS spectra of the samples were also collected throughoutthe experiment as well. The experimental work wassupplemented by Monte Carlo (CASINO) simulations thatallowed calculating the average dose a molecule absorbswithin the average penetration depth of the electrons.According to these, the average dose corresponded toapproximately 650 Myr of exposure to GCRs 2–3 cm belowthe Martian surface.The use of the PI-ReTOF-MS aside from the classical FTIR
and EI-QMS methods allowed us to untangle the radiolyticdegradation mechanism of the neat adenine (C5H5N5) and itsmixture with magnesium perchlorate hexahydrate (Mg(ClO4)2·6H2O) upon electron irradiation in detail. As a resultit can be concluded that the first decomposition step of the neatadenine sample is a loss of hydrogen cyanide (HCN) that canlater attack the neighboring adenine molecules and take part ina nucleophile substitution yielding the cyano-derivatives ofadenine as it has been pointed out previously (Evanset al. 2011). The other product molecule of the HCN loss ofadenine is 1H-5-aminoimidazol-4-carbonitrile (I), which isformally the HCN tetramer and has been shown to have animportant role in the prebiotic synthesis of adenine. Thisspecies can further decompose upon irradiation, losing acarbodiimide (HNCNH) unit that quickly rearranges into itsmore stable form cyanamide (H2N–C≡N), which later can bedetected via the PI-ReTOF-MS method. All of these mayaccount for the R–C≡N vibrational feature emerging uponirradiation as can be monitored by the help of the FTIRspectroscopy. The decay profile of adenine as well as thegrowth profile of this new R–C≡N signal could also be fittedusing (pseudo) first-order kinetics.When irradiated in the presence of perchlorates -( )ClO4 ,
adenine (C5H5N5) is decomposed into a plethora of radiolysisproducts such as carbon dioxide (CO2), nitrogen monoxide(NO), isocyanate anion (OCN−), isocyanic acid (HNCO), andcarbon monoxide (CO), as could be observed in the FTIRspectrum of the mixture sample. The already-known irradia-tion products of perchlorates, molecular oxygen (O2) andchlorine dioxide (ClO2), could also be monitored by EI-QMSand PI-ReTOF-MS (Góbi et al. 2016b; Turner et al. 2016).The presence of these new products as well as the loweredconcentration of cyanamide (H2N–C≡N) both suggest that anew decomposition mechanism involving oxidation reactions
19
The Astrophysical Journal, 838:84 (21pp), 2017 April 1 Góbi, Bergantini, & Kaiser

becomes the predominant one. The growth profiles of theproducts listed above do not follow a simples (pseudo) first-order kinetics, therefore a set of 11 coupled differentialequations had to be solved numerically. This helpeddetermine the exact decomposition mechanism of adenine inthe presence of oxidizing agents and also allowed themolecule 1H-5-aminoimidazol-2-oxo-4-carbonitrile (VIII,C4H4N4O), which has been undetected so far and mayaccount for the new vibrational features in the R–C≡N andR1R2–C=O stretching region, to be unraveled. This mech-anism also includes molecules that are well-known oxidationproducts of adenine, for instance 2-oxo-adenine (or isogua-nine, V, C5H5N5O) and 2,8-dioxo-adenine (VII, C5H5N5O2)and a species that is important in the prebiotic synthesis ofadenine such as 2-amino-propanedinitrile (or aminomaloni-trile, IX, C3H3N3, formally trimer of the HCN molecule).When calculating the mass balance, one can find that all theseproducts account for roughly 60% of the both the carbon andnitrogen and 30% of the oxygen atoms formed upon thedestruction of adenine (C5H5N5) in the mixture sample. Therest of the oxygen leaves the sample as unreacted molecularoxygen (O2), which can be observed via the EI-QMSinstrument. The assumption that the perchlorate unit -( )ClO4loses only one oxygen, yielding chlorates -( )ClO3 , does notprovide enough oxygen atoms, therefore it has to be taken intoaccount that they must originate from the decomposition ofcrystalline water of magnesium perchlorate hexahydrate (Mg(ClO4)2·6H2O) as well. This may seem to be in contradictionwith earlier results (Turner et al. 2016) but the high dosesused by the current work may explain this apparentdiscrepancy. Alternatively, the decomposition of radiolysisproduct chlorates -( )ClO3 yielding further oxygen atoms canalso partly account for the oxygen mass balance.
In contrast to the fact that adenine (C5H5N5) has beenextensively studied by the astrobiology community in the pastfew decades, many issues have remained unanswered untilnow. The present work has successfully detected electronirradiation products of this nucleobase for the first time. Thesespecies may have a huge impact on the current knowledge onthe oxidizing agents on Mars. Furthermore, it represents thefirst systematic investigation of the decomposition mechanismwith the decomposition/formation rate constants of adenineand its radiolysis products in the absence and presence ofMartian-relevant oxidizer perchlorates, further extending ourview on the radiolytic processes on Mars.
This work was supported by the National Aeronautics andSpace Administration under Grant NNX14AG39G.
References
Abplanalp, M. J., Borsuk, A., Jones, B. M., & Kaiser, R. I. 2015, ApJ, 814, 45Acuña, M. H., Connerney, J. E. P., Ness, N. F., et al. 1999, Sci, 284, 790Armstrong, J. C., Leovy, C. B., & Quinn, T. 2004, Icar, 171, 255Barbatti, M., Borin, A. C., & Ullrich, S. 2015, Top. Curr. Chem., 355, 1Bennett, C. J., Ennis, C. P., & Kaiser, R. I. 2014, ApJ, 782, 63Bennett, C. J., Jones, B., Knox, E., et al. 2010, ApJ, 723, 641Biemann, K., & Bada, J. L. 2011, JGRE, 116, E12001Biemann, K., Oró, J., Toulmin, P., et al. 1976, Sci, 194, 72Bishop, J. L., Quinn, R., & Dyar, M. D. 2014, AmMin, 99, 1580Botta, O., & Bada, J. L. 2002, SGeo, 23, 411Broekhuizen, F. A., Keane, J. V., & Schutte, W. A. 2004, A&A, 415, 425Callahan, M. P., Burton, A. S., Elsila, J. E., et al. 2013, M&PS, 48, 786Callahan, M. P., Smith, K. E., Cleaves, H. J., II, et al. 2011, PNAS, 108, 13995Carrier, B. L., & Kounaves, S. P. 2015, GeoRL, 42, 3739
Chen, L., Brédy, R., Bernard, J., et al. 2011, JChPh, 135, 114309Chevrier, V. F., Hanley, J., & Altheide, T. S. 2009, GeoRL, 36, L10202Cleaves, H. J., II, Nelson, K. E., & Miller, S. L. 2006, NW, 93, 228Cockell, C. S., & Raven, J. A. 2004, Icar, 169, 300Dartnell, L. R., Desorgher, L., Ward, J. M., & Coates, A. J. 2007, GeoRL, 34,
L02207Davila, A. F., Willson, D., Coates, J. D., & McKay, C. P. 2013, IJAsB,
12, 321Drouin, D., Couture, A. R., Joly, D., et al. 2007, Scanning, 29, 92Ebata, T., Anezaki, Y., Fujii, M., Mikami, N., & Ito, M. 1983, JPhCh, 87, 4773Erman, P., Karawajczyk, A., Rachlew-Kallne, E., et al. 1993, CPL, 215, 173Evans, N. L., Bennett, C. J., Ullrich, S., & Kaiser, R. I. 2011, ApJ, 730, 69Fateley, W. G., Bent, H. A., & Crawford, B., Jr. 1959, JChPh, 31, 204Flesch, R., Schürmann, M. C., Plenge, J., et al. 1999, PCCP, 1, 5423Flynn, G. J. 1996, EM&P, 72, 469Fornaro, T., Brucato, J. R., Pace, E., et al. 2013, Icar, 226, 1068Freissinet, C., Glavin, D. P., Mahaffy, P. R., et al. 2015, JGRE, 120, 495Frenklach, M., Wang, H., & Rabinowitz, M. J. 1992, PrECS, 18, 47Gerakines, P. A., Schutte, W. A., Greenberg, J. M., & van Dishoeck, E. F.
1995, A&A, 296, 810Glavin, D. P., Freissinet, C., Miller, K. E., et al. 2013, JGRE, 118, 1955Góbi, S., Abplanalp, M. J., & Kaiser, R. I. 2016a, ApJ, 822, 8Góbi, S., Bergantini, A., & Kaiser, R. I. 2016b, ApJ, 832, 164Góbi, S., Förstel, M., Maksyutenko, P., & Kaiser, R. I. 2017, ApJ, 835, 241Guan, Y. Y., Fray, N., Coll, P., et al. 2010, P&SS, 58, 1327Guimon, C., Khayar, S., Gracian, F., Begtrup, M., & Pfister-Guillouzo, G.
1989, CP, 138, 157Hanley, J., Chevrier, V. F., Barrows, R. S., Swaffer, C., & Altheide, T. S. 2015,
JGRE, 120, 1415Hecht, M. H., Kounaves, S. P., Quinn, R. C., et al. 2009, Sci, 325, 64Hilbig, R., & Wallenstein, R. 1981, IJQE, 17, 1566Hudson, R. L., & Moore, M. H. 2004, Icar, 172, 466Ibañez, D., Santidrian, A., Heras, A., Kalbác, M., & Colina, A. 2015, JPCC,
119, 8191Improta, R., Santoro, F., & Blancafort, L. 2016, ChRv, 116, 3540Jones, B. M., & Kaiser, R. I. 2013, JPCL, 4, 1965Kaiser, R. I., Maity, S., & Jones, B. M. 2014, PCCP, 16, 3399Kaiser, R. I., & Maksyutenko, P. 2015, JPCC, 119, 14653Kereszturi, Á., & Góbi, S. 2014, P&SS, 103, 153Kim, Y. S., & Kaiser, R. I. 2010, ApJ, 725, 1002Kim, Y. S., Wo, K. P., Maity, S., Atreya, S. K., & Kaiser, R. I. 2013, JAChS,
135, 4910King, S. T., & Strope, J. H. 1971, JChPh, 54, 1289Lasne, J., Noblet, A., Szopa, C., et al. 2016, AsBio, 16, 977Leshin, L. A., Mahaffy, P. R., Webster, C. R., et al. 2013, Sci, 341, 1238937Levy, M., & Miller, S. L. 1998, PNAS, 95, 7933Lewis, R. J., Sr. (ed.) 2007, Hawley’s Condensed Chemical Dictionary (15th
ed.; Hoboken, NJ: Wiley), 779Lowenthal, M. S., Khanna, R. K., & Moore, M. H. 2002, AcSpA, 58, 73Maier, G., Eckwert, J., Bothur, A., Reisenaur, H. P., & Schmidt, C. 1996,
Liebigs Ann., 1996, 1041Maity, S., Kaiser, R. I., & Jones, B. M. 2014, FaDi, 168, 485Maksyutenko, P., Förstel, M., Crandall, P., et al. 2016, CPL, 658, 20Miller, F. A., & Wilkins, C. H. 1952, AnaCh, 24, 1253Miller, K. E., Eigenbrode, J. L., Freissinet, C., et al. 2016, JGRE, 121, 296Miller, S. L., & Cleaves, H. J. 2007, Systems Biology, Vol. 1 (1st ed.; New
York: Oxford Univ. Press)Minaev, B. F., Shafranyosh, M. I., Svida, Y. Y., et al. 2014, JChPh, 140,
175101Ming, D. W., Archer, P. D., Glavin, D. P., et al. 2014, Sci, 343, 1245267Mohamed, T. A., Shabaan, I. A., Zoghaib, W. M., et al. 2009, JMoSt,
938, 263Molina-Cuberos, G. J., Stumptner, W., Lammer, H., Kömle, N. I., &
O’Brien, K. 2001, Icar, 154, 216Moores, J. E., & Schuerger, A. C. 2012, JGRE, 117, E08008Muñoz-Caro, G. M., Mateo-Martí, E., & Martínez-Frías, J. 2006, Sensors,
6, 688Nowak, M. J., Lapinski, L., Kwiatkowski, J. S., & Leszczyński, J. 1996, JPCA,
100, 3527Orgel, L. E. 2004, OLEB, 34, 361Oró, J., & Holzer, G. 1979, JMolE, 14, 153Parr, G. R., & Taylor, J. W. 1974, IJMIP, 14, 467Pavlov, A. A., Vasilyev, G., Ostryakov, V. M., Pavlov, A. K., & Mahaffy, P.
2012, GeoRL, 39, L13202Pearce, B. K. D., & Pudritz, R. E. 2016, AsBio, 16, 853Perun, S., Sobolewski, A. L., & Domcke, W. 2005, CP, 313, 107
20
The Astrophysical Journal, 838:84 (21pp), 2017 April 1 Góbi, Bergantini, & Kaiser

Pilling, S., Lago, A. F., Coutinho, L. H., et al. 2007, Rapid Commun. MassSpectrom., 21, 3646
Poch, O., Jaber, M., Stalport, F., et al. 2015, AsBio, 15, 221Poch, O., Kaci, S., Stalport, F., Szopa, C., & Poll, P. 2014, Icar, 242, 50Raulin, F., Fonsalas, F., & Wolny, M. 1984, OrLi, 14, 151Rice, J. M., & Dudek, G. O. 1967, JACS, 89, 2719Roy, D., Najafian, K., & von Ragué Schleyer, P. 2007, PNAS, 104, 17272Ruscic, B., & Berkowitz, J. 1994, JChPh, 100, 4498Saïagh, K., Cloix, M., Fray, N., & Cottin, H. 2014, P&SS, 90, 90Schuerger, A. C., Clausen, C., & Britt, D. 2011, Icar, 213, 393Schwell, M., Jochims, H.-W., Baumgärtel, H., Dulieu, F., & Leach, S. 2006,
P&SS, 54, 1073Seki, T., & Ikariya, T. 2009, PCCP, 11, 10073Shivak, J. N., & Pavlov, A. 2012, American Geophysical Union, Fall Meeting
2012, Abstract #P11F-07Smith, M. L., Claire, M. W., Catling, D. C., & Zahnle, K. J. 2014, Icar, 231, 51Stirling, A., Pápai, I., Mink, J., & Salahub, D. R. 1994, JChPh, 100, 2910
Sutter, B., Ming, D. W., Boynton, W. V., et al. 2009, LPICo, 1502, 29Tarczay, G., Förstel, M., Maksyutenko, P., & Kaiser, R. I. 2016, InCh,
55, 8776ten Kate, I. L. 2010, AsBio, 10, 589Toner, J., Catling, D., & Light, B. 2014, GeCoA, 136, 142Tonkyn, R. G., Winniczek, J. W., & White, M. G. 1989, CPL, 164, 137Turner, A. M., Abplanalp, M. J., Chen, S. Y., et al. 2015, PCCP, 17,
27281Turner, A. M., Abplanalp, M. J., & Kaiser, R. I. 2016, ApJ, 820, 127Vandenbussche, B., Ehrenfreund, P., Boogert, A. C. A., et al. 1999, A&A,
346, L57Voet, A. B., & Schwartz, A. W. 1983, Bioorg. Chem., 12, 8Watanabe, K., Matsunaga, F. M., & Sakai, H. 1967, ApOpt, 6, 391Wilson, E. H., Atreya, S. K., Kaiser, R. I., & Mahaffy, P. R. 2016, JGRE,
121, 1472Zheng, W., Jewitt, D., & Kaiser, R. I. 2006a, ApJ, 639, 534Zheng, W., Jewitt, D., & Kaiser, R. I. 2006b, ApJ, 648, 753
21
The Astrophysical Journal, 838:84 (21pp), 2017 April 1 Góbi, Bergantini, & Kaiser