Embed Size (px)
Citation preview

A
iromaddcf©
K
1
ibriieflhrottct
0d
Available online at www.sciencedirect.com
Electrochimica Acta 53 (2008) 3279–3295
Degradation mechanism study of perfluorinated proton exchangemembrane under fuel cell operating conditions
Nagappan Ramaswamy, Nazih Hakim, Sanjeev Mukerjee ∗Department of Chemistry and Chemical Biology, Northeastern University, Boston, MA 02115, USA
Received 3 August 2007; received in revised form 5 November 2007; accepted 7 November 2007Available online 13 November 2007
bstract
Perfluorinated sulfonic acid proton exchange membranes are in the forefront as solid electrolytes for fuel cell applications. Although expensive,ts potential utilization in commercial fuel cells can be validated provided it can be established that it is highly durable. In this context, peroxideadical-initiated attack of the membrane electrode interface is one of the key issues requiring further systematic investigation under fuel cellperating conditions, to better determine the fundamental degradation mechanism. In this study, we attempt to analyze the durability of theembrane electrode assembly (MEA) made with different commercial electrodes from the perspective of peroxide radical-initiated chemical
ttack on the electrode/electrolyte interface and find the pathway of membrane degradation as well. A novel segmented fuel cell is employed forurability characterization, and use of this cell and pre and post analysis of the membrane are presented. Correlation of membrane degradation
ata with the peroxide yield determined by RRDE experiments is obtained. This method is able to separate the membrane evaluation process intoathode and anode aspects. Fenton type mechanism of peroxide radical generation from H2O2 formed due to two-electron pathway of ORR isound to be the dominant membrane degrading factor.2007 Elsevier Ltd. All rights reserved.
ide yi
ioeamrtppC(boa
eywords: PEMFC durability; Nafion membrane degradation; ORR and perox
. Introduction
Widespread commercialization of PEMFC’s is strongly pred-cated on component costs and striking an optimum balanceetween its performance and durability. Although extensiveesearch seeking enhancement in performance of PEMFC’ss available (decreasing noble metal catalyst loading, improv-ng reactant and catalyst utilization, developing new polymerlectrolytes, non-noble metal catalysts, improving stack andow field designs) extensive investigations of durability issuesas been relatively recent mainly because of the test durationequirements and complexity of analysis brought on by existencef parallel processes and inability to perform in-situ, nondestruc-ive analysis of the key components[1]. Since the MEA being
he heart of an operating PEMFC where electrochemical energyonversion takes place, it is more prone to chemical and elec-rochemical degradation and remains as the biggest determinant∗ Corresponding author. Tel.: +1 617 373 2382; fax: +1 617 373 8949.E-mail address: [email protected] (S. Mukerjee).
tAah
rf
013-4686/$ – see front matter © 2007 Elsevier Ltd. All rights reserved.oi:10.1016/j.electacta.2007.11.010
eld; FTIR of Nafion; Array electrode assembly fuel cell
n the extent of losses in fuel cell performance. Degradationf MEA components are broadly understood to be due to (i)lectrocatalyst sintering via (a) thermal induced coalescencend growth following surface migration over the carbon supportaterial, and (b) ‘Ostwald Ripening’ which follows a dissolution
edeposition mechanism; (ii) platinum particle agglomerationriggered by corrosion of carbon support; (iii) electrocatalystoisoning, surface segregation and morphology changes due toresence of strong surface chemisorption by species such asO, sulfur compounds, products of methanol oxidation, etc.;
iv) self segregation of elements in mixed metal oxides or alloysrought on by potential excursions, etc.; and (v) degradationf ion conducting component including membrane and smallerggregates present along side the electrocatalyst in the reac-ion layer due to free radical species generated at the interface.ll these degradation processes are a strong function of oper-
ting conditions such as temperature, partial pressures, relative
umidity, overpotentials, etc.Perfluorosulfonated Nafion membranes (Fig. 1) haveeceived priority in durability studies [2,3] although sul-onated nonfluorinated aromatic membranes [4] and composite
3280 N. Ramaswamy et al. / Electrochimi
mdahsdrimsr
m(cpetcrtfea[td
M
M
PiHsocf
bma
[flgccdo[slwatPrassuafcsolftt
botsiateaaPcssiembaissii
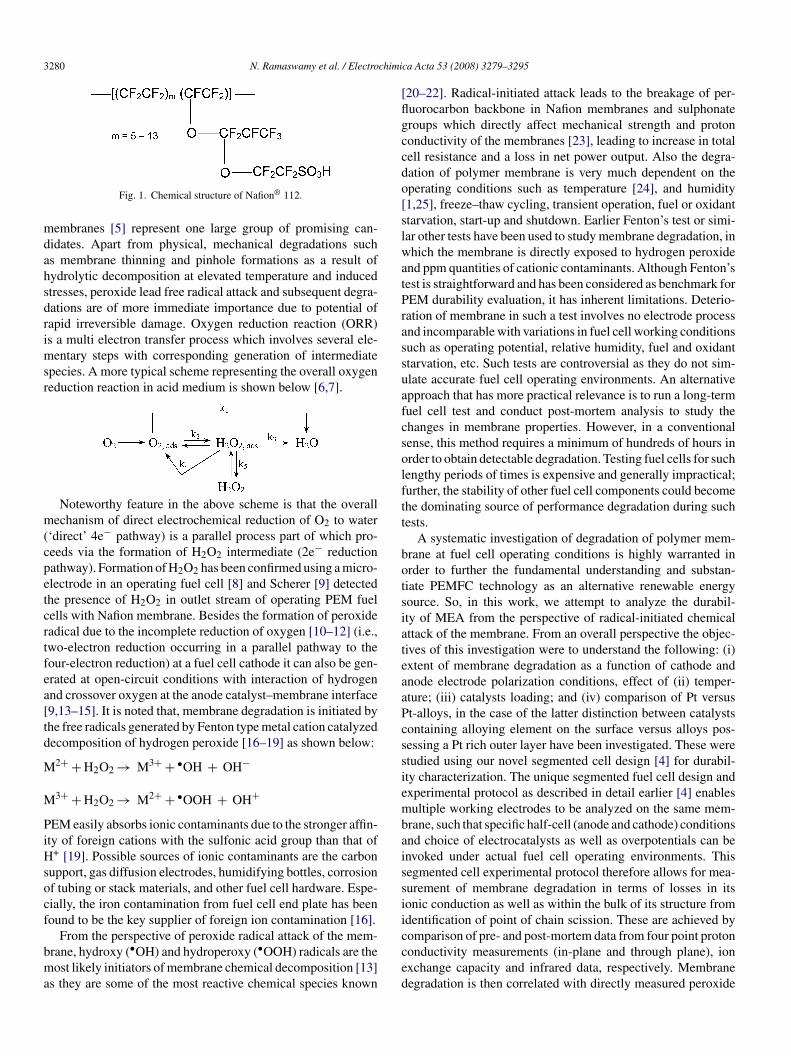
Fig. 1. Chemical structure of Nafion® 112.
embranes [5] represent one large group of promising can-idates. Apart from physical, mechanical degradations suchs membrane thinning and pinhole formations as a result ofydrolytic decomposition at elevated temperature and inducedtresses, peroxide lead free radical attack and subsequent degra-ations are of more immediate importance due to potential ofapid irreversible damage. Oxygen reduction reaction (ORR)s a multi electron transfer process which involves several ele-
entary steps with corresponding generation of intermediatepecies. A more typical scheme representing the overall oxygeneduction reaction in acid medium is shown below [6,7].
Noteworthy feature in the above scheme is that the overallechanism of direct electrochemical reduction of O2 to water
‘direct’ 4e− pathway) is a parallel process part of which pro-eeds via the formation of H2O2 intermediate (2e− reductionathway). Formation of H2O2 has been confirmed using a micro-lectrode in an operating fuel cell [8] and Scherer [9] detectedhe presence of H2O2 in outlet stream of operating PEM fuelells with Nafion membrane. Besides the formation of peroxideadical due to the incomplete reduction of oxygen [10–12] (i.e.,wo-electron reduction occurring in a parallel pathway to theour-electron reduction) at a fuel cell cathode it can also be gen-rated at open-circuit conditions with interaction of hydrogennd crossover oxygen at the anode catalyst–membrane interface9,13–15]. It is noted that, membrane degradation is initiated byhe free radicals generated by Fenton type metal cation catalyzedecomposition of hydrogen peroxide [16–19] as shown below:
2+ + H2O2 → M3+ + •OH + OH−
3+ + H2O2 → M2+ + •OOH + OH+
EM easily absorbs ionic contaminants due to the stronger affin-ty of foreign cations with the sulfonic acid group than that of
+ [19]. Possible sources of ionic contaminants are the carbonupport, gas diffusion electrodes, humidifying bottles, corrosionf tubing or stack materials, and other fuel cell hardware. Espe-ially, the iron contamination from fuel cell end plate has beenound to be the key supplier of foreign ion contamination [16].
From the perspective of peroxide radical attack of the mem-rane, hydroxy (•OH) and hydroperoxy (•OOH) radicals are theost likely initiators of membrane chemical decomposition [13]
s they are some of the most reactive chemical species known
cced
ca Acta 53 (2008) 3279–3295
20–22]. Radical-initiated attack leads to the breakage of per-uorocarbon backbone in Nafion membranes and sulphonateroups which directly affect mechanical strength and protononductivity of the membranes [23], leading to increase in totalell resistance and a loss in net power output. Also the degra-ation of polymer membrane is very much dependent on theperating conditions such as temperature [24], and humidity1,25], freeze–thaw cycling, transient operation, fuel or oxidanttarvation, start-up and shutdown. Earlier Fenton’s test or simi-ar other tests have been used to study membrane degradation, inhich the membrane is directly exposed to hydrogen peroxide
nd ppm quantities of cationic contaminants. Although Fenton’sest is straightforward and has been considered as benchmark forEM durability evaluation, it has inherent limitations. Deterio-ation of membrane in such a test involves no electrode processnd incomparable with variations in fuel cell working conditionsuch as operating potential, relative humidity, fuel and oxidanttarvation, etc. Such tests are controversial as they do not sim-late accurate fuel cell operating environments. An alternativepproach that has more practical relevance is to run a long-termuel cell test and conduct post-mortem analysis to study thehanges in membrane properties. However, in a conventionalense, this method requires a minimum of hundreds of hours inrder to obtain detectable degradation. Testing fuel cells for suchengthy periods of times is expensive and generally impractical;urther, the stability of other fuel cell components could becomehe dominating source of performance degradation during suchests.
A systematic investigation of degradation of polymer mem-rane at fuel cell operating conditions is highly warranted inrder to further the fundamental understanding and substan-iate PEMFC technology as an alternative renewable energyource. So, in this work, we attempt to analyze the durabil-ty of MEA from the perspective of radical-initiated chemicalttack of the membrane. From an overall perspective the objec-ives of this investigation were to understand the following: (i)xtent of membrane degradation as a function of cathode andnode electrode polarization conditions, effect of (ii) temper-ture; (iii) catalysts loading; and (iv) comparison of Pt versust-alloys, in the case of the latter distinction between catalystsontaining alloying element on the surface versus alloys pos-essing a Pt rich outer layer have been investigated. These weretudied using our novel segmented cell design [4] for durabil-ty characterization. The unique segmented fuel cell design andxperimental protocol as described in detail earlier [4] enablesultiple working electrodes to be analyzed on the same mem-
rane, such that specific half-cell (anode and cathode) conditionsnd choice of electrocatalysts as well as overpotentials can benvoked under actual fuel cell operating environments. Thisegmented cell experimental protocol therefore allows for mea-urement of membrane degradation in terms of losses in itsonic conduction as well as within the bulk of its structure fromdentification of point of chain scission. These are achieved by
omparison of pre- and post-mortem data from four point protononductivity measurements (in-plane and through plane), ionxchange capacity and infrared data, respectively. Membraneegradation is then correlated with directly measured peroxide
N. Ramaswamy et al. / Electrochimica Acta 53 (2008) 3279–3295 3281
Fb
yutaaPo
2
2
tcaKt1oslwntlttnaHn
Fe
co
2
tPIpstDfdsm1sIt1pv
2
Fc
ig. 2. Sensitive sites for radical attack in Nafion® 112 [Arrows indicate etherond A as the vulnerable site as labeled in Fig. 11].
ield values for various electrocatalysts during oxygen reductionsing rotating ring-disk electrode technique. The objective is toherefore correlate peroxide yields with membrane degradationnd understand membrane durability as a function of temper-ture, catalyst loading, electrode overpotentials, pure Pt versust-alloy electrocatalyst, nature of polymer chain scission (pointf radical-initiated attack) and overall polymer breakdown.
. Experimental
.1. Physicochemical characterization
X-ray diffraction (XRD, model D/MAX-2200T) was usedo characterize the crystal structure, phase purity, and parti-le size of the catalysts. The measurements were made withRigaku diffractometer, at 46 kV and 40 mA, fitted with Cu� radiation source, λCu Kα = 1.5406 A. The diffraction pat-
erns were recorded with a scan rate of 0.400◦/min between0◦ and 100◦. The analysis of the XRD data was carriedut using the “Cell Refinement” package. The average crystalize of the catalyst was determined using a Scherrer crystal-ite size broadening model. Micro-structural characterizationsere carried out with cold field emission high resolution scan-ing electron microscope (HRSEM), Hitachi (model S-4800),o take high resolution topographical micrographs of the cata-yst samples. HRSEM micrographs are very useful in analyzinghe morphology of the carbon support, the crystallite size dis-ribution of the catalysts, and the coverage of the catalyst
ano-particles over the support. Attached to the SEM unit isn energy dispersion X-ray spectrometer (EDS, EDS-GENESISITACHI S-4800), equipped with a Cu filter and a liquiditrogen-cooled Si(Li) detector, and it was used to measure thecatn
ig. 4. Design of MEA for durability test showing the five individual working electroounter electrode (CE).
ig. 3. Segmented array fuel cell assembly designed for testing multiple workinglectrodes, each with individual reference electrodes and a common counter.
omposition of the alloyed catalysts at an acceleration voltagef 25 kV.
.2. Electrochemical characterization
All electrochemical measurements were made at roomemperature using a rotating ring-disk electrode setup fromine Instruments connected to an Autolab (Ecochemienc., model—PGSTAT 30) potentiostat equipped with a bi-otentiostat interface. All potentials in acidic and alkalineolutions were measured with respect to sealed hydrogen elec-rode (RHE) and Hg/HgO reference electrode, respectively.etailed methodologies are given elsewhere [26]. Briefly, ink
ormulation consisted of sonicating the electrocatalyst pow-er with an appropriate quantity of water, isopropanol andmall quantity of 5 wt% Nafion® solution as a binder. Four-icrolitre aliquot of catalysts ink with a target Pt metal loading of
4 �g/cm2 was dropped on glassy carbon (GC) disk (0.196 cm2)ubstrate. 1M HClO4 and 1M KOH were used as the electrolytes.n a separate experiment, a study for determining optimal elec-rocatalyst loading on GC disk was performed. Ideal loading of4 �g/cm2 (Pt) was determined from the point of inflection of alot of mass transport normalized current (at 900 rpm) for ORRersus loading (Pt metal).
.3. Segmented cell design
Durability experiments were performed using a modified fuel
ell hardware based on a “high throughput screening fuel cellssembly” (NuVant System, Inc., IL, USA) [27]. Fig. 3 showshe original schematic of the fuel cell assembly. Its key compo-ents include an electronically conducting flow field block anddes (WEs) each with their reference electrode (RE) arrangement and common

3282 N. Ramaswamy et al. / Electrochimica Acta 53 (2008) 3279–3295
ode a
atoMnwat1h
tmoedtiaadIw
2
tficcatlttamid
tc
2
pomcpfmpp
H
H
H
M
M
Tt(pcrhidoiau
Fig. 5. Half-cell configuration of an
n electronically insulating array block on the opposite side ofhe MEA. The array block has 25 sensors glued into the blockn the opposite side facing one of the testing spots on the arrayEA and a pin jack on the other side used for electrical con-
ection. The heating control and gas supplies to this fuel cellere built in-house to enable the cell to run at ambient pressure
nd constant temperature up to 80 ◦C [28]. Gases were passedhrough humidification bottles, which were kept at a temperature0 ◦C higher than that of the cell in order to ensure the 100%umidification of the MEA.
The MEAs in this work were customized for the purpose ofhe durability tests. As shown in Fig. 4, the MEA consists of the
embrane of interest with a size of 11 cm × 11 cm. Attached tone side of the membrane is a titanium mesh common counterlectrode (CE). On the other side, the testing area of the MEA isivided into five testing units. Each unit has a strip of electrode ashe working electrode (WE), and two disk electrodes for build-ng the reference electrode (RE) of this unit. This design enablessimultaneous evaluation of five catalyst samples of geometricrea 5 cm2 (5 cm × 1 cm) at each run under same operating con-itions. A multi-channel Arbin (BT2000) Testing System (Arbinnstruments, TX) was used for polarization of the individualorking electrodes.
.4. Durability test design criteria
In prior publications concerning the susceptibility of PEM’so radical-initiated chemical attack, fuel cell experiments per-ormed with either single cell or multi-cell stack played anmportant role. These extended life testing reflected indeed theombined impact from various sources (fuel cell componentonfiguration, MEA fabrication, operating conditions, thermalnd load cycles, impurities, and uniformity, etc.) on the life-ime of the membrane. However, the interplay of these factorseads to inevitable difficulties in interpreting and reproducinghe data and inability to assign the observed membrane failureo one particular factor without taking other possible triggers
nd/or enhancers into account. From this point of view, a uniqueembrane durability test was designed so as to enable datanterpretation. To understand the radical-induced membraneegradation during fuel cell operation, two types of durability
hePp
nd cathode-side degradation tests.
est were tailored for examining the proposed mechanisms: (a)athode-side durability test; and (b) anode-side durability test.
.4.1. Anode-side durability testThe ‘anode (hydrogen) side degradation mechanism’ as pro-
osed earlier [13] is based on the premise that during fuel cellperation, unreacted molecular O2 from the cathode feed per-eates through the membrane and reacts with atomic hydrogen
hemisorbed on the surface of the anode platinum catalyst, thusroducing hydrogen peroxide or free radicals. Any peroxidesormed at this interface in conjunction with traces of transitionetal ions [Fe2+, Cu2+, . . .found in MEA and/or catalyst sup-
ort (carbon black)] results in formation of free radicals. Theossible reactions involved in this mechanism are [13]:
2 → 2Hads(onPtorPt/Mcatalyst)
ads + O2(diffusedfromcathodeside) → HOO•
OO• + H+ → H2O2
2+ + H2O2 → M3+ + •OH + OH−
3+ + H2O2 → M2+ + •OOH + OH−
his proposed mechanism has been suggested on the basis ofests in regular fuel cell setups under open-circuit potentialOCP) conditions in prior publications [14,25]. However, thearallel process involving interaction of adsorbed oxygen at theathode (at or near OCP conditions) and cross over hydrogenesulting in free radical formation cannot be ruled out. Thisas been pointed out in an earlier publication [25]. Therefore,t is imperative for appropriate experimental design for properata interpretation. An earlier attempt to understand the extentf this mechanism involved providing the electrolyte/catalystnterface a predominantly H2 environment consisting of a smallmount of O2. For example, to induce degradation of water sol-ble polystyrene sulfonic acid [used as a model compound for
ydrated polystyrenesulfonic acid (PSSA) membrane], Hodgent al. [29] purged hydrogen gas containing 5% oxygen through aSSA polymer solution at the rate of 1.5 cm3/s in the presence oflatinized platinum. Clearly this method deviated from fuel cell
N. Ramaswamy et al. / Electrochimica Acta 53 (2008) 3279–3295 3283
Table 1Basic membrane properties of Nafion®112 showing ion exchange capacity (η), membrane thickness, glass transition temperature (Tg), proton conductivity (σ)
Membrane Ion exchange capacity (η) (mEq/g) Proton conductivity (σ) (S/cm at 22 ◦C, 100% RH) Thickness (mm) Tg (C)
N
cbma
cwthepvwitooiottewnaslatwFca
2
v(ocoirmb
O
M
M
ItvH
cpettnpsogdbtp2boaaPwwt
2
BMTtBPf
aNi0os
afion® 112 0.91 0.097
onfiguration; also it failed to mirror the O2 crossover behavior,ecause O2 permeability through the membrane changes dra-atically with the chemistry of polymer as well as temperature
nd hydration [30].In order to investigate this mechanism under fuel cell-like
onditions in the absence of interference from reactions of O2ith crossover hydrogen, our approach involved conducting
ests in the aforementioned fuel cell device running with pureydrogen and pure oxygen (in a normal fuel cell mode) at ambi-nt pressure. As shown in Fig. 5a, humidified hydrogen wasassed through the catalyzed working electrode which also pro-ided reference electrode for the MEA, and humidified oxygenas passed through the non-catalyzed counter electrode side
n order to enable oxygen diffusion through the membrane tohe working electrode side depending on its permeability at theperating condition of the fuel cell. After full humidificationf the MEA (on reaching equilibrium conditions), the work-ng electrodes were either held at the typical anode potentialf the PEMFC [0.1–0.2 V, versus a reference hydrogen elec-rode (RHE)] or left in OCP condition for a fixed period ofime. After the test, membranes in contact with the workinglectrodes were detached for postmortem analysis. The resultsere then compared with the corresponding properties of theon-degraded membrane before the test (Table 1). Further, it islso noted that, the possibility of H2 cross over to the cathodeide to cause analogous degradation did not find favor in theiterature because of the fact that H2 utilization efficiency on thenode side is sufficiently high enough evidenced by low magni-ude of H2 crossover current density (∼1–3 mA/cm2) reportedidely in the literature [31–34] and measured in our lab as well.urthermore, the counter electrode side with O2 flow was a non-atalyzed carbon electrode and hence lacked the reaction centersfforded conventionally by Pt.
.4.2. Cathode-side durability testRecent publication [12,13,16,23,35,36] suggested that the
ulnerable location for radical attack in a MEA is at the cathodeoxygen) side. This mechanism is based on the proposition ofxygen reduction reaction (ORR) at the cathode of PEMFC pro-eeding via a parallel pathway where a two-electron reductionf oxygen occurs simultaneously with the formation of H2O2ntermediates [37] along with the predominant four-electroneduction to H2O; the peroxides then react with trace transitionetals ions (Fe2+, Cu2+. . . found in membrane and/or carbon
lack catalysts support) to form radicals:
+ −
2 + 2H + 2e → H2O2 (1)2+ + H2O2 → M3+ + •OH + OH− (2)
3+ + H2O2 → M2+ + •OOH + H+ (3)
6tei
0.0508 140
t has been pointed out that the metal ion and H2O2 concentra-ions necessary for the occurrence of hydroxyl radical can beery low (<10–25 mg/L H2O2 and 1 part Fe per 5–25 parts of2O2 (wt/wt) [38])Fig. 5b shows our cathode durability test arrangement. The
ell is operated on pure oxygen and pure nitrogen at ambientressure. Humidified oxygen is passed through the workinglectrode side of the cell; humidified nitrogen, which is inertherefore only functions to hydrate the MEA, is passed throughhe counter electrode side so that water molecules carried byitrogen undergo oxidation at the counter electrode and providerotons that pass through the membrane to the working electrodeide purged with humidified oxygen. This design emulates anperating fuel cell except for suppressing the passage of hydro-en on the anode side. The reference electrode is a solid-stateynamic hydrogen electrode (DHE) [39], which is constructedy connecting two disk electrodes (E-TEK 30% Pt/C electrode)o power supply of 1.7 V. After full hydration of the MEA, theotential of the working electrode could be set (versus DHE) for4–48 h time period at different potentials. Cathode-side mem-rane degradation was studied both at normal fuel cell cathodeperating potentials of 0.6 V and 0.7 V versus DHE and alsoccelerated conditions of membrane degradation was achievedt a cathode potential of 0.4 V versus DHE in this present study.re- and post-test analysis of the membrane in contact with theorking electrode is conducted. The results were then comparedith the corresponding properties of the membrane before the
est (Table 1).
.5. MEA fabrication
Working electrodes were selected from commercial ETEK-ASF 30% Pt/C, 60% Pt/C, 30% Pt2Co/C and 30% Pt3Co/C.aterial for the reference electrode was 30% Pt/C electrode (E-
EK-BASF). The counter electrode for the anode-side durabilityest was non-catalyzed carbon gas diffusion electrode (E-TEK-ASF). For the cathode degradation test 0.6 mgPt/cm2 of 80%t/C (ETEK-BASF) was used as the catalyst and titanium meshor current collection.
Working electrodes were prepared by sonicating for 20 minn appropriate amount of water-wetted catalyst with 5 wt%afion® 1100EW (Ion-Power, Inc. – New Castle, DE) and
sopropanol. All working electrode catalyst loading was.4 mgPt/cm2. The resulting catalyst ink was then sprayedn the commercial carbon gas diffusion electrode (singleided ELAT, E-TEK) and then dried in oven at 60 ◦C for
0 min. For electrodes obtained from commercial vendors, ahin layer of Nafion® ionomer solution was brushed on thelectrode surface and then dried in oven. Typical loading ofonomer layer was in the range of 0.8–1.0 mg/cm2. MEAs
3284 N. Ramaswamy et al. / Electrochimica Acta 53 (2008) 3279–3295
F y: (a)
wm[
2
fcsdoows
2
nit
bidtmRuitti10bdta
TP
C
3633
ig. 6. SEM images of PEMEAS Pt and Pt-alloy catalysts employed in this stud
ere prepared by hot-pressing the electrodes to the polymerembrane according to procedures described in detail earlier
28].
.6. Characterization techniques
After the durability experiment, the MEA was uninstalledrom the cell, and the working electrode portions were carefullyut off from the MEA with the appropriate working electrodeide carefully labeled. The samples were then dipped in anhy-rous methanol for a short fraction of a second to enable peelingf the electrodes from the membrane. The membrane samples sobtained, typically 1 cm × 5 cm, were then washed thoroughlyith deionized water before performing the following analy-
is.
.6.1. Fourier-transform infrared spectroscopy
Fourier transform infrared spectroscopy (FTIR) is a handy,ondestructive technique to probe changes in membrane chem-stry due to degradation, used in numerous studies [40,41] ando determine the microstructure of Nafion® in prior PEM sta-
csam
able 2hysicochemical characterization of Pt and Pt-alloy catalysts using SEM/EDS
atalysta EDS elemental composition
0 wt% Pt/C –0 wt% Pt/C –0 wt% Pt3Co/C Co = %24 ± 1, Pt = %76 ± 10 wt% Pt2Co/C Co = %32 ± 1, Pt = %68 ± 1
a All are commercial PEMEAS catalysts supported on Vulcan XC-72 Carbon.
30 wt% Pt/C; (b) 60 wt% Pt/C; (c) 30 wt% Pt2Co/C; and (d) 30 wt% Pt3Co/C.
ility studies [14,15]. In this work, infrared spectra, plays anmportant role in revealing the chemical processes underlyingegradation. Due to the thickness of the sample, attenuatedotal reflection (ATR) mode was employed instead of trans-
ission mode. IR spectra were recorded with either MattsonS-2 FTIR instrument equipped with a pike MIRacle ATRnit with 45◦ ZnSe ATR Crystal or Bio-Rad FTS6000 FTIRnstrument with 45◦ Ge ATR crystal. The reason for usingwo different crystals is to exploit the difference in IR pene-ration depth that they provide due to difference in refractivendex of ZnSe and Ge. ZnSe provides a penetration depth of.7–2 �m from the membrane surface whereas Ge has only.65–0.7 �m from the membrane surface in the IR wavenum-er region of ∼400–4000 cm−1 [42]. For measurement, theried sample (24 h in vacuum at 60 ◦C) was pressed againsthe ATR crystal with the help of a force-sensing pressurepplicator. All spectra were collected from 400 scans at 4-
m−1 resolution. Dry nitrogen gas was purged around theample during the measurement to eliminate moisture in their. Linear background correction in the spectra was attainedanually.Average size (A) (XRD) Lattice parameter (A)
27 3.934 (Fm3m)36 3.934 (Fm3m)55 3.855 (Fm3m)70 3.81 (Fm3m)

chimica Acta 53 (2008) 3279–3295 3285
2
mcwLB
2
siibass
3
3
Pot6wo6capasPc
F
tccopot〈sisTcwA(
F2
N. Ramaswamy et al. / Electro
.6.2. Conductivity measurementProton conductivity was determined from a fully humidified
embrane at room temperature using four-probe conductivityell setup described in our prior publication [43]. Measurementsere carried out with a digital potentiostat/galvanostat (AUTO-AB model PGSTAT30 equipped with FRA model, Ecochemie.V.).
.6.3. Ion exchange capacity (IEC)Ion exchange capacity (IEC) defined as the ratio of moles of
ulfonate ion exchange sites to the dry of Nafion® is expressedn mEq/g and were measured using standard methods, whichnvolved equilibrating known amount of H+ form of the mem-rane in measured volume of a standard solution of 3 M NaClt 100 ◦C for 10 h to allow for the exchange with H+ ions. Thisolution was then titrated to a phenolphthalein end-point with atandard NaOH solution.
. Results and discussion
.1. Physicochemical characterization (SEM and XRD)
HRSEM micrographs for the electrocatalysts of Pt, andt–Co are shown in Fig. 6. These images show that statisticallyverwhelming number of observable particles have sizes inhe range <3 nm for 30%Pt/C and in the range of 2–5 nm for0%Pt/C. Particle size distribution for Pt–Co alloys exhibited aider range, and particle size variation from 2 nm to 10 nm wasbserved as compared with the pure Pt catalyst. Except for the0%Pt/C, where the nano-particles of this catalyst aggregate, theatalyst particles for the rest of the samples are well dispersednd distributed on the carbon support. Along with the SEMatterns the fluorescence signal was analyzed using EDAX
nalyzer and software (EDS-GENESIS, HITACHI S-4800). Ashown in Table 2, the atomic composition of the two supportedt–Co alloys show that in comparison to Pt3Co whose elementalomposition is 75:25, the Pt2Co sample exhibits ∼70:30 ratio,ctap
ig. 8. Cyclic voltammograms in oxygen-free 1 M HClO4 at room temperature for0 mV/s. Current densities based on geometric electrode area.
ig. 7. X-ray diffractograms of the Pt and Pt-alloy catalysts used in this study.
hereby showing very good correspondence with the nominalomposition. X-ray diffraction patterns of the supported electro-atalysts, Pt, Pt–Co mixtures scanned at 2θ angles over a rangef 10–100◦ are shown in Fig. 7. The broad-based diffractioneak at ∼2θ = 24.6◦ for all types of catalysts arises from thatf the carbon support. In Fig. 7, the two Pt catalysts show theypical platinum peaks at 2θ position of 〈1 1 1〉, 〈2 0 0〉, 〈2 2 0〉,3 1 1〉, and 〈2 2 2〉; whereas the Pt–Co peaks position are shiftedlightly higher in 2θ values showing an appropriate reductionn lattice parameters as a result of addition of Co in the unit celltructure showing a clear indication of Pt–Co alloy formation.he approximate average particle sizes of the carbon-supportedatalysts were determined by using the Scherrer equation [44],hich relates crystallite size to the line broadening of the peaks.lthough not accurate for particles either (<5 nm) or above
>50 nm), XRD still constitutes one effective tool for estimating
atalyst particle sizes usually in the range of 5–50 nm. However,hese particle sizes reflect exclusively the diffracting domainsnd so all amorphous components are excluded. The averagearticle sizes, based on the peak width of the 〈1 1 1〉, 〈2 0 0〉,(a) Pt and (b) Pt-alloy catalysts used in this study on a glassy carbon disk at

3286 N. Ramaswamy et al. / Electrochimi
Ffb
aisaPtwvladopt
3
acriwcTla
fcsscftgdtrttttlstwr
iotlbgdePfOtcmoP
3p
TE
C
3633
ig. 9. Cyclic voltammograms in oxygen-free 1 M KOH at room temperatureor 30% Pt2Co/C and 30% Pt3Co/C catalysts at 20 mV/s; current densities areased on geometric electrode surface area of the glassy carbon disk.
nd 〈2 2 0〉 diffraction lines and lattice parameters are presentedn Table 2. There is a broad agreement between the particleizes obtained from SEM and XRD analysis, thereby indicatinghigh degree of crystalline character to the supported Pt andt-alloy naonoparticles. The lattice parameter obtained from
he XRD patterns indexed to a face-center cubic (fcc) structureas 3.9238 A which is in good agreement with the literaturealue of 3.9239 A. The Pt–Co binary mixtures have lowerattice parameter values than the corresponding pure platinum,nd increasing the atomic content of cobalt in the mixtureecreases the lattice parameter values, since the atomic radiusf cobalt is smaller than platinum and the decrease in latticearameter indicates alloying of the metals where cobalt entershe platinum lattice by substitution in to octahedral sites [45].
.2. Electrochemical measurements—cyclic voltammetry
Cyclic voltammetry (CV) was used to characterize the cat-lysts in argon purged 1M HClO4 at room temperature byycling between 0.05 V and 1.2 V versus RHE. Also CVs wereecorded in 1 M KOH electrolyte to investigate the electrochem-cal behavior of cobalt in Pt–Co alloys used in this study. Thisas especially useful in determining presence of surface Co as
haracterized by typical redox peaks in alkaline electrolytes.he resulting voltammograms in oxygen-free acidic and alka-
ine electrolytes taken at 20 mV/s with a loading of 14 �gPt/cm2
re shown in Figs. 8 and 9. The electrochemically active sur-mH
able 3lectrokinetic parameters for the different electrocatalysts used in this study in 1 M H
atalyst ik @ 0.9 V(mA/cm2
Pt)a
ik @ 0.8 V(mA/cm2
Pt)
0% Pt/C 0.078 0.9180% Pt/C 0.141 0.9600% Pt2Co/C 0.408 2.3250% Pt3Co/C 0.314 3.065
a ik – kinetic current density.b io – equilibrium exchange current density.c Extracted from the anodic sweep of ORR from 0.35 V to 1.2 V vs. RHE.d Based on 210 �C/cm2 for atomic hydrogen oxidation on a smooth Pt surface.
ca Acta 53 (2008) 3279–3295
ace area of the catalysts was also estimated from the integratedharge in the H adsorption/desorption region of the CVs and arehown in Table 3. Cyclic voltammograms show that the carbon-upported Pt particles possess some degree of low coordinatedrystal planes, and hence the hydrogen adsorption/desorptioneatures between 0.4 V and 0.0 V versus RHE are different fromhe CV expected of a bulk pc-Pt electrode. The area in the hydro-en underpotential deposition (HUPD) region decreases withecreasing Pt surface sites available. Also an anodic shift inhe reduction peak is observed for the two 30% Pt–Co/C alloyselative 30% Pt/C which can be attributed to a decrease in desorp-ion free energy of Pt–OH, Pt–O or Pt–O2 due to the presence ofhe alloying element implying that the reduction of oxygen con-aining intermediate species is more facile. It is also interestingo compare the HUPD region for the two-supported Pt–Co cata-ysts. The shape of the HUPD region for Pt3Co (76% Pt) is veryimilar to that of Pt catalyst and shows typical hydrogen adsorp-ion/desorption features in the potential range of 50–400 mV,hereas Pt2Co (68% Pt) exists more in alloy form with poorly
esolved H adsorption/desorption features.Fig. 9 shows typical cyclic voltammograms of Pt–Co alloys
n alkaline media using 1M KOH at 10 mV/s. The redox couplebserved between 0 V and −0.2 V (versus Hg/HgO) is due tohe redox processes involving metallic Co in alkaline mediumeading to the formation of Co3O4 and/or CoOOH as indicatedy Pourbaix diagram of Co and detailed electrochemical investi-ations [46]. Co oxidation peaks are not discernable due to largeouble layer current but the corresponding reduction peaks arevident. It is observed from these cyclic voltammograms thatt3Co shows higher Co redox peaks compared to that of Pt2Coor the same loading of 14 �gPt/cm2 on the glassy carbon disk.n the contrary, EDS measurement which is a bulk averaged
echnique, shows a cobalt composition of only 25% for Pt3Coompared to that of 30% for Pt2Co. This implies that in Pt3Coore Co is present on the surface compared to Pt2Co, in turn
bserved as higher metallic Co redox currents in Pt3Co thant2Co.
.3. Oxygen reduction reaction (ORR) kinetics anderoxide yield measurement
Fig. 10 shows a representative set of rotating ring-disk experi-ents performed on Pt and Pt-alloy catalysts in O2 saturated 1 MClO4 at room temperature using a constant Pt metal loading
ClO4 at room temperature from RDE measurements at 900 rpm
io × 109
(A/cm2Pt)
bTafel Slope(mV/dec)c
ECA (m2/gPt)d
[HUPD region]
0.230 60/122 440.852 63/125.5 231.400 60/139 160.853 59.5/129 19

N. Ramaswamy et al. / Electrochimica Acta 53 (2008) 3279–3295 3287
F Pt2Cw 0 mV/3 eep aa area
omrtTisomet0rctOfftfblbct3aapT
ddtocfictp
i
wrtrteadlaiosf
ig. 10. Disk (A) and ring (B) currents obtained on 30% Pt/C, 60% Pt/C, 30%ith 1 M HClO4 electrolyte at a disk rotation rate of 900 rpm and scan rate of 29%. (C) Tafel plots for the ORR at room temperature extracted from anodic swt various potentials; current densities normalized to the electrochemical surface
f 14 �gPt/cm2 on the glassy carbon (GC) disk. The voltam-ograms measured at a scan rate of 20 mV/s, are shown for a
otation rate of 900 rpm. Representative scans shown in the bot-om left-hand side of Fig. 10(A), represents the anodic sweep.he anodic sweep represents a true comparison of ORR activ-
ty as it is taken immediately after the corresponding cathodicweep and hence represents ORR activity after removal of thexide layer formed at or near open-circuit conditions. While itay be argued that this may not represent true fuel cell operating
nvironment it does represent a more accurate picture of the reac-ion center (Pt site) activity for ORR. In the potential region of.9–0.7 V versus RHE, mixed kinetic-diffusion controlled cur-ents are observed ensued by a well-defined diffusion limitingurrent beyond 0.6 V. For the same Pt loading of 14 �g/cm2 onhe GC disk, 30% Pt/C and 60% Pt/C exhibit essentially similarRR activity in the mixed kinetic-diffusion controlled region
ollowed by a significantly lower diffusion controlled currentor 30% Pt/C as compared to 60% Pt/C which can be attributedo the increased thickness of the catalyst layer on the GC diskor 30% Pt/C relative to 60% Pt/C, since the supporting car-on determines oxygen diffusion through the porous catalystoaded on the GC disk. An exactly similar argument can alsoe extended to the two supported Pt–Co alloys with different Ptompositions, such that 30% Pt3Co/C has a smaller catalyst layerhickness and hence higher diffusion limited current relative to0% Pt2Co/C. On comparing the Pt/C catalysts with Pt–Co/C
lloy catalysts, it is seen that the two Pt–Co/C catalysts exhibitn anodic shift of about 30 mV in the mixed kinetic-diffusionotential region and hence 30 mV lower over potential for ORR.his lower overpotential of the alloy catalysts towards ORR isitsP
o/C, and 30% Pt3Co/C during ORR in the anodic sweep at room temperatures using a glassy carbon disk of 5 mm diameter and ring collection efficiency oft 20 mV/s, 900 rpm. (D) Representative Levich Plot for the ORR on 30% Pt/Cof platinum on 5 mm glassy carbon disk unless otherwise indicated in the plot.
ue to the fact that the presence of alloying element decreases theesorption free energy (�Gdes) of Pt–OH, Pt–O or Pt–O2 suchhat the adsorption of oxygen containing intermediate speciesn Pt surface sites is inhibited in the supported alloy catalystsompared to Pt/C [47]. This discussion based on the ORR pro-le for each catalyst involves interference from diffusion limitedurrent densities ilim, and hence Tafel plots are extracted usinghe following Eq. (1) by eliminating ilim and obtaining a clearericture based on kinetic currents.
k = (ilim•i)(ilim − i)
(1)
here ik is the kinetic current density, i is the measured cur-ent density during oxygen reduction polarization, and ilim ishe diffusion limited current density. Fig. 10(C) shows the cor-esponding Tafel plots of the Pt and Pt-alloy catalysts wherehe kinetic current densities are normalized on the basis of thelectrochemical surface area of Pt. Firstly, it is noted that thectivity of Pt-alloy catalysts are better than the Pt/C catalystsue to the unique effect of the surface Co species enablingower oxide formation on Pt [48,49]. Taking into consider-tion that the initial adsorption of molecular oxygen on Pts part of the rate-determining step (rds) [26], the coveragef oxides at or near the open-circuit potentials represents aurface poison. Hence, preferential oxide formation on sur-ace Co as shown earlier is attributed to freeing Pt sites for
nitiating ORR [50]. However, the comparison of the rela-ively oxide free anodic scans exhibiting enhanced ORR isignificant. This shows the concomitant oxide formation ont sites in the supported Pt–Co electrocatalysts is significantly
3 chimica Acta 53 (2008) 3279–3295
lovccesicprvTtorPttRhsssCiriHfuoo
PtaLfta
i
wtctr
OtHeRrs
Table 4Peroxide yields (mole fraction) measured using a RRDE technique with a rota-tion rate of 900 rpm and various disk potentials of 0.7 V, 0.6 V, 0.4 V vs. RHE inconjunction with a gold ring electrode polarized at 1.3 V in 1M HClO4 at roomtemperature
Catalyst %H2O2 @0.7 V %H2O2 @0.6 V %H2O2 @0.4 V
30% Pt/C 0.111 0.257 2.3306PP
sTtwt
χ
wfrrH
dudpootawisnpmtctipdoOitim
3
288 N. Ramaswamy et al. / Electro
ower than the corresponding Pt/C catalysts (both 30% and 60%n carbon loading). This in the background of previous obser-ations of experimentally derived activation energies on theselass of supported catalysts and agreement with theoretical cal-ulations on transition states [51] indicates that the observednhancement is direct effect of surface oxide coverage. Also, it iseen from the Tafel plot that the Tafel slope is constantly chang-ng, which is due to the continuously varying charge transferoefficient (α) value from 0 to 1 with overpotential; however, it isossible as a gross approximation to obtain Tafel slope (Table 3)epresenting two distinct regions, in good comparison with pre-iously reported literature values [52], yielding two differentafel slopes of −2.3RT/F, i.e., 60 mV/decade at low overpoten-
ials (E > 0.85 V) and −2(2.3RT/F), i.e., 120 mV/decade at highverpotentials (E < 0.85 V) which agree very well with prioreports on single-crystal Pt electrodes [53], carbon-supportedt [54] and pc-Pt plug [26]. This change from 60 mV/decade
o 120 mV/decade is closely related to earlier contention ofhe adsorbed OH species at potentials beyond 0.85 V versusHE corresponding to 60 mV/decade of Tafel slope, where as atigher overpotentials, 120 mV/decade indicates a clean catalyticurface devoid of any oxygen containing adsorbed intermediatepecies that can affect the adsorption of molecular O2 from theolution to the active surface site for subsequent reduction [26].yclic voltammogram measured in alkaline electrolyte shown
n Fig. 9 as explained earlier indicate that the Pt3Co/C surface isich with cobalt which can inhibit the adsorption of oxygenatedntermediate species on the Pt surface sites thereby avoiding
2O2 generation pathways and providing a direct route for H2Oormation. Subsequently, ring current (also peroxide yield val-es shown in Table 3) of Pt3Co catalyst imply a very low amountf peroxide generation presumably attributed to the rich cobaltn the surface.
Fig. 10(D) shows the representative Levich plot for 30%t3Co/C used in this study at various rotation rates from 100 rpm
o 2500 rpm. Similar plots were obtained with the other three cat-lysts and hence not shown here. Levich plot yields the so calledevich constant B, according to relation (2) [55] given below
or ORR limiting current ilim, from which the number of elec-rons transferred was calculated to be 3.72 for Pt3Co indicatingpredominant four-electron transfer.
lim = Bω1/2 (2)
here B = 0.62nFD2/3ν−1/6C, where n is the number of electronsransferred, F is the Faradays Constant, D is the diffusion coeffi-ient of O2 in the electrolyte, Co is the oxygen concentration inhe electrolyte, ν is the kinematic viscosity and ω is the rotationate in rpm.
Hydrogen peroxide yield due to the parallel pathway forRR was also analyzed by classical rotating ring-disk elec-
rode (RRDE) technique. The formation of relative amount of2O2 and H2O can be determined quantitatively with the RRDE
xperiment by holding the potential of the ring at 1.3 V versusHE, where H2O2 formed at the disk during oxygen reduction is
eadily oxidized at the ring. Fig. 10(B) shows the currents mea-ured at the ring during the anodic sweep of the disk potential
o
n
0% Pt/C 0.394 0.753 2.408t2Co/C 0.342 0.652 3.523t3Co/C 0.160 0.260 0.510
hown in figure at room temperature in 1M HClO4 at 900 rpm.able 4 shows the comparison of peroxide yields measured at
he gold ring when the corresponding disk electrode potentialsere 0.4 V, 0.6 V and 0.7 V versus RHE and calculated using
he following relation,
H2O2 = 2(IR/N)
(ID + (IR/N)(3)
here N is the collection efficiency of the ring, χ is the moleraction of peroxide formed, ID and IR are the disk and ring cur-ents, taking into account the total disk currents for the oxygeneduction as the sum of reduction currents of O2 to H2O and
2O2 and the collection efficiency N for the ring electrode [26].These data in Table 4 are an indication of potential depen-
ence of peroxide yield at disk electrode for the various catalystssed in these experiments. Peroxide currents are negligible forisk potentials above 0.65 V indicating that oxygen reductionredominantly proceeds via four-electron transfer process with-ut significant peroxide generation, which is relevant for theperating potential of fuel cell cathodes. This is the region wherehe cathode potential of a normal operating fuel cell lies, andlludes to the importance of maintaining a stable cell potentialith regard to the interfacial stability of the MEA, especially
n the case of discontinuous fuel cell operation in which con-iderable voltage fluctuations take place frequently. Below theormal fuel cell operating potential of 0.6–0.7 V versus RHE,eroxide generation begins to increase significantly followed byuch higher ring currents at a diffusion controlled disk poten-
ial of 0.4 V. This potential dependence of peroxide yield isorrelated to fuel cell membrane degradation in the next sec-ion. It is also observed that as the disk potential further extendsnto the HUPD region, the ring currents of the two Pt/C sam-les keeps increasing. In the case of the Pt/C catalysts, as theisk potential enters HUPD region enhanced peroxide generationccurs as HUPD blocks the Pt surface sites necessary to split the2 molecule leading to increased peroxide generation. This is
mportant in cases where H2 permeation from the anode feed tohe cathode catalyst through the membrane is significant as thiss also a possible pathway of peroxide generation and subsequent
embrane degradation.
.4. Assignment of the absorption bands of ATR-IR Spectra
f Nafion®112 (H-form)Infrared absorption studies, along with small angle X-ray,eutron scattering investigation and scanning probe microscopy

N. Ramaswamy et al. / Electrochimica Acta 53 (2008) 3279–3295 3289
Fb
iomtroiaaflga(abdeppcecsic∼
t
Table 5Selective list of IR absorption peak assignments of H-Nafion® 112 as pertinentto this study in correspondence with Fig. 2
Index Wavenumbera (cm−1) Peak assignments
(A) 969 m υs(C–O–C), ether band ‘A’, symmetric(B) 982 m υs(C–O–C), ether band ‘B’, symmetric(C) 1059 m υs (SO3
−), sulfonate group, symmetric(D) 1142 vs υs (CF2), CF2 group, symmetric(D) 1208 vs vb υas (CF2), CF2 group, asymmetric(
s
fiafbonlciislrtsf
3p
gtdvysaand 80 ◦C to study the influence of temperature for various time
TEe
C
L
ig. 11. ATR-FTIR spectrum of Nafion®112 (H-form) indicating absorptionands obtained using ZnSe ATR crystal. [See text for references].
maging, have been used widely to elucidate the nanostructuref Nafion® membrane. Fig. 11 and Table 5 indicates the assign-ent of various vibrational absorption bands [40,41,56–59], in
he region between 900 cm−1 and 1350 cm−1 wavenumbers aselevant to this study, associated with the chemical structuref Nafion®112 membranes (DuPont Corp.) in H-form shownn Fig. 1. The very strong absorption bands at 1142 cm−1
nd 1208 cm−1 wavenumbers correspond to the symmetricnd asymmetric vibrations of –CF2 groups in the hydrophobicuorocarbon backbone, symmetric stretching of the sulfonateroup is observed at 1059 cm−1. The twin peak at 969 cm−1
nd 982 cm−1 is due to the presence of two ether linkages–C–O–C–) in Nafion® side chain. Of the two ether vibrationalbsorption bands in Nafion® membrane, the higher frequencyand (i.e., the one at 982 cm−1) is attributed to the ether linkageirectly attached to the fluorocarbon backbone and is labeled asther band ‘B’. Further the corresponding lower frequency com-onent at 969 cm−1 is labeled as ether band ‘A’, caused due to itsroximity to the sulfonate group and its electron withdrawingharacter. This assignment of vibrational absorption bands ofther linkages is due to the work done by Cable et al. [56], whoontrasted the two ether absorption peaks in Nafion® against aingle ether absorption band present in Dow perflourosulfonateonomers (PFSI). Dow PFSI has only one ether linkage in its sidehain and exhibits a single absorption peak centered at around
969 cm−1.Hsu et al. [60], proposed the ion-cluster network theory forhe morphology of Nafion® membranes according to which sul-
sbi
able 6ffect of cathode-side durability tests with O2/N2, 40 ◦C, 1 atm, for a duration of 24 hlectrode (WE) polarization potentials of 0.4 V and 0.6 V vs. DHE
atalysts WE @ 0.4 V
σafter−σbeforeσbefore
(%) ηafter−ηbeforeηbefore
(%
30% Pt/C 34 2660% Pt/C 57 4830% Pt2Co/C 50 4030% Pt3Co/C 27 22
isted are the decreases in proton conductivity σ (S/cm) and ion exchange capacity η
E) 1303 sh υs (C–C), symmetric
a Relative intensity: m – medium; vs – very strong; vb – very broad; sh –houlder.
onate groups with terminating pendant side chains stretch outnto approximately spherical clusters also consisting of waternd hydrated cations, interconnected to each other by channelsor ionic transport, and supported by hydrophobic fluorocarbonackbone material. Meanwhile, Yeager and Steck [61] corrob-rated the conclusions of Falk [62] (that the ionic clusters areon-spherical in shape and have intrusions of side chain etherinkages), by proposing three-phase morphology for Nafion®
onsisting of the hydrophobic fluorocarbon phase, hydrophiliconic clusters and an interfacial region between these two. Thisnterfacial region is largely a void volume containing pendantide chain materials, a small amount of sorbed water and traceevel of sulfonate exchange sites and counter-ions. From theesults of this present study, this interfacial region is of impor-ance since they turn out to be the vulnerable site for radicalpecies attack during fuel cell operation as discussed in theollowing sections.
.5. Effect of radical-initiated degradation on membraneroperties
Segmented cell durability tests were conducted to investi-ate the mechanism of degradation as a function of potential,emperature, choice of electrocatalyst, catalyst loading, and testuration. Cathode operating potentials of 0.4 V, 0.6 V and 0.7 Versus RHE were employed to study the influence of peroxideield, subsequent membrane deterioration and also to correlateegmented cell durability test results to RRDE data discussedbove. Tests were conducted at room temperature, 40 ◦C, 60 ◦C,
cales of 24 or 48 h. At the end of each durability test, the mem-rane was carefully separated from the electrode; the changesn its proton conductivity (σ), ion exchange capacity (η) were
using 30% Pt/C, 60% Pt/C, 30% Pt2Co, 30% Pt3Co at two different working
WE @ 0.6 V
) σafter−σbeforeσbefore
(%) ηafter−ηbeforeηbefore
(%)
27 1949 4344 3416 9
(mEq/g).

3290 N. Ramaswamy et al. / Electrochimi
Fig. 12. ATR-FTIR Spectrums of Nafion® obtained using Ge ATR crystal beforeand after cathode-side degradation tests with four parallel samples as indicateditd
dNeomd
cpeFbpIfaa
tataebtteQcitdpactd(iiiu0tdcbtotc(Sasecsts
TPt
C
A
n the plot, operated for 24 h at 0.4 V (WE vs. DHE), 40 ◦C cell tempera-ure and 1 atm pressure conditions. (a) IR Spectrum (900–1400 cm−1) beforeegradation. (b) IR Spectrum after degradation.
etermined and compared with that of the non-degraded pureafion® membrane properties shown in Table 1, to estimate the
xtent of degradation quantitatively; ATR-IR absorption spectraf degraded membranes were compared to spectra of pristineembrane (Fig. 11) to determine the site of membrane degra-
ation.Table 6 shows the results of cathode-side degradation tests
onducted at 0.4 V and 0.6 V (WE versus DHE), 40 ◦C, 1 atmressure conditions for duration of 24 h with four parallellectrocatalysts 30%Pt/C, 60%Pt/C, 30%Pt2Co and 30%Pt3Co.ig. 12 compares the FTIR spectrums of the Nafion® mem-ranes before and after degradation test at 0.4 V, 40 ◦C, 1 atmressure conditions for duration of 24 h using Ge crystal with
R penetration depth of 0.65–0.7 �m. The most significant dif-erence after this 24 h test is observed at the ether band ‘A’ peakt 969 cm−1 as a decrease in its intensity of absorption. There isconcomitant effect of cleavage of ether band ‘A’ and the rela-tmta
able 7ercentage decrease in intensity of IR absorption of ether band 1 at 969 cm−1 and sul
est performed at 40 ◦C, ambient pressure, for a duration of 24 h at a WE potential of
atalyst % Aratio ν(C–O–C) I
30% Pt/C 18 %60% Pt/C 39%30%Pt2Co/C 21%30%Pt3Co/C 12%
ratio[ν(C − O − C)I] = (Hυ(−C−O−C−)I/Hυ(−CF2)) and Aratio[ν(SO3)] = (Hυ(SO3a H2O2 obtained from ring current using Eq. (3).
ca Acta 53 (2008) 3279–3295
ively small decrease in intensity of sulfonate vibrational bandt 1059 cm−1, and the reason for this is discussed below. Vibra-ional absorption peak at 969 cm−1, as discussed earlier in thisrticle, is due to the ether bond present closer to the sulfonate ionxchange site in the pendant side chain. The vibrational etherand ‘B’ at 982 cm−1, due to the ether linkage directly attachedo the fluorocarbon backbone is relatively unaffected comparedo the band at 969 cm−1, indicating a preferential cleavage of thether linkage directly attached to the sulfonate exchange groups.uantitative results from IR absorbance plot of the membrane
an be obtained only if an internal reference is incorporatedn the membrane that does not degrade during the durabilityest [63]. Since such an internal reference might interfere withurability testing, it was not preferred in this study. For the pur-ose of semi-quantitative comparison the concept of relativebsorbance has been used here. For example, with the 30% Pt/Catalyst sample, ratio of absorbance intensity of ether band ‘A’ tohe symmetric –CF2 stretching peak (Hυ(−C−O−C−)I/Hυ(−CF2))ecreased to 0.256 (after test) as compared to the initial ratio ofHυ(−C−O−C−)I/Hυ(−CF2) = 0.312. –CF2 symmetric stretch-ng peak is used as the reference peak for normalization sincet did not decrease in intensity during the course of the exper-ment. It is noted here that the spectra in Fig. 12 is obtainedsing Ge ATR crystal that provides a penetration depth of only.65–0.7 �m and same test performed with ZnSe ATR crys-al (penetration depth 1.7–2 �m) did not exhibit any significantecrease in any of the IR absorption bands indicating that thisleavage is highly localized on the surface and has not proba-ly affected the membrane beyond a distance of ∼1 �m fromhe surface. Table 7 shows the decrease in relative intensityf ether band A in Nafion®112 after cathode-side durabilityest at the indicated conditions with the four Pt and Pt-alloyatalysts. Further, the decrease in intensity of ether band ‘B’Hυ(−C−O−C−)II/Hυ(−CF2)) was negligible and not shown here.ubsequently, loss in conductivity and IEC shown in Table 6 islso due to the preferential cleavage of ether band ‘A’ in theide chain, because this cleavage scissions off the sulfonate ionxchange sites present at the terminal end of the pendant sidehain and directly attached to ether band ‘A’. Also a very minorhift in the vibrational frequency of the sulfonate exchange siteso higher values is observed. Vibrational stretching frequency ofulfonate group υs(SO3) in pure Nafion®-H form is localized in
he spectral region around 1059 cm−1. υs(SO3) of the degradedembranes is observed around 1062–1064 cm−1 and this is dueo the modest contamination of membrane by counter ions (suchs Na+, Rb+, Li+, Cs+, Ca+), because minor cationic impurities
fonate symmetric stretching bang at 1059 cm−1 after cathode-side degradation0.4 V vs. DHE
% Aratio ν(SO3) H2O2 yield @ 0.4 V (%)a
22% 2.33037% 2.40823% 3.52313% 0.510
)/Hυ(−CF2)). % Aratio = (Aratio(before) − Aratio(after))/Aratio(before).

chimica Acta 53 (2008) 3279–3295 3291
ftowtrtflefaot3yibPpttpcO
sddc0oloPpt
Fof
Table 8Loss in conductivity and peroxide yield from 30% Pt/C after cathode-side degra-dation test at 40 ◦C, ambient pressure, for 24 h at various WE potentials of 0.4 V,0.6 V, 0.7 V vs. RHE
WE@ 0.7 V WE @ 0.6 V WE @ 0.4 V
PL
Iu
sier6syht
Nambo1bp1(b
N. Ramaswamy et al. / Electro
rom the carbon support, gas diffusion electrodes, humidifica-ion bottles, other fuel cell hardware are inevitable in the fuel cellperation. These foreign cations, usually have stronger affinityith the sulfonic acid group compared to H+, and thereby replace
he protons (H+) attached to the sulfonate ion exchange sites; thiseplacement of protons by metal impurities causes a polariza-ion of S–O dipoles and subsequently shifts υs(SO3) to higherrequencies [40,56,64]. Also IEC indicated in Table 6 suffers aoss similar to the decrease in conductivity due to the loss of ionxchange sites. A comparison between peroxide yield in Table 4or the various catalysts, loss in conductivity and IEC in Table 6nd decrease in ratio of absorbance in Table 7 indicates a directne-on-one relationship between peroxide yields obtained onhe ring electrode and membrane degradation. 60% Pt/C and0% Pt2Co/C catalysts exhibited significantly higher peroxideield on the ring at all potentials below 0.7 V versus RHE ands reflected in the high levels of degradation observed in mem-rane characteristics in the durability experiment. Further, 30%t3Co/C that consistently yielded low peroxide on the ring at allotentials gives rise to a low level of loss in membrane proper-ies after cathode-side durability testing. This clearly indicateshat the degradation on the cathode side is most likely due toeroxide radicals generated from local interfacial Fenton typeatalysis of H2O2 in turn generated from the 2e− pathway ofRR.Fig. 13 shows the IR plot of degraded membranes in the
pectral region 1100 cm−1 to 940 cm−1 after cathode-side degra-ation test performed at 40 ◦C, 1 atm pressure conditions foruration of 24 h using three parallel samples of 30% Pt/C as theathode catalyst at various cathode operating potentials of 0.4 V,.6 V, 0.7 V versus DHE. At normal cathode operating potentialsf 0.6 V and 0.7 V the cleavage of ether band ‘A’ is relativelyess intense than at an accelerated cathode operating potential
f 0.4 V, due to significantly higher peroxide formation at 0.4 V.otential dependent cleavage of ether band ‘A’ shows that theeroxide radical generation at various operating fuel cell poten-ial is directly correlated to the subsequent polymer membrane.ig. 13. Potential dependent cleavage of ether band ‘A’. Shown are the IR Spectraf Nafion® after cathode-side degradation test at 40 ◦C, 1 atm pressure conditionsor a duration of 24 h using 30% Pt/C catalyst.
scIsbatg
rbeqtcbeam
tata
eroxide yield (%) 0.111 0.257 2.330oss in conductivity (%) 16% 27% 34%
t is also seen that the intensity of ether band ‘B’ is relativelynaffected during the durability test.
As discussed above, the small decrease in intensity of υ(SO3),hown in Table 8, attributed to cleavage of ether band ‘A’ resultsn the scission of the sulfonate group present at the terminalnd of the pendant chain. Fig. 2 shows the vulnerable region foradical attack based on the result of this study. It is also seen that0% Pt/C which has higher catalyst loading and higher particleize (Table 2) as compared to 30% Pt/C gives higher peroxideield observed from RRDE results (Fig. 10) and correspondinglyigher loss in membrane conductivity (Table 6) from durabilityesting.
As shown in Fig. 1, based on the chemical structure ofafion®, the repeating unit of the fluorocarbon backbone, char-
cterized by the value ‘m’, determines the dry weight of theembrane and also its ion exchange capacity [41,59] (num-
er of moles of sulfonic acid ion exchange sites per gramf dry polymer membrane) which varies from 0.55 mEq/g to.05 mEq/g. Ion exchange capacity (IEC) of the degraded mem-ranes, as shown in Table 6, shows a loss similar to that of theroton conductivity. Since the vibrational absorption bands at142 cm−1 and 1208 cm−1 represent the fluorocarbon backbone–CF2 groups), the relative intensity of absorption is determinedy the factor ‘m’. This remains unaffected after 24 h of cathode-ide degradation test performed at 0.4 V versus DHE for the fourathode catalysts used in these experiments, thus the decrease inEC can be attributed directly to the loss of sulfonate exchangeites. Decrease in proton conductivity and IEC values followedy relative decrease in IR intensity of one of the ether bandsnd no decrease in fluorocarbon backbone IR absorption signa-ure implies that the radical species do not attacked the fluorineroups of the hydrophobic backbone.
Following the discussions of Falk [62] and Cable et al. [56]egarding the chemical nanostructure of Nafion® membraneriefly summarized above, it is likely that part of the side chainther linkage intrudes into the hydrophilic ionic clusters. Conse-uently, during this period of 24 h of cathode-side degradationests, it is observed that the radical species generated during theourse of fuel cell operation initiates the polymer chain breakagey attacking the hydrophilic ionic cluster region (specifically thether linkage intruding into the hydrophilic ionic cluster region)nd virtually does not degrade the hydrophobic backbone of theembrane.In order to understand the prolonged effect of fuel cell opera-
ion on membrane durability, cathode-side degradation test waslso performed for a period of 48 h at various operating poten-ials, and temperature conditions. Table 9 shows the results of48 h cathode-side degradation test performed at 40 ◦C, 1 atm

3292 N. Ramaswamy et al. / Electrochimica Acta 53 (2008) 3279–3295
Table 9Effect of cathode-side durability tests with O2/N2, at 40 ◦C, 1 atm, for a durationof 48 h using 30% Pt/C, 60% Pt/C, 30% Pt2Co, 30% Pt3Co at a polarizationpotential of 0.4 V vs. DHE
Catalysts σafter−σbeforeσbefore
(%) ηafter−ηbeforeηbefore
(%)
30% Pt/C 44 2760% Pt/C 73 4430% Pt2Co/C 74 3830% Pt Co/C 51 24
Le
ppiTrtsndmdaiTpsgimmsfs
FfvAa
FtP
itigchbt
cap8
3
isted are the percentage decrease in proton conductivity σ (S/cm) and ionxchange capacity η (mEq/g).
ressure conditions, and 0.4 V versus DHE cathode operatingotential simultaneously using four parallel electrodes contain-ng catalysts, 30% Pt/C, 60% Pt/C, 30% Pt2Co, 30% Pt3Co.able 9 indicates the decrease in proton conductivity valuesemain linear with time. Further the relative changes in conduc-ivity reflect previous correlation with peroxide yields. Howeverurprisingly, the corresponding linear decrease in IEC values isot observed. An apparent stabilization occurs after the initialecrease in the first 24 h. Corresponding IR plots of degradedembranes after 48 h shown in Fig. 12 exhibit a significant
ecrease in absorption bands at 1142 cm−1 and 1208 cm−1
ttributed to the hydrophobic fluorocarbon backbone reflect-ng that the membrane backbone has undergone degradation.he fact that IEC capacity does not decrease linearly after thisrolonged test appears to be due to the simultaneous loss ofulfonate exchange sites concurrent with loss of fluorocarbonroups from the membrane backbone. This leads to a decreasen the dry membrane weight in such a way that IEC (number of
oles of sulfonic acid ion exchange sites per gram of dry poly-
er membrane) does not change. Insets (a) and (b) in Fig. 14hows the decrease in intensity of the ether linkages and sul-onate symmetric bands. Also the sulfonate stretching bands arehifted to higher wavenumbers due to modest contamination
ig. 14. ATR-FTIR Spectra of Nafion® after cathode-side degradation tests withour parallel samples as indicated in the figure, operated for 48 h at 0.4 V (WEs. DHE), 1 atm pressure and 40 ◦C temperature conditions obtained from ZnSeTR crystal. Also shown are magnified views of the ether linkages [Inset (a)]nd sulfonate symmetric stretching peaks [Inset (b)].
hiitrf
e[derccbitasooceNha
ig. 15. Temperature dependence of conductivity after cathode-side degradationest with four parallel catalysts 30% Pt/C, 60% Pt/C, 30% Pt2Co/C and 30%t3Co/C at 0.4 V at ambient pressure and various temperatures.
n the form of cationic impurities that replace the protons inhe membrane as already discussed earlier in this article. Thisndicates that the membrane degradation due to radical speciesenerated during the course of fuel cell operation is initiated byleavage of certain sections of ether band ‘A’ intruding into theydrophilic ionic clusters and then later spreads to the hydropho-ic fluorocarbon backbone thereby slowly degrading the bulk ofhe membrane.
Fig. 15 shows the loss in proton conductivity for the fouratalysts after cathode-side degradation performed for 24 h atmbient pressure and 0.4 V versus DHE as a function of tem-erature in the range starting from room temperature (RT) to0 ◦C.
Similar behavior was observed with IEC data and not shownere. It is seen that as the temperature increases there is anncrease in loss of conductivity, however the differential changen conductivity loss with temperature is not very high, it implieshat at higher temperatures, despite higher overall ORR cur-ent densities obtained, the current due to H2O2 formation as araction of H2O formed remains approximately the same.
Previous results using data of membrane degradation afterxposure to Fenton’s solutions such as those reported by Inaba65] concluded that both main chain and side chains areecomposed at similar rates by radical attack. However, theirxperimental results bear no relation to electrochemical envi-onment of an operating fuel cell. In addition, there is no directorrelation with cathode or anode interface. By contrast our fuelell setup shows that the hydrophilic regions within the mem-rane structure are more prone to radical species attack in thenitial stage of fuel cell operation followed by decomposition ofhe hydrophobic main chains during prolonged exposure to theseccelerated degradation conditions. Previous study [13,18] havehown that SO2 and CO2 were observed in the outlet streamf an operating fuel cell which is presumably due to the lossf ether linkage and sulfonate groups from the membrane sidehain and terminal groups, respectively. In the literature, fluoride
mission rate (FER) has been frequently used as a measure ofafion® membrane degradation, but such studies were not doneere because in our segmented cell experimental setup four par-llel samples run simultaneously with a common outlet for the
N. Ramaswamy et al. / Electrochimi
Table 10Effect of anode-side durability with O2/H2 for 48 h at 1 atm pressure as a func-tion of temperature (60 ◦C and 80 ◦C), polarization potential (OCV, 0.1 V), andchoice of anode electrocatalysts (30% Pt/C, 60% Pt/C)
Catalyst T (◦C) WE potential σafter−σbeforeσbefore
(%) ηafter−ηbeforeηbefore
(%)
30% Pt/C60
OCV – –0.1 V 2 4
80OCV 2 30.1 V 3 3
60%Pt/C
60OCV 4 40.1 V 5 6
80OCV 3 70.1 V 4 10
Lc
gsoemu
3
bOipatTtetcdtRsatcsib1snaaotOlg
tgnctrrePttcltstpapcscros
4
cimltaateoaltiwtialaaclo
isted are the decreases in proton conductivity σ (S/cm) and ion exchangeapacity η (mEq/g) of Nafion® 112 membrane.
as stream and fluoride ions detected at the outlet stream repre-ents a total loss from the membrane due the combined effectf the four samples. Further, the fluoride release represents thextent of the polymer degradation without any detailed infor-ation on the nature of attack and the regions of the membrane
ndergoing degradation at any given operating condition.
.6. Anode-side durability tests
As explained in the experimental section, anode-side dura-ility test involved the passage of H2 over catalyzed anode and2 over non-catalyzed gas diffusion layer (GDL) in order to
nvestigate membrane degradation on the anode side due to O2ermeation through the membrane. In this test only 30% Pt/Cnd 60% Pt/C catalysts were chosen for anode-side durabilityests since the Pt–Co/C alloys are cathode relevant catalysts.he membrane samples were obtained after subjecting them to
wo types of conditions: (i) holding the potential of the workinglectrode in the MEA at possible anode electrode overpoten-ial of 0.1 V for 48 h and (ii) in open-circuit voltage (OCV)ondition for 48 h. Table 10 shows the decrease in proton con-uctivity and ion exchange capacity after anode-side durabilityests performed at 60 ◦C and 80 ◦C at OCV and 0.1 V versusHE. Decreases in conductivity and ion exchange capacity are
ignificantly lower than those observed in the cathode-side testss shown in Table 10 after this 48 h test indicating that forhe duration of the experiment performed there is no signifi-ant degradation on the anode side. This result is not surprisingince the O2 permeation rate through Nafion® 112 membranes relatively low and our previous study on hydrocarbon mem-ranes such as sulfonated poly ether sulfone (SPES) and Nafion135 indicate similar low level of degradation on the anodeide [4]. Also considering the fact that in this experiment theon-catalyzed GDL on the cathode side does not consume O2,s a result the test is specific to probing the interaction ofdsorbed hydrogen on a working catalyzed GDL and the effectf crossover oxygen. A separate test wherein hydrogen oxida-
ion occurs in significant rate (higher current density) in the same2 crossover environment is a case for future work. In a priorong-term fuel cell performance study on radiation-grafted-FEP--polystyrene-type membranes, Buchi et al. [15] reported that
iotm
ca Acta 53 (2008) 3279–3295 3293
he rate of radical-initiated degradation increases with increasingas crossover. They also claimed that gas crossover is a promi-ent factor for the degradation process, especially under OCVonditions; however, whether oxygen or hydrogen crossover ishe predominant contributor could not be ascertained in theiregular fuel cell setup. In our case, the suspected formation ofadicals due to hydrogen crossover to the cathode side may beliminated as a source of peroxides at the cathode, because not reaction sites were present in the O2 side of our experimen-
al setup (non-catalyzed GDL). It has also been shown earlierhat degradation of membrane due to either H2 crossover to theathode and/or O2 crossover to the anode side result in onlyess than 3% loss in efficiency due to slower diffusion rates ofhese gases through the membrane [13]. Also Liu et al. [31]howed that for short periods of durability tests, H2 crossovero the cathode side is very minimal and thereby ruling out theossibility of significant degradation of the membrane at thenode side. Finally, regarding the anode-side durability tests theresent results cannot rule out the possible occurrence of radicalatalyzed membrane degradation at the anode side when anodeide is subject to higher current density (hydrogen oxidationonditions) in longer testing periods and it is here found that theate of degradation on the cathode side is much higher than thatn the anode side under the accelerated conditions used in thistudy.
. Conclusions
Novel accelerated technique was used to investigate andorrelate the peroxide generation at an electrode/electrolytenterface from the perspective of radical-initiated perfluorinated
embrane degradation as a function of choice of electrocata-yst, catalyst loading on carbon support, operating overpotential,emperature, and presence of alloying element on the surfacegainst Pt rich outer layer. Membrane degradation process waslso separately studied in half-cell configurations so that thewo formerly proposed PEM degradation mechanisms could bevaluated individually without interference. Peroxide generationbserved on the ring electrode of a RRDE for various electrocat-lysts used in this study showed a one-on-one relation with theevel of degradation of perfluorinated membrane via local Fentonype reactions at the cathode-membrane interface of an operat-ng fuel cell due to the simultaneous 2e− pathway of ORR alongith the more predominant 4e− reduction to water. Cleavage of
he side chain ether linkage, which intrudes into the hydrophiliconic cluster, is found to be the key initiator of conductivitynd ion exchange capacity loss. Prolonged durability testingeads to breakage of certain sections of fluorocarbon backbones observed in the stabilization of ion exchange capacity versusmore linear decline in proton conductivity. Normal operating
athode overpotentials of 0.6 V and 0.7 V versus DHE leads toower membrane degradation relative to higher overpotentialsf 0.4 V, this is directly correlated to peroxide yields observed
ndependently during RRDE measurements. Higher the loadingf catalyst on carbon support and corresponding larger the par-icle size results in higher peroxide yield and consequent higherembrane degradation as shown by the comparison between

3 chimi
6labehacreni
A
Aalfa
R
[[
[
[
[[
[
[
[
[
[
[
[
[
[
[
[
[[
[
[
[
[
[
[
[
[
[[
[
[[[
[
[
[
[
[
[[
[
[
[
[
[
294 N. Ramaswamy et al. / Electro
0% Pt/C and 30% Pt/C used in this study. Pt–Co/C alloy cata-yst with enrichment of surface Co gives lower peroxide currentnd maintains lower level of membrane degradation as showny the comparison between Pt2Co/C and Pt3Co/C. Temperatureffects on membrane degradation was found to be linear withigher ORR activity and consequent higher peroxide generationt the interface. Degradation at the anode side due to oxygenrossover through the membrane was found to be insignificantelative to cathode-side degradation within the duration of thexperiments performed here. However, these tests represent thearrow confines of interaction of absorbed hydrogen on Pt andts interaction with crossover oxygen.
cknowledgments
The authors deeply appreciate the financial assistance of thermy Research Office under a single investigator grant. The
uthors also gratefully acknowledge the supply of electrocata-ysts from BASF-fuel cells (Somerset, NJ, USA). Assistancerom Dr. Freemen Chen (NU) during IR measurements andnalysis for membrane samples is acknowledged.
eferences
[1] J. Xie, D.L. Wood III, D.M. Wayne, T.A. Zawodzinski, P. Atanassov, R.L.Borup, J. Electrochem. Soc. 152 (2005) A104.
[2] A.E. Steck, New materials for fuel cell systems I, Proceedings of the1st International Symposium on New Materials for Fuel Cell Systems,Montreal, 1995, pp. 74–94.
[3] R. Baldwin, M. Pham, A. Leonida, J. McElroy, T. Nalette, J. Power Sources29 (1990) 399.
[4] L. Zhang, S. Mukerjee, J. Electrochem. Soc. 153 (2006) A1062.[5] V. Ramani, R. Kunz, H.J.M. Fenton, J. Power Sources 152 (2005) 182.[6] E. Yeager, J. Mol. Catal. 38 (1986) 5.[7] R. Adzic, in: J. Lipkowski, P.N. Ross (Eds.), Electrocatalysis, Wiley-VCH,
1998, p. 197.[8] W. Liu, D. Zuckerboard, J. Electrochem. Soc. 152 (2005) A1165.[9] G.G. Scherer, Berichte der Bunsen-Gesellschaft 94 (1990) 1008.10] M. Watanabe, H. Uchida, M. Emori, J. Electrochem. Soc. 145 (1998) 1137.11] M.R. Tarasevich, A. Sadkowski, E. Yeager, Oxygen Electrochemistry,
Plenum Press, New York, 1983.12] M. Inaba, H. Yamada, J. Tokunaga, A. Tasaka, Electrochem. Solid-State
Lett. 7 (2004) A474.13] A.B. Laconti, M. Hamdan, R.C. McDonald, in: W. Vielstich, H.A.
Gasteiger, A. Lamn (Eds.), Handbook of Fuel Cells-Fundamentals, Tech-nology and Applications, vol. 3, John Wiley & Sons Ltd., New York, 2003,p. 647.
14] H. Wang, G.A. Capuano, J. Electrochem. Soc. 145 (1998) 780.15] F.N. Buchi, B. Gupta, O. Haas, G.G. Scherer, Electrochim. Acta 40 (1995)
345.16] A. Pozio, R.F. Silva, M. De Francesso, L. Giorgi, Electrochim. Acta 48
(2003) 1543.17] J. Qiao, M. Saito, K. Hayamizu, T. Okada, J. Electrochem. Soc. 153 (2006)
A967.18] T. Kinumoto, M. Inaba, Y. Nakayama, K. Ogata, R. Umebayashi, A. Tasaka,
Y. Iriyama, T. Abe, Z. Ogumi, J. Power Sources 158 (2006) 1222.19] T. Okada, in: W. Vielstich, H.A. Gasteiger, A. Lamn (Eds.), Handbook of
Fuel Cells—Fundamentals, Technology and Applications, 3, John Wiley
& Sons, New York, 2003, p. 627.20] P. Maletzky, R. Bauer, J. Lahnsteiner, B. Pouresmael, Chemosphere 38(1999) 2315.
21] E. Niki, Chemistry of Active Oxygen Species, Center of Academic Publi-cations of Japan, Tokyo, 1990.
[
[
ca Acta 53 (2008) 3279–3295
22] W.C. Schumb, C.N. Satterfield, R.L. Wentworth, Hydrogen Peroxide, Rein-hold Pub. Co., New York, 1955.
23] D.P. Wilkinson, J. St-Pierre, in: W. Vielstich, H.A. Gasteiger, A.Lamn (Eds.), Handbook of Fuel Cells—Fundamentals, Technology andApplications, vol. 3, John Wiley & Sons, Ltd., New York, 2003, p.611.
24] S.D. Knights, K.M. Colbow, J. St-Pierre, D.P. Wilkinson, J. Power Sources127 (2004) 127.
25] E. Endoh, S. Terazono, H. Widjaja, Y. Takimoto, Electrochem. Solid-StateLett. 7 (2004) A209.
26] V.S. Murthi, C.R. Urian, S. Mukerjee, J. Phys. Chem. B 108 (2004)11011.
27] R. Liu, E.S. Smotkin, J. Electroanal. Chem. 535 (2002) 49.28] R.C. Urian, A.F. Gulla, S. Mukerjee, J. Electroanal. Chem. 554/555 (2003)
307.29] R.B. Hodgdon, J.R. Boyack, A.B. LaConti Report TIS 65DE 5, General
Electric Company, 1966.30] L. Zhang, C. Ma, S. Mukerjee, J. Electroanal. Chem. 568 (2004)
273.31] W. Liu, K. Ruth, G. Rusch, J. New. Mater. Electrochem. Syst. 4 (2001)
227.32] H.A. Gasteiger, S.S. Kocha, B. Sompalli, F.T. Wagner, Appl. Catal. A 56
(2005) 9.33] H.A. Gasteiger, J.E. Panels, S.G. Yan, J. Power Sources 127 (2004)
162.34] M.V. Williams, H.R. Kunz, J.M. Fenton, J. Electrochem. Soc. 152 (2005)
A635.35] Q. Guo, P.N. Pintauro, H. Tang, A. O’Connor, J. Membr. Sci. 154 (1999)
175.36] J. Yu, B. Yi, D. Xing, F. Liu, Z. Shao, Y. Fu, H. Zhang, Phys. Chem. Chem.
Phys. 3 (2003) 611.37] E. Yeager, Electrochim. Acta 29 (1984) 1527.38] P. Maletzky, R. Bauer, J. Lahnsteiner, B. Pouresmael, Chemosphere 10
(1999) 2315.39] A. Parthasarathy, C.R. Martin, S. Srinivasan, J. Electrochem. Soc. 138
(1991) 916.40] K.A. Mauritz, R.B. Moore, Chem. Rev. 104 (2004) 4535.41] C. Heitner-Wirguin, J. Membr. Sci. 120 (1996) 1.42] H. Gunzler, H.-U. Gremlich, IR Spectroscopy An Introduction, Wiley-
VCH, Cambridge, 2002.43] C. Ma, L. Zhang, S. Mukerjee, D. Ofer, B. Nair, J. Membr. Sci. 219 (2003)
123.44] C. Suryanarayana, M.G. Norton, X-Ray Diffraction A Practical Approach,
Plenum Press, New York, 1998.45] T.F. Fuller, F.J. Luczak, D.J. Wheeler, J. Electrochem. Soc. 142 (1995)
1752.46] S.S. Abd El Rehim, A.A. El Basosi, S.M. El Zein, M.M. Osman, Collect.
Czech. Chem. Commun. 59 (1994) 2383.47] F.H.B. Lima, M. Janete Giz, E.A. Ticianelli, J. Braz. Chem. Soc. 16 (2005)
328.48] S. Mukerjee, S. Srinivasan, J. Electroanal. Chem. 357 (1993) 201.49] S. Mukerjee, J. McBreen, S. Srinivasan, Proc-Electrochem. Soc. 95-26
(1996) 38.50] J. Roques, A.B. Anderson, V.S. Murthi, S. Mukerjee, J. Electrochem. Soc.
152 (2005) E193.51] A.B. Anderson, J. Roques, S. Mukerjee, V.S. Murthi, N.M. Markovic, V.
Stamenkovic, J. Phys. Chem. B 109 (2005) 1198.52] U.A. Paulus, A. Wokaun, G.G. Scherer, T.J. Schmidt, V. Stamenkovic,
V. Radmilovic, N.M. Markovic, P.N. Ross, J. Phys. Chem. B 106 (2002)4181.
53] B.N. Grgur, N.M. Markovic, P.N. Ross, Can. J. Chem. 75 (1997)1465.
54] U.A. Paulus, T.J. Schmidt, H.A. Gasteiger, R.J. Behm, J. Electroanal.
Chem. 495 (2001) 134.55] A.J. Bard, L.R. Faulkner, Electrochemical Methods: Fundamentals andApplications, second ed., John Wiley & Sons, Inc., 2001.
56] K.M. Cable, K.A. Mauritz, R.B. Moore, J. Polym. Sci. B 33 (1995)1065.

chimi
[
[
[[[
[[
N. Ramaswamy et al. / Electro
57] Z. Liang, W. Chen, J. Liu, S. Wang, Z. Zhou, W. Li, G. Sun, Q. Xin, J.Membr. Sci. 233 (2004) 39.
58] A. Gruger, A. Regis, T. Schmatko, P. Colomban, Vib. Spectrosc. 26 (2001)215.
59] C. Heitner-Wirguin, Polymer 20 (1979) 371.60] W.Y. Hsu, T.D. Gierke, J. Membr. Sci. 13 (1983) 307.61] H.L. Yeager, A. Steck, J. Electrochem. Soc. 128 (1981) 1880.
[
[
ca Acta 53 (2008) 3279–3295 3295
62] M. Falk, Can. J. Chem. 58 (1980) 1495.63] R.T. Conley, Infrared Spectroscopy, Allyn and Bacon, Inc., Boston, MA,
1972.64] A. Eisenberg, H.L. Yeager, Perfluorinated Ionomer Membranes, American
Chemical Society, Washington. DC, 1982.65] M. Inaba, 14th International Conference on the Properties of Water and
Steam in Kyoto, Kyoto, Japan.
![Investigation of Photocatalytic Degradation of Methyl Orange by Using Nano-Sized ZnO … · 2017-08-28 · photo-degradation mechanism of ZnO being similar to that of TiO2 [3,14]](https://img.dokumen.tips/doc/110x75/5fb8941e7016c6512e43ed5b/investigation-of-photocatalytic-degradation-of-methyl-orange-by-using-nano-sized.jpg)


