Embed Size (px)
Citation preview

DEFORMATION DETECTION OF LIGHTWEIGHT CONCRETEBLOCK USING GEODETIC AND NON-GEODETIC METHODS
Halim Setan, Zainal Abidin Md Som & Khairulnizam M.Idris
Center for Industrial Measurement & Engineering SurveyingFaculty of Geoinformation Science & Engineering University Technology of Malaysia
81310 UTM Skudai Malaysia
Abstract
One of the main tasks in deformation monitoring is to investigate the movement or displacementthat occurred to any structural object. The measuring techniques and the instruments used forsuch monitoring are categorized as geodetic and non-geodetic (i.e., geotechnical/structural)methods. A monitoring survey has been conducted in a laboratory to detect the deformation of alight weight concrete block which undergoes load testing. A number of target points on onesurface of the concrete block has been monitored by triangulation survey using a total station.Five epochs of measurement have been obtained and each epoch was based on the load appliedranging from 0kN up to 358kN. The investigation is supplemented by data obtained from non-geodetic instrument (i.e., strain gauge). Results from such exercise indicate the practicality of thegeodetic method in deformation detection for civil engineering application.
1. Introduction
In general, the deformation measurement methods can be divided into two categories namely thegeodetic and non-geodetic. The geodetic method of deformation monitoring of any structuralobject involves determining the coordinates difference of object points measured from a referencenetwork. The non-geodetic method employs specialized instrumentation which normally used bythe geotechnical and structural engineers (Chrzanowski 1986, Teskey 1986). The geodeticmethod is very useful in giving a global deformation picture of deformation. While the non-geodetic method is benefit by providing measurement data at point where locality is not aproblem.
The main aim of geodetic deformations analysis includes (Chrzanowski and Szostak, 1995);
a) geometrical analysis, which describe the geometrical status of deformable object, change inshape and dimensions (rigid body movement) of whole deformable object with respect to astable reference frame,
b ) physical interpretation which describe the state of internal stresses and the relationshipbetween the causative factors and deformations.
Recently, a deformation measurement has been conducted to a lightweight concrete block (Fig 1)in conjunction with it's load test experiment. This research is a collaboration between Center ofIndustrial Measurement & Engineering Surveying (CIMES) and Laboratory of Material &Structural, Faculty of Civil Engineering UTM. This paper deals with geometrical deformationanalysis of axial compression test applies to the lightweight concrete (Figure 1) using geodeticmethod. The study was supplement by non-geodetic data obtained using strain gauges.
Proceedings, 11th FIG Symposium on Deformation Measurements, Santorini, Greece, 2003.
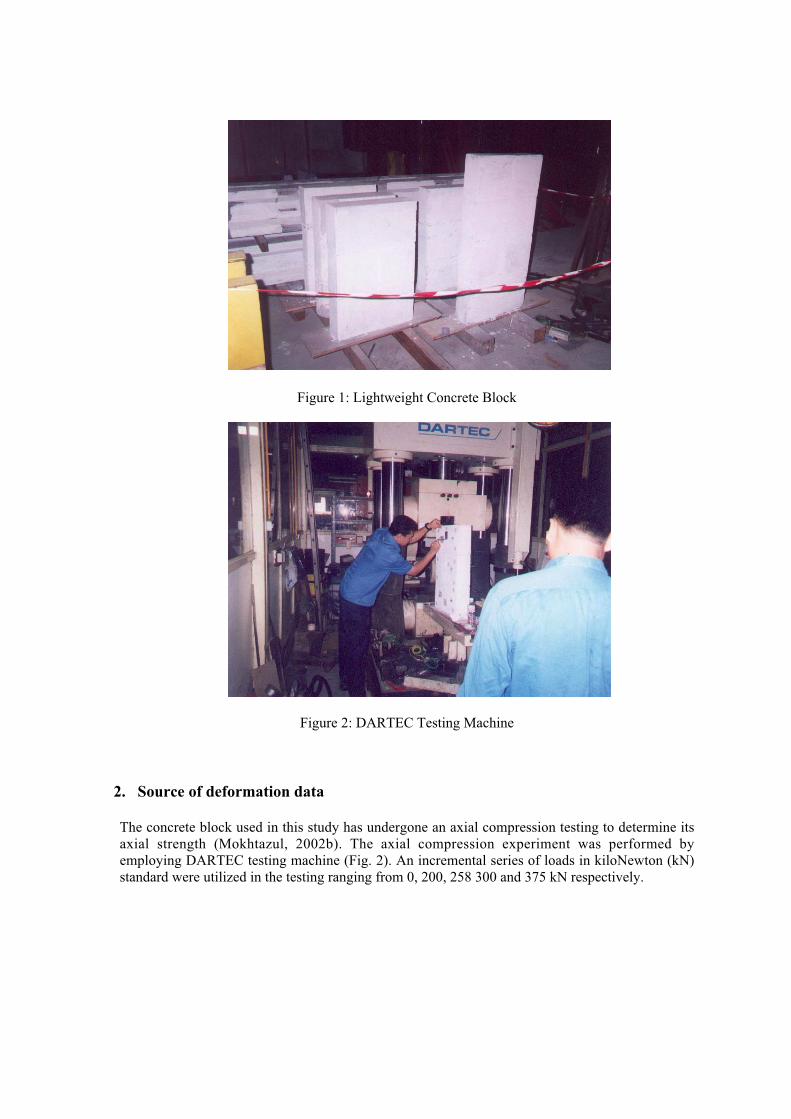
Figure 1: Lightweight Concrete Block
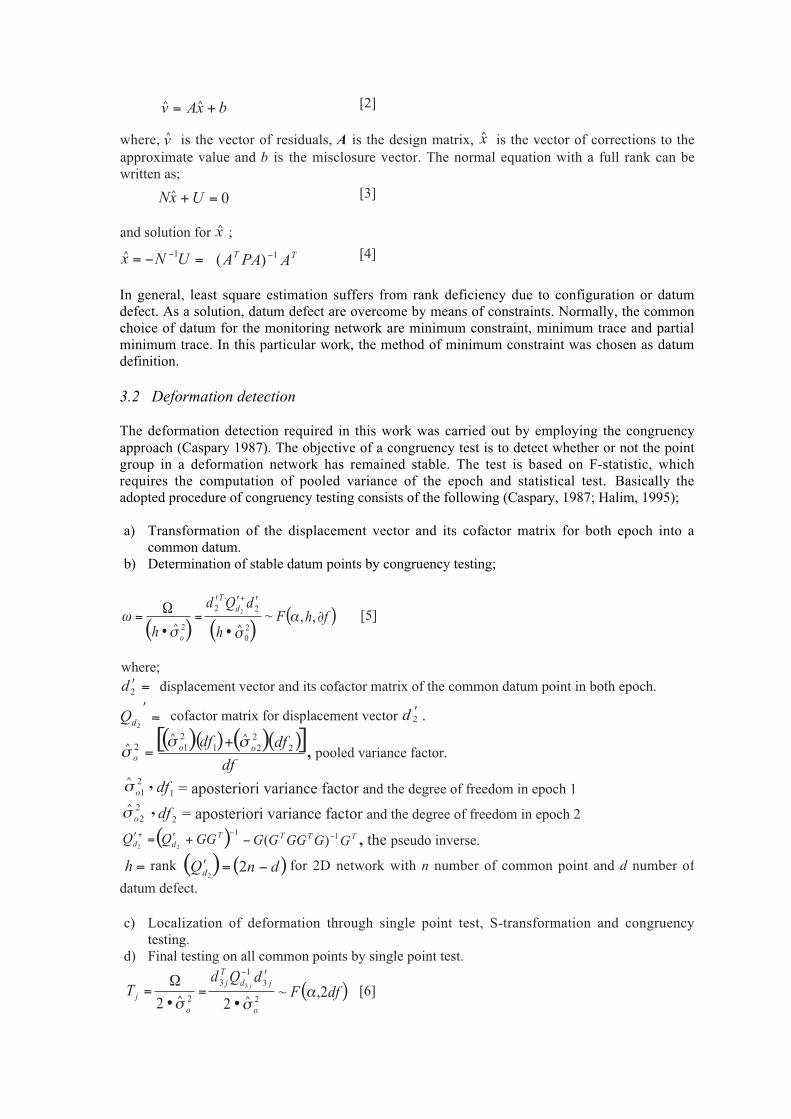
Figure 2: DARTEC Testing Machine
2. Source of deformation data
The concrete block used in this study has undergone an axial compression testing to determine itsaxial strength (Mokhtazul, 2002b). The axial compression experiment was performed byemploying DARTEC testing machine (Fig. 2). An incremental series of loads in kiloNewton (kN)standard were utilized in the testing ranging from 0, 200, 258 300 and 375 kN respectively.

2.1 Geothetic method
The geodetic method of deformation measurement were carried out from a small survey networkestablished within the laboratory (Fig 3). A number of object points were identified and markedwith retro-tape target and glued on one side of the concrete block (Fig 4). The survey methodutilized a conventional 2D measurements consist of bearing and distance observed using TotalStation. A total of five epoch of measurements were observed and each epoch was identify basedon the load utilized during the testing (i.e., 0kN, 200kN up to 375kN).
Figure 3: Sketch of the geodetic deformation network established in the laboratory
Fig 4: Distribution of object points on the concrete block
2.2 Non – geothetic method
In addition to conventional survey observations measurement by non-geodetic technique was alsoperformed to the lightweight concrete block. The non-geodetic scheme involves strainmeasurement at a number of points on the concrete block. The instrumentation used in collectingthe non-geodetic data is the Data Acquisition System consists of Electrical Resistance Strain(ERS) together with the Linear Variable Displacement Transducer (LVDT) as shown in Figure 5.The Electrical Resistance Strain are connected to high speed multi-channel data logger formeasuring strain, load pressure and voltage or thermocouple. All measurements are in real-timemode. Figure 6 shows location of the Electrical Resistance Strain points on the lightweightconcrete block.

Figure 5: The set-up of Non-Geodetic Instrumentations
Figure 6: Location of Electrical Resistance Strain (ERS) points
3. Mathematical formulation
3.1 Network adjusment
The measured data (e.g, directions and distances) are being related to the parameter (coordinates)by mathematical relationship called the functional model and expressed as (Cooper, 1987;Harvey, 1990);
)(xfl = [1]
bxAv += [2]
where, v is the vector of residuals, A is the design matrix, x is the vector of corrections to theapproximate value and b is the misclosure vector. The normal equation with a full rank can bewritten as;
0=+UxN [3]
and solution for x ;
APAAUNx TT 11 )( −− =−= [4]
^
^
^
^
^ ^
^
In general, least square estimation suffers from rank deficiency due to configuration or datumdefect. As a solution, datum defect are overcome by means of constraints. Normally, the commonchoice of datum for the monitoring network are minimum constraint, minimum trace and partialminimum trace. In this particular work, the method of minimum constraint was chosen as datumdefinition.
3.2 Deformation detection
The deformation detection required in this work was carried out by employing the congruencyapproach (Caspary 1987). The objective of a congruency test is to detect whether or not the pointgroup in a deformation network has remained stable. The test is based on F-statistic, whichrequires the computation of pooled variance of the epoch and statistical test. Basically theadopted procedure of congruency testing consists of the following (Caspary, 1987; Halim, 1995);
a) Transformation of the displacement vector and its cofactor matrix for both epoch into acommon datum.
b) Determination of stable datum points by congruency testing;
( ) ( )( )fhF
h
dQd
h
dT
o
∂•
′′′=
•
Ω=+
,,~20
22
2
2 ασσ
ω [5]
where;=′2d displacement vector and its cofactor matrix of the common datum point in both epoch.
=′2dQ cofactor matrix for displacement vector 2d ′ .
( )( ) ( )( )[ ]df
dfdf ooo
2221
212 σσ
σ+
= , pooled variance factor.
^
^^
^
^
21oσ ,
1df = aposteriori variance factor and the degree of freedom in epoch 122oσ ,
2df = aposteriori variance factor and the degree of freedom in epoch 2
( ) TTTTdd GGGGGGGGQQ 11
)(22
−−+ −+′=′ , the pseudo inverse.
=h rank ( ) ( )dnQd −=′ 22
for 2D network with n number of common point and d number of
datum defect.
c) Localization of deformation through single point test, S-transformation and congruencytesting.
d) Final testing on all common points by single point test.
( )dfFdQd
To
jdT
j
o
jj
2,~22 2
31
3
2
3 ασσ •
′=
•
Ω=
−
[6]
^
^
^ ^

4. Results and analysis
4.1 Results of the geothetic method
All computations for geodetic method has been solved by utilizing a computer packageDEFORM99 developed at the CIMES, University of Technology Malaysia. In DEFORM99, theleast square estimation employs minimum constraint datum definition, the deformation detection isusing congruency testing and the graphic presentation module is link with AutoCAD.
The deformation detection of the monitoring network consists of 13 points, i.e. 5 reference points(1,2,3,4 and 5) and 7 object points (6,7,8,9,10,11 and 12) were done on a two-epochs basis. Eachmeasurement epoch consists of 22 directions and 15 horizontal distances. A total of five epochs ofmeasurement data were gathered based on the load-test applied to the concrete block (i.e., 0kN,200kN, 258kN, 300kN and 375kN). Finally, the deformation analysis was only concentratedbetween the first and the last epochs of measurement (i.e., 0kN and 375kN loads). The summary ofthe least squares adjustment details are given in Table 1.
0kN 375kN
Datum definition 11 , yx 11, yx
No of Observations 37 37
Degrees of Freedom 15 15
Aposteri variance factor 0.448917 0.458043
Global Test 0.245 < 1 < 1.075 0.250 < 1 < 1.097
Critical value Pope Tau &
Local test
2.8198
All Passed
2.8198
All Passed
Table 1: Least squares estimation output
The displacement vector of the reference points and the object points of the lightweight concreteare determined by using congruency testing with points 1,2,3,4 and 5 defined as datum and theresults is tabulated in Table 2 below.
Object
Point 0kN & 200kN 0kN & 258kN 0kN & 375kN6 0.001 0.0012 0.00117 0.0025 0.0026 0.00448 0.0041 0.0065 0.00939 0.0046 0.0047 0.008
10 0.0012 0.0121 0.002611 0.0012 0.0118 0.003912 0.0044 0.0173 0.0075
Displacement Vector (m)
Table 2 : Displacement Vector

4.2 Results of the non - geothetic method
Figure 7: Strain-Stress relationship of the surface of lightweight concrete
0
0.5
1
1.5
2
2.5
3
3.5
4
4.5
5
5.5
6
6.5
7
7.5
-50 -40 -30 -20 -10 0 10 20 30 40 50 60
Strain ( µ )
Str
ess
(N/m
m2) M000
M001
M008
M009
The data obtained using non-geodetic technique (i.e., strain gauges) are able to provide asupplement view on deformation and the behavior of the lightweight concrete block. Thisinformation is the form of strain-stress relationship as shown in Fig 7. Strains are foundcritical at the top and bottom of the block (M008 and M009) and reduce strain at the sideof the block (M000 and M001). This is happening because the unit block expanded whenit was constructed.
5. Conclusion
The ability of surveyors to provides other profession such as civil engineer, a graphicalpresentation of displacement vector of the monitoring object is very meaningful. For example,results of this particular monitoring works (Fig 8) were given to civil engineering colleagues.Such results will then enable them to visualize the movement trend of the lightweight concreteblock which undergone the axial compression testing.
Figure 8: Displacement vector of object points on the concrete block

Figure 9: Direction of concrete block during the test
Theoretically, due to axial compression the lightweight concrete will expand in the way showngraphically in Fig. 9 (picture A). On the other hand, if the movement of the concrete block occursas in picture B it implies that either the geodetic monitoring results was wrong, or there could bewrong in designing the concrete block or mislaid of the concrete block on the DARTEC machine.Therefore, results obtained in this work is agreed to what is expected by judging the deformationvector obtained by geodetic method as indicated in Fig 8.
Acknowledgement
This work is part of a research project sponsored by the Ministry of Science and Technology,Malaysia under IRPA Program (Vote 74156).
References
Bruce R. Harvey (1990). “Practical Least Square and Statistics for Surveyor.” School ofGeomatic Engineering, The University of New South Wales. Monograph 13
Chrzanowski, A. (1986). “Geotechnical and other non-geodetic method in deformationmeasurement. ” In: Proceedings of the Deformation Measurement Workshop. Oct 31 – Nov1, Ed: Yehuda Bock, Massachusetts Institute of Technology, Cambridge, MA. pp. 112-152
Chrzanowski, A., Chen, Y.Q. & Secord, J.M (1986). “Geometrical Analysis of DeformationSurveys.” In: Proceedings of the Deformation Measurement Workshop. Oct. 31 – Nov. 1,Ed: Yehuda Bock, Massachusetts Institute of Technology, Cambridge, MA pp 170 – 206
Cooper, M.A.R. (1987). “Control Surveys in Civil Engineering.’ London: William Collins Sons& Co. Ltd
Chrzanowski, A. & Szostak-Chrzanowski, A. (1995). “Identification of Dam Mechanism.” TheMWA International Conference on Dam Engineering, Kuala Lumpur, August 1995.
Caspary, W. F. (1987). “Concept of Network and Deformation Analysis.” School of Surveying,The University New South Wales, Monograph 11.
Halim Setan (1995). “Functional and Stochastic Models for Geometrical Detection ofDeformation In Engineering: A Practical Approach.” PhD Thesis, City University.
Ranjit Singh (1999). “The Adjustment and Analysis of a Monitoring Network for the Purpose ofGeometrical Deformation Detection.” MSc Thesis, University of Technology Malaysia.
Teskey, W.F. (1986). “Integrated analysis of deformation.” In: Proceedings of DeformationMeasurement Workshop. Oct 31 – Nov 1, Ed: Yehuda Bock, Massachusetts Institute ofTechnology, Cambridge, MA pp. 221-233