Embed Size (px)
Citation preview

Defining Financial Stability
March 2017
Appendix B Postal Service March 20 Comments
PRC Docket No. RM2017-3
Postal Regulatory CommissionSubmitted 3/20/2017 4:18:09 PMFiling ID: 99556Accepted 3/20/2017

CONTACT INFORMATION
All communications, inquiries and requests for information relating to these materials should be directed to the persons listed below.
Evercore
55 East 52nd Street New York, NY 10055
George Ackert Sr. Managing Director
Tel: (212) 822-7547 [email protected]
Christopher Lynch Managing Director Tel: (212) 822-7561
Jonathan Weinstein Vice President
Tel: (212) 822-7587 [email protected]
Johanna Robinson Vice President
Tel: (212) 857-7543 [email protected]
Andrew Longley Associate
Tel: (646) 259-7894 [email protected]
Shruti Patel Analyst
Tel: (646) 259-7832 [email protected]
Appendix B Postal Service March 20 Comments
PRC Docket No. RM2017-3

DISCLAIMER
These materials have been prepared by Evercore Group L.L.C. (“Evercore”) for the United States Postal Service (the “USPS”) for inclusion in their report to the Postal Regulatory Commission (“PRC”) and may not be used or relied upon for any purpose other than as specifically contemplated. These materials are based on information provided by or on behalf of the USPS, from public sources or otherwise reviewed by Evercore. Evercore assumes no responsibility for independent investigation or verification of such information and has relied on such information being complete and accurate in all material respects. To the extent such information includes estimates and forecasts of future financial performance prepared by or reviewed with the USPS or obtained from public sources, Evercore has assumed that such estimates and forecasts have been reasonably prepared on bases reflecting the best currently available estimates and judgments of the USPS (or, with respect to estimates and forecasts obtained from public sources, represent reasonable estimates). No representation or warranty, express or implied, is made as to the accuracy or completeness of such information and nothing contained herein is, or shall be relied upon as, a representation, whether as to the past, the present or the future. These materials were designed for use by specific persons familiar with the business and affairs of the USPS. These materials are not intended to provide the sole basis for evaluating, and should not be considered a recommendation with respect to, any transaction or other matter. These materials have been prepared exclusively for the benefit and use of the USPS in connection with their report to the PRC. Evercore assumes no obligation to update or otherwise revise these materials. Evercore and its affiliates do not provide legal, accounting or tax advice.
Appendix B Postal Service March 20 Comments
PRC Docket No. RM2017-3
1
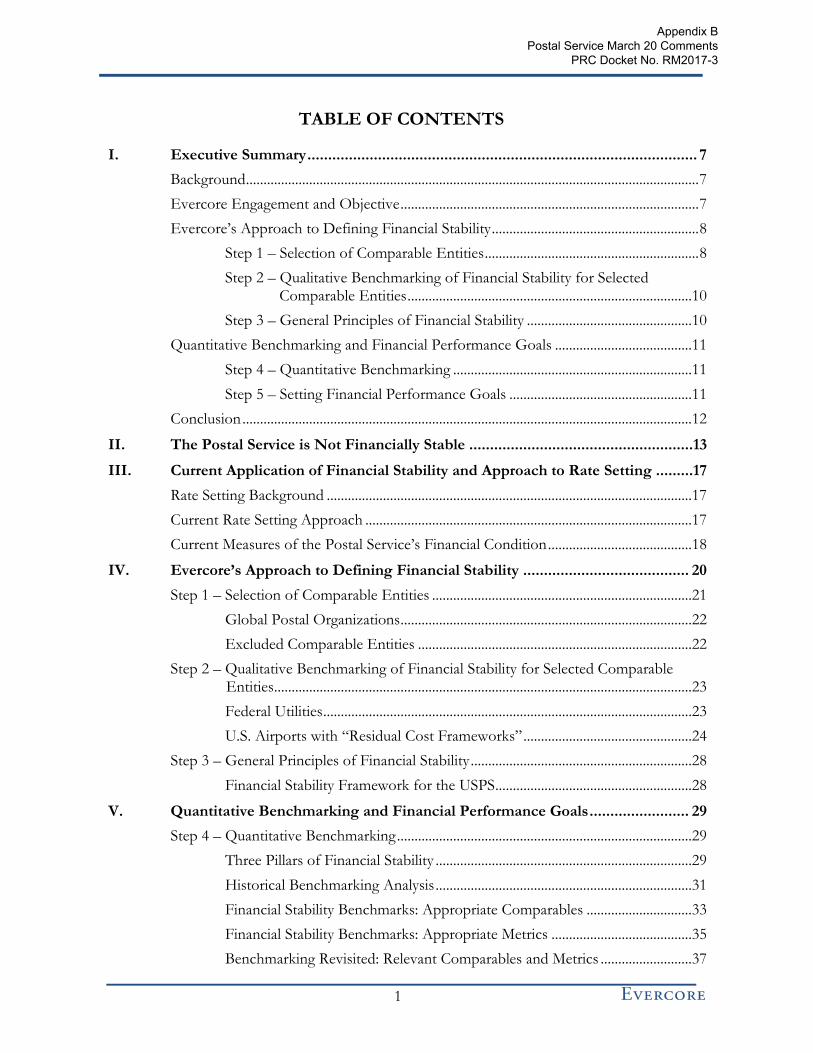
TABLE OF CONTENTS
I. Executive Summary .............................................................................................. 7
Background ................................................................................................................................. 7
Evercore Engagement and Objective ..................................................................................... 7
Evercore’s Approach to Defining Financial Stability ........................................................... 8
Step 1 – Selection of Comparable Entities ............................................................. 8
Step 2 – Qualitative Benchmarking of Financial Stability for Selected Comparable Entities .................................................................................10
Step 3 – General Principles of Financial Stability ...............................................10
Quantitative Benchmarking and Financial Performance Goals .......................................11
Step 4 – Quantitative Benchmarking ....................................................................11
Step 5 – Setting Financial Performance Goals ....................................................11
Conclusion ................................................................................................................................12
II. The Postal Service is Not Financially Stable ......................................................13
III. Current Application of Financial Stability and Approach to Rate Setting .........17
Rate Setting Background ........................................................................................................17
Current Rate Setting Approach .............................................................................................17
Current Measures of the Postal Service’s Financial Condition .........................................18
IV. Evercore’s Approach to Defining Financial Stability ........................................ 20
Step 1 – Selection of Comparable Entities ..........................................................................21
Global Postal Organizations ...................................................................................22
Excluded Comparable Entities ..............................................................................22
Step 2 – Qualitative Benchmarking of Financial Stability for Selected Comparable Entities .......................................................................................................................23
Federal Utilities .........................................................................................................23
U.S. Airports with “Residual Cost Frameworks” ................................................24
Step 3 – General Principles of Financial Stability ...............................................................28
Financial Stability Framework for the USPS ........................................................28
V. Quantitative Benchmarking and Financial Performance Goals ........................ 29
Step 4 – Quantitative Benchmarking ....................................................................................29
Three Pillars of Financial Stability .........................................................................29
Historical Benchmarking Analysis .........................................................................31
Financial Stability Benchmarks: Appropriate Comparables ..............................33
Financial Stability Benchmarks: Appropriate Metrics ........................................35
Benchmarking Revisited: Relevant Comparables and Metrics ..........................37
Appendix B Postal Service March 20 Comments
PRC Docket No. RM2017-3

2
Step 5 – Setting Financial Performance Goals ....................................................................39
Profitability Target ...................................................................................................39
Illustrative Exercise: Impact of One Year of 6% EBT Margin ........................39
Leverage Target #1 ..................................................................................................42
Leverage Target #2 ..................................................................................................42
Liquidity Target ........................................................................................................44
Targeting Conclusion ..............................................................................................................47
VI. Conclusion .......................................................................................................... 48
VII. Appendix ............................................................................................................. 52
A. BPA’s Rate Setting Mechanism: The Cost Recovery Adjustment Clause ...........52
B. Global Postal Organizations’ Responses to Market Headwinds ...........................52
Royal Mail’s Response to Financial Hardship ......................................................52
Australia Post’s Response to Financial Hardship ................................................53
Canada Post’s Financial Stability Plan ...................................................................53
C. Excluded Comparable Groups...................................................................................55
D. Considerations for the Defaulted PSHRBF Pre-Funding Payments ...................57
E. Office of the Inspector General: Report on Liquidity............................................59
F. Explanations of Financial Adjustments ....................................................................60
I. Cash Flow and Profitability Normalization Adjustments ............................60
II. Adjusted Liabilities and Adjusted Assets: Off-Balance-Sheet Adjustments ........................................................................................................61
III. Residual Airport Off-Balance-Sheet Adjustments ........................................63
Appendix B Postal Service March 20 Comments
PRC Docket No. RM2017-3

3
TABLE OF EXHIBITS
Glossary ............................................................................................................................. 4 Exhibit 1: Definition of Financial Stability ...................................................................................10 Exhibit 2: Financial Stability Metrics .............................................................................................11 Exhibit 3: Proposed USPS Financial Stability Targets ................................................................12 Exhibit 4: 10 Years of Consecutive Losses ...................................................................................13 Exhibit 5: Total Assets & Liabilities as of 9/30/16, Including Off-Balance-Sheet Items .....14 Exhibit 6: Rate Comparison of USPS to Other Global Posts ...................................................16 Exhibit 7: PRC Metrics of USPS Financial Stability – 12/2016 ................................................18 Exhibit 8: PRC Measures of USPS Financial Condition ............................................................19 Exhibit 9:
Financial Stability Comparables ...................................................................................21 Exhibit 10: Summary Attributes of Financial Stability Comparables..........................................27 Exhibit 11: Three Pillars of Financial Stability ...............................................................................30 Exhibit 12: Financial Benchmarking Analysis ................................................................................32 Exhibit 13: Appropriate Comparables for Financial Stability Benchmarks ...............................34 Exhibit 14: Financial Benchmarking Analysis with Comparability Indicators ..........................38 Exhibit 15: Proposed USPS Financial Stability Targets ................................................................39 Exhibit 16: Chart Annotation Legend .............................................................................................40 Exhibit 17: Profitability Metrics Analysis ........................................................................................41 Exhibit 18: Leverage Metrics Analysis .............................................................................................43 Exhibit 19: Liquidity Comparison: USPS vs. BPA & TVA ..........................................................44 Exhibit 20: Liquidity Metrics Analysis .............................................................................................46 Exhibit 21: Proposed USPS Financial Stability Targets ................................................................49 Exhibit 22: BPA Rate Adjustment Methodology ..........................................................................52 Exhibit 23: Canada Post’s Five-Year Financial Framework .........................................................55 Exhibit 24: EBT Margins for La Poste and Deutsche Post .........................................................56 Exhibit 25: EBT Margins for FedEx and UPS ..............................................................................57 Exhibit 26: Illustrative Example of Impact of Amortization Schedules of the PSRHBF .......59 Exhibit 27: Liquidity Metrics Analysis for USPS and Comparables ...........................................60 Exhibit 28: San Francisco International Airport (SFO) Pension & Other Postemployment Exhibit 29:
Benefits (OPEB) Adjustment .......................................................................................64 McCarran International Airport (LAS) Pension & Other Postemployment Exhibit 30:
Benefits (OPEB) Adjustment .......................................................................................64 Miami-Dade International Airport (MIA) Pension & Other Postemployment Exhibit 31:
Benefits (OPEB) Adjustment .......................................................................................65 USPS Benchmarking – Latest Fiscal Year Statistics .................................................67 Exhibit 32: Off-Balance-Sheet Adjustments ..................................................................................68 Exhibit 33: Historical Returns Benchmarking: USPS ...................................................................70 Exhibit 34: Historical Returns Benchmarking: U.S. Airports with “Residual Cost Exhibit 35:
Frameworks” ..................................................................................................................71 Historical Returns Benchmarking: Federal Utilities ..................................................73 Exhibit 36: Historical Returns Benchmarking: Global Postal Organizations ............................74 Exhibit 37:
Appendix B Postal Service March 20 Comments
PRC Docket No. RM2017-3
4
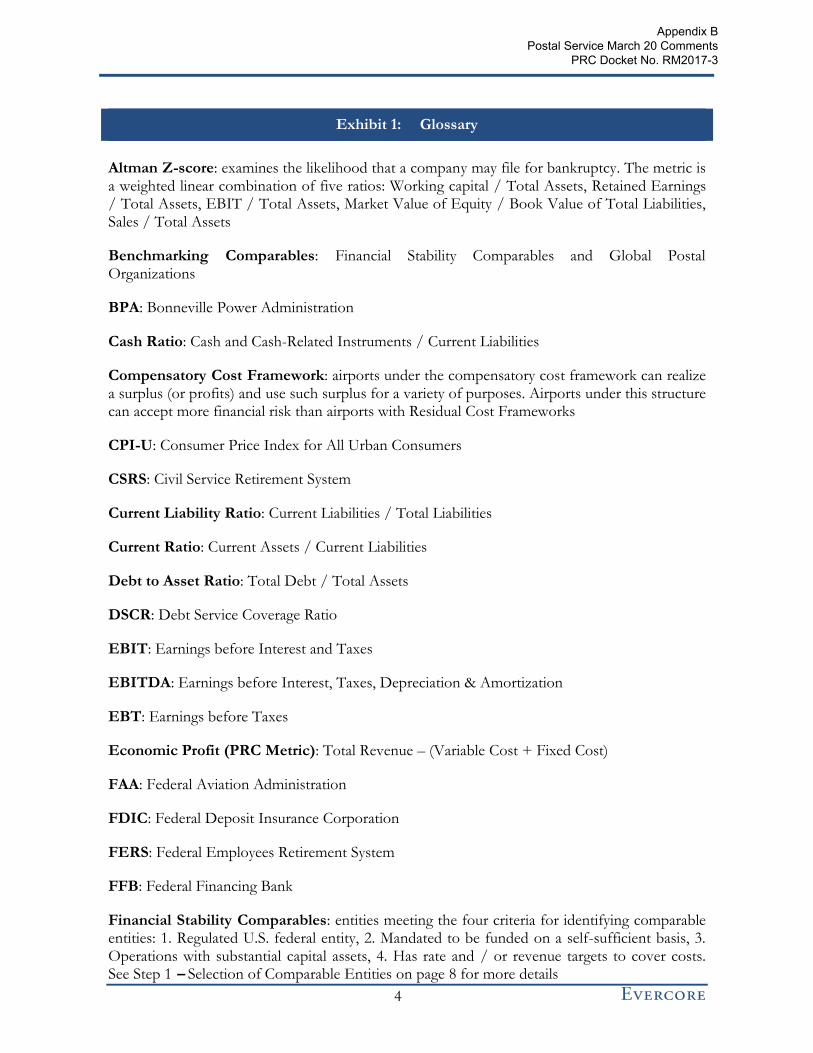
Glossary Exhibit 1:
Altman Z-score: examines the likelihood that a company may file for bankruptcy. The metric is a weighted linear combination of five ratios: Working capital / Total Assets, Retained Earnings / Total Assets, EBIT / Total Assets, Market Value of Equity / Book Value of Total Liabilities, Sales / Total Assets
Benchmarking Comparables: Financial Stability Comparables and Global Postal Organizations
BPA: Bonneville Power Administration
Cash Ratio: Cash and Cash-Related Instruments / Current Liabilities
Compensatory Cost Framework: airports under the compensatory cost framework can realize a surplus (or profits) and use such surplus for a variety of purposes. Airports under this structure can accept more financial risk than airports with Residual Cost Frameworks
CPI-U: Consumer Price Index for All Urban Consumers
CSRS: Civil Service Retirement System
Current Liability Ratio: Current Liabilities / Total Liabilities
Current Ratio: Current Assets / Current Liabilities
Debt to Asset Ratio: Total Debt / Total Assets
DSCR: Debt Service Coverage Ratio
EBIT: Earnings before Interest and Taxes
EBITDA: Earnings before Interest, Taxes, Depreciation & Amortization
EBT: Earnings before Taxes
Economic Profit (PRC Metric): Total Revenue – (Variable Cost + Fixed Cost)
FAA: Federal Aviation Administration
FDIC: Federal Deposit Insurance Corporation
FERS: Federal Employees Retirement System
FFB: Federal Financing Bank
Financial Stability Comparables: entities meeting the four criteria for identifying comparable entities: 1. Regulated U.S. federal entity, 2. Mandated to be funded on a self-sufficient basis, 3. Operations with substantial capital assets, 4. Has rate and / or revenue targets to cover costs. See Step 1 – Selection of Comparable Entities on page 8 for more details
Appendix B Postal Service March 20 Comments
PRC Docket No. RM2017-3

5
Global Postal Organizations (GPO): organizations whose operations are comparable to the USPS (e.g., Canada Post, Australia Post, Royal Mail)
LAS: Las Vegas McCarran International Airport
Liquidity: Cash and undrawn capacity of revolving credit line
Liquidity Days of Operating Expenses: this metric defines operating expenses as revenue minus EBITDA (as reflected on the income statement), and defines liquidity as the sum of the balances of cash, restricted cash, and available undrawn lines of credit. It measures the number of days for which an entity could cover its operating expenses with currently available resources
MIA: Miami International Airport
OCF: Operating Cash Flow
OPEB: Other Postretirement Benefit Obligations
Operating Expenses: Revenue – EBITDA (as reflected on the income statement)
Operating Profit (PRC Metric): Operational Revenue – Operational Expenses
PAEA: Postal Accountability and Enhancement Act of 2006
Pillars of Financial Stability: three broad categories of figures that provide a holistic picture of financial stability: Profitability, Liquidity, and Leverage
Postal Service: United States Postal Service
PRA: Postal Reorganization Act
PRC: Postal Regulatory Commission
PSRHBF: Postal Service Retiree Health Benefits Fund
Quick Ratio: Liquid Assets / Current Liabilities
Residual Cost Frameworks: airports with “residual cost frameworks” have residual cost agreements with airlines that pay terminal and landing fees. These airports set rates and charges based on the net revenue an airport needs to cover expenses including debt service
RHB: Retirement Health Benefits
SFO: San Francisco International Airport
Solvency (PRC Metric): Total Assets / Total Liabilities
STB: Surface Transportation Board
Appendix B Postal Service March 20 Comments
PRC Docket No. RM2017-3

6
Theoretical Liquidity Days of Operating Expenses: Theoretical Days of Operating Expenses is defined as the number of days for which a company could cover its operating expenses, given its current Liquidity and its ability to raise incremental debt without exceeding its statutory debt capacity, if applicable, or without being downgraded to a Moody’s credit rating of Caa1 or lower
TVA: Tennessee Valley Authority
USPS: United States Postal Service
Appendix B Postal Service March 20 Comments
PRC Docket No. RM2017-3

7
I. EXECUTIVE SUMMARY
Background
Ten years after the enactment of the Postal Accountability and Enhancement Act of 2006 (“PAEA”), the Postal Regulatory Commission (“PRC”) is required to review the regulatory system for Market-dominant products to determine whether it is achieving the objectives set forth in the statute Title 39 U.S.C § 3622 (b) (while also taking into account certain statutory factors [Title 39 U.S.C § 3622 (c)]). If the PRC determines that the current regulatory system is not achieving the objectives, it is authorized to modify the system or adopt an alternative system as it deems necessary to achieve the objectives. The PRC’s review commenced on December 20th, 2016.
Objective 5 of U.S.C § 3622 seeks to assure that for Market-dominant products the United States Postal Service (the “USPS” or the “Postal Service”) is assured of “adequate revenues, including retained earnings, to maintain financial stability”. However, U.S.C § 3622 does not define “financial stability” nor does it provide a framework for doing so. Notwithstanding the foregoing limitation, in the absence of any specific quantitative guidelines, the USPS has failed to meet the threshold for financial stability under any reasonable interpretation of the term, as evidenced, for example, by: (i) 10 years of consecutive net losses totaling $62.4 billion since 2007; (ii) limited liquidity, including a lack of any incremental borrowing capacity from the U.S. Treasury’s Federal Financing Bank (FFB); and (iii) five consecutive years of defaults totaling $33.9 billion on obligations to prefund the Postal Service Retiree Health Benefits Fund (“PSRHBF”).
The PRC’s assessment of the efficacy of the current regulatory system is critical to the long-term sustainability and livelihood of the Postal Service.
Evercore Engagement and Objective
Given the lack of a clear definition of “financial stability”, as a precursor to the PRC’s upcoming assessment, the USPS retained Evercore Group LLC as an independent, third-party expert to develop a framework for defining and measuring financial stability.
In August 2016, the USPS engaged Evercore on the basis of Evercore’s significant experience as a financial advisor to transportation and logistics companies – including the Postal Service (in multiple prior engagements).
The scope and objectives of Evercore’s engagement included determining: (i) what “financial stability” means in the context of the Postal Service; (ii) an appropriate level of liquidity for the Postal Service to maintain; (iii) an appropriate level of debt and other long-term liabilities for the Postal Service; (iv) an appropriate amount of annual earnings, cash flow, or other such metric for the Postal Service to generate; and (v) metrics that the Postal Service and the PRC could use to monitor the Postal Service’s financial condition in the future.
Evercore’s report is limited to defining financial stability and addressing the questions outlined above. Evercore has not opined on what specific changes – operational, financial, regulatory, or otherwise – should be implemented to facilitate the achievement of financial stability.
Appendix B Postal Service March 20 Comments
PRC Docket No. RM2017-3

8
Evercore’s Approach to Defining Financial Stability
Evercore employed a multi-faceted approach to (i) qualitatively define “financial stability”, relying upon well-established precedent standards, and (ii) identify financial metrics which could be used to quantitatively measure the Postal Service’s progress going forward.
Qualitatively Defining Financial Stability: Evercore’s approach to determining a qualitative definition began with the identification of entities that have similar mandates to be financially stable and meet certain other criteria (outlined in Step 1 below), but are not necessarily operationally similar to the Postal Service. Based on a review of the specific requirements of these comparable entities, such as the setting of rates to facilitate being funded on a self-sufficient basis, Evercore determined that financial stability could broadly be defined as being able to cover one’s costs sustainably over a long period of time with internally generated funds, as detailed below.
Quantitatively Measuring Financial Progress: After qualitatively defining financial stability, Evercore considered entities which could serve as quantitative benchmarks for determining specific financial targets the USPS could use to measure its performance in the future. The entities benchmarked in this analysis, which include other Global Postal Organizations, do not necessarily meet all of the same criteria as those considered in the qualitative definition of financial stability; nonetheless, they are relevant for quantitative benchmarking purposes and should have comparable financial metrics to the Postal Service, because they either (i) share the same mandate to be financially stable, or (ii) have similar operations.
While quantitative benchmarking can be used as a barometer of the Postal Service’s financial health in the future, the true test of financial stability is meeting the terms of the qualitative definition: covering one’s costs sustainability over a long period of time with internally generated funds. If the Postal Service is meeting its performance targets but not meeting the qualitative definition, then the performance targets should be reassessed from time to time.
Evercore’s approach to the assignment is outlined in further detail below.
Step 1 – Selection of Comparable Entities
Evercore determined that entities possessing the following attributes could be deemed comparable to the USPS in a financial stability context:
1) A regulated U.S. federal entity whose primary purpose is to provide a service to the public
2) The entity has a regulatory mandate to be funded on a self-sufficient basis, without the significant aid of governmental subsidies or tax revenue, generating sufficient revenue and cash flow to cover all of its current and future anticipated expenses via rate-setting mechanisms which are designed to ensure compliance with this mandate
3) The entity has operations with substantial capital assets and relies upon the availability of internally-generated cash flow, cash reserves, and debt
Appendix B Postal Service March 20 Comments
PRC Docket No. RM2017-3

9
4) Rate and / or revenue targets are set to cover operating costs, debt service, and other liabilities, without generating any meaningful incremental return to serve public (or private) shareholders
These entities were not required to have – and upon conducting the screen turned out not to have – the same business model as the Postal Service or similar business models to the Postal Service.
Applying the above criteria, Evercore identified the following entities as comparable to the USPS in a financial stability context, and therefore comprising the “Financial Stability Comparables”:
Federal Utilities
– Tennessee Valley Authority (“TVA”)
– Bonneville Power Administration (“BPA”)
U.S. Airports with “Residual Cost Frameworks”1
– San Francisco International Airport (“SFO”)
– Miami International Airport (“MIA”)
– Las Vegas McCarran International Airport (“LAS”)
While other global postal organizations do not meet all four of the criteria outlined above, there are many global postal organizations whose operations are comparable to the USPS. As such, Evercore also reviewed the financial profiles of a selected group of comparable global postal organizations (the “Global Postal Organizations” or “GPOs”) in order to assess financial stability for entities with similar operations. However, because these entities do not meet all four criteria listed above, the Global Postal Organizations are compared only for the purpose of financial benchmarking, as outlined later in this document. Furthermore, the Global Postal Organizations that Evercore examined were selected because they are currently or were recently state-owned, and have similar products, services and business models to the USPS. Based on this rationale, Evercore included the following GPOs:
Canada Post
Australia Post
Royal Mail2
Together with the Financial Stability Comparables, these entities are referred to throughout this memorandum as the “Benchmarking Comparables”. See Appendix Section C for additional information on postal and related organizations which were excluded from the analysis.
1 U.S. airports with “residual cost frameworks” have residual cost agreements with airlines that pay terminal and landing fees. These airports set rates and charges based on the net revenue an airport needs to cover expenses including debt service. The three entities chosen are a representative set of large residual cost airports 2 Royal Mail was examined both before and after its 2013 privatization
Appendix B Postal Service March 20 Comments
PRC Docket No. RM2017-3

10
Step 2 – Qualitative Benchmarking of Financial Stability for Selected Comparable Entities
Evercore researched the regulatory guidelines and mechanisms (e.g., rate-setting mechanisms) which govern the requirement and ability of the comparable entities to be financially stable. Evercore found that the Financial Stability Comparables have a regulatory mandate to generate sufficient revenue and cash flow to cover all of their current and future anticipated expenses, and further, that they have rate-setting mechanisms which are designed to ensure that they consistently meet this mandate.
Step 3 – General Principles of Financial Stability
Based in part on the research resulting from Step 2, Evercore developed a qualitative definition of financial stability for the USPS. Based on our review, Evercore has concluded that the principles of financial stability include the ability of an organization to:
1) Cover its financial costs (debt service costs) and operational costs (all other costs) sustainably over a long period of time,
2) Service its on- and off-balance-sheet liabilities, and
3) Have sufficient access to liquidity (i.e., cash and/or borrowing availability) to withstand cyclicality and unexpected temporary changes in business conditions.
Evercore then applied these general principles to create a definition of financial stability that is specific to the USPS.
Definition of Financial Stability Exhibit 2:
The USPS’s revenues and retained earnings shall be sufficient to allow the Postal Service to fund the following cash needs in each fiscal year:
Operating expenses
Statutorily mandated payments, including all post-retirement benefits (e.g., PSRHBF pre-funding), to the extent not already included on the income statement
Principal and interest on funded debt, as well as other liabilities as they come due
A prudent level of capital investment (e.g., in real estate, machinery and equipment, etc.) required to maintain the efficiency of and preserve the long-term viability of the Postal Service
Financial stability also encompasses the Postal Service’s ability to support an appropriate balance-sheet, including sufficient liquidity to protect against the risks of both normal and cyclical cash-flow fluctuations:
Appropriate level of debt capacity and other long-term liabilities to fund any unexpected short-term losses and capital expenditure needs that cannot be funded with current year cash flow
Appropriate level of cash reserves and other sources of liquidity
Appendix B Postal Service March 20 Comments
PRC Docket No. RM2017-3

11
Quantitative Benchmarking and Financial Performance Goals
Step 4 – Quantitative Benchmarking
The primary financial goal of the USPS should be to achieve financial stability as defined in Step 3, above. However, Evercore also sought to identify a set of financial metrics that can be used to compare the performance of the USPS to that of the Benchmarking Comparables in the future. Specifically, Evercore identified metrics which can be instructive in guiding management and regulatory decisions pertaining to the operations and capital structure of the business, to facilitate the achievement of financial stability. These metrics can be classified into three general categories, which together provide a holistic picture of financial stability: profitability, leverage and liquidity.
Evercore calculated these metrics for the USPS and the Benchmarking Comparables as of the latest fiscal year end, and in some cases over a longer period of time to control for year-to-year fluctuations.
Financial Stability Metrics Exhibit 3:
Primary Metric(s) Secondary Metric(s)
Profitability
EBT / Revenue EBIT / Revenue
(EBITDA – CapEx) / Revenue
(Operating Cash Flow – CapEx) / Revenue
Leverage
Total Liabilities / Total Assets, Adjusted to Include Off-Balance-Sheet Items
Total Debt / EBITDA
Total Debt / Total Assets
Total Liabilities / Total Assets
Liquidity
Theoretical Liquidity Days of Operating Expenses
Liquidity Days of Operating Expenses
Current Assets / Current Liabilities
Step 5 – Setting Financial Performance Goals
Based on the outcome of the quantitative benchmarking in Step 4, Evercore identified specific targets, or financial performance goals, for measuring the financial health of the USPS in the future. The goals take into account structural differences between the entities, including capital structure, capital intensity, and non-governmental debt availability, among others. These goals were set to guide operational and capital structural decisions related to attaining financial stability over time. To determine these target ranges, Evercore referenced the ranges of financial metrics for the Benchmarking Comparables, as summarized in Exhibit 4.
Appendix B Postal Service March 20 Comments
PRC Docket No. RM2017-3

12
It should be noted again that successful or unsuccessful financial performance in any of the financial stability targets is not necessarily determinative of being financially stable or unstable. Instead, financial stability of the Postal Service is determined with respect to its ability to sustainably cover its costs, as outlined in Step 3. However, successful performance in these metrics does indicate a correlation with the financial results of financially stable entities.
Proposed USPS Financial Stability Targets Exhibit 4:
Note: See Exhibit 14 for the rationale for including / excluding certain Benchmarking Comparables from the range used for each metric (1) Global Postal Organizations and Federal Utilities serve as comparable entities to establish target EBT margins (2) Global Postal Organizations serve as comparable entities to establish target Debt / EBITDA ratio (3) Global Postal Organizations serve as comparable entities to establish target Adjusted Total Liabilities / Adjusted Total Assets ratio (4) Global Postal Organizations and Federal Utilities serve as comparable entities to establish target Theoretical Days of Opex
Conclusion
As discussed above, Evercore has determined that in order to be “financially stable” the USPS must generate revenue and retained earnings that are sufficient to cover its costs sustainably. The USPS is not currently financially stable under this definition because it does not cover its costs and is not expected to be in a position to cover its costs on a sustainable basis in the foreseeable future.
Category Metric 2016 Actual
Proposed
Target
Benchmarking
Comps Range
Benchmarking
Comps Mean
Benchmarking
Comps Median
Profitability EBT Margin(1) (8%) 6% 3% - 11% 5% 4%
Leverage Total Debt / EBITDA(2) (4.1x) 1.0x - 2.5x 0.7x - 2.3x 1.6x 1.7x
Leverage Adjusted Total Liabilities / Total Assets(3) 126% 85% 63% - 104% 83% 83%
Liquidity Theoretical Liquidity Days of Opex(4) 39 240 161 - 689 352 239
Appendix B Postal Service March 20 Comments
PRC Docket No. RM2017-3

13
II. THE POSTAL SERVICE IS NOT FINANCIALLY STABLE
While there is no uniform definition for “financial stability”, the Postal Service’s existing rate structure and non-controllable costs have prevented the USPS from generating sufficient revenues for Market-dominant products or curtailing expenses sufficiently to achieve “financial stability”.
Notwithstanding operational efficiency gains and innovations that have been achieved, the Postal Service’s financial results over the last decade reflect a decline in high contribution First Class Mail volume, a rigid rate structure on Market-dominant products, and high non-controllable costs – all of which, in the aggregate, have led to, among other things: (i) 10 consecutive years of losses; (ii) five consecutive years of defaults on its retiree health benefit prefunding obligations; (iii) an underfunded balance sheet; (iv) debt levels that are at the statutory maximum level of $15 billion; and (v) a cash balance that is insufficient to weather cyclicality or changes in business conditions.
Consecutive Losses: Since 2007, the USPS has been unable to cover its costs in part due to declining mail volumes and a high cost structure. As a result, the USPS has suffered 10 years of consecutive net losses totaling $62.4 billion since 2007 (see Exhibit 5).
10 Years of Consecutive Losses Exhibit 5:
Source: Company filings (1) In 2009, $4.0 billion of RHB Pre-Funding was deferred and will be re-evaluated in 2017 (2) In September 2011, Congress deferred the 2011 required RHB Pre-Funding payment of $5.5 billion until August 2012; it is included
in the ($15.9 billion) 2012 figure
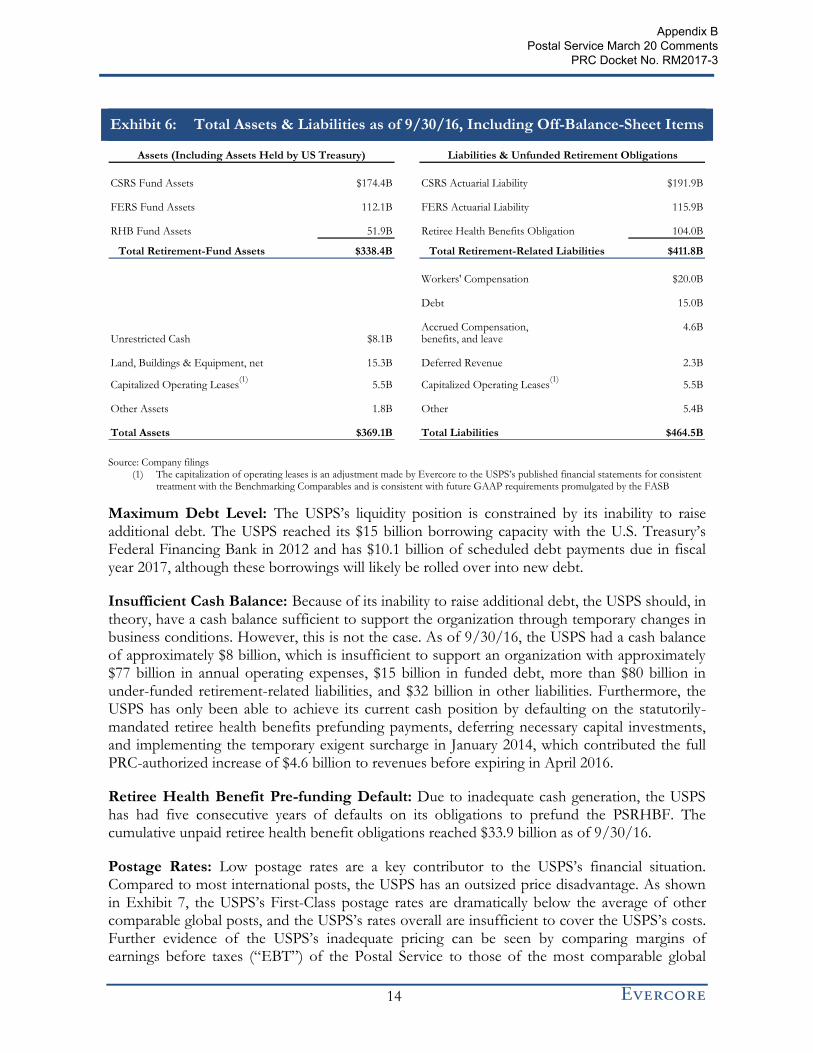
Underfunded Balance Sheet: The USPS’s balance sheet is underfunded. Including off-balance-sheet items, the USPS’s Total Liabilities exceeded Assets by more than $95 billion (or 26%) as of 9/30/16 (See Exhibit 6).
$0.9
($5.1)
($2.8)($3.8)
($8.5)
($5.1)
($15.9)
($5.0) ($5.5) ($5.1) ($5.6)
($18.0)
($16.0)
($14.0)
($12.0)
($10.0)
($8.0)
($6.0)
($4.0)
($2.0)
$0.0
$2.0
2006 2007 2008 2009 2010 2011 2012 2013 2014 2015 2016
($ B
illi
on
s)
(1)
(2)
(2)
Appendix B Postal Service March 20 Comments
PRC Docket No. RM2017-3
14
Total Assets & Liabilities as of 9/30/16, Including Off-Balance-Sheet Items Exhibit 6:
Source: Company filings (1) The capitalization of operating leases is an adjustment made by Evercore to the USPS’s published financial statements for consistent
treatment with the Benchmarking Comparables and is consistent with future GAAP requirements promulgated by the FASB
Maximum Debt Level: The USPS’s liquidity position is constrained by its inability to raise additional debt. The USPS reached its $15 billion borrowing capacity with the U.S. Treasury’s Federal Financing Bank in 2012 and has $10.1 billion of scheduled debt payments due in fiscal year 2017, although these borrowings will likely be rolled over into new debt.
Insufficient Cash Balance: Because of its inability to raise additional debt, the USPS should, in theory, have a cash balance sufficient to support the organization through temporary changes in business conditions. However, this is not the case. As of 9/30/16, the USPS had a cash balance of approximately $8 billion, which is insufficient to support an organization with approximately $77 billion in annual operating expenses, $15 billion in funded debt, more than $80 billion in under-funded retirement-related liabilities, and $32 billion in other liabilities. Furthermore, the USPS has only been able to achieve its current cash position by defaulting on the statutorily-mandated retiree health benefits prefunding payments, deferring necessary capital investments, and implementing the temporary exigent surcharge in January 2014, which contributed the full PRC-authorized increase of $4.6 billion to revenues before expiring in April 2016.
Retiree Health Benefit Pre-funding Default: Due to inadequate cash generation, the USPS has had five consecutive years of defaults on its obligations to prefund the PSRHBF. The cumulative unpaid retiree health benefit obligations reached $33.9 billion as of 9/30/16.
Postage Rates: Low postage rates are a key contributor to the USPS’s financial situation. Compared to most international posts, the USPS has an outsized price disadvantage. As shown in Exhibit 7, the USPS’s First-Class postage rates are dramatically below the average of other comparable global posts, and the USPS’s rates overall are insufficient to cover the USPS’s costs. Further evidence of the USPS’s inadequate pricing can be seen by comparing margins of earnings before taxes (“EBT”) of the Postal Service to those of the most comparable global
Liabilities & Unfunded Retirement Obligations
CSRS Fund Assets $174.4B CSRS Actuarial Liability $191.9B
FERS Fund Assets 112.1B FERS Actuarial Liability 115.9B
RHB Fund Assets 51.9B Retiree Health Benefits Obligation 104.0B
Total Retirement-Fund Assets $338.4B Total Retirement-Related Liabilities $411.8B
Workers' Compensation $20.0B
Debt 15.0B
Accrued Compensation, 4.6BUnrestricted Cash $8.1B benefits, and leave
Land, Buildings & Equipment, net 15.3B Deferred Revenue 2.3B
Capitalized Operating Leases(1)
5.5B Capitalized Operating Leases(1)
5.5B
Other Assets 1.8B Other 5.4B
Total Assets $369.1B Total Liabilities $464.5B
Assets (Including Assets Held by US Treasury)
Appendix B Postal Service March 20 Comments
PRC Docket No. RM2017-3

15
posts. The USPS’s 2016 EBT margin was negative 11% compared to positive EBT margins for the USPS’s peers who have higher First-Class mail rates.
Appendix B Postal Service March 20 Comments
PRC Docket No. RM2017-3

16
Rate Comparison of USPS to Other Global Posts Exhibit 7:
Cost of Postage for a Domestic Standard Letter - Adjusted for Purchasing Power Parity (PPP) ($USD)(1)
Source: Deutsche Post March 2016 Report and World Bank
(1) Exchange rates as of 2/14/2017; PPP adjustment from World Development Indicators indexed to U.S.
(2) EBT margin shown is a 5-year average for all international posts, except for Canada Post, which is the 2014 - 2015 average to reflect the sizable price increase implemented in 2014
Average: $0.92
$3.56
$2.42
$1.70
$1.24
$1.24
$1.23
$1.19
$1.15
$1.13
$1.12
$1.07
$1.07
$1.04
$0.95
$0.93
$0.93
$0.93
$0.91
$0.91 $0.88
$0.85
$0.84
$0.79
$0.79
$0.75
$0.74
$0.68
$0.66
$0.64
$0.62
$0.58
$0.57
$0.49
$0.41
$0.00 $0.25 $0.50 $0.75 $1.00 $1.25 $4.00
Italy
Denmark
Croatia
Slovakia
Poland
Finland
Bulgaria
Iceland
Greece
Estonia
Latvia
Norway
Hungary
Czech Republic
Portugal
Lithuania
France
Belgium
Romania
UK
Germany
Netherlands
Austria
Ireland
Switzerland
Luxembourg
Sweden
Canada
Spain
Australia
Cyprus
Slovenia
United States
Malta
Most Comparable Global Posts
(11%)
3%
3%
EBT Margin for Selected
Global Posts(2)
3%
4%
4%
Appendix B Postal Service March 20 Comments
PRC Docket No. RM2017-3
17
III. CURRENT APPLICATION OF FINANCIAL STABILITY AND APPROACH TO RATE SETTING
Rate Setting Background
In 1971, the Postal Reorganization Act (“PRA”) formed the United States Postal Service as an “independent establishment of the executive branch of the Government of the United States” with the mandate to offer a “fundamental service” to the nation “at fair and reasonable rates”. The USPS does not receive tax dollars and relies solely on the sale of postage, products and services to fund its operations. The PRA mandated the PRC to set the rates for different classes of mail by holding hearings on rates proposed by the USPS. The Postal Accountability and Enhancement Act of 2006, Public Law 109-435 endowed the PRC with regulatory and oversight obligations. Specifically, the PAEA requires the PRC to develop and maintain regulations for a modern system of rate regulation. Starting in December 2016, the PRC is required to review the regulatory system for Market-dominant products to determine whether it is achieving the objectives set forth in the statute Title 39 U.S.C § 3622 (b), including:
1) Creating predictability and stability in rates;
2) Allowing the Postal Service pricing flexibility; and
3) Assuring adequate revenues, including retained earnings, to maintain financial stability.
It should be noted that the PAEA does not explicitly define “financial stability”.
Current Rate Setting Approach
Current law states that, except in very narrow circumstances, price increases for Market-dominant products cannot exceed changes in the Consumer Price Index for All Urban Consumers (CPI-U) for the most recent available 12-month period. The CPI-U price cap applies to the five classes of Market-dominant products: First Class Mail, Periodicals, Standard Mail, Package Services, and Special Services. Additionally, the PRC is mandated to establish a schedule whereby the rates change at regular intervals by predictable amounts.3
In an attempt to improve the USPS’s financial situation after the decline in volumes following the Great Recession, the PRC ruled in December 2013 that the Postal Service could collect a 4.3% exigent surcharge on Market-dominant products. However, this surcharge expired in April 2016 and mail volumes are expected to continue to decline. Revenue lost as a consequence of the expiration of the surcharge will further impair the Postal Service.
3 Section 711 and 3622.d in the PAEA; https://www.govtrack.us/congress/bills/109/hr6407/text
Appendix B Postal Service March 20 Comments
PRC Docket No. RM2017-3

18
Current Measures of the Postal Service’s Financial Condition
As noted previously, one of the PRC’s objectives is to assure “adequate revenues, including retained earnings, to maintain financial stability”, yet U.S.C § 3622 does not define “financial stability”, nor does it provide a framework for doing so. As outlined in this section, the PRC has proposed several financial metrics and ratios to assess the Postal Service’s overall financial health and solvency; while many of these figures are relevant to measuring financial stability, they do not provide a comprehensive picture of financial stability, including the ability of the Postal Service to cover its costs sustainably over a long period of time.
In its Advance Notice of Proposed Rulemaking on the Statutory Review of the System for Regulating Rates and Classes for Market Dominant Products issued on December 20, 2016, the PRC issued a “preliminary definition”, defining financial stability as a state in which “the Postal Service is financially solvent while able to respond to changes in its environment (e.g., volume erosion, legal or regulatory framework, demographic trends) and meet its statutory obligations (e.g., pricing and universal service).”
While this preliminary definition provides a foundation for examining financial stability, it is incomplete. Simply looking to current financial solvency fails to consider what changes need to be made to ensure that the USPS will remain financially solvent in the long run, given the changes in its environment and statutory obligations.
In the same publication, the PRC set forth the metrics in Exhibit 8 to measure short-term, medium-term and long-term financial stability.
PRC Metrics of USPS Financial Stability – 12/2016 Exhibit 8:
Short-term Operating Profit: Operational Revenue – Operational Expenses
Medium-term Economic Profit: Total Revenue – (Variable Cost + Fixed Cost)
Long-term Solvency: Total Assets / Total Liabilities
As with the preliminary definition, these metrics, while relevant, do not provide a comprehensive view of financial stability. Only considering operating profit and economic profit fails to account for the USPS’s ability to weather market fluctuations using liquidity and access to capital. Considering only current solvency fails to address the fact that the USPS is losing money every year, and does not explicitly consider the USPS’s significant off-balance sheet net liabilities.
Similarly, in its Annual Financial Analysis the PRC does not define financial stability, but does consider a number of financial ratios to assess the Postal Service’s overall financial health and solvency (described in Exhibit 9).
Appendix B Postal Service March 20 Comments
PRC Docket No. RM2017-3

19
PRC Measures of USPS Financial Condition Exhibit 9:
Overall Financial
Health
PRC presents three key financial ratios to analyze the Postal Service’s overall financial health:
– Debt to Assets Ratio: Total Debt ÷ Total Assets
– Fixed Assets to Net Worth Ratio: Fixed Assets ÷ Net Worth
– Current Liability Ratio: Current Liabilities ÷ Total Liabilities
Solvency
PRC presents the following three liquidity-related ratios to assess the solvency of the USPS:
– Current Ratio: Current Assets ÷ Current Liabilities
– Quick Ratio: Liquid Assets ÷ Current Liabilities
– Cash Ratio: Cash and Cash-Related Instruments ÷ Current Liabilities
Long-term Financial Viability
To assess the long-term financial viability of the USPS, PRC uses the Altman Z-score, which examines the likelihood that a company may file for bankruptcy. The Z-score is a weighted linear combination of five common ratios: (i) Working Capital ÷ Total Assets, (ii) Retained Earnings ÷ Total Assets, (iii) EBIT ÷ Total Assets, (iv) Market Value of Equity ÷ Book Value of Total Liabilities, and (v) Sales ÷ Total Assets
While some of the metrics assessed by the PRC do help to demonstrate problems with the USPS’s balance sheet, as a whole they fail to paint a complete picture of the current financial health of the organization. For example, profitability is not discretely measured (it is only considered through one component of the Altman Z-score), yet it is critical to consider because it is determinative of an entity’s ability to cover its expenses over time.
Additionally, these metrics rely primarily on balance sheet measurements, which are point-in-time in nature. To thoroughly understand current performance, profitability, liquidity, and balance sheet metrics should be evaluated together.
Finally, the Altman Z-score is not relevant for measuring the USPS’s financial stability. The Altman Z-score measures the likelihood of an entity declaring bankruptcy within two years by statistically comparing its financial metrics to those of a composite of other entities who have declared bankruptcy in the past. Bankruptcy (not to be confused with insolvency) is a remote outcome for Federally-sponsored enterprises supported by implicit Federal guarantees, such as the USPS. Furthermore, the Altman Z-score uses market value of equity, which is not observable for a government entity such as the USPS. Lastly, the test was developed using a database of 66 manufacturing firms, all of which would be unlikely comparables for the USPS; while alternate Z-score tests do exist for non-manufacturers, the results are still not instructive to management on how to fix any operational or capital structure problems that may exist.
To assess the USPS’s financial stability, one must look at profitability, leverage and liquidity separately, and in combination.
Appendix B Postal Service March 20 Comments
PRC Docket No. RM2017-3

20
IV. EVERCORE’S APPROACH TO DEFINING FINANCIAL STABILITY
Evercore’s multi-faceted approach to defining “financial stability” was designed to identify well-established precedent standards of the term to apply to the USPS, and then identify financial metrics which could be used to measure the USPS’s progress going forward. The process that Evercore undertook is as follows:
Step 1 Selection of Comparable
Entities
Evercore defined parameters for other entities that could be deemed comparable to the USPS either (i) in the sense that they also have a government mandate to be financially stable (Financial Stability Comparables), or (ii) from an operational perspective (Global Postal Organizations). Using these parameters, Evercore conducted a screen to select a set of relevant comparable entities.
Step 2
Qualitative Benchmarking of Financial Stability
for Selected Comparable
Entities
Evercore researched the regulatory guidelines and mechanisms (e.g., rate adjustment mechanisms) which govern the requirement and ability of the Financial Stability Comparables to be financially stable.
Step 3 General Principles
of Financial Stability
Based in part on the research resulting from Step 2, Evercore developed a qualitative definition of financial stability for the USPS.
Step 4 Quantitative
Benchmarking
Evercore identified a set of financial metrics to be used to compare the performance of the USPS to that of the Benchmarking Comparables in the future; these metrics can be instructive in guiding management decisions pertaining to the operations and capital structure of the business, to facilitate the achievement of financial stability. Evercore calculated and compared these metrics for the USPS and the comparable entities as of the latest fiscal year end or over a longer period of time to control for year-to-year fluctuations.
Step 5 Setting Financial
Performance Goals
Based on the outcome of the quantitative benchmarking in Step 4, Evercore designed a framework with specific targets for measuring the financial health of the USPS in the future.
Appendix B Postal Service March 20 Comments
PRC Docket No. RM2017-3

21
Step 1 – Selection of Comparable Entities
Evercore began by defining parameters for entities that have financial stability mandates similar to the one which governs the Postal Service. While the term “financial stability” lacks a uniform definition, it encompasses characteristics commonly embraced by financial managers of regulated / unregulated, state controlled / non-state controlled, and for-profit / not-for-profit entities alike, particularly when regulated rate setting is involved. Evercore concluded that the following four criteria are most appropriate for identifying comparables:
1) A regulated U.S. federal entity whose primary purpose is to provide a service to the public
2) The entity has a regulatory mandate to be funded on a self-sufficient basis, without the
significant aid of governmental subsidies or tax revenue, generating sufficient revenue
and cash flow to cover all of its current and future anticipated expenses via rate-setting
mechanisms which are designed to ensure compliance with this mandate
3) The entity has operations with substantial capital assets and relies upon the availability of internally-generated cash flow, cash reserves, and debt
4) Rate and / or revenue targets are set to cover operating costs, debt service, and other liabilities, without generating any meaningful incremental return to serve public (or private) shareholders
These entities were not required to have – and upon conducting the screen turned out not to have – the same business model as the Postal Service or similar business model to the Postal Service.
After defining these parameters for comparable entities, Evercore conducted a screen to identify organizations other than the USPS which meet all four criteria. Two general categories emerged from this screen: (i) Federal Utilities, and (ii) U.S. Airports with a “Residual Cost Framework”, a qualifier which is discussed in more detail on page 24. Exhibit 10 lists the particular entities evaluated.
Financial Stability Comparables Exhibit 10:
Federal Utilities Selected Airports with “Residual Cost Frameworks”
Tennessee Valley Authority (TVA)
Bonneville Power Administration (BPA)
San Francisco International Airport (SFO)
Las Vegas McCarran International Airport (LAS)
Miami Dade International Airport (MIA)
Appendix B Postal Service March 20 Comments
PRC Docket No. RM2017-3
22
Global Postal Organizations
Global Postal Organizations were considered as additional reference points because they most closely follow the business model of the USPS. Although these organizations do not meet all of the criteria for Financial Stability Comparables listed earlier, they are instructive in determining appropriate benchmarking targets that are attainable for a postal organization which has implemented measures to improve its financial performance. The three GPOs that Evercore considered most comparable to the USPS are currently or were recently state-owned, and have similar products, services and business models to the USPS. Based on these criteria, the three comparable Global Postal Organizations examined by Evercore are:
Canada Post
Australia Post
Royal Mail4
It should be noted that La Poste (France) and Deutsche Post (Germany) were excluded as benchmarks, despite being identified as comparable global posts in Exhibit 7. They were excluded because they both have different business models from the USPS; La Poste operates a banking segment while Deutsche Post operates domestic mail and global express, freight forwarding, and contract logistics businesses. More information about this exclusion can be found in Section C of the Appendix.
Each of the three organizations identified above has responded to the financial challenges facing the global mail industry driven by electronic diversion and the recent global recession, and has generated a sustainably positive profit margin. The Global Postal Organizations’ responses to market headwinds are detailed in Section B of the Appendix and the financial results of these actions are evidenced in the financial analyses presented in this memorandum.
Excluded Comparable Entities
Evercore identified several other entities in its screen which were excluded because they did not meet all of the criteria for inclusion as Financial Stability Comparables or Benchmarking Comparables. These entities include: private sector utilities regulated by commissions, railroads regulated by the Surface Transportation Board, the Federal Deposit Insurance Corporation, certain global postal organizations and integrators, logistics companies, and U.S. airports with “compensatory cost frameworks”.
The USPS is often compared to UPS and FedEx domestically. These organizations were excluded from Evercore’s benchmarking analysis because both companies are publicly-traded, for-profit companies, and have different business models and product mixes from the USPS (both include logistics services businesses).
More details about excluded comparable entities can be found in Section C of the Appendix.
4 Royal Mail was examined both before and after its 2013 privatization
Appendix B Postal Service March 20 Comments
PRC Docket No. RM2017-3
23
Step 2 – Qualitative Benchmarking of Financial Stability for Selected Comparable Entities
To inform our definition of financial stability for the USPS, Evercore researched, aggregated and studied available financial stability language, mandates, rates rules and regulations, and liquidity and funding constraints for the Financial Stability Comparables.
Federal Utilities
In the context of this analysis, Federal Utilities operate federally owned electrical generation assets for the purposes of selling electrical output to the public. Evercore focused on the Tennessee Valley Authority and Bonneville Power Administration, as these are two of the largest Federal Utilities in the United States and meet all of the criteria for Financial Stability Comparables.
Tennessee Valley Authority
The Tennessee Valley Authority operates the nation’s largest public power system and supplies power in most of Tennessee, northern Alabama, northeastern Mississippi, and southwestern Kentucky and in portions of northern Georgia, western North Carolina, and southwestern Virginia to a population of over nine million people. The TVA is governed by the Tennessee Valley Act of 1933, and is regulated by a board of directors that is appointed by the President of the United States.
In terms of financial stability, the TVA aims to sell power at rates that are as low as feasible, and has the following four strategic imperatives:5
Rates – maintain low rates;
Stewardship – be responsible stewards;
Debt – live within its means; and
Asset Portfolio – meet reliability expectations and provide a balanced portfolio.
For rate setting, the TVA is authorized to charge rates for power that are sufficient to:
Fund operations and maintenance;
Pay tax and tax equivalents;
Service debt outstanding;
Cover minimum payments to U.S. Treasury as repayment for and return on the government’s appropriation investment in TVA’s power facilities6; and
5 Page 23 of TVA Budget Proposal and Management Agenda; https://www.tva.com/file_source/TVA/Site%20Content/About%20TVA/Guidelines%20and%20Reports/FY17%20Performance%20Report%20-%20FINAL.pdf 6 Congress has not provided any funding appropriations to TVA since 1999; during 2000, TVA began paying for essential stewardship activities primarily with power revenues, with the remainder funded with user fees and other forms of revenues derived in connection with those activities
Appendix B Postal Service March 20 Comments
PRC Docket No. RM2017-3

24
“Include such additional margin” to invest in power system assets, amongst other activities
A wholesale rate structure is employed (including a base rate and a fuel rate) that is automatically determined monthly using a “fuel cost adjustment formula”, where the rate is adjusted to recover the cost TVA pays for fuel (recovered costs include realized gains / losses on derivatives purchased to hedge the costs of such commodities). Other public comparables are used to determine an appropriate debt-service coverage (DSC) ratio.
Bonneville Power Administration
The BPA is a self-financed federal agency, meaning it does not receive appropriations or tax dollars for operations and maintenance. It is governed by a number of authorizing statutes, including the Bonneville Power Act, the Federal Columbia River Transmission System Act and the Pacific Northwest Electric Power Planning and Conservation Act, and is regulated by an administrator that reports to the Secretary of Energy.
The BPA pays its expenses from revenues it receives from the sale of power and transmission services to eligible customers. While the BPA does not have an explicitly stated financial stability goal, it does balance “the goals of low rates, reliable operations, sustainable and affordable investment strategies and long-term financial health, and meeting its public purpose objectives and statutory obligations as a federal power marketer and open-access transmission provider”. 7
The “BPA establishes rates to be charged for power and transmission services in a rate proceeding, a formal evidentiary hearing process”.8 To ensure the BPA is able to meet its financial responsibilities to counterparties and to the U.S. Treasury, “the BPA relies on…a cost recovery adjustment clause, which enables BPA to increase certain power and transmission rates within a rate period…when a rate metric BPA uses to forecast financial reserves is below a specified threshold”.9
In terms of liquidity & funding, the BPA currently has total financial reserves of $1.2 billion. To ensure the BPA is able to meet its financial responsibilities to counterparties and to the U.S. Treasury, the BPA “relies on risk mitigation measures such as financial reserves, a line of credit with the U.S. Treasury, and a cost recovery adjustment clause that can raise rates, if needed”.
U.S. Airports with “Residual Cost Frameworks”
U.S. airports with “residual cost frameworks” have residual cost agreements with airlines that pay terminal and landing fees. These airports set rates and charges based on the net revenue an airport needs to cover expenses including debt service. If the airport cannot meet its costs, the rates paid by the airlines are raised to meet the shortfall. If the airport realizes a surplus, the airline rates are reduced. Generally, increases in non-airline revenues, such as parking and concession revenues, result in decreases in airline landing fees and terminal rental rates, and vice versa.
7 Page 32 of the 2016 BPA Annual Report 8 https://www.bpa.gov/Finance/RateCases/RateCaseBackground/Pages/default.aspx 9 Page 35 of the 2016 BPA Annual Report
Appendix B Postal Service March 20 Comments
PRC Docket No. RM2017-3

25
It is important to distinguish between airports with residual cost agreements and airports with compensatory cost agreements. Airports under the compensatory cost framework can realize a surplus (or profits) and use such surplus for a variety of purposes outside of the core business operations, including for purposes other than reducing the airlines’ rates. Because compensatory airports do not set their revenue targets to cover costs, we have excluded them from our analysis and have chosen to focus solely on airports with residual cost agreements.
The Federal Aviation Administration (“FAA”) is the national authority with powers to regulate all aspects of civil aviation, including airports. With regards to financial stability, the FAA states that “airport proprietors must maintain a fee and rental structure that in the circumstances of the airport makes the airport as financially self-sustaining as possible”.10 If market conditions or demand for air service do not permit the airport to be financially self-sustaining, the airport proprietor should establish long-term goals and targets to make the airport as financially self-sustaining as possible.
In its Policy Regarding Airport Rates and Charges11, the FAA states 3 rate-setting principles:
Rates must be “fair and reasonable” (the term “reasonable” is not specifically defined);
The airports must be financially self-sufficient; and
There should be no unjust discrimination between passengers
Additionally, fees imposed for the use of the airfield “may not exceed the costs (the ‘rate base’) to the airport proprietor of providing airfield services and airfield assets”. In determining the rate base, the “airport proprietor must employ a reasonable, consistent, and ‘transparent’ (i.e., clear and fully justified) method of establishing the rate base and adjusting the rate base on a timely and predictable schedule”.12
Airport rate setting accounts for expenses that include debt service, capital improvements, and cash reserves. Specifically, the FAA’s policy states that airport proprietors “may include in the rate base amounts needed to fund debt service and other reserves and to meet cash flow requirements as specified in financing agreements or covenants…including, but not limited to, reasonable amounts to meet debt-service coverage requirements; to fund cash reserves to protect against the risks of cash-flow fluctuations associated with normal airfield operations; and to fund reasonable cash reserves to protect against other contingencies”.
Of particular relevance to the USPS, it should be noted that pension obligations are generally added to the rate base because those payments are typically cash outlays.13
Evercore reviewed the financials for three U.S. Airports with “Residual Cost Frameworks”:
10 Page 18 of Chapter 18: Airport Rates and Charges https://www.faa.gov/airports/resources/publications/orders/compliance_5190_6/media/5190_6b_chap18.pdf 11 Page 55335, Policy Regarding Airport Rates and Charges, Federal Register, Vol. 78, No. 175, September 10, 2013 (https://www.gpo.gov/fdsys/pkg/FR-2013-09-10/pdf/2013-21905.pdf) 12 Page 55333, Policy Regarding Airport Rates and Charges, Federal Register, Vol. 78, No. 175, September 10, 2013 (https://www.gpo.gov/fdsys/pkg/FR-2013-09-10/pdf/2013-21905.pdf) 13 United States Airport Rates and Charges Regulations, DWU Consulting, March 2015 (https://dwuconsulting.com/images/Articles/150315%20US%20Airport%20Rates%20and%20Charges%20Regulations.pdf)
Appendix B Postal Service March 20 Comments
PRC Docket No. RM2017-3

26
San Francisco International Airport (SFO)
McCarran International Airport – Las Vegas (LAS)
Miami International Airport (MIA)
These three residual airports were selected because they provide a representative sample of large U.S. residual cost framework airports (of which there are many) and have detailed, publicly available financial statements.
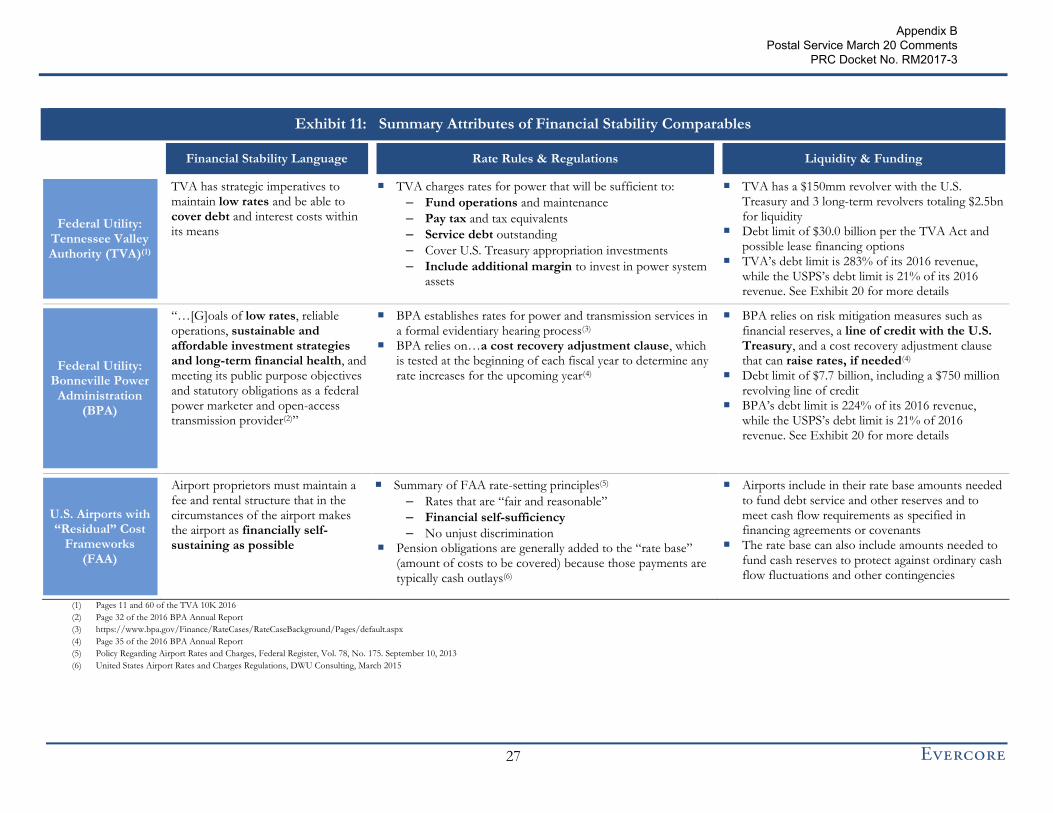
Exhibit 11 summarizes the financial stability language, rate-setting and liquidity and funding mechanisms of each subgroup.
Appendix B Postal Service March 20 Comments
PRC Docket No. RM2017-3
27
Summary Attributes of Financial Stability Comparables Exhibit 11:
Financial Stability Language Rate Rules & Regulations Liquidity & Funding
Federal Utility: Tennessee Valley Authority (TVA)(1)
TVA has strategic imperatives to maintain low rates and be able to cover debt and interest costs within its means
TVA charges rates for power that will be sufficient to:
– Fund operations and maintenance
– Pay tax and tax equivalents
– Service debt outstanding
– Cover U.S. Treasury appropriation investments
– Include additional margin to invest in power system assets
TVA has a $150mm revolver with the U.S. Treasury and 3 long-term revolvers totaling $2.5bn for liquidity
Debt limit of $30.0 billion per the TVA Act and possible lease financing options
TVA’s debt limit is 283% of its 2016 revenue, while the USPS’s debt limit is 21% of its 2016 revenue. See Exhibit 20 for more details
Federal Utility: Bonneville Power
Administration (BPA)
“…[G]oals of low rates, reliable operations, sustainable and affordable investment strategies and long-term financial health, and meeting its public purpose objectives and statutory obligations as a federal power marketer and open-access transmission provider(2)”
BPA establishes rates for power and transmission services in a formal evidentiary hearing process(3)
BPA relies on…a cost recovery adjustment clause, which is tested at the beginning of each fiscal year to determine any rate increases for the upcoming year(4)
BPA relies on risk mitigation measures such as financial reserves, a line of credit with the U.S. Treasury, and a cost recovery adjustment clause that can raise rates, if needed(4)
Debt limit of $7.7 billion, including a $750 million revolving line of credit
BPA’s debt limit is 224% of its 2016 revenue, while the USPS’s debt limit is 21% of 2016 revenue. See Exhibit 20 for more details
U.S. Airports with “Residual” Cost
Frameworks (FAA)
Airport proprietors must maintain a fee and rental structure that in the circumstances of the airport makes the airport as financially self-sustaining as possible
Summary of FAA rate-setting principles(5)
– Rates that are “fair and reasonable”
– Financial self-sufficiency
– No unjust discrimination Pension obligations are generally added to the “rate base”
(amount of costs to be covered) because those payments are typically cash outlays(6)
Airports include in their rate base amounts needed to fund debt service and other reserves and to meet cash flow requirements as specified in financing agreements or covenants
The rate base can also include amounts needed to fund cash reserves to protect against ordinary cash flow fluctuations and other contingencies
(1) Pages 11 and 60 of the TVA 10K 2016
(2) Page 32 of the 2016 BPA Annual Report
(3) https://www.bpa.gov/Finance/RateCases/RateCaseBackground/Pages/default.aspx
(4) Page 35 of the 2016 BPA Annual Report
(5) Policy Regarding Airport Rates and Charges, Federal Register, Vol. 78, No. 175. September 10, 2013
(6) United States Airport Rates and Charges Regulations, DWU Consulting, March 2015
Appendix B Postal Service March 20 Comments
PRC Docket No. RM2017-3

28
Upon review of the findings presented in Exhibit 11, Evercore found that the Financial Stability Comparables have regulatory mandates to generate sufficient revenue and cash flow to cover all of their current and future anticipated expenses, and further, that they have rate-setting mechanisms which are designed to ensure that they consistently meet this mandate. These characteristics of comparable entities guided Evercore in the development of its framework for defining financial stability and support some of the potential next steps outlined later in this report.
Step 3 – General Principles of Financial Stability
Based in part on our review of the Financial Stability Comparables, Evercore believes that “financial stability” should be defined as the ability of an organization to:
1) Cover its financial costs (debt service costs) and operational costs (all other costs) sustainably over a long period of time,
2) Service its on- and off-balance-sheet liabilities, and
3) Have sufficient access to liquidity (defined as cash and / or additional borrowing availability) to withstand cyclicality and unexpected temporary changes in business conditions.
Financial Stability Framework for the USPS
Taking into account the general principles outlined above and the unique attributes of the USPS, Evercore created a definition of financial stability that is specific to the USPS.
Definition of Financial Stability for USPS: The USPS’s revenues and retained earnings shall be sufficient to allow the Postal Service to fund the following cash needs:
Operating expenses
Statutorily mandated payments, including all post-retirement benefits (e.g., prefunding of the PSRHBF), to the extent not already included on the income statement
Principal and interest on funded debt, as well as other liabilities as they come due
A prudent level of capital investment (e.g., in real estate, machinery and equipment, etc.) required to maintain the efficiency of and preserve the long-term viability of the Postal Service
Financial stability also encompasses the Postal Service’s ability to support an appropriate balance sheet, including sufficient liquidity to protect against the risks of both normal and cyclical cash-flow fluctuations. Therefore, the USPS must have an ability to raise an appropriate level of debt and other long-term liabilities to fund any unexpected short-term losses and capital expenditure needs that cannot be funded with current year cash flow. Furthermore, the USPS must maintain an appropriate level of cash reserves and other sources of liquidity.
Appendix B Postal Service March 20 Comments
PRC Docket No. RM2017-3
29
V. QUANTITATIVE BENCHMARKING AND FINANCIAL PERFORMANCE GOALS
The primary financial goal of the USPS should be to achieve financial stability as defined in Step 3. However, Evercore also sought to identify a set of financial metrics that can be used to compare the performance of the USPS to that of the Benchmarking Comparables in the future, and to guide management and regulatory monitoring of financial stability moving forward. This process involves the selection of appropriate metrics, benchmarking the USPS against the Benchmarking Comparables for said metrics, and finally setting a recommended target range for the USPS.
Step 4 – Quantitative Benchmarking
The selection of appropriate financial metrics for benchmarking began with the identification of three broad categories of figures that we believe provide a holistic picture of financial stability. We refer to these three categories as the “Three Pillars of Financial Stability”.
Three Pillars of Financial Stability
Evercore categorized financial metrics into three “pillars”:
1) Profitability,
2) Liquidity, and
3) Leverage.
These three interdependent categories offer a comprehensive picture of financial stability, as defined earlier herein, for any organization. All three pillars should be considered independently and together for a holistic view of financial stability. Of note, Canada Post used the same three categories for financial target-setting in its “Five-Year Financial Framework” in 2013 – see Appendix page 53 for details.
On the following page, Exhibit 12 summarizes the financial stability objectives of an organization with respect to each pillar, and a set of metrics that can be utilized to assess financial health in each category. The metrics shown include some of those measured by the PRC in its annual reports regarding the USPS, but overall are substantially different; the metrics selected by Evercore are intended to offer a holistic view of an entity’s financial health and to be instructive for managerial decision-making.
Appendix B Postal Service March 20 Comments
PRC Docket No. RM2017-3

30
Three Pillars of Financial Stability Exhibit 12:
Financial Stability Objective Financial Metrics Assessed(1)
1. Profitability
To be financially stable, an organization must be able to sustainably cover its operational and financial costs
EBIT / Revenue
EBT / Revenue
(EBITDA – CapEx) / Revenue
(OCF – CapEx) / Revenue
2. Leverage
To be financially stable, an organization must be able to service its on- and off-balance-sheet liabilities
Total Debt / Total Assets
Total Liabilities / Total Assets
Total Liabilities / Total Assets, Adjusted to include Off-Balance-Sheet Items
Total Debt / Earnings before Interest, Tax, Depreciation and Amortization
3. Liquidity
To be financially stable, an organization must have sufficient access to liquidity (cash and / or borrowing availability) to withstand cyclicality and unexpected temporary changes in business conditions
Liquidity Days of Operating Expenses(2)
Theoretical Liquidity Days of Operating Expenses(2)
Current Assets / Current Liabilities
(1) Abbreviated terms are defined as follows:
‒ EBITDA = Earnings before interest, taxes, depreciation & amortization
‒ EBIT = Earnings before interest and taxes
‒ EBT = Earnings before taxes
‒ OCF = Operating cash flow (2) Operating Expenses defined as Revenue – EBITDA (as reflected on the income statement); Theoretical Days of Operating Expenses
defined as days for which a company could operate assuming no revenue, given current liquidity and ability to issue incremental debt, see “Liquidity Metric: Theoretical Liquidity Days” Section on page 36 for a more detailed description of calculation
Appendix B Postal Service March 20 Comments
PRC Docket No. RM2017-3

31
Historical Benchmarking Analysis
As a starting point for a comparative analysis, Evercore calculated all of the financial metrics in Exhibit 12 for the USPS and the Benchmarking Comparables as of the latest reported fiscal year end, and in some cases over a longer period of time to control for year-to-year fluctuations.
To effectively evaluate the recent financial results of the USPS in a benchmarking capacity, some context of special financial conditions is required. Recently, financial results of the USPS have benefitted from two noteworthy factors:
PSRHBF Payment: The PSRHBF payment has not been made since 2012 in order to maintain the solvency of the USPS. In 2016 the defaulted payment was $5.8 billion. Total defaults accrued from 2012 through 2016 are $33.9 billion. Were it not for these defaults, the USPS’s net debt position would be $33.9 billion higher today than it actually is.
Exigent Surcharge: Beginning in 2014, the PRC allowed the USPS to collect additional revenue by temporarily charging higher rates, known as the “exigent surcharge”. The exigent surcharge resulted in higher revenue and profitability than would have been attained with the maximum rates allowed under the PRC’s ordinary rate structure. The ability to collect additional revenues through this surcharge expired in April 2016. Were it not for this expired surcharge, the USPS’s historical profitability would have been lower than it actually was, and its net debt position today would be higher by the cumulative benefit of this surcharge recognized between 2014 and 2016.
The ability of an organization to avoid insolvency through measures such as these is unique to the USPS. Without these benefits the historical benchmarking results for the USPS would be less favorable than are displayed in Exhibit 13.
On the following page, Exhibit 13 shows the results of the historical benchmarking analysis.
Appendix B Postal Service March 20 Comments
PRC Docket No. RM2017-3

32
Financial Benchmarking Analysis Exhibit 13:
USPS Benchmarking(1)
Note, this disclaimer page should follow the title page in presentations.
Please fill out the [blanks] in the text.
USPS Global Postal Organizations Federal Utilities Large Residual Airports
As
Reported
Canada
Post(5)
Australia
Post
Royal Mail
Pre-IPO(6)
Royal Mail
Post-IPO(7) BPA TVA SFO LAS MIA
Profitability: 5-Year Average
EBIT / Revenue (11%) 3% 4% NA 5% 21% 21% 26% 27% 24%
EBT / Revenue (11%) 3% 3% NA 4% 6% 11% 2% (6%) (11%)
(EBITDA - CapEx) / Revenue (9%) 3% 2% NA 5% 15% 12% 20% 46% 40%
(Operating Cash Flow - CapEx) / Revenue 1% 4% 1% NA 4% (5%) 0% 1% 11% 1%
Leverage: Latest Fiscal Year
Total Debt / Total Assets 59% 15% 14% 26% 8% 63% 44% 81% 71% 79%
Total Debt / EBITDA (4.1x) 2.3x 1.7x 1.8x 0.7x 12.1x 4.7x 8.8x 11.7x 13.3x
Total Liabilities / Total Assets(2) 322% 115% 64% 70% 41% 86% 85% 100% 79% 88%
Adjusted Total Liabilities / Total Assets(3) 126% 104% 83% NA 63% NA 87% 100% 81% 89%
Cash Reserves & Liquidity: Latest Fiscal Year
Total Liquidity / Revenue 11% 30% 15% 14% 15% 32% 13% 152% 177% 137%
Liquidity Days of Opex 39.3 118.3 57.7 54.0 61.4 186.5 86.8 1,329.0 1,515.8 1,035.4
Theoretical Liquidity Days of Opex(4) 39.3 221.0 160.9 169.9 238.9 688.6 452.7 1,329.0 1,515.8 1,035.4
Current Assets / Current Liabilities 46% 185% 67% 76% 71% 97% 62% 93% 409% 189%
Capital Expenditures: Latest Fiscal Year
CapEx / Depreciation & Amortization 0.8x 1.1x 1.5x 1.6x 1.2x 1.7x 1.8x 1.4x 0.4x 0.4x
CapEx / Revenue 2% 4% 5% 4% 3% 24% 29% 35% 12% 11%
See page 66 for footnotes for this exhibit.
Appendix B Postal Service March 20 Comments
PRC Docket No. RM2017-3

33
Upon review of the broad range of results in Exhibit 13, Evercore drew two conclusions which directed the rest of the benchmarking exercise. Firstly, for the purposes of setting target metric ranges for the USPS, certain of the Benchmarking Comparables may be more appropriate than others to consider for each particular pillar. Secondly, within each of the three pillars, certain metrics will be more helpful than others to the USPS for benchmarking and managerial decision-making purposes.
Financial Stability Benchmarks: Appropriate Comparables
While certain entities are relevant comparables for defining financial stability (as described earlier), for a variety of reasons others are more appropriate for financial benchmarking purposes.
Generally speaking, the profitability and liquidity metrics of entities which have similar mandates to be financially stable should be correlated. This correlation should exist because, absent any unique circumstances (such as for airports, as described on the following page), (i) entities with rate-setting mechanisms designed to cover costs definitionally must be profitable, and (ii) entities which are permitted to generate sufficient reserves to withstand cyclicality and changes in business conditions should have ample liquidity. In light of this correlation, these companies should be considered for benchmarking purposes.
On the other hand, a suitable leverage level is idiosyncratic based on business and industry dynamics, cash flow profile, collateral quality, and numerous other factors, and may vary widely across entities with the same financial stability mandate. Therefore, suitable leverage benchmarks should be considered on a case-by-case basis, and not simply because an entity is classified in the Financial Stability Comparables. The leverage comparablility for the Benchmarking Comparables is considered on a case-by-case basis on the next page.
Exhibit 14 reviews the entities deemed as appropriate benchmarks for each financial metric category, and the rationale for including or excluding each.
Appendix B Postal Service March 20 Comments
PRC Docket No. RM2017-3

34
Appropriate Comparables for Financial Stability Benchmarks Exhibit 14:
Financial Stability Comparables
Referenced For Benchmarking
Rationale Profitability Leverage Liquidity
Federal Utilities
Meet all of the criteria for defining financial stability
Excluded from leverage benchmarking because suitable leverage levels are idiosyncratic
U.S. Airports with Residual
Cost Frameworks
(FAA)
Meet all of the criteria for defining financial stability
Excluded from all benchmarking metrics:
– Profitability: Annual depreciation is typically significantly higher than maintenance capex due to the large upfront investment to construct an airport
Causes long period of negative EBT margins despite positive cash flows, leading to misleading benchmarks
This depreciation and capex dynamic is different from that which would be observable for a financially healthy USPS that is deploying adequate capex
– Leverage: Idiosyncratic risk profile, as described earlier
– Liquidity: Municipal bond funding that residual airports employ requires vast amounts of cash to be held in various restricted funds, thereby overstating liquidity for an entity that is capitalized differently
Global Postal Organizations
(GPOs)
Excluded from Financial Stability Comparables because they do not meet two of the criteria for defining financial stability: they have shareholders for whom a return may be provided, and they are not U.S. entities
GPOs are included as references for benchmarking as they are operationally similar to the USPS and have similar capex and liquidity requirements
Appendix B Postal Service March 20 Comments
PRC Docket No. RM2017-3

35
Financial Stability Benchmarks: Appropriate Metrics
After assessing which of the comparable groups are most appropriate for benchmarking each of the three financial stability pillars, Evercore analyzed which of the metrics within each pillar are the most appropriate for setting targets to achieve financial stability.
Profitability Metric: EBT Margin
Evercore considered a number of profitability metrics including: (i) EBT margin, (ii) EBIT margin, (iii) (EBITDA – Capex) / Revenue, and (iv) (OCF – Capex) / Revenue. Evercore believes that EBT margin (i.e., pre-tax income) is the most appropriate and comparable profitability metric to measure financial stability.
As an accrual-based accounting metric, EBT margin smooths out differences in the timing of cash flows from year to year, which is appropriate for a framework that seeks to improve cash flows over a long period of time. For this same reason, Evercore considers (EBITDA – Capex) / Revenue and (OCF – Capex) / Revenue as not comparable for profitability purposes: these cash-flow-based metrics can vary significantly from year to year due to cash flow fluctuations, which is not ideal for long-term target setting.
EBT margin also allows for the comparison of financial stability among entities with different capital structures and different tax rates. For example, a company with more leverage will require a higher EBIT or EBITDA margin to cover its costs than will a less levered company. For this reason, Evercore considered EBIT margin as not ideal for a comparison of profitability to the Benchmarking Comparables.
It should be noted that the USPS’s financial statements include certain non-cash items which may impact EBT in any given year. For example, significant income or expenses have arisen from the revaluation of the USPS’s workers compensation liability due to exogenous factors such as interest rate fluctuations. Because of the unpredictability and volatility of these factors, the impact of any significant non-cash items and other one-time expenses should be carefully considered when evaluating whether USPS has reached its EBT target in a given year.
Leverage Metrics: Adjusted Total Liabilities / Adjusted Total Assets and Debt / EBITDA
Evercore considered the following leverage metrics: (i) Total Debt / Total Assets, (ii) Total Debt / EBITDA, (iii) Total Liabilities / Total Assets, and (iv) Adjusted Total Liabilities / Adjusted Total Assets.
Appendix B Postal Service March 20 Comments
PRC Docket No. RM2017-3

36
Evercore believes that Adjusted Total Liabilities / Adjusted Total Assets (adjusted to include off-balance-sheet assets and liabilities) and Debt / EBITDA are the most appropriate leverage metrics to measure financial stability. Adjusted Total Liabilities / Adjusted Total Assets is an appropriate metric because it is important to consider off-balance-sheet assets and obligations, which have economic value just like their on-balance-sheet counterparts. Adjusted liabilities and assets include pension obligations and pension fund assets, other postretirement benefit obligations (OPEBs), capitalized operating leases and other assets and liabilities.14 These assets and liabilities are very significant for the USPS: as of 9/30/16, off-balance-sheet assets outnumbered on-balance-sheet assets by a factor of 14x, while off-balance-sheet liabilities exceeded on-balance-sheet liabilities by a factor of 5x. Because these assets and liabilities are not included in metrics like Total Debt / Total Assets and Total Liabilities / Total Assets, these ratios were deemed to have less utility for the benchmarking analysis.
In addition to Adjusted Total Liabilities / Adjusted Total Assets, Evercore included Debt / EBITDA as an additional leverage metric to consider for financial stability purposes. This metric is included because Debt / EBITDA provides an indication of how a creditor may analyze an entity’s ability to pay its obligations as they come due. Additionally, this metric provides a better short-term indication of how leverage is changing from year to year than does Adjusted Total Liabilities / Adjusted Total Assets, because it is possible to drastically improve Debt / EBITDA in a very short period of time (e.g., through a potential rate increase) by growing the EBITDA denominator. In contrast, the numerator and denominator in Adjusted Total Liabilities / Adjusted Total Assets are the cumulative product of years of activity, and change more gradually than Debt / EBITDA.
Liquidity Metric: Theoretical Liquidity Days15
Evercore considered the following leverage metrics: (i) Liquidity Days of Operating Expenses, (ii) Theoretical Liquidity Days of Operating Expenses, and (iii) Current Assets / Current Liabilities.
Evercore believes that Theoretical Liquidity Days of Operating Expenses is the most appropriate metric for assessing financial stability because it indicates how long the USPS would be able to operate in a severe cyclical downturn. Liquidity Days of Operating Expenses is less relevant because it fails to take into account additional potential sources of liquidity considered in the theoretical liquidity metric. Current Assets / Current Liabilities is not used because it considers only assets and liabilities that are convertible to cash and due, respectively, in the next 12 months, and does not provide an indication of the length of time an entity could survive in a future downturn.
The Days of Operating Expenses metrics are defined as follows.
Liquidity Days of Operating Expenses: This metric defines operating expenses as revenue minus EBITDA (as reflected on the income statement), and defines Liquidity as the sum of the balances of Cash, Restricted Cash, and available undrawn lines of credit. It measures the number of days for which an entity could cover its operating expenses with currently available resources.
14 See Exhibit 33 on page 68 for more details 15 Evercore’s recommendations do not conflict with USPS Management’s response to OIG Audit Report FT-AR-17-001, as discussed in Appendix Section, Exhibit 26
Appendix B Postal Service March 20 Comments
PRC Docket No. RM2017-3
37
Theoretical Liquidity Days of Operating Expenses: Theoretical Days of Operating Expenses is defined as the number of days for which a company could cover its operating expenses, given its current Liquidity (as defined above) and its ability to raise incremental debt without exceeding its statutory debt capacity, if applicable, or without being downgraded to a Moody’s credit rating of Caa1 or lower.
Like Liquidity Days of Operating Expenses, operating expenses continue to be defined as revenue minus EBITDA (as reflected on the income statement). However, liquidity is adjusted for Global Postal Organizations and Federal Utilities to reflect the potential incremental debt that could be raised from the capital markets or the U.S. Government, pursuant to the limitations in the previous paragraph.
To adjust liquidity for Global Postal Organizations, potential incremental debt was calculated as (7*EBITDA – Current Total Debt), where 7x is the EBITDA multiple threshold at which Moody’s considers a global postal organization to have a credit rating of Caa1.16
To adjust liquidity for Federal Utilities, Evercore reviewed filings for statutory incremental borrowing limits from the U.S. government. The TVA has total borrowing capacity of $30 billion, with $5.9 billion currently undrawn. The BPA has total borrowing capacity of $7.7 billion, with $2.9 billion currently undrawn. Evercore did not make this adjustment for airports with “residual cost frameworks” as they were not considered appropriate benchmarks for this metric (see Exhibit 14). For the USPS in particular, Theoretical Liquidity Days of Operating Expenses is effectively the same as Liquidity Days of Operating Expenses because the USPS had reached its $15 billion debt cap as of 9/30/2016. However, for other entities with remaining borrowing capacity, there is a pronounced difference between liquidity and theoretical liquidity.
Benchmarking Revisited: Relevant Comparables and Metrics
Following the determination of the most appropriate benchmarking metrics and the Benchmarking Comparables, the original benchmarking analysis was revisited to determine an appropriate benchmark range for each metric. Exhibit 15 on the following page depicts the same figures as Exhibit 13, but with red boxes and grey shading to highlight the most relevant metrics.
16 Moody’s 2011 Global Postal and Express Delivery Methodology
Appendix B Postal Service March 20 Comments
PRC Docket No. RM2017-3
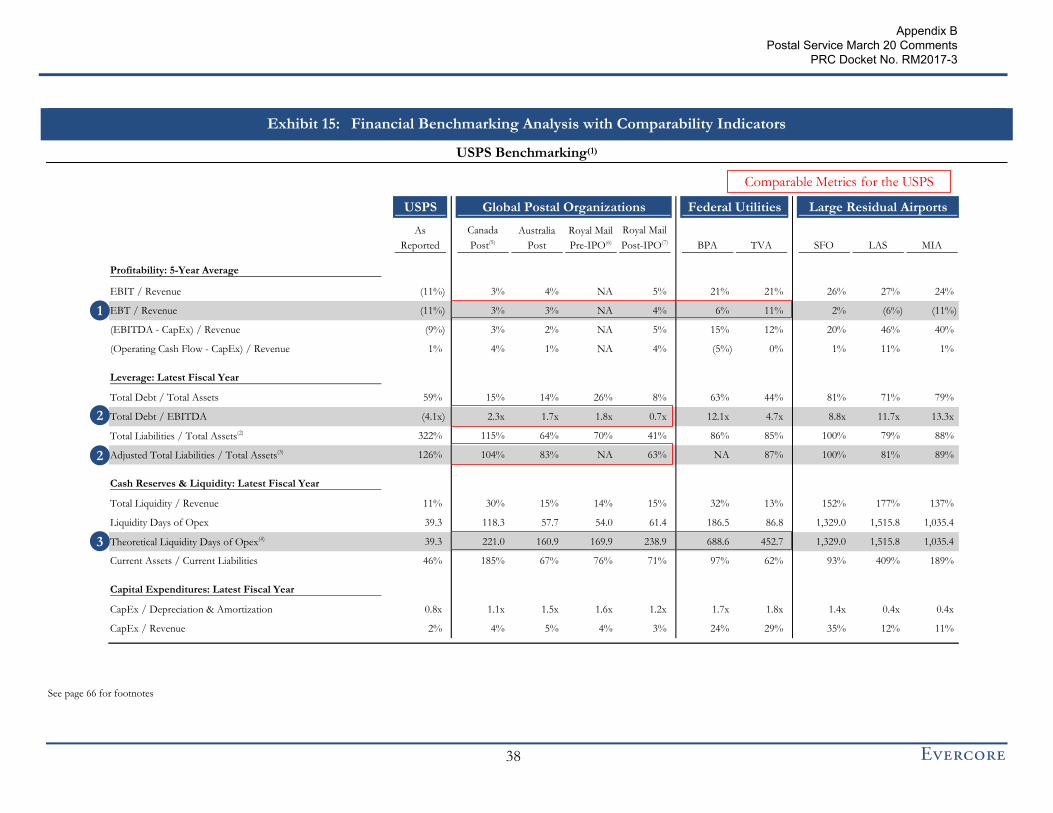
38
Financial Benchmarking Analysis with Comparability Indicators Exhibit 15:
USPS Benchmarking(1)
Note, this disclaimer page should follow the title page in presentations.
Please fill out the [blanks] in the text.
USPS Global Postal Organizations Federal Utilities Large Residual Airports
As
Reported
Canada
Post(5)
Australia
Post
Royal Mail
Pre-IPO(6)
Royal Mail
Post-IPO(7) BPA TVA SFO LAS MIA
Profitability: 5-Year Average
EBIT / Revenue (11%) 3% 4% NA 5% 21% 21% 26% 27% 24%
EBT / Revenue (11%) 3% 3% NA 4% 6% 11% 2% (6%) (11%)
(EBITDA - CapEx) / Revenue (9%) 3% 2% NA 5% 15% 12% 20% 46% 40%
(Operating Cash Flow - CapEx) / Revenue 1% 4% 1% NA 4% (5%) 0% 1% 11% 1%
Leverage: Latest Fiscal Year
Total Debt / Total Assets 59% 15% 14% 26% 8% 63% 44% 81% 71% 79%
Total Debt / EBITDA (4.1x) 2.3x 1.7x 1.8x 0.7x 12.1x 4.7x 8.8x 11.7x 13.3x
Total Liabilities / Total Assets(2) 322% 115% 64% 70% 41% 86% 85% 100% 79% 88%
Adjusted Total Liabilities / Total Assets(3) 126% 104% 83% NA 63% NA 87% 100% 81% 89%
Cash Reserves & Liquidity: Latest Fiscal Year
Total Liquidity / Revenue 11% 30% 15% 14% 15% 32% 13% 152% 177% 137%
Liquidity Days of Opex 39.3 118.3 57.7 54.0 61.4 186.5 86.8 1,329.0 1,515.8 1,035.4
Theoretical Liquidity Days of Opex(4) 39.3 221.0 160.9 169.9 238.9 688.6 452.7 1,329.0 1,515.8 1,035.4
Current Assets / Current Liabilities 46% 185% 67% 76% 71% 97% 62% 93% 409% 189%
Capital Expenditures: Latest Fiscal Year
CapEx / Depreciation & Amortization 0.8x 1.1x 1.5x 1.6x 1.2x 1.7x 1.8x 1.4x 0.4x 0.4x
CapEx / Revenue 2% 4% 5% 4% 3% 24% 29% 35% 12% 11%
2
3
2
1
Comparable Metrics for the USPS
See page 66 for footnotes
Appendix B Postal Service March 20 Comments
PRC Docket No. RM2017-3

39
Step 5 – Setting Financial Performance Goals
Based on the outcome of the quantitative benchmarking in Step 4, Evercore designed a framework with specific targets for measuring the financial health of the USPS in the future. The proposed financial stability targets are summarized in Exhibit 16.
Proposed USPS Financial Stability Targets Exhibit 16:
Explanations for how these targets were set are detailed throughout the rest of this section.
To validate these targets, Evercore adjusted the historical financial statements of the USPS to evaluate what the impact would have been on all financial stability metrics if the 6% EBT margin target had been achieved, which is discussed throughout this section.
Profitability Target: 6% EBT Margin
Evercore determined that the EBT Margin target for a financially stable USPS should be 6%. With an EBT margin of 6%, the USPS should be able to cover its operating expenses each year, and should build liquidity and reduce leverage over time. Definitionally EBT margin must be above 0% to generate sufficient cash to cover operating expenses. The 6% target is in the lower half of the range of Federal Utilities and Global Postal Organizations (3-11%), and slightly above the median (4%) and mean (5%). Evercore selected a margin slightly above the median and mean because the USPS has significantly worse leverage metrics than any of the comparable entities. More specifically, Adjusted Total Liabilities / Adjusted Total Assets currently is 126%, which represents a $96bn asset shortfall as of 2016. The next worst comparable entity is Canada Post at 104% Adjusted Total Liabilities / Adjusted Total Assets. Additionally, the BPA and TVA have financial stability mandates similar to the USPS and have EBT margins of 6% and 11% respectively. Therefore, to realistically reduce the USPS’s $96bn asset shortfall over time and eventually achieve financial stability Evercore believes a margin above the mean and median is appropriate.
Illustrative Exercise: Impact of One Year of 6% EBT Margin
As a check, the USPS’s historical financial statements were adjusted to illustrate how achieving a theoretical 6% EBT margin for one year would change the USPS’s metrics versus those of the Benchmarking Comparables. Evercore solved only for historical changes in EBT margin because unlike leverage and liquidity, which incorporate cumulative results over time, EBT margin could theoretically be achieved immediately with regulatory change. Therefore, improved profitability necessarily has the impact of improving both leverage and liquidity, whereas the opposite relationship is not true.
Category Metric 2016 Actual
Proposed
Target
Benchmarking
Comps Range
Benchmarking
Comps Mean
Benchmarking
Comps Median
Profitability EBT Margin (8%) 6% 3% - 11% 5% 4%
Leverage Total Debt / EBITDA (4.1x) 1.0x - 2.5x 0.7x - 2.3x 1.6x 1.7x
Leverage Adjusted Total Liabilities / Total Assets 126% 85% 63% - 104% 83% 83%
Liquidity Theoretical Liquidity Days of Opex 39 240 161 - 689 352 239
Appendix B Postal Service March 20 Comments
PRC Docket No. RM2017-3

40
To calculate the metrics denoted as “USPS Financial Stability Metric Implied by 6% EBT Margin” in Exhibit 18, Evercore adjusted the USPS’s 2016 income statement to achieve a theoretical 6% EBT margin, then recalculated all profitability, leverage and liquidity metrics to reflect the USPS having achieved a 6% EBT Margin in 2016 (but not in prior years).
Evercore assumed the 6% target EBT margin was reached using two approaches: (i) increasing revenue while holding expenses constant, and (ii) decreasing expenses while holding revenue constant.17 All other variables were held constant in both approaches (e.g., interest expense, debt, D&A, capex). The average of the output of the two approaches was used as the implied values for calculating the metrics for the values labeled “Implied by 6% EBT Margin” in Exhibit 18. It was assumed that 100% of the revenue increase or expense reduction flowed through to operating cash flow at a 100% cash flow conversion rate. Please see Cash Flow and Profitability Normalization Adjustments on page 60 for additional notes pertaining to this analysis.
Note that for the purposes of restating leverage and liquidity metrics to reflect a 6% EBT margin, Evercore assumed that 100% of incremental profits would have been used to pay down debt, with the revolver paid down first.
Profitability Financial Targeting Chart Legend
The following chart legend in Exhibit 17 summarizes the chart symbols that are used on the following pages for profitability, leverage, and liquidity targeting. The purpose of these charts is to show three concepts graphically: (i) the ranges of metrics for groups of comparable entities; (ii) how the USPS compares to these ranges on a relative basis; and (iii) how the USPS would compare to the comparable entities with one year of 6% EBT margin performance.
Chart Annotation Legend Exhibit 17:
17 The differences in target metrics generated by assuming 100% revenue increase or 100% expense reduction were de minimis for the purposes of target setting; however the midpoints of the resulting metrics were used to generate new profitability targets. It was assumed that 100% of the revenue increase or expense reduction flowed through to operating cash flow at a 100% cash flow conversion rate
Appendix B Postal Service March 20 Comments
PRC Docket No. RM2017-3

41
Profitability Metrics Analysis18 Exhibit 18:
Note: (EBITDA – Capex) / Revenue and (OCF – Capex) / Revenue are relatively high for USPS in the 6% EBT Margin case. A primary driver of these higher margins is the USPS’s relative underinvestment in capital expenditures over the past five years versus these comparables Source: Company filings with Evercore adjustments 18 For Airports, cash flow metrics for years impacted by capex related to major capital improvements (e.g., construction of a new terminal) are excluded as they are directly funded with revenue bonds
Metric Comparative Benchmarking & USPS Target Range
EBT Margin
(5 Year Average)
EBIT Margin
(5 Year Average)
(EBITDA - CapEx) /
Revenue
(5 Year Average)
(OCF - CapEx) /
Revenue
(5 Year Average)
USPS Actual (11%) 6%
3% 5%
21% 21%
24% 27%
(20%) (10%) 0% 10% 20% 30% 40% 50%
3% 4%
6% 11%
(11%) 2%
USPS Actual (11%) 6%
(20%) (10%) 0% 10% 20% 30% 40% 50%
USPS Actual (9%) 7%
2% 5%
12% 15%
20% 46%
(20%) (10%) 0% 10% 20% 30% 40% 50%
USPS Actual 1% 15%
1% 4%
(5%) 0%
1% 11%
(20%) (10%) 0% 10% 20% 30% 40% 50%
USPS
SFO LAS MIA BPA TVA Royal Mail Australia Post Canada Post
Residual Airports (Top)Federal Utilities
(Middle) Global Postal Organizations (Bottom)Implied by 6% EBT Margin
ActualTarget
Appendix B Postal Service March 20 Comments
PRC Docket No. RM2017-3

42
Leverage Target #1: Adjusted Total Liabilities / Adjusted Total Assets: 85%
Evercore determined that the Adjusted Total Liabilities / Adjusted Total Assets target should be 85%. The relevant comparables for Leverage targeting, including adjusted total liabilities / adjusted total assets include the Global Postal Organizations, which have a range of 63% – 104%, with a median of 83%. Evercore selected a rounded median of the comparables for the Adjusted Total Liabilities / Adjusted Total Assets target of 85%.
Leverage Target #2: Debt / EBITDA: 1.0 – 2.5x
Evercore determined that the Debt / EBITDA Target range should be 1.0x – 2.5x. The 1.0x – 2.5x target range was derived using a rounded target range of the Global Postal Organizations, which was 0.7x – 2.3x. As a reference point, a Debt / EBITDA multiple of 1.6x (which falls within the proposed range) would be implied based on achieving a 6% EBT margin, as detailed in the illustrative exercise on page 43 using FY 2016 debt levels.
Appendix B Postal Service March 20 Comments
PRC Docket No. RM2017-3
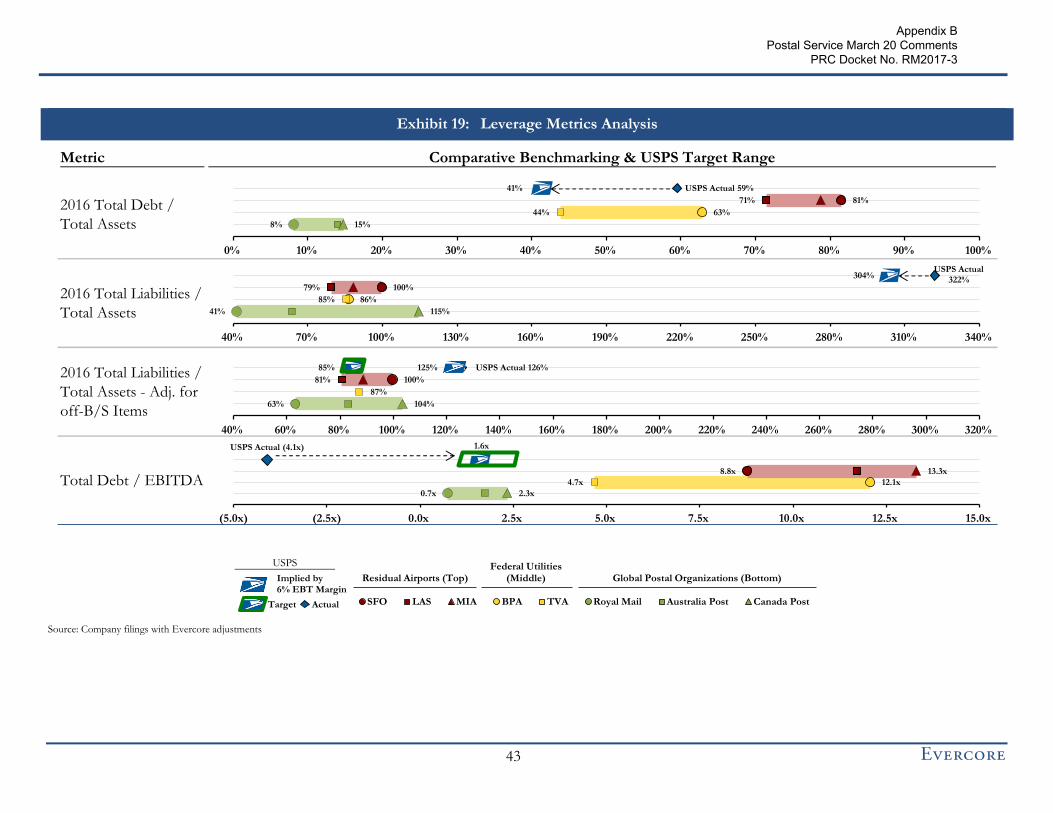
43
Leverage Metrics Analysis Exhibit 19:
Source: Company filings with Evercore adjustments
Metric Comparative Benchmarking & USPS Target Range
2016 Total Debt /
Total Assets
2016 Total Liabilities /
Total Assets
2016 Total Liabilities /
Total Assets - Adj. for
off-B/S Items
Total Debt / EBITDA
(20%) (10%) 0% 10% 20% 30% 40% 50%
USPS Actual 59% 41%
8% 15%
44% 63%
71% 81%
0% 10% 20% 30% 40% 50% 60% 70% 80% 90% 100%
USPS Actual (4.1x) 1.6x
0.7x 2.3x
4.7x 12.1x
8.8x 13.3x
(5.0x) (2.5x) 0.0x 2.5x 5.0x 7.5x 10.0x 12.5x 15.0x
USPS Actual322%
304%
41% 115%
85% 86%
79% 100%
40% 70% 100% 130% 160% 190% 220% 250% 280% 310% 340%
63% 104%
87%
USPS Actual 126% 125% 85%
81% 100%
40% 60% 80% 100% 120% 140% 160% 180% 200% 220% 240% 260% 280% 300% 320%
USPS
SFO LAS MIA BPA TVA Royal Mail Australia Post Canada Post
Residual Airports (Top)Federal Utilities
(Middle) Global Postal Organizations (Bottom)Implied by 6% EBT Margin
ActualTarget
Appendix B Postal Service March 20 Comments
PRC Docket No. RM2017-3

44
Liquidity Target: 240 Theoretical Liquidity Days of Opex
Evercore believes that 240 Theoretical Days of Opex is the appropriate target for the USPS. 240 Theoretical Days of Opex is the rounded number of the median (239 days) of the relevant Benchmarking Comparables, which includes the Federal Utilities and Global Postal Organizations. The USPS needs at least the same amount (if not more) of liquidity as organizations that have rate-setting mechanisms which allow for frequent rate adjustments.
For additional context on liquidity balances, Evercore compared liquidity of the USPS with that of the BPA and the TVA. Bonneville Power Association and the Tennessee Valley Authority have the highest and second highest Theoretical Liquidity Days of Opex amongst the comparable entities at 689 days and 453 days, respectively. These figures are largely driven by the $2.9 billion in additional borrowing capacity the BPA has with the U.S. Treasury and the $5.9 billion in stated additional debt capacity the TVA has. See Exhibit 20 for additional detail.
Liquidity Comparison: USPS vs. BPA & TVA Exhibit 20:
The BPA and TVA have more liquidity than the USPS due to borrowing capacity
Source: Company filings with Evercore adjustments (1) For calculation details please see Liquidity Metric: Theoretical Liquidity Days Section on page 36
Exhibit 20 indicates that Theoretical Liquidity and the debt limit for the USPS are low on a relative basis (i.e., percentage of sales) versus the BPA and the TVA, entities 5% and 15% of its size by revenue, respectively. This comparison reinforces that 240 days is both reasonable and justifiable as a liquidity target for the USPS.
240 theoretical days of operating expenses on hand implies ~$47.4bn19 of cash and theoretical liquidity for the USPS. Although this figure may seem high, especially when compared with the USPS’s current debt and cash balances, it should be noted that this figure would include undrawn but accessible debt from the U.S. government, and that the USPS’s cash balance would grow substantially over time with positive profitability.
19 Calculated using unadjusted operating expense numbers with operating expense defined as Gross Revenue – EBITDA (as reflected on the income statement)
Statutory Debt
Limit
Current
Debt Balance
Remaining Debt
Capacity
Total Thoeretical
Liquidity(1)
2016
Revenue
Statutory Debt Limit /
Gross Revenue
Theoretical Liquidity /
Gross Revenue
USPS $15,000 $15,000 $ - $8,077 $71,498 21% 11%
BPA 7,700 4,760 2,940 4,032 3,433 224% 117%
TVA 30,000 24,100 5,900 7,300 10,616 283% 69%
BPA vs. USPS on a Relative Basis 10.7x 10.4x
TVA vs. USPS on a Relative Basis 13.5x 6.1x
Appendix B Postal Service March 20 Comments
PRC Docket No. RM2017-3

45
Residual Airport Liquidity Calculation and Rationale for Exclusion
Theoretical Liquidity Days of Opex for Residual Airports ranged from 1,035 days to 1,516 days. Liquidity includes restricted cash because it includes funds that are not classified as restricted for other entities. For example, restricted cash for airports can include funds restricted for capital projects, debt service, debt service reserves, subordinated debt coverage reserves, working capital reserves, contingency fund reserves, and capital funds. Because airports frequently borrow using municipal bonds that require relatively large sums of cash to be held in restricted funds, airports’ liquidity metrics are higher than comparable entities without municipal bonds outstanding. Therefore, airports are not an appropriate comparable group to the USPS for the purpose of measuring liquidity.
Appendix B Postal Service March 20 Comments
PRC Docket No. RM2017-3

46
Liquidity Metrics Analysis Exhibit 21:
Source: Company filings with Evercore adjustments (1) Opex defined as revenue – EBITDA (as reflected on the income statement) (2) Theoretical Days of Operating Expenses defined as days for which a company could operate assuming no revenue, given current liquidity and ability to issue incremental debt. See footnote 4 under the Benchmarking
Snapshot Section on page 66 in Appendix for calculation details (3) For USPS, current liabilities exclude RHB prefunding defaults
Metric Comparative Benchmarking & USPS Target Range
2016 Liquidity Days of
Opex(1)
Theoretical Liquidity
Days of Opex(2)
Current Assets /
Current Liabilities(3)
(5.0x) (2.5x) 0.0x 2.5x 5.0x 7.5x 10.0x 12.5x 15.0x
USPS Actual39x 63x
58x 118x
87x 186x
1035x
1516x
0 200 400 600 800 1,000 1,200 1,400 1,600
USPS Actual39x
66x
240x
161x 239x
453x 689x
1035x
1516x
0 200 400 600 800 1,000 1,200 1,400 1,600
USPS Actual 0x 1x
1x 2x
1x 1x
1x 4x
0% 50% 100% 150% 200% 250% 300% 350% 400% 450%
USPS
SFO LAS MIA BPA TVA Royal Mail Australia Post Canada Post
Residual Airports (Top)Federal Utilities
(Middle) Global Postal Organizations (Bottom)Implied by 6% EBT Margin
ActualTarget
Appendix B Postal Service March 20 Comments
PRC Docket No. RM2017-3

47
Targeting Conclusion
The targets outlined in this section should be used as a guide to help the USPS move towards financial stability. However, it should be noted that the achievement of any or all of the financial targets is not necessarily determinative of being financial stable, as the determinative test of financial stability is being able to cover one’s costs over a long period of time. That said, the achievement of these targets does by its very nature indicate a correlation with the financial performance of other financially stable entities.
Appendix B Postal Service March 20 Comments
PRC Docket No. RM2017-3

48
VI. CONCLUSION
Stabilizing the Postal Service’s financial condition will likely require a comprehensive approach. The USPS expects negative trends impacting the business to persist, including continued migration of First-Class Mail and increased competition in Standard Mail and Shipping and Package Services. Absent action, the USPS is likely to see continuing and worsening net losses. As detailed in Section II, The Postal Service is Not Financially Stable, the USPS has 10 consecutive years of losses, five consecutive years of defaults on its retiree health benefit prefunding obligations, an underfunded balance sheet, debt levels that are at the statutory maximum level of $15 billion, and a cash balance that is insufficient to weather cyclicality or changes in business conditions. It is clear that the USPS is not currently financially stable under any reasonable definition for financial stability.
Evercore’s approach to financial stability encompasses both a qualitative definition and quantitative targets for measuring future performance. While quantitative benchmarking can be used to measure the Postal Service’s financial health in the future, the true test of financial stability is compliance with the qualitative definition: covering one’s costs sustainability over a long period of time with internally generated funds. If the Postal Service is meeting its performance targets but not meeting the qualitative definition, then the performance targets should be reassessed from time to time.
The qualitative definition was formed by evaluating entities that have similar mandates to be financially stable and meet certain other criteria, but are not necessarily operationally similar to the Postal Service. Generally speaking, Evercore determined that financial stability should be defined as the ability of an organization to:
1) Cover its financial costs (debt service costs) and operational costs (all other costs) sustainably over a long period of time,
2) Service its on- and off-balance-sheet liabilities, and
3) Have sufficient access to liquidity (defined as cash and / or additional borrowing availability) to withstand cyclicality and unexpected temporary changes in business conditions.
Taking into account these general principles and the unique attributes of the USPS, Evercore created a USPS-specific definition of financial stability:
The USPS’s revenues and retained earnings shall be sufficient to allow the Postal Service to fund the following cash needs:
Operating expenses
Statutorily mandated payments, including all post-retirement benefits (e.g., prefunding of PSRHBF), to the extent not already included on the income statement
Principal and interest on funded debt, as well as other liabilities as they come due
Appendix B Postal Service March 20 Comments
PRC Docket No. RM2017-3
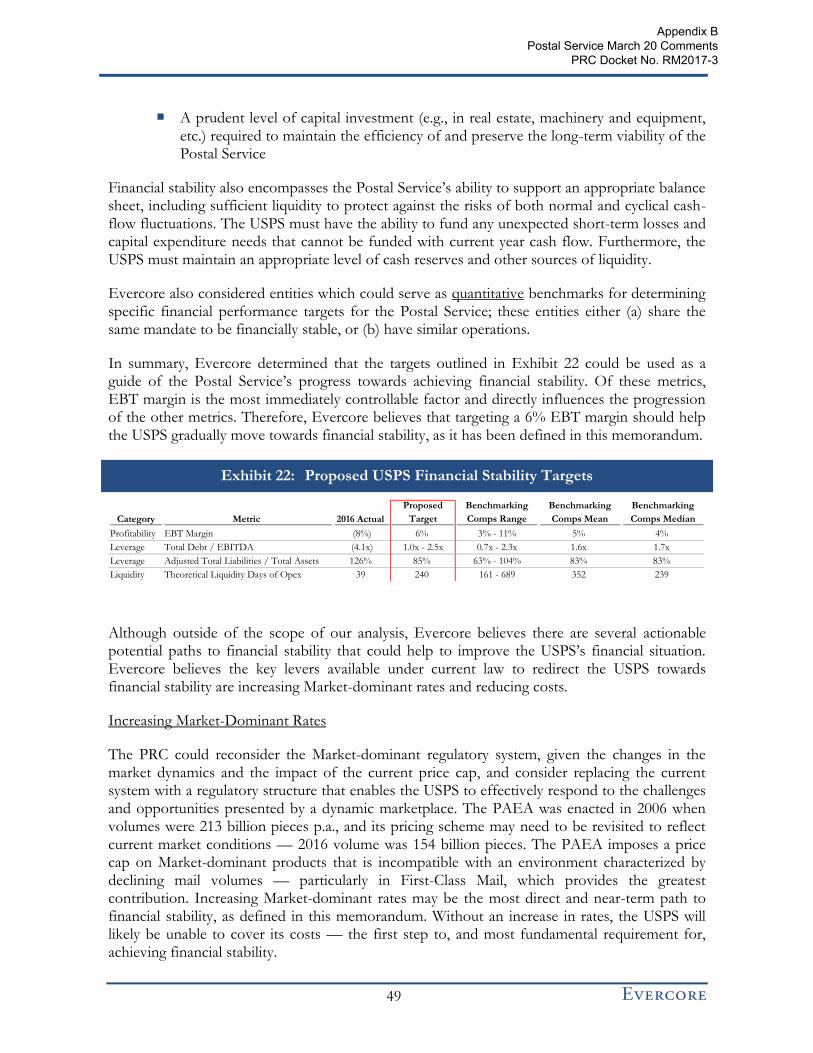
49
A prudent level of capital investment (e.g., in real estate, machinery and equipment, etc.) required to maintain the efficiency of and preserve the long-term viability of the Postal Service
Financial stability also encompasses the Postal Service’s ability to support an appropriate balance sheet, including sufficient liquidity to protect against the risks of both normal and cyclical cash-flow fluctuations. The USPS must have the ability to fund any unexpected short-term losses and capital expenditure needs that cannot be funded with current year cash flow. Furthermore, the USPS must maintain an appropriate level of cash reserves and other sources of liquidity.
Evercore also considered entities which could serve as quantitative benchmarks for determining specific financial performance targets for the Postal Service; these entities either (a) share the same mandate to be financially stable, or (b) have similar operations.
In summary, Evercore determined that the targets outlined in Exhibit 22 could be used as a guide of the Postal Service’s progress towards achieving financial stability. Of these metrics, EBT margin is the most immediately controllable factor and directly influences the progression of the other metrics. Therefore, Evercore believes that targeting a 6% EBT margin should help the USPS gradually move towards financial stability, as it has been defined in this memorandum.
Proposed USPS Financial Stability Targets Exhibit 22:
Although outside of the scope of our analysis, Evercore believes there are several actionable potential paths to financial stability that could help to improve the USPS’s financial situation. Evercore believes the key levers available under current law to redirect the USPS towards financial stability are increasing Market-dominant rates and reducing costs.
Increasing Market-Dominant Rates
The PRC could reconsider the Market-dominant regulatory system, given the changes in the market dynamics and the impact of the current price cap, and consider replacing the current system with a regulatory structure that enables the USPS to effectively respond to the challenges and opportunities presented by a dynamic marketplace. The PAEA was enacted in 2006 when volumes were 213 billion pieces p.a., and its pricing scheme may need to be revisited to reflect current market conditions — 2016 volume was 154 billion pieces. The PAEA imposes a price cap on Market-dominant products that is incompatible with an environment characterized by declining mail volumes — particularly in First-Class Mail, which provides the greatest contribution. Increasing Market-dominant rates may be the most direct and near-term path to financial stability, as defined in this memorandum. Without an increase in rates, the USPS will likely be unable to cover its costs — the first step to, and most fundamental requirement for, achieving financial stability.
Category Metric 2016 Actual
Proposed
Target
Benchmarking
Comps Range
Benchmarking
Comps Mean
Benchmarking
Comps Median
Profitability EBT Margin (8%) 6% 3% - 11% 5% 4%
Leverage Total Debt / EBITDA (4.1x) 1.0x - 2.5x 0.7x - 2.3x 1.6x 1.7x
Leverage Adjusted Total Liabilities / Total Assets 126% 85% 63% - 104% 83% 83%
Liquidity Theoretical Liquidity Days of Opex 39 240 161 - 689 352 239
Appendix B Postal Service March 20 Comments
PRC Docket No. RM2017-3

50
Cost Rationalization
The USPS must continue to effectively rationalize its cost base. In response to the market changes, the Postal Service has rationalized its business. As a result of these operational changes, the Postal Service has grown Total Factor Productivity by 7% since 2006, despite declining mail volumes and has achieved savings by making fiscally responsible decisions and managing operational costs within its control. Although these actions have allowed the USPS to reduce its annual cost base by almost $14 billion, the operational changes have not been enough to restore the USPS to financial health. The USPS should continue to focus on cost rationalization, in combination with the other pathways to financial stability.
A large contributor to the USPS’s costs are non-controllable costs, such as the pre-funding of retiree health benefits, which would require legislative change. Changes to these costs could help guide the USPS toward financial stability.
Additional Paths to Financial Stability
Finally, additional paths to financial stability exist that are currently unavailable to the USPS due to legal constraints. For example, theoretically, financial stability could be addressed through legislation that changes the USPS’s current borrowing limit. Because the USPS is currently constrained by its $15 billion debt cap, it must maintain sufficient liquidity on its balance sheet to fund any unexpected changes in business conditions. With additional sources of liquidity, the USPS could potentially pay down debt, and hence reduce interest expense, because it would no longer need to keep as much excess cash reserves on its balance sheet in case of unexpected changes in business conditions.
Looking Forward
The enactment of all or some of the aforementioned changes could allow the USPS to achieve certain aspects of financial stability in the near-term. Increasing rates and / or reducing non-controllable costs could have a nearly immediate impact on the following three financial targets:
Generating revenue and retaining earnings that are sufficient to cover costs
6% EBT margin
Debt / EBITDA ratio of 1.0x – 2.5x
However, the three pillars of financial stability goals (profitability, leverage, and liquidity) cannot all be met in the short-term merely by enacting changes that would improve margins. Reaching the liquidity target requires some combination of: (i) the organic buildup of cash reserves and / or repayment of debt over a long period of time, and (ii) the USPS’s ability to access additional sources of liquidity. Similarly, reaching the Adjusted Total Liabilities / Adjusted Total Assets target would occur very gradually over time as the USPS builds up an equity base with its profits, pays down debt, and gradually funds the unfunded portion of its off-balance-sheet liabilities.
Appendix B Postal Service March 20 Comments
PRC Docket No. RM2017-3

51
Under any reasonable definition, the USPS is not currently financially stable. Evercore believes that its proposed definition and corresponding financial metric thresholds will help guide management and the PRC in making operational and capital structure-related decisions. As discussed, any analysis of financial stability or actions with that goal in mind should consider all three pillars of financial stability, and factor in both the entity’s current financial position, as well as its outlook going forward.
It is important to keep in mind that the most fundamental tenet of financial stability is being able to cover costs sustainably over time. The financial targets set forth in this memorandum should be used to measure the USPS’s financial health on an ongoing basis and to manage the revenue and costs of the business, but the specific financial targets and groups of comparable companies should be revisited from time to time to ensure that they are the still producing results consistent with the fundamental definition of financial stability.
Appendix B Postal Service March 20 Comments
PRC Docket No. RM2017-3

52
VII. APPENDIX
A. BPA’s Rate Setting Mechanism: The Cost Recovery Adjustment Clause
Specifically, at the beginning of each fiscal year, N, if cumulative revenue20 for fiscal years 2013 through N-1 falls short of a set targeted threshold21 by at least $5 million, rate increases will go into effect at the beginning of the current fiscal year N to target a recovery of the cumulative revenue shortfall in the following manner:
BPA Rate Adjustment Methodology Exhibit 23:
Shortfall22 vs. Threshold Targeted Recovered Revenue
$5M - $100M Amount of shortfall
$100M - $500M $100M + 1 / 2*(shortfall - $100)
$500M+ $300M (maximum recovery)
Source: BPA 2016 Power Rate Schedules pg. 40-43
B. Global Postal Organizations’ Responses to Market Headwinds
Royal Mail’s Response to Financial Hardship
The Royal Mail Group, founded in 1516, was traditionally a public service operating as a government department. Two reviews of Royal Mail were completed in 2008 and 2010 that concluded that privatization was the best way to secure affordable, sustainable universal postal service in the United Kingdom. This was concluded because Royal Mail was less efficient than many postal companies elsewhere in Europe that had undergone modernization and that it urgently needed commercial confidence, capital and corporate experience to modernize quickly and effectively.23 The review recommended:
Transferring responsibility for Royal Mail’s historic pension liabilities to the government;
Reform of regulatory regime and removal of price controls; and
The introduction of private capital, which inherently requires a return
20 Accumulated Net Revenue (ANR) – calibrated for forecasted events that impact power net revenue and power cash flow differently by more than $5M 21 The Cost Recovery Adjustment Clause (CRAC) Threshold – see BPA 2016 Power Rate Schedules and General Rate Schedule Provisions for more detail 22 The shortfall, called the Underrun, is equal to the CRAC Threshold minus forecast ANR 23 https://www.nao.org.uk/wp-content/uploads/2014/04/The-privatisation-of-royal-mail.pdf
Appendix B Postal Service March 20 Comments
PRC Docket No. RM2017-3
53
The British government sold off its final 13% stake in Royal Mail in October of 2015, completing the privatization process that began in 2014. Shortly after the privatization, Royal Mail instituted its most recent price increase of first class stamps to 64p ($0.81 USD) and second class stamps to 55p ($0.69 USD). 24 Furthermore, following the Postal Services Act of 2011, Royal Mail is now able to change prices on ~95% of its mail (by revenue) with up to 30 days’ notice.25
Australia Post’s Response to Financial Hardship
Australia Post welcomed the Australian Government’s regulatory reform that enabled change to combat the digital era. The reform introduced:
Two-speeds of letter service for consumer mail:
– Regular service (1.00 AUD) for non-urgent mail to be delivered two business days slower than priority26
– Priority service offers delivery within 1-4 business days depending on destination (Based on the 1.00 AUD BPR a Priority label will cost 0.50 AUD)27
Price Increases:
– On January 4th, 2016 Australia post increased the Basic Postage Rate 43% from 0.70 AUD ($0.53 USD) to 1.00 AUD ($0.76 USD).28, 29 This price change applied to the Regular service and better reflects the actual cost of sending a letter. Also, this price change allows Australia post to cover more of the cost of service while maintaining a five day week delivery.30
Canada Post’s Financial Stability Plan
In 2013, Canada Post implemented a Five-Point Action plan to “achieve financial stability”31 by 2019. The five points included:
Converting partially to community mailbox delivery (now put on hold);
New pricing structure for Lettermail; 32
– March 31, 2014 rate increase: stamps sold in booklets, coils, and panes rose from $0.63 CAD to $0.85 CAD, while single stamp prices rose to $1.00 CAD
24 At $1.26 USD to 1 GBP as of 11/11/16 25 http://www.royalmail.com/sites/default/files/RoyalMail_2016_Prices.pdf: The Universal Service is a service the Royal Mail is required to maintain by law, where items of a specific size can be sent to any location within the United Kingdom for a fixed price, not affected by distance. The other service that the Royal Mail provides is special delivery, an expedited service that guarantees delivery by 1pm or 9am the next day at an increased cost 26 Australia Post 2016 Annual Report page 14 27 https://auspost.newsroom.com.au/Content/Home/02-Home/Article/Pricing-changes-effective-4-January-2016/-2/-2/6072 28 Foreign exchange rates as of November 10th, 2016 29 https://auspost.newsroom.com.au/Content/Home/02-Home/Article/Pricing-changes-effective-4-January-2016/-2/-2/6072 30 Australia Post 2016 Annual Report page 14 31 2013 Annual Report page 5 32 2015 Five-Point Action Plan Update page 9 (https://www.canadapost.ca/cpo/mc/assets/pdf/aboutus/5_en.pdf)
Appendix B Postal Service March 20 Comments
PRC Docket No. RM2017-3

54
– Impact on volume: In 2014, volume of transaction mail fell by approximately 5%, comparable to declines in recent years and better than expected
Expanding through postal franchises;
Streamlining operations; and
Addressing labor costs
Though financial stability is not explicitly defined by Canada Post, its principles are apparent in Canada Post’s capital management objectives (see below) and its Five-Year Financial Framework (see below). By 2015, the plan had contributed approximately $390 million CAD in financial benefits to the bottom line. Steady-state is expected to be approximately $450 million CAD per year33 in financial benefits to the bottom line.
Capital Management Objectives:
Maintaining sufficient liquidity to support financial obligations as well as operating and strategic plans
Maintaining financial capacity and access to credit facilities to support future development of the business
The actions taken in 2013 and 2015 were built upon the Canadian Government’s 2008 announced review of Canada Post’s public-policy objectives, its ability to remain financially self-sustaining, and the continued relevance of the 1998 policy framework.34 Selected results of the review include:
Recognized need for postal transformation through increased access to financing
Endorsed changes to the pricing constraint imposed by the existing price-cap formula to the basic letter rate
– Prior price-cap limited increases to the domestic basic letter rate to two-thirds the rate of inflation (CPI) – repealed in 2010
– Received approval for new five-year pricing regime for the domestic letter rate of $0.03 CAD in 2010, and $0.02 per year thereafter to 2014
Recognized the need for an increased ceiling to Canada Post’s borrowing authority from $300 million CAD to $2.5 billion CAD
Recognized need for a new financial framework
33 Canada Post Annual Report 2015 page 56 34 Canada Post AR 2009 Page 41
Appendix B Postal Service March 20 Comments
PRC Docket No. RM2017-3

55
– In 2009, the Government of Canada approved a five-year financial framework35 that set out performance targets from 2010 to 2014 (see chart below)
– The new framework supplanted the former Multi-Year Policy Framework (in use for over a decade), that had included objectives of income from operations of $175 million CAD, an operating margin of 3%36, and return on equity of Canada of 11%34
Canada Post’s Five-Year Financial Framework Exhibit 24:
Five-Year Financial Framework
Source: Canada Post Annual Report 2015 page 94
C. Excluded Comparable Groups
During the research process, Evercore considered and eventually decided to exclude the following potentially comparable entities for all or some of the analyses in this memorandum:
Private sector utilities regulated by commissions – excluded as they generally are for-profit and entitle shareholders to a fair return on investment
Railroads regulated by the Surface Transportation Board (“STB”) – excluded as railroads are for-profit and need to return enough to attract and retain capital
The Federal Deposit Insurance Corporation – excluded as it is structured more like an insurance company than the USPS. Furthermore, this entity must retain enough funds to provide liquidity to a crashing bank system in a time of high stress. Therefore, many metrics, including liquidity metrics, would be structurally different versus the USPS
U.S. Airports with “Compensatory” Cost Frameworks – excluded as airports under this structure can run a surplus (profit) and accept more financial risk than airports with “Residual” Cost Frameworks
35 Canada Post Annual Report 2015 page 94 36 Operating margin = income from operations / revenue from operations
Canada Post Five-Year Financial Framework
Financial
framework 2011A 2012A 2013A 2014A 2015A
Profitability
EBITDA margin 5.0-7.5% 0.9% 3.2% 3.8% 7.9% 6.1%
Return on adjusted book equity 0-5% (9.7%) (4.6%) (1.8%) 10.3% 4.7%
Leverage
Total debt to EBITDAR 2.5-4.0x 9.6x 5.7x 5.0x 2.8x 3.4x
Total debt to adjusted book capital 45-65% 55.5% 55.2% 55.4% 51.8% 49.9%
Liquidity
(EBITDAR - capex) ÷ interest 1.0-2.5x (1.8x) 1.3x 3.3x 5.7x 2.6x
Dividend payout
Dividend payout ratio 2011-2012 0-20% 0.0% 0.0%
2013-2015 15-20% 0.0% 0.0% 0.0%
Appendix B Postal Service March 20 Comments
PRC Docket No. RM2017-3
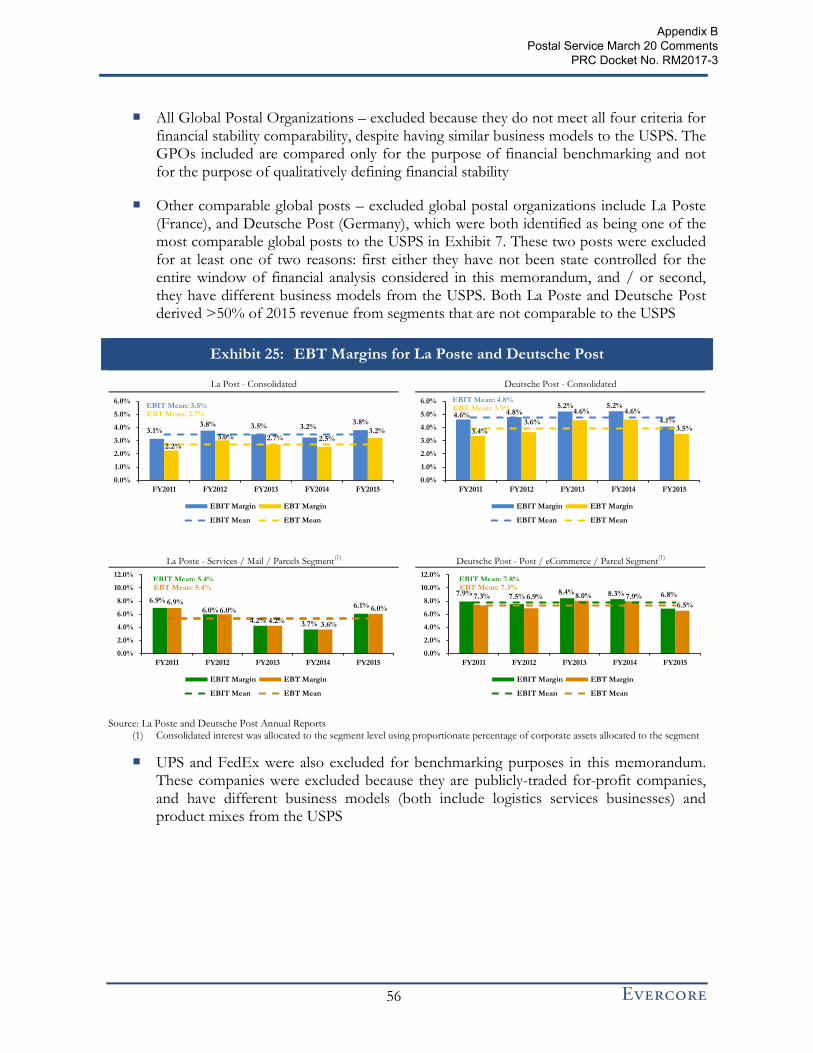
56
All Global Postal Organizations – excluded because they do not meet all four criteria for financial stability comparability, despite having similar business models to the USPS. The GPOs included are compared only for the purpose of financial benchmarking and not for the purpose of qualitatively defining financial stability
Other comparable global posts – excluded global postal organizations include La Poste (France), and Deutsche Post (Germany), which were both identified as being one of the most comparable global posts to the USPS in Exhibit 7. These two posts were excluded for at least one of two reasons: first either they have not been state controlled for the entire window of financial analysis considered in this memorandum, and / or second, they have different business models from the USPS. Both La Poste and Deutsche Post derived >50% of 2015 revenue from segments that are not comparable to the USPS
EBT Margins for La Poste and Deutsche Post Exhibit 25:
Source: La Poste and Deutsche Post Annual Reports (1) Consolidated interest was allocated to the segment level using proportionate percentage of corporate assets allocated to the segment
UPS and FedEx were also excluded for benchmarking purposes in this memorandum. These companies were excluded because they are publicly-traded for-profit companies, and have different business models (both include logistics services businesses) and product mixes from the USPS
La Post - Consolidated Deutsche Post - Consolidated
3.1% 3.8% 3.5% 3.2%
3.8%
2.2%
3.0% 2.7% 2.5% 3.2%
0.0%
1.0%
2.0%
3.0%
4.0%
5.0%
6.0%
FY2011 FY2012 FY2013 FY2014 FY2015
EBIT Margin EBT Margin
EBIT Mean EBT Mean
EBIT Mean: 3.5% EBT Mean: 2.7% 4.6% 4.8%
5.2% 5.2%
4.1%
3.4%
3.6%
4.6% 4.6%
3.5%
0.0%
1.0%
2.0%
3.0%
4.0%
5.0%
6.0%
FY2011 FY2012 FY2013 FY2014 FY2015
EBIT Margin EBT Margin
EBIT Mean EBT Mean
EBIT Mean: 4.8% EBT Mean: 3.9%
La Poste - Services / Mail / Parcels Segment(1)
Deutsche Post - Post / eCommerce / Parcel Segment(1)
6.9%
6.0%
4.2% 3.7%
6.1% 6.9% 6.0%
4.2% 3.6%
6.0%
0.0%
2.0%
4.0%
6.0%
8.0%
10.0%
12.0%
FY2011 FY2012 FY2013 FY2014 FY2015
EBIT Margin EBT Margin
EBIT Mean EBT Mean
EBIT Mean: 5.4% EBT Mean: 5.4%
7.9% 7.5% 8.4% 8.3% 6.8% 7.3% 6.9% 8.0% 7.9%
6.5%
0.0%
2.0%
4.0%
6.0%
8.0%
10.0%
12.0%
FY2011 FY2012 FY2013 FY2014 FY2015
EBIT Margin EBT Margin
EBIT Mean EBT Mean
EBIT Mean: 7.8% EBT Mean: 7.3%
Appendix B Postal Service March 20 Comments
PRC Docket No. RM2017-3

57
EBT Margins for FedEx and UPS Exhibit 26:
Source: FedEx and UPS Annual Reports (1) Margins for the consolidated business are substantially similar for the mailing and package segments (2) Non-recurring expenses were removed from historical financial results, in line with standard wall street practice (3) Consolidated interest was allocated to the segment level using proportionate percentage of corporate assets allocated to the segment (4) UPS’s Supply Chain & Freight segment was excluded as it is not considered comparable to the USPS
D. Considerations for the Defaulted PSHRBF Pre-Funding Payments
The PSRHBF is a relatively unique and sizable obligation of the USPS and one not incurred by the Benchmarking Comparables. In light of these unique attributes, additional discussion related to the PSRHBF’s impact on financial stability is merited.
As of 9/30/16, defaulted PSRHBF pre-funding payments totaled $33.9bn. If and when that liability is repaid in the future, the principal component of those payment(s) will be reflected in the statement of cash flows but not in the income statement, as those amounts were already expensed previously. As such, a meaningful portion of the USPS’s profits in any given year could be eroded by these repayments, and the treatment of the obligation going forward could have a significant impact on the financial stability of the USPS.
In the examples below, Evercore considers three illustrative examples of how the defaulted PSRHBF obligation may be treated in the future, and the corresponding impacts on the USPS’s financial stability. The examples include two bookend scenarios in which the obligation is called all at once or never paid (Examples 1 and 2), as well as a range of scenarios if the obligation is repaid gradually over time (Example 3).
FedEx - Consolidated(1)(2)
UPS - Consolidated(2)
La Post - Consolidated
7.8% 7.3%
8.4% 9.6%
9.7%
7.7%
7.1%
8.0% 9.1% 9.1%
0.0%
2.0%
4.0%
6.0%
8.0%
10.0%
12.0%
FY2012 FY2013 FY2014 FY2015 FY2016
EBIT Margin EBT Margin
EBIT Mean EBT Mean
EBIT Mean: 8.5% EBT Mean: 8.2%
11.5% 11.4% 13.1%
10.4% 13.3%
10.9% 10.7% 12.5%
9.8%
12.8%
0.0%
3.0%
6.0%
9.0%
12.0%
15.0%
18.0%
FY2011 FY2012 FY2013 FY2014 FY2015
EBIT Margin EBT Margin
EBIT Mean EBT Mean
EBIT Mean: 11.9% EBT Mean: 11.3%
UPS(2)(3)(4)
La Poste -
Services /
12.5%
8.9%
14.0%
10.5%
14.3%
12.1%
8.5%
13.5%
10.1%
13.9%
0.0%
3.0%
6.0%
9.0%
12.0%
15.0%
18.0%
FY2011 FY2012 FY2013 FY2014 FY2015
EBIT Margin EBT Margin
EBIT Mean EBT Mean
EBIT Mean: 12.0% EBT Mean: 11.6%
Appendix B Postal Service March 20 Comments
PRC Docket No. RM2017-3

58
Example 1: The PSRHBF defaulted payment liability gets called all at once: If the USPS returns to financial stability and the $33.9bn PSRHBF liability gets called all at once in the near-term before the USPS has built up substantial cash and liquidity reserves, the USPS would be forced to issue debt to fund the liability. This would increase debt balances and adversely impact the USPS’s progress towards the Debt / EBITDA financial stability target range. Additionally, interest and debt repayments associated with the new debt would impact the USPS’s progress towards liquidity targets. Note that in this scenario, the USPS’s debt limit would also need to be increased above the current $15bn threshold.
Example 2: The PSRHBF defaulted payment liability never gets called or paid down: For this example the working assumption is that the debt, though never paid, remains an obligation. If the USPS does not make any payments to reduce the $33.9bn deficit, the liability would have no impact on liquidity or profitability targets. However, the Adjusted Total Liabilities / Total Assets ratio would be negatively impacted if the PSRHBF liability remained substantially unfunded, and grow with accrued interest. Additionally, as the PSRHBF obligations eventually come due, there may not be enough capital to fund the costs for which the fund is designed.
Example 3: The PSRHBF defaulted payment liability is paid down gradually over time: If the pre-funding deficit is repaid over time, any amortization payments would impact the USPS’s progress towards the financial stability liquidity target. Liquidity metrics would be impacted because the principal portion of the amortization payments would consume a portion of the cash generated by the 6% EBT margin. (Note that the USPS has already expensed the principal portion of pre-funding obligations associated with the $33.9bn deficit.) To illustrate the size of the impact that gradual repayment of the PSRHBF defaulted pre-funding liability could have, Evercore calculated theoretical average amortization principal payments in Exhibit 27. As shown below, the amortization of such a large obligation can represent a significant portion of the profits that the USPS would target generating in the future (~20 to ~79% of EBT, or 1.2% - 4.7% of the 6.0% EBT margin).
Appendix B Postal Service March 20 Comments
PRC Docket No. RM2017-3

59
Illustrative Example of Impact of Amortization Schedules of the PSRHBF Exhibit 27:
(1) Represents the average annual principal payments without interest. Interest impact would reduce profitability, requiring USPS to take more steps to meet the target 6% EBT margin.
Although the future treatment of the PSRHBF pre-funding deficit is unclear, the treatment could have a significant impact on the USPS’s ability to achieve financial stability and should be carefully considered in the context of setting financial stability targets. Because any repayments of the $33.9bn deficit are not included in the calculation of EBT, the primary financial stability target, a cushion above the mean and median of the EBT margins for the Benchmarking Comparables is prudent.
E. Office of the Inspector General: Report on Liquidity
Evercore is aware that on October 20th, 2016 the Office of the Inspector General (OIG) issued an Audit Report (FT-AR-17-001) titled “Measurement of Days of Operating Cash on Hand”. In this report, the OIG investigated the USPS’s reporting of 24 days of operating cash on hand and ascertained that the calculation was “not consistent with best practices” and recommended that USPS define the number of days of operating cash on hand it should have to sustain operations through a short-term economic downturn.37
The USPS issued a response to the OIG’s recommendation in which it disagreed with the recommendation to change its calculation of Days of Operating Cash on Hand to be based on 365 day rather than its current 251 day, and with the OIG’s conclusion that 24 days was an appropriate amount of cash on hand given reference to certain competitors. The USPS also disagreed with defining the number of days of operating cash on hand necessary to make it through an economic downturn, saying that every recession is different; the length of the recession cannot be estimated so defining a specific number of days is not possible.
Evercore’s recommendations do not conflict with the USPS Management’s response to the OIG because:
Evercore is agnostic to the number of days used in this calculation as either number of days, would mathematically produce the same implied targeted cash balance for the USPS. See following example:
37 Page 1, OIG Audit Report FT-AR-17-001
PSRHBF Total Defaulted Pre-funding Payments ($33,900) ($ in millions)
2016 Revenue 71,498
EBT (@ Theoretical 6%) 4,290
Theoretical Amortization
Years to Pay Down Defaulted Payments 10 20 30 40
Average Annual Principal Payments(1)
($3,390) ($1,695) ($1,130) ($848)
Average Annual Principal Payments as % of 2016 Revenue 4.7% 2.4% 1.6% 1.2%
Average Annual Principal Payments as % of 2016 EBT 79.0% 39.5% 26.3% 19.8%
Appendix B Postal Service March 20 Comments
PRC Docket No. RM2017-3

60
Liquidity Metrics Analysis for USPS and Comparables Exhibit 28:
Source: Evercore generated example
Evercore agrees that it is impossible to estimate the amount of cash the USPS will need during a recession because the length of recessions is impossible to predict. Rather, what Evercore is recommending as a liquidity target is what can be deemed as financially stable by a reasonable measure by considering:
– The liquidity measures of the peers of the USPS;
– The length of time that would likely be needed for the government to give the USPS additional funding in a time of crisis; and
– The length of the last recession, which was particularly severe, and what the USPS would have needed to weather that storm
Furthermore, Evercore is not recommending that a target liquidity balance be cash on hand. A significant portion of the target liquidity level could also be held in the form of a line of credit or other liquidity mechanism, perhaps with the U.S. Treasury to use only in times of crisis. In the absence of USPS having additional borrowing authority 24 days of cash on hand is not consistent with financial stability.
F. Explanations of Financial Adjustments
I. Cash Flow and Profitability Normalization Adjustments
Airport Cash Flows
Average cash flow metrics excluded years in which airports had major capital expenditures (e.g., construction of a new terminal) because these capital expenditures were directly funded with revenue bonds
Las Vegas:
Days of Opex Illustrative Example C D
Numbers are ficticious, for illustrative purposes only 251 365
A B Opex Days Cash
Cash Revenue EBITDA OpEx 251 Days 365 Days
Comp 1 $100 $500 $150 $350 71.7x 104.3x
Comp 2 250 1,000 200 800 78.4x 114.1x
Comp 3 200 750 100 650 77.2x 112.3x
= A / (B / C) = A / (B / D)
Average 75.8x 110.2x
=E*F/C F E
USPS Implied Balance - 251 Days $3,020 10,000 75.8x
USPS Implied Balance - 365 Days $3,020 10,000 110.2x
=G*F/D G
Implied USPS Cash is same both ways
Appendix B Postal Service March 20 Comments
PRC Docket No. RM2017-3

61
– Capital expenditures in 2012 were outsized because of construction of a $2.4B new terminal, which was completed at the end of FY 2012. This project was funded by a series of bonds issued prior to 2011
– In FY 2012, LAS recognized an outsized loss from a disposition of capital assets for sale of $33mm. To normalize, EVR used the average net loss from disposition of capital assets for FY2011, and 2013 – 2016
– Also in FY 2012, LAS recognized an outsized loss on interest and investment income of $59mm. To normalize, EVR used the gain / (loss) on interest and investment income for FY 2011, and 2013 – 2016
Miami: Capital expenditures in 2011 were outsized due to the 2002 Capital Improvement Program. This program was funded by a series of revenue bonds, with a limit of $6.2bn
Global Postal Organizations
In FY 2013, Canada Post recognized an outsized gain on sale of capital assets and assets held for sale of $168mm. To normalize, EVR used the average of capital gains on asset sales for FY 2012, 2014 and 2015
In FY2015, Australia Post recognized an outsized restructuring and asset write-down charge. To normalize, EVR replaced the expense with the average of restructuring and write-down costs for FY 2012 – FY 2014
BPA
For profitability metrics, nonfederal project expenses were added back into EBITDA because they comprised of interest & amortization expenses.
II. Adjusted Liabilities and Adjusted Assets: Off-Balance-Sheet Adjustments
This section applies to the USPS and all comparable entities explored in this memorandum except the U.S. Airports with “Residual Cost Frameworks”, which have their own off-balance sheet adjustments section. Off-balance-sheet adjustments fell into three buckets: Operating Lease Adjustments, Pension and Other Postemployment Benefit Adjustments, and Contingent Liability Adjustments (all detailed below). Evercore did not make adjustments for purchase obligations or other capital expenditure-like capital commitments as they were considered more like ordinary capital expenditures than committed liabilities.
Operating Lease Adjustments
To capture the additional liabilities and assets created by operating leases, Evercore adjusted the liabilities and assets totals for leverage metrics using the following methodology:
Total Operating Lease Adjustment = Rent Expense * Rent Expense Multiplier
Appendix B Postal Service March 20 Comments
PRC Docket No. RM2017-3

62
The rent expense multiplier used for the USPS and comparable entities was 5.0x, which is in line with industry standards. The total operating lease adjustment is added to both total adjusted liabilities and total adjusted assets. This assumes that the capitalized value of off-balance-sheet operating lease assets is equal to the corresponding liability. This practice is consistent with Moody’s Operating Lease adjustment methodology detailed in the June 2015 report “Financial Statement Adjustments in the Analysis of Non-Financial Corporates”.
Pension and Other Postemployment Benefit (OPEB) Adjustments
To capture the additional liabilities and assets created by off-balance-sheet pension plans and other postemployment benefit plans Evercore adjusted the liabilities and assets totals for leverage metrics by adding the total value of the obligations to Total Liabilities and the value of corresponding assets to Total Assets. Further notes related to specific entities are below:
USPS: For the USPS, $33.9bn of $104.0bn of total obligations was already on the balance sheet so $28.1bn was deducted from the adjustment. Furthermore, the FERS Supplemental Liability, Workers Comp, and employees leave were all not adjusted from the totals stated on the 2016 Balance Sheet. Furthermore, the USPS includes related CSRS and FERS off-balance-sheet obligations and assets.38
BPA Exclusion: Employees of the BPA are federal employees associated with the operation of CSRS and FERS. All such postretirement system and program are sponsored by the office of personnel management; therefore, the BPA’s financial statements do not include accumulated plan assets or liabilities related to administration of such plan. 39 The USPS has a similar relationship to the CSRS and FERS plans, which Evercore is including in the adjusted balance sheet totals. The allocation of CSRS and FERS plans to the BPA were not publically available to the knowledge of Evercore. As the impact of these plans is significant in the adjusted balance sheet totals Evercore felt BPA had to be excluded from the total adjusted balance sheet leverage metrics.
TVA: The TVA Pension and OPEB adjustment includes net balance of Pension Obligation on balance sheet under “accounts payable and accrued liabilities” and “pension and post-retirement benefit obligations”. Evercore added back fair value of plan assets to encompass full obligation and asset amount.40
Canada Post: Canada Post includes a total net pension balance on their financial statements ($6,303mm total, or $6,398mm non-current pension, other post-employment and other long-term benefit liabilities + $62mm current other long-term benefit liabilities - $157mm pension benefit assets). Evercore added back fair value of plan assets ($23,185mm) to encompass full obligation and asset amount.41
38 USPS 2015 10k pg. 23 39 See Pension and Other Postretirement Benefits Section on page 60 of the BPA 2016 Annual Report 40 See page 127 of the TVA 2016 10-K 41 See page 120 and 121 of the 2015 Canada Post Annual Report
Appendix B Postal Service March 20 Comments
PRC Docket No. RM2017-3

63
Australia Post: Australia Post includes pension net balance ($403.6mm) in superannuation assets added back fair value of pension obligation ($3,506.8mm) to capture full obligation and asset balance.42
Royal Mail Group: Royal Mail Group balance sheet includes retirement surplus benefit of $3,430mm, post IFRIC 14 adjustment. Evercore added back $3,815mm to both benefit obligation and asset to include full balance.
The detailed off-balance-sheet calculations related to operating leases, pension plans, and OPEBs for the USPS, Federal Utilities, and Global Postal Organizations can be seen in Exhibit 33.
III. Residual Airport Off-Balance-Sheet Adjustments
Operating Leases and Concession Agreements
No adjustment was made for any of the residual airports for Operating leases and concession agreements because these contracts were sources of revenue and not potential liabilities.
Pension Plans and Other Postemployment Benefits (OPEB)
The residual airports under consideration (San Francisco International - SFO, Miami Dade International – MIA, and McCarran International Airport - LAS) all had both pension plans and OPEB liabilities. In all cases, these liabilities were reported as net liabilities on the balance sheet. Furthermore, in all cases the net liabilities were a portion of a broader pension or OPEB plan which was held and controlled by a governing municipality or entity (e.g., the county of Miami, the city of San Francisco, or the State of Nevada). To make the Adjusted Total Liabilities / Adjusted Total Assets metric comparable to the USPS and other comparables, Evercore added the gross asset and additional liability implied by the net liability for each airport for each pension plan and other postemployment benefit plan. To do this, Evercore determined the size of the gross asset which created the corresponding net liability. No direct offsetting asset numbers at the airport level were available. However, in all cases proportionate share percentages of the municipality level net liability were available. Also, critically, Total Asset numbers were available at the municipality level. Therefore, to calculate the Total Assets which create the on balance sheet net liabilities Evercore followed this formula:
Total Off-Balance-Sheet Asset & Liability for the airport = (airport’s proportionate share of the
municipality’s net liability) * (Total Assets allocated to fund the plan)
This calculation was performed for each of the pension plans and OPEB plans for each airport. Corresponding off-balance-sheet assets and liabilities were added to calculate Adjusted Total Liabilities / adjusted Total Assets. A critical assumption that this formula implies is that the proportionate share of a plan’s liabilities was equal to the total claim an entity has on the plan’s assets. Calculation details for all three airports are displayed below.
42 Australia Post 2016 10-K page 92
Appendix B Postal Service March 20 Comments
PRC Docket No. RM2017-3

64
San Francisco International Airport (SFO) Pension & Other Exhibit 29:Postemployment Benefits (OPEB) Adjustment43
Source: San Francisco International Airport Annual Report 2016; http://sfcontroller.org/sites/default/files/FileCenter/Documents/6275-Report_Retiree_Postemployment_Medical_Benefit_Costs.pdf; http://mysfers.org/wp-content/uploads/SFERS_AnnualReport_2015_web.pdf
McCarran International Airport (LAS) Pension & Other Postemployment Exhibit 30:Benefits (OPEB) Adjustment44
Source: McCarran International Airport Annual Report 2016; http://www.nvpers.org/public/investments/pers/PERS-Investment-Performance.pdf; http://www.nvpers.org/public/publications/FY15GASB68.pdf
43 2016 SFERS Annual Report and 2016 Retiree Postemployment Medical Benefit Costs Report were not available at the time of the writing of this document, therefore, 2015 reports were used as best approximations of 2016 values. Total OPEB Fund June 30, 2015, Evercore used the 2012 number and increased by 7.5% per year to reflect expected returns detailed in report as 2013 – 2015 were not available but 2012 and expected returns were available 44 2016 PERS Investment reports were not available at the time of the writing of this report, therefore, 2015 reports were used as best approximations of 2016 values. For the total PER’s Fund as of June 30th, 2015 Evercore used the Total PERS Fund from 2016 and subtracted one year of performance (2.3%)
SFO Airport Pension - As Reported
Net Pension Liability - on Balance Sheet (B/S Amt) $144
SFO Airport Pension - Adjustment
City of San Francisco's Share of the San Francisco Employers Retirement System (SFERS) NPL (A) 94%
SFO Airport's Allocation of the City of San Francisco's Proportionate Share of SFERS's NPL (B) 7%
Total SFERS Investments at Fair Value June 30 2015 (C) $21,540
Appx Total Claim on SFERS Fund for SFO (A)*(B)*(C)=(D) 1,343
Net Pension Liability - on Balance Sheet (B/S Amt) 144
Implied Total SFERS Liability for SFO =(B/S Amt)+(D) 1,487
SFO OPEB Adjustment
Net Other Postemployment Benefits (OPEB) Obligation - on Balance Sheet Total Liabilities (B/S Amt) 124
Total Unfunded Actuarial Liability for Other Post-Employment Health Benefits (OPEB) (A) 3,980
SFO Airport's % of Total OPEB NPL (C)=(B/S Amt)/(A) 3%
Appx. Total OPEB Fund June 30 2016 (D) 24
Appx Total Claim on OPEB Fund for SFO (E)=(C)*(D) 1
Net Other Postemployment Benefits (OPEB) Obligation - on Balance Sheet Total Liabilities (B/S Amt) 124
Implied Total OPEB Liability for SFO =(B/S Amt)+(E) 125
LAS Net Pension Liability - As Reported
Net Pension Liability - on Balance Sheet (B/S Amt) 143
LAS Unfunded Pension Adjustment
McCarren Airport's allocation of the NPL of Clark County (A) 15%
Clark County's Total Net Pension Liability in NV PERS (B) 963
Total NPL for NV PERS (C) 11,459
% of Clark County's NPL of NV PERS (D)=(B)/(C) 8%
Total PER's Fund Sept 30 2016 (E) 34,729
Appx Total Claim on NV PERS Fund for LAS (F) = (A)*(D)*(E) $432
Net Pension Liability - on Balance Sheet (B/S Amt) 143
Implied Total PERS Liability for LAS =(B/S Amt)+(F) $575
LAS Net Other Postemployment Benefits (OPEB) Obligation - As Reported 59
Does not require any adjustments as parent fund is entirely unfunded
Appendix B Postal Service March 20 Comments
PRC Docket No. RM2017-3

65
Miami-Dade International Airport (MIA) Pension & Other Exhibit 31:Postemployment Benefits (OPEB) Adjustment45
Sources: Miami-Dade International Airport Annual Report 2015 https://www.rol.frs.state.fl.us/forms/2014-15_CAFR.pdf
45 For the total PER’s Fund as of June 30th, 2015 Evercore used the Total PERS Fund from 2016 and subtracted one year of performance (2.3%)
MIA Health Insurance Subsidy (HIS) Net Pension Liability - As Reported
Health Insurance Subsidy (HIS) Net Pension Liability - on Balance Sheet (B/S Amt) 18.2
MIA HIS Program Adjustment
Aviation Department's Proportionate Share of NPL in 2015 (A) 0.1784%
Total Retiree (HIS) Fiduciary Net Position June 30 2015 (B) 51
Appx Total Claim on HIS Fund for Miami-Dade Airport (A)*(B)=(C) $0.1
Health Insurance Subsidy (HIS) Net Pension Liability - on Balance Sheet (B/S Amt) 18.2
Implied Total HIS Liability for MIA =(B/S Amt)+(C) $18.3
MIA Florida Retirement System (FRS) Net Pension Liability - As Reported
Florida Retirement System (FRS) Net Pension Liability - on Balance Sheet (B/S Amt) 28
MIA FRS Pension Adjustment
Aviation Department's proportionate share of NPL in 2015 (A) 0.2145%
Total FRS Fiduciary Net Position June 30 2015 (B) 148,454
Appx Total Claim on FRS Fund for Miami-Dade Airport (A)*(B)=(C) $318
Florida Retirement System (FRS) Net Pension Liability - on Balance Sheet (B/S Amt) 28
Implied Total FRS Liability for MIA =(B/S Amt)+(C) $346
MIA Net Other Postemployment Benefits (OPEB) Obligation - As Reported 3
Does not require any adjustments as parent fund is entirely unfunded
Appendix B Postal Service March 20 Comments
PRC Docket No. RM2017-3

66
Exhibit 13 and Exhibit 15 Footnotes Source: Company filings
(1) Financial statements for the Canada Post and Miami Airport are 2015, every other comp is FY 2016
(2) This metric reflects Total Liabilities / Total Assets as reported, either by GAAP or other standard accounting practices (e.g., IFRS). It should be noted that different entities have different ways of reporting off-balance-sheet assets and liabilities. This metric is unadjusted
(3) Total Assets and Total Liabilities are adjusted in this metric to include off-balance-sheet pensions, operating leases, and other off-balance sheet items (e.g., Contingent Liabilities)
(4) Theoretical liquidity adjusts liquidity for Global Postal Orgs and Federal Utilities to reflect additional debt capacity that could be raised from the capital markets or the U.S. Government.
a. Global Postal Orgs: Mechanically, total liquidity = (Cash & Cash Equivalents + (7*EBITDA) – (Actual Total Debt)). 7*EBITDA reflects what Moody defines as a Caa rating for global postal organizations as stated in the 2011 Moody’s Global Postal and Express Delivery Methodology. This would theoretically be the limit at which the capital markets would be shut off
b. Federal Utilities: Mechanically, total liquidity = (Cash & Cash Equivalents + Additional allowed borrowings from the U.S. Government). Additional borrowing limits from the U.S. Government are identified, to some extent, in the TVA and BPA annual reports
(5) Canada Post profitability metrics include average of 2014-2015 to reflect profitability since 2014 price increase
(6) Royal Mail pre-IPO excluded from all targeting exercises
(7) Royal Mail post-IPO average reflects profitability metrics from 2014-2016
Appendix B Postal Service March 20 Comments
PRC Docket No. RM2017-3

67
USPS Benchmarking – Latest Fiscal Year Statistics Exhibit 32:
Source: Company filings 1) TVA: "Tax equivalents" used as taxes; Airports (SFO, MIA, and LAS): EBT excludes capital contributions and transfers to cities and states, and includes passenger facility revenues, and Jet A fuel tax revenues 2) Restricted cash is excluded for the USPS, as it includes “Postal Service cash that is not available for general use, or cash that is otherwise awaiting disposition”. For airports, restricted cash includes non-current investments
and non-current cash 3) Other sources of liquidity primarily comprised of undrawn lines of credit
USPS Large Residual Airports Federal Utilities Global Postal Organizations
As Reported SFO LAS MIA BPA TVA Canada Post Australia Post
Royal Mail Pre-
IPO
Royal Mail Post-
IPO
Fiscal Year End Date Sep-16 Jun-16 Jun-16 Sep-15 Sep-16 Sep-16 Dec-15 Jun-16 Mar-13 Mar-16
Income Statement Liquidity with 180 Days
Gross Revenue $71,498 $867 $641 $883 $3,433 $10,616 $8,006 $6,500 £9,146 £9,251
EBITDA (3,661) 505 368 457 1,296 4,730 484 406 684 823
EBIT (5,401) 277 170 195 799 2,848 169 76 403 551
EBT(1) (5,591) 82 4 (107) 277 1,755 136 41 304 538
Balance Sheet
Liquidity
Unrestricted Cash 8,077 416 449 307 853 300 775 548 351 368
Restricted Cash(2) - 902 685 901 - - - - - -
Other Sources of Liquidity(3) - - - - 239 1,100 1,663 415 900 1,050
Total Liquidity $8,077 $1,318 $1,134 $1,208 $1,092 $1,400 $2,438 $963 $1,251 $1,418
Contingency Account (or equivalent) 94 43 42
Draw on revolver 4,000 1,400 - 973 392
Revolver Limit 4,000 2,500 136 415 1,873 1,442
Other Lines 239 1,527
Additional Borrowing Capacity - if stated 2,940 5,900
Borrowing used 4,760 24,100
Limit on US Govt Borrowing 7,700 30,000
Current Assets 9,512 750 1,165 642 1,327 3,644 2,505 1,429 1,389 1,420
Total Assets 25,219 5,437 6,037 7,727 24,898 50,494 7,720 5,043 4,616 7,600
Current Liabilities 20,715 804 285 339 1,371 5,862 1,356 2,133 1,825 1,991
Total Liabilities 81,201 5,417 4,790 6,817 21,505 43,074 8,844 3,204 3,211 3,133
Total Debt 15,000 4,430 4,311 6,083 15,641 22,148 1,135 705 1,199 612
Net Debt 6,923 3,112 3,177 4,875 14,789 21,848 360 157 848 244
Cash Flow Statement
Depreciation & Amortization 1,740 228 198 262 471 1,882 315 330 281 272
Operating Cash Flow 2,736 332 204 165 855 3,042 595 407 761 727
Capital Expenditures 1,428 304 74 98 808 3,060 352 302 388 270
Appendix B Postal Service March 20 Comments
PRC Docket No. RM2017-3

68
Off-Balance-Sheet Adjustments Exhibit 33:
See next page for footnotes
Off-Balance Sheet Adjustments(1)
USPS(2)
Large Residual Airports(3)
Federal Utilities Global Postal Organizations
USPS SFO LAS MIA BPA TVA(4)
Canada Post(5)
Australia Post(6)
Royal Mail Pre-
Privatization
Royal Mail Post-
Privatization(7)
Liability Adjustments
Operating Lease Adjustment
Rent Expense $1,094 $46 134 197 145
Rent Expense Multiplier 5.0x 5.0x 5.0x 5.0x 5.0x
Total Operating Lease Adjustment $5,470 $230 $670 $985 £725
Pension Adjustment 7,145 23,185 3,507 3,815
Total PSRHBF Off-BS Obligations $103,981
Less: Total PSRHBF On-BS Obligations (33,900)
Total PSRHBF Liability Adjustment 70,081
Total CSRS Off-BS Obligations 191,900
Total FERS Off-BS Obligations 115,900
Total Off B/S Retirement Liability Adj. $377,881 1,344 $432 $319 $7,145 $23,185 $3,507 £3,815
Other
Contingent Liabilities 235
Total Other Adjustments $ - $ - $ - $ - $ - $ - $235 £ -
Total Liability Adjustments $383,351 $1,344 $432 $319 $7,375 $23,855 $4,727 £4,540
Asset Adjustments
Total Off BS PSRHBF Assets 51,862
Total CSRS Off BS Assets 174,400
Total FERS Off BS Assets 112,100
Total Pension Asset Adjustments $338,362 $1,344 $432 $319 $7,145 23,185 $3,507 £3,815
Contingent Assets $8
Total Op Lease Asset Adjustments(8)$5,470 $230 $670 $985 £725
Total Asset Adjustments $343,832 $1,344 $432 $319 $7,375 $23,855 $4,492 £4,540
Total Liabilities 81,201 5,417 4,790 6,817 43,074 8,844 3,204 3,133
Total Assets 25,219.0 5,437 6,037 7,727 50,494 7,720 5,043 7,600
Total Liabilities / Total Assets 322.0% 99.6% 79.3% 88.2% 85.3% 114.6% 63.5% 41.2%
Adjusted Total Liabilities 464,552 6,761 5,221 7,135 50,449 32,699 7,931 7,673
Adjusted Total Assets 369,051 6,780 6,469 8,045 57,869 31,575 9,535 12,140
Adjusted Total Liabilities / Total Assets 125.9% 99.7% 80.7% 88.7% 87.2% 103.6% 83.2% 63.2%
Appendix B Postal Service March 20 Comments
PRC Docket No. RM2017-3
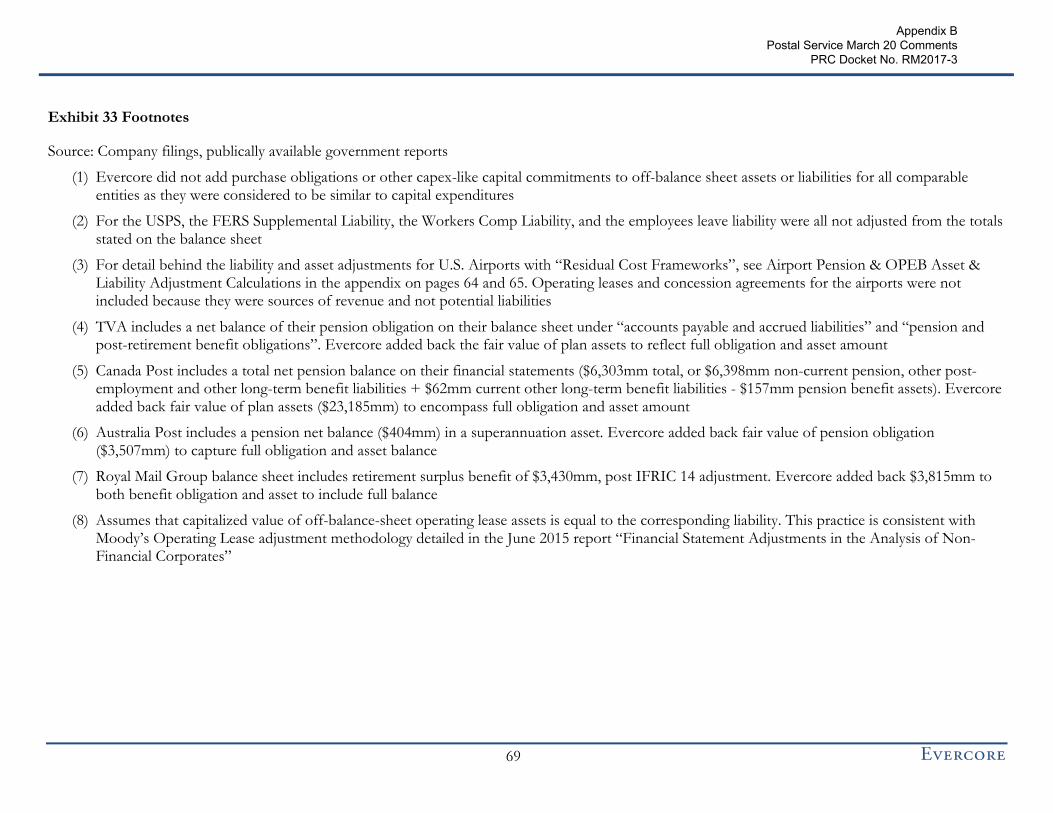
69
Exhibit 33 Footnotes
Source: Company filings, publically available government reports
(1) Evercore did not add purchase obligations or other capex-like capital commitments to off-balance sheet assets or liabilities for all comparable entities as they were considered to be similar to capital expenditures
(2) For the USPS, the FERS Supplemental Liability, the Workers Comp Liability, and the employees leave liability were all not adjusted from the totals stated on the balance sheet
(3) For detail behind the liability and asset adjustments for U.S. Airports with “Residual Cost Frameworks”, see Airport Pension & OPEB Asset & Liability Adjustment Calculations in the appendix on pages 64 and 65. Operating leases and concession agreements for the airports were not included because they were sources of revenue and not potential liabilities
(4) TVA includes a net balance of their pension obligation on their balance sheet under “accounts payable and accrued liabilities” and “pension and post-retirement benefit obligations”. Evercore added back the fair value of plan assets to reflect full obligation and asset amount
(5) Canada Post includes a total net pension balance on their financial statements ($6,303mm total, or $6,398mm non-current pension, other post-employment and other long-term benefit liabilities + $62mm current other long-term benefit liabilities - $157mm pension benefit assets). Evercore added back fair value of plan assets ($23,185mm) to encompass full obligation and asset amount
(6) Australia Post includes a pension net balance ($404mm) in a superannuation asset. Evercore added back fair value of pension obligation ($3,507mm) to capture full obligation and asset balance
(7) Royal Mail Group balance sheet includes retirement surplus benefit of $3,430mm, post IFRIC 14 adjustment. Evercore added back $3,815mm to both benefit obligation and asset to include full balance
(8) Assumes that capitalized value of off-balance-sheet operating lease assets is equal to the corresponding liability. This practice is consistent with Moody’s Operating Lease adjustment methodology detailed in the June 2015 report “Financial Statement Adjustments in the Analysis of Non-Financial Corporates”
Appendix B Postal Service March 20 Comments
PRC Docket No. RM2017-3

70
Historical Returns Benchmarking: USPS Exhibit 34:
GAAP Profitability Metrics Cash Flow Profitability Metrics
Includes pre-funded retiree
health benefits for both 2012
(current year) and 2011
(previously defaulted)
(24.1%)
(7.1%)(7.9%)
(7.1%)(7.6%)
(24.4%)
(7.4%) (8.1%) (7.3%) (7.8%)
FY2012 FY2013 FY2014 FY2015 FY2016
EBIT Margin EBT Margin
Mean: (10.8%)
Mean: (11.0%)
(22.0%)
(5.3%)
(6.3%) (6.3%)(7.1%)
(1.7%)
0.4%
3.7%
2.4% 1.8%
FY2012 FY2013 FY2014 FY2015 FY2016
(EBITDA - CapEx) / Revenue (OCF - CapEx) / Revenue
Mean: (9.4%)
Mean: 1.3%
Appendix B Postal Service March 20 Comments
PRC Docket No. RM2017-3

71
Historical Returns Benchmarking: U.S. Airports with “Residual Cost Frameworks” Exhibit 35:
38.6% 22.5%
(1.7%)
17.3% 23.1%
10.6% 10.7%
(14.3%)(2.9%)
3.2%
FY2012 FY2013 FY2014 FY2015 FY2016
Mean: 20.0% Mean: 1.4%
39.4% 47.6% 51.3%
45.8%
(3.4%)
12.8% 15.3% 20.3%
FY2012 FY2013 FY2014 FY2015 FY2016
Mean: 46.0%
Mean: 11.3%
(3)NM(1)
29.8% 45.8% 45.5% 40.6%
(14.7%)
3.6% 6.6% 7.5%
FY2011 FY2012 FY2013 FY2014 FY2015
Mean: 40.5%
Mean: 0.8%
NM(2)
23.9% 26.1% 27.6%
30.9% 26.6%
(16.7%)
(5.7%)(9.7%)
1.1% 0.7%
FY2012 FY2013 FY2014 FY2015 FY2016
Mean: 27.0%
Mean: (6.1%)
(1)
19.8%
28.1% 24.9% 26.2%
22.1%
(16.5%)
(6.7%) (10.7%) (7.7%) (12.2%)
FY2011 FY2012 FY2013 FY2014 FY2015
Mean: 24.2%
Mean: (10.8%)
28.5%
23.1%
16.1%
29.3% 31.9%
2.9%
(3.5%)(6.8%)
7.1% 9.5%
FY2012 FY2013 FY2014 FY2015 FY2016
Mean: 25.8%
Mean: 1.8%
Note, this disclaimer page should follow the title page in presentations.
Please fill out the [blanks] in the text.
San Francisco (SFO) Las Vegas (LAS)
EBIT Margin EBT Margin (EBITDA - CapEx) / Revenue (Operating Cash Flow - CapEx) / Revenue
Miami (MIA)
EBT margins tend to be close to or less than 0% because EBT calculations deduct D&A, while the rate setting frameworks for residual airports are
based on cash costs (including CapEx); for LAS and MIA, CapEx was only ~40% of D&A in 2015
GA
AP
Pro
fita
bil
ity M
etr
ics
Cash
Flo
w
Pro
fita
bil
ity M
etr
ics
GAAP Profitability Metrics Cash Flow Profitability Metrics
Years impacted by capex related to major capital
improvements (e.g., construction of a new terminal)
excluded as they are directly funded with revenue bonds
See next page for footnotes
Appendix B Postal Service March 20 Comments
PRC Docket No. RM2017-3

72
Exhibit 35 Footnotes
Source: Company filings
(1) Capex numbers from 2012 were outsized because of construction of a $2.4bn new terminal, which was completed end of FY 2012. This project was funded by a series of bonds issued prior to 2011
(2) Capex numbers from 2011 were outsized due to the 2002 Capital Improvement Program. This program was funded by a series of revenue bonds, with a limit of $6.2bn
(3) In FY2012, LAS recognized an outsized loss from a disposition of capital assets for sale of $33mm; to normalize, EVR used the average net loss from disposition of capital assets for FY2011, and 2013 – 2016; also in FY2012, LAS recognized an outsized loss on interest and investment income of $59mm; to normalize, EVR used the gain / (loss) on interest and investment income for FY2011, and 2013 – 2016
Appendix B Postal Service March 20 Comments
PRC Docket No. RM2017-3
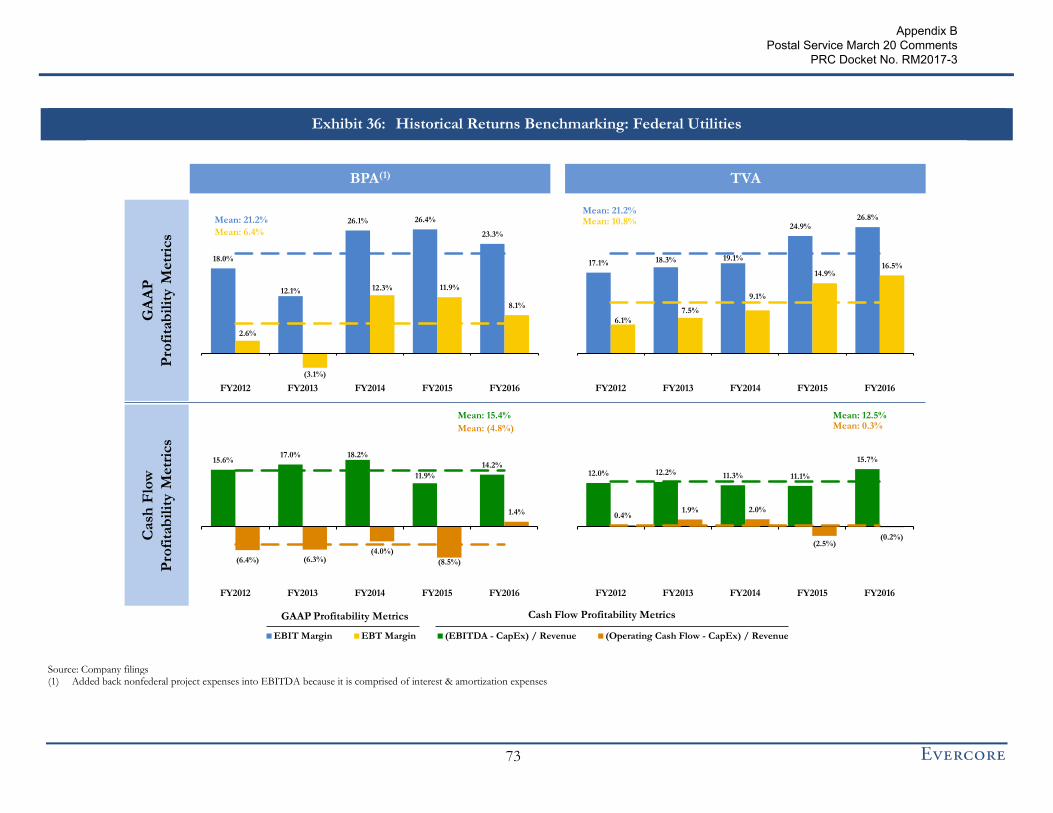
73
Historical Returns Benchmarking: Federal Utilities Exhibit 36:
15.6% 17.0% 18.2%
11.9%
14.2%
(6.4%) (6.3%)(4.0%)
(8.5%)
1.4%
FY2012 FY2013 FY2014 FY2015 FY2016
Mean: 15.4%
Mean: (4.8%)
12.0% 12.2% 11.3% 11.1%
15.7%
0.4% 1.9% 2.0%
(2.5%)(0.2%)
FY2012 FY2013 FY2014 FY2015 FY2016
Mean: 12.5% Mean: 0.3%
17.1% 18.3% 19.1%
24.9% 26.8%
6.1%
7.5%
9.1%
14.9% 16.5%
FY2012 FY2013 FY2014 FY2015 FY2016
Mean: 21.2% Mean: 10.8%
18.0%
12.1%
26.1% 26.4%
23.3%
2.6%
(3.1%)
12.3% 11.9%
8.1%
FY2012 FY2013 FY2014 FY2015 FY2016
Mean: 21.2%
Mean: 6.4%Note, this disclaimer page should follow the title page in presentations.
Please fill out the [blanks] in the text.
EBIT Margin EBT Margin (EBITDA - CapEx) / Revenue (Operating Cash Flow - CapEx) / Revenue
BPA(1) TVA
GA
AP
Pro
fita
bil
ity M
etr
ics
Cash
Flo
w
Pro
fita
bil
ity M
etr
ics
GAAP Profitability Metrics Cash Flow Profitability Metrics
Source: Company filings (1) Added back nonfederal project expenses into EBITDA because it is comprised of interest & amortization expenses
Appendix B Postal Service March 20 Comments
PRC Docket No. RM2017-3

74
Historical Returns Benchmarking: Global Postal Organizations Exhibit 37:
(6.3%)
(4.9%)
(3.1%)
4.5%
1.6%
(4.6%)
(3.5%)
(0.4%)
4.1%
3.0%
FY2011 FY2012 FY2013 FY2014 FY2015
Mean: (1.6%)
Mean: (0.3%)
6.4%
5.3%
(1.5%)
0.3%
1.6%
5.7%
1.3%
(1.1%) (1.3%)
1.6%
FY2012 FY2013 FY2014 FY2015 FY2016
Mean: 2.4%
Mean: 1.2%
(3.0%)
(1.4%)
(2.6%)
3.7%
2.1%
(3.4%)
(1.5%)
(2.8%)
3.4%
1.7%
FY2011 FY2012 FY2013 FY2014 FY2015
Mean: (0.2%)
Mean: (0.5%)
3.3% 3.2%
3.8%
6.5% 6.0%
0.2%
4.1% 4.9% 5.3% 4.9%
FY2012 FY2013 FY2014 FY2015 FY2016
Mean: 4.6%
Mean: 3.9%
3.2%
4.4% 4.5%
6.4% 6.0%
2.3%
3.3%
3.8%
6.1% 5.8%
FY2012 FY2013 FY2014 FY2015 FY2016
Mean: 4.9%
Mean: 4.3%
7.6% 7.5%
2.3%
0.6% 1.2%
7.2% 7.0%
1.6%
0.1% 0.6%
FY2012 FY2013 FY2014 FY2015 FY2016
Mean: 3.8%
Mean: 3.3%
Note, this disclaimer page should follow the title page in presentations.
Please fill out the [blanks] in the text.
Canada Post Australia Post Royal Mail Group
(1) (2)
EBIT Margin EBT Margin (EBITDA - CapEx) / Revenue (Operating Cash Flow - CapEx) / Revenue
GA
AP
Pro
fita
bil
ity M
etr
ics
Cash
Flo
w
Pro
fita
bil
ity M
etr
ics
(1) (2)
GAAP Profitability Metrics
Pre-Privatization Post-Privatization
Pre-Privatization Post-Privatization
Cash Flow Profitability Metrics
See next page for footnotes
Appendix B Postal Service March 20 Comments
PRC Docket No. RM2017-3

75
Exhibit 37 Footnotes
Source: Company filings
(1) In FY2013, Canada Post recognized an outsized gain on sale of capital assets and assets held for sale of $168mm; to normalize, EVR used the average of capital gains on asset sales for FY2012, 2014 and 2015
(2) In FY2015, Australia Post recognized an outsized restructuring and asset write-down charge; to normalize, EVR replaced the expense with the average of restructuring and write-down costs for FY2012 – FY2014
Appendix B Postal Service March 20 Comments
PRC Docket No. RM2017-3