Embed Size (px)
Citation preview
Define Initial Data Models
This document supports Pentaho Business Analytics Suite 5.0 GA and Pentaho Data Integration 5.0 GA,documentation revision August 28, 2013, copyright © 2013 Pentaho Corporation. No part may be reprinted withoutwritten permission from Pentaho Corporation. All trademarks are the property of their respective owners.
Help and Support ResourcesIf you do not find answers to your quesions here, please contact your Pentaho technical support representative.
Support-related questions should be submitted through the Pentaho Customer Support Portal athttp://support.pentaho.com.
For information about how to purchase support or enable an additional named support contact, please contact yoursales representative, or send an email to [email protected].
For information about instructor-led training, visithttp://www.pentaho.com/training.
Liability Limits and Warranty DisclaimerThe author(s) of this document have used their best efforts in preparing the content and the programs containedin it. These efforts include the development, research, and testing of the theories and programs to determine theireffectiveness. The author and publisher make no warranty of any kind, express or implied, with regard to theseprograms or the documentation contained in this book.
The author(s) and Pentaho shall not be liable in the event of incidental or consequential damages in connectionwith, or arising out of, the furnishing, performance, or use of the programs, associated instructions, and/or claims.
TrademarksPentaho (TM) and the Pentaho logo are registered trademarks of Pentaho Corporation. All other trademarks are theproperty of their respective owners. Trademarked names may appear throughout this document. Rather than listthe names and entities that own the trademarks or insert a trademark symbol with each mention of the trademarkedname, Pentaho states that it is using the names for editorial purposes only and to the benefit of the trademarkowner, with no intention of infringing upon that trademark.
Third-Party Open Source SoftwareFor a listing of open source software used by each Pentaho component, navigate to the folder that contains thePentaho component. Within that folder, locate a folder named licenses. The licenses folder contains HTML.files thatlist the names of open source software, their licenses, and required attributions.
Contact UsGlobal Headquarters Pentaho CorporationCitadel International, Suite 3405950 Hazeltine National DriveOrlando, FL 32822Phone: +1 407 812-OPEN (6736)Fax: +1 407 517-4575http://www.pentaho.com
Sales Inquiries: [email protected]

| TOC | 3
Contents
Introduction................................................................................................................................4Get Started with Data Models....................................................................................................5Tour the Data Source Wizard.................................................................................................... 6Choose A Data Source Type.....................................................................................................8Create CSV Data Sources.......................................................................................................10Create SQL Query Data Sources............................................................................................ 13Create Database Sources....................................................................................................... 15
Create a Database Table Data Source for Reporting Only........................................................................ 15Create a Database Table Data Source for Reporting and Analysis........................................................... 18
Tour the Data Source Model Editor......................................................................................... 21Edit Data Source Models.........................................................................................................23
Edit a Data Source Model...........................................................................................................................23Delete a Data Source................................................................................................................................. 23Add Member Properties to a Level............................................................................................................. 24Edit Multidimensional Data Source Models................................................................................................ 24
Assign Geographic Properties......................................................................................................... 24Assign Time Dimension Properties..................................................................................................25Use Ordinal Columns.......................................................................................................................27Properties of Time Dimension Levels.............................................................................................. 27
Next Steps............................................................................................................................... 29
| Introduction | 4
Introduction
Before you can create Pentaho reports and analysis, the BA Server needs to know where to find your data and how toconnect to it, what data you want to use, how the data is structured, and what the data is like. The Data Source Wizardhelps you define a data source that contains this information and guides you through the creation of your first relationalor multidimensional data models for use in creating reports and analysis.
After you define a data source, you can make it available to people who create reports and analysis so they can simplypick the data source they want to use from a list and begin creating their reports or analysis. One data source can beused by any number of reports or analysis.
Prerequisites
Before you can work with the Data Source Wizard, you must have installed the Pentaho software and configured the BAServer.
Expertise
The topics in this section are written for IT administrators who know how and where data is stored, how to connect to it,and details about the computing environment.
Tools
We provide a web application, the User Console, which you use to perform most data source and data modelling tasks.
Login Credentials
All of the tasks in this section require that you log on to the User Console with the Pentaho administrator user name andpassword.
| Get Started with Data Models | 5
Get Started with Data Models
When you configured your BA Server, you defined the connection information, including where the data is stored andwhat protocol or driver to use to connect to it. Configure Pentaho Systems shows you how to change or add connectioninformation.
To create a data source, just pick one of the connections that you have already defined, then use the wizard'sinteractive data modeling tool to select tables and columns to drag onto the model canvas. You can then use the DataSource Model Editor to refine the model further.
Eventually, you might want to add more security, localization, or make other advanced modifications to your model.To do that, export the initial model created with the Data Source wizard, and import it into either Metadata Editor forrelational data models and Schema Workbench for multidimensional data models.
Note: Relational and multidimensional models that have been edited in Metadata Editor and SchemaWorkbench can no longer be edited in the Data Source Model Editor.
It is time to take a look at the Data Source Wizard and see what all you can do with it. Just follow the Guide Postgraphics as you work with the tutorials to create your first data models with the wizard.
• Tour the Data Source Wizard• Choose a Data Source Type• Create CSV Data Sources• Create SQL Query Data Sources• Create Database Sources• Tour the Data Source Model Editor• Refine Data Models• Next Steps
| Tour the Data Source Wizard | 6
Tour the Data Source Wizard
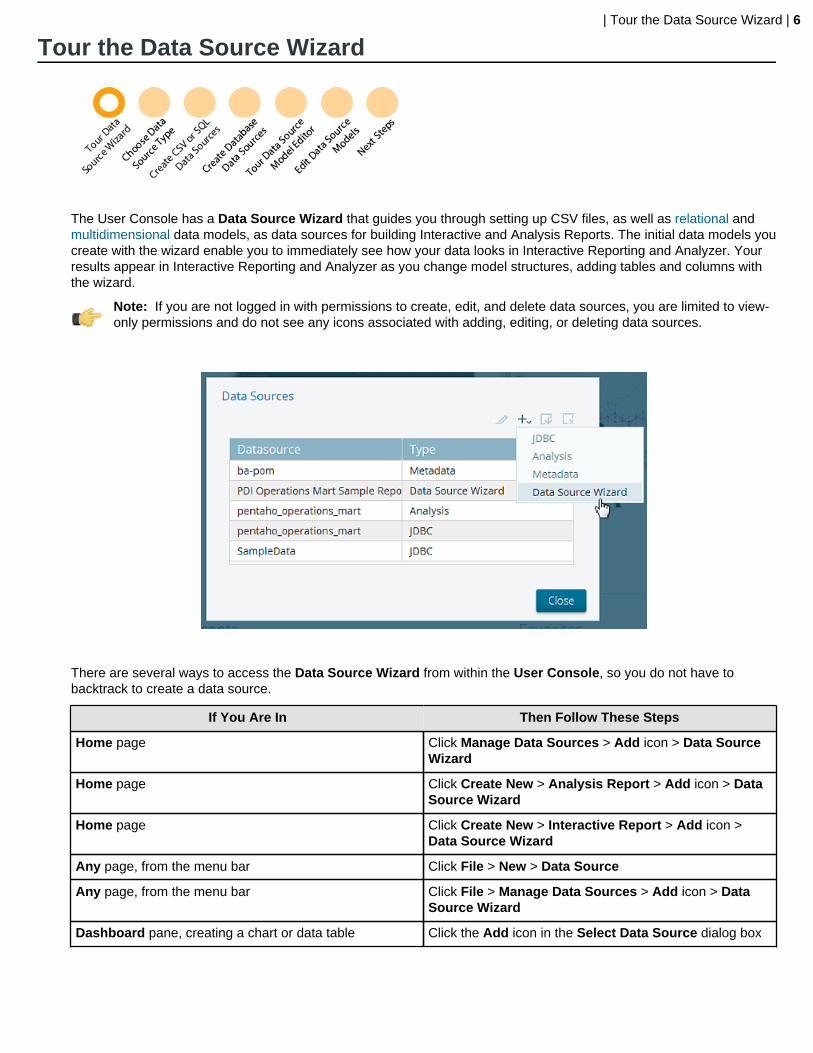
The User Console has a Data Source Wizard that guides you through setting up CSV files, as well as relational andmultidimensional data models, as data sources for building Interactive and Analysis Reports. The initial data models youcreate with the wizard enable you to immediately see how your data looks in Interactive Reporting and Analyzer. Yourresults appear in Interactive Reporting and Analyzer as you change model structures, adding tables and columns withthe wizard.
Note: If you are not logged in with permissions to create, edit, and delete data sources, you are limited to view-only permissions and do not see any icons associated with adding, editing, or deleting data sources.
There are several ways to access the Data Source Wizard from within the User Console, so you do not have tobacktrack to create a data source.
If You Are In Then Follow These Steps
Home page Click Manage Data Sources > Add icon > Data SourceWizard
Home page Click Create New > Analysis Report > Add icon > DataSource Wizard
Home page Click Create New > Interactive Report > Add icon >Data Source Wizard
Any page, from the menu bar Click File > New > Data Source
Any page, from the menu bar Click File > Manage Data Sources > Add icon > DataSource Wizard
Dashboard pane, creating a chart or data table Click the Add icon in the Select Data Source dialog box
| Tour the Data Source Wizard | 7
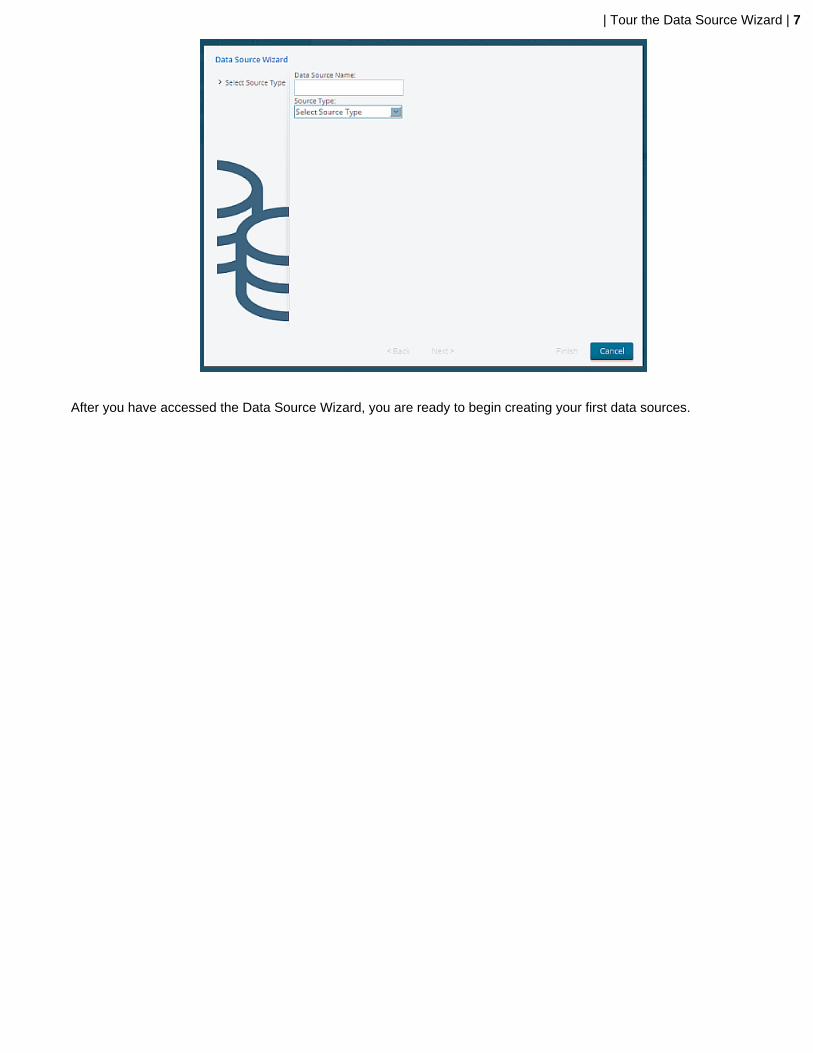
After you have accessed the Data Source Wizard, you are ready to begin creating your first data sources.

| Choose A Data Source Type | 8
Choose A Data Source Type
The Data Source Wizard supports several data source types for maximum flexibility. Each data source type is definedon where or how you store data. This table helps you decide which data source typed is best for you.
Table 1: Data Source Type Decision Table
Choose OptionsExploreConsiderations
CSV Files SQL Queries Database TableData Sources
Summary A file with data that isseparated by commas orsome other specified delimitercharacter.
You can save an Excelspreadsheet as a CSV fileand use this file to stage adatabase table in the BARepository. If the data in theCSV file changes, you haveto upload the updated filethrough the wizard again.
CSV files can be uploadeddirectly to the BA Repositorywithout a data connection.
This option creates amultidimensional model forAnalyzer only and a relationalmodel for Interactive Reports,Dashboard reports, andAnalyzer.
An SQL query written againsta relational database definesthe data you want to usein Interactive Reports orAnalyzer.
You can customize howcolumns are presented tousers who are building queriesagainst the new data source;for example, you definecolumn names and selectoptions that indicate how datais aggregated (sum, min.,max., etc.), and more.
This option creates amultidimensional model forAnalyzer only and a relationalmodel for Interactive Reports,Dashboard reports, andAnalyzer.
SQL Queries are used forprototyping, not for production.
Database Table Data Sourcesallow you to create relationaldatabase tables containingthe data you want to usein Interactive Reports orAnalyzer.
This data source typesupports a broad range ofuse cases including relationalreporting directly against anoperational data store (ODS)or creating a data source formultidimensional analysisagainst a star schema.
Database Table data sourcesare used in productionenvironments.
Expertise Knowledge of basic databasestructures.
Knowledge of basic databasestructures and SQL.
Knowledge of relational and/or multidimensional databasestructures.
Time Approximately 10 minutes Approximately 20 minutes Approximately 30 minutes to 1hour
Recommendation This data source makes iteasier to evaluate or createdevelopment prototypes.
This data source typeworks well when you areevaluating or creatingdevelopment prototypes.
SQL Queries are usedfor prototyping, not forproduction.
Use this data source forproduction.
To use it for evaluatingor creating developmentprototypes, limit the data inthe tables to sample datathat is representative ofyour production data.

| Choose A Data Source Type | 9
Choose OptionsExploreConsiderations
CSV Files SQL Queries Database TableData Sources
To use this data source inproduction, create the queryusing Metadata Editor.
| Create CSV Data Sources | 10
Create CSV Data Sources
Before you begin working with CSV data sources, there are a few key terms that you should know.
• Delimiter - a character, such as a comma, used to specify a boundary between separate regions in a data stream.• Enclosure - a container that holds a collection of other data objects.• Length - indicates the maximum number of characters allowed in a field.• Precision - the number of digits after a decimal point.
1. Login to the User Console as an administrator. Click Manage Data Sources.
The Data Sources window appears.
2. Click the Add icon, then choose Data Source Wizard from the drop-down menu.
3. Enter a name that identifies your new data source in the Data Source Name field.
The following characters are not allowed in Data Source Wizard source names:
$ < > ? &; # % ^ * ( ) ! ~ : ; [ ] { } |
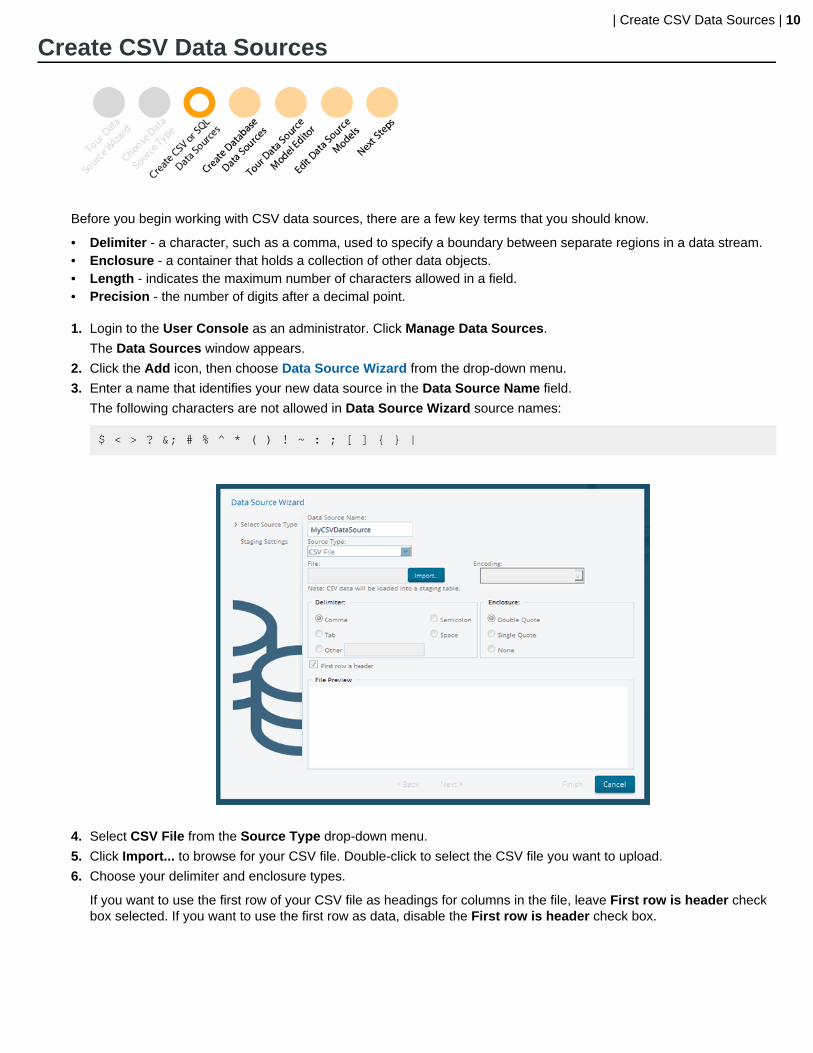
4. Select CSV File from the Source Type drop-down menu.
5. Click Import... to browse for your CSV file. Double-click to select the CSV file you want to upload.
6. Choose your delimiter and enclosure types.
If you want to use the first row of your CSV file as headings for columns in the file, leave First row is header checkbox selected. If you want to use the first row as data, disable the First row is header check box.
| Create CSV Data Sources | 11
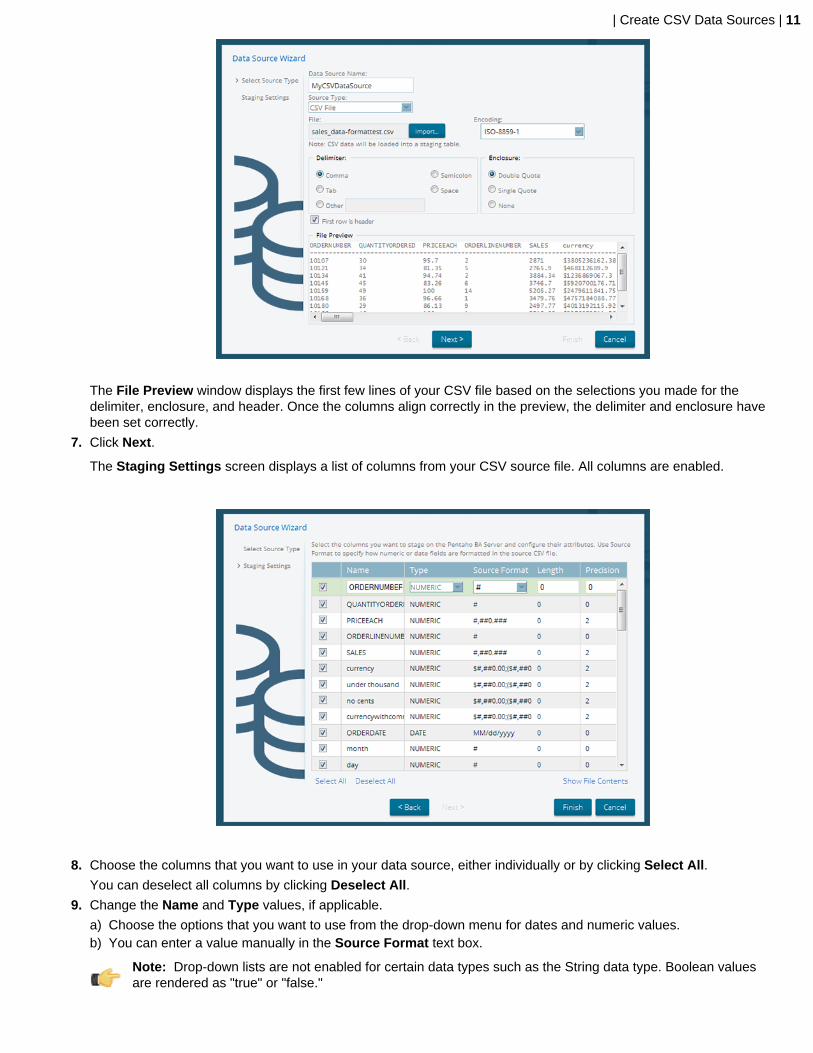
The File Preview window displays the first few lines of your CSV file based on the selections you made for thedelimiter, enclosure, and header. Once the columns align correctly in the preview, the delimiter and enclosure havebeen set correctly.
7. Click Next.
The Staging Settings screen displays a list of columns from your CSV source file. All columns are enabled.
8. Choose the columns that you want to use in your data source, either individually or by clicking Select All.
You can deselect all columns by clicking Deselect All.
9. Change the Name and Type values, if applicable.
a) Choose the options that you want to use from the drop-down menu for dates and numeric values.b) You can enter a value manually in the Source Format text box.
Note: Drop-down lists are not enabled for certain data types such as the String data type. Boolean valuesare rendered as "true" or "false."
| Create CSV Data Sources | 12
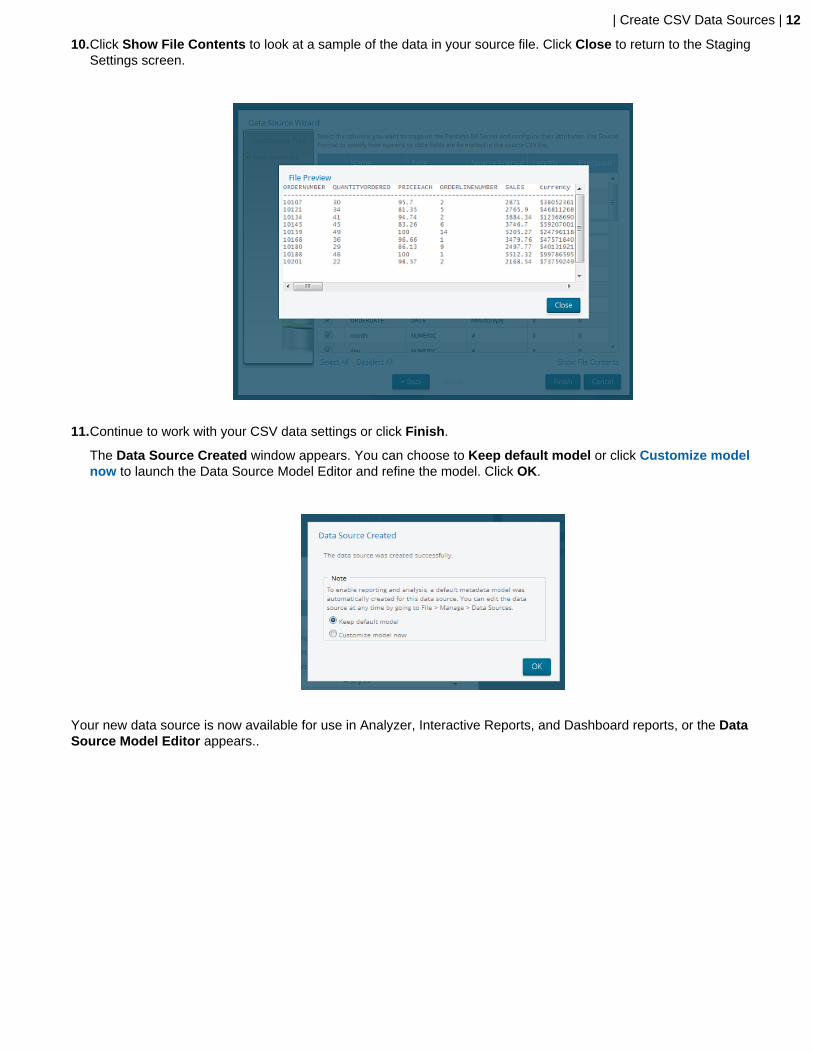
10.Click Show File Contents to look at a sample of the data in your source file. Click Close to return to the StagingSettings screen.
11.Continue to work with your CSV data settings or click Finish.
The Data Source Created window appears. You can choose to Keep default model or click Customize modelnow to launch the Data Source Model Editor and refine the model. Click OK.
Your new data source is now available for use in Analyzer, Interactive Reports, and Dashboard reports, or the DataSource Model Editor appears..

| Create SQL Query Data Sources | 13
Create SQL Query Data Sources
Once you create the data source, it is available to users of Interactive Reports, Analyzer, and Dashboard reports.
1. Login to the User Console as an administrator. Click Manage Data Sources.
The Data Sources window appears.
2. Click the Add icon, then choose Data Source Wizard from the drop-down menu.
3. Enter a name that identifies your new data source in the Data Source Name field.
The following characters are not allowed in Data Source Wizard source names:
$ < > ? &; # % ^ * ( ) ! ~ : ; [ ] { } |
4. Select SQL Query from the Source Type drop-down menu. Click Next.
5. Select a database connection from the list, under Data Connection.
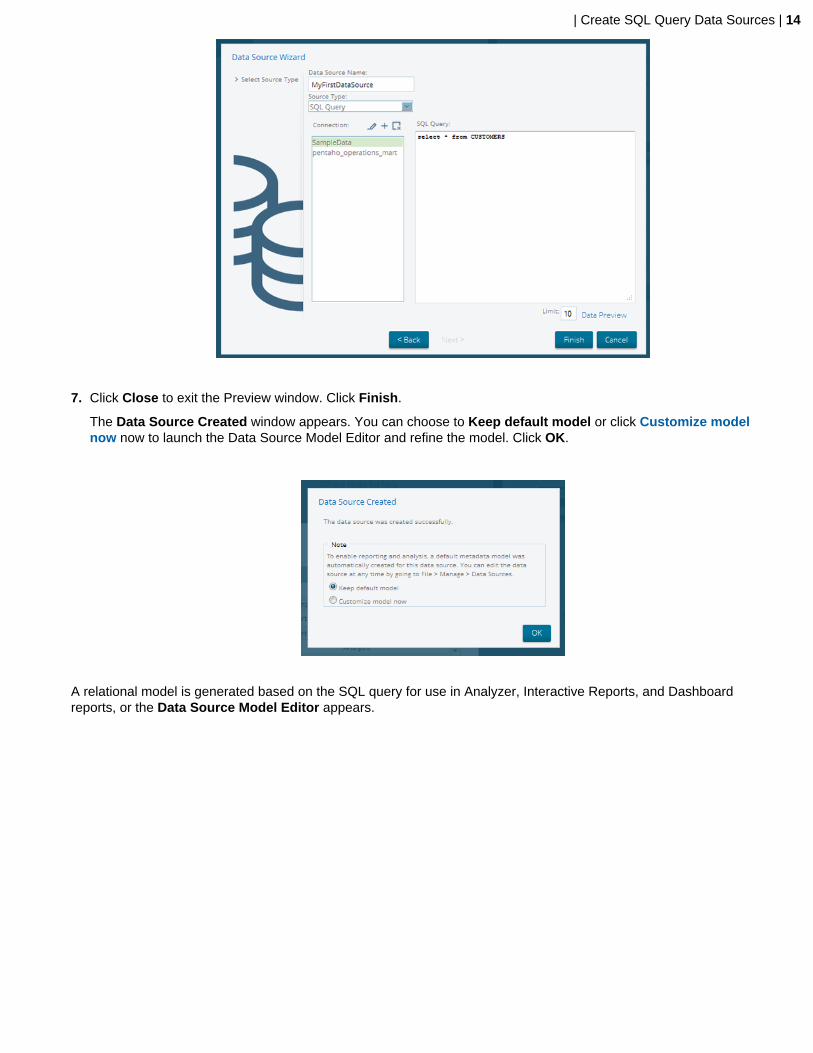
6. Enter your SQL Query in the SQL Query text field. Click Data Preview to make sure that your query returns data.The SQL query select * from CUSTOMERS is shown in this example.
| Create SQL Query Data Sources | 14
7. Click Close to exit the Preview window. Click Finish.
The Data Source Created window appears. You can choose to Keep default model or click Customize modelnow now to launch the Data Source Model Editor and refine the model. Click OK.
A relational model is generated based on the SQL query for use in Analyzer, Interactive Reports, and Dashboardreports, or the Data Source Model Editor appears.
| Create Database Sources | 15
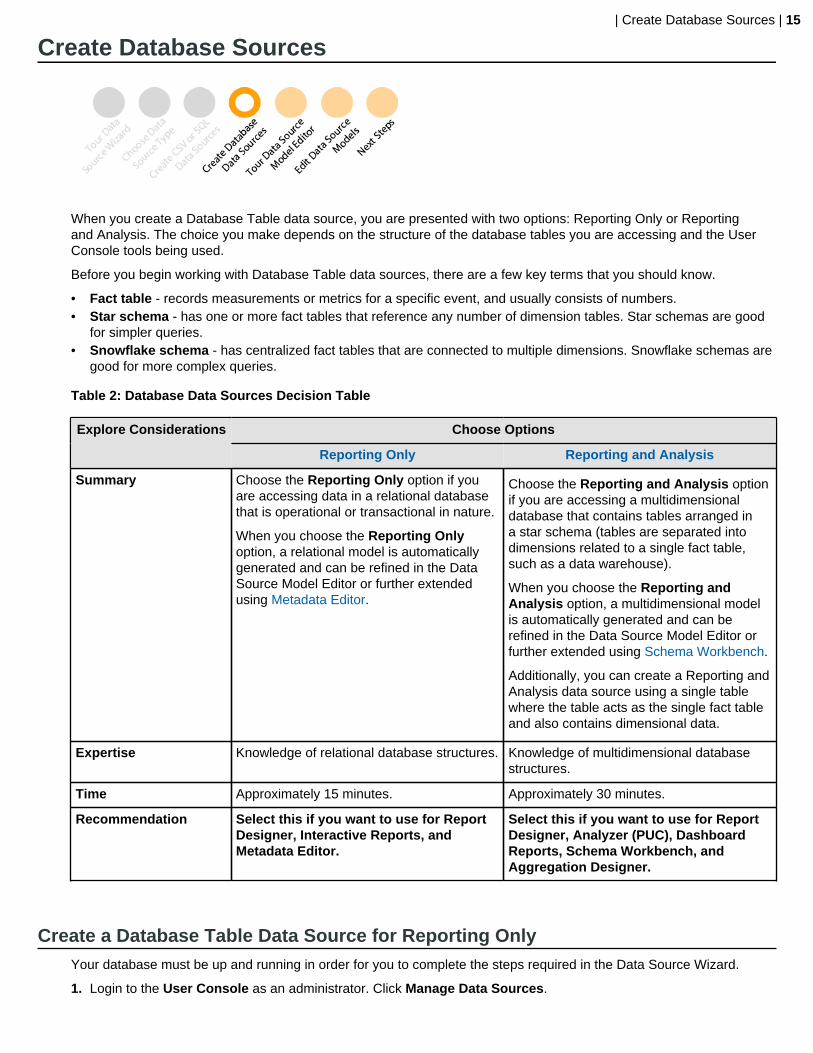
Create Database Sources
When you create a Database Table data source, you are presented with two options: Reporting Only or Reportingand Analysis. The choice you make depends on the structure of the database tables you are accessing and the UserConsole tools being used.
Before you begin working with Database Table data sources, there are a few key terms that you should know.
• Fact table - records measurements or metrics for a specific event, and usually consists of numbers.• Star schema - has one or more fact tables that reference any number of dimension tables. Star schemas are good
for simpler queries.• Snowflake schema - has centralized fact tables that are connected to multiple dimensions. Snowflake schemas are
good for more complex queries.
Table 2: Database Data Sources Decision Table
Choose OptionsExplore Considerations
Reporting Only Reporting and Analysis
Summary Choose the Reporting Only option if youare accessing data in a relational databasethat is operational or transactional in nature.
When you choose the Reporting Onlyoption, a relational model is automaticallygenerated and can be refined in the DataSource Model Editor or further extendedusing Metadata Editor.
Choose the Reporting and Analysis optionif you are accessing a multidimensionaldatabase that contains tables arranged ina star schema (tables are separated intodimensions related to a single fact table,such as a data warehouse).
When you choose the Reporting andAnalysis option, a multidimensional modelis automatically generated and can berefined in the Data Source Model Editor orfurther extended using Schema Workbench.
Additionally, you can create a Reporting andAnalysis data source using a single tablewhere the table acts as the single fact tableand also contains dimensional data.
Expertise Knowledge of relational database structures. Knowledge of multidimensional databasestructures.
Time Approximately 15 minutes. Approximately 30 minutes.
Recommendation Select this if you want to use for ReportDesigner, Interactive Reports, andMetadata Editor.
Select this if you want to use for ReportDesigner, Analyzer (PUC), DashboardReports, Schema Workbench, andAggregation Designer.
Create a Database Table Data Source for Reporting OnlyYour database must be up and running in order for you to complete the steps required in the Data Source Wizard.
1. Login to the User Console as an administrator. Click Manage Data Sources.

| Create Database Sources | 16
The Data Sources window appears.
2. Click the Add icon, then choose Data Source Wizard from the drop-down menu.
3. Enter a name that identifies your new data source in the Data Source Name field.
The following characters are not allowed in Data Source Wizard source names:
$ < > ? &; # % ^ * ( ) ! ~ : ; [ ] { } |
4. Select Database Table(s) from the Source Type drop-down menu. Under Connection, click to choose a databaseconnection.
5. Click to select the Reporting Only radio button. Click Next.
6. Choose a schema from the Schema drop-down menu.
A list of Available Tables appears.
| Create Database Sources | 17
7. Choose a table from Available Tables and click the right arrow (Add) to move the table into the Selected Tablesfield.
If you add a table you decide not to use, highlight the table and click the left arrow (Remove) to remove it from thelist of Selected Tables. To choose multiple tables, press the CTRL key down as you make your selections.
8. Click Next.
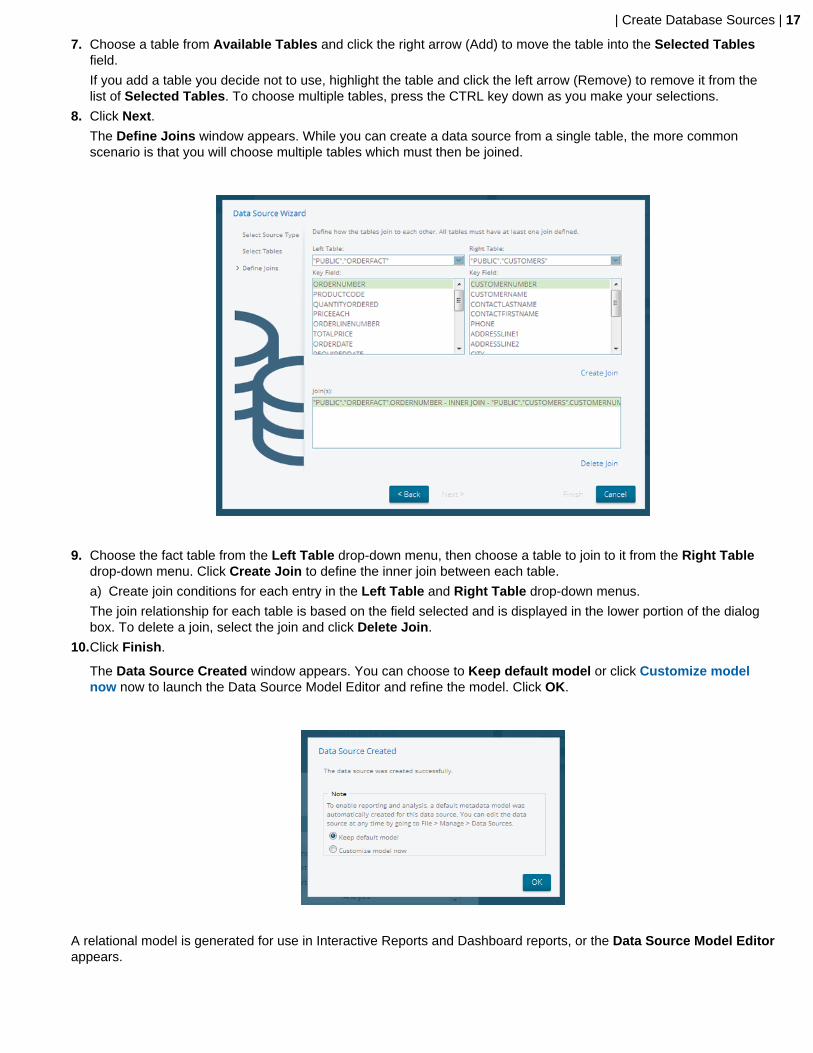
The Define Joins window appears. While you can create a data source from a single table, the more commonscenario is that you will choose multiple tables which must then be joined.
9. Choose the fact table from the Left Table drop-down menu, then choose a table to join to it from the Right Tabledrop-down menu. Click Create Join to define the inner join between each table.
a) Create join conditions for each entry in the Left Table and Right Table drop-down menus.
The join relationship for each table is based on the field selected and is displayed in the lower portion of the dialogbox. To delete a join, select the join and click Delete Join.
10.Click Finish.
The Data Source Created window appears. You can choose to Keep default model or click Customize modelnow now to launch the Data Source Model Editor and refine the model. Click OK.
A relational model is generated for use in Interactive Reports and Dashboard reports, or the Data Source Model Editorappears.
| Create Database Sources | 18
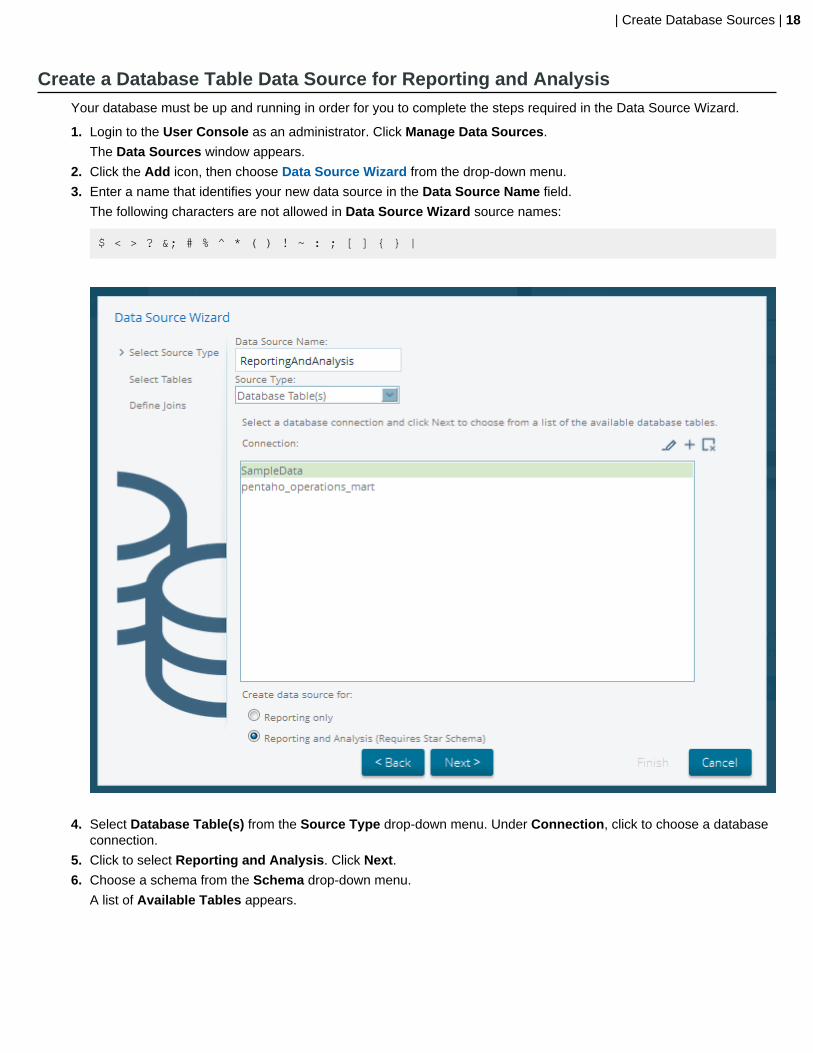
Create a Database Table Data Source for Reporting and AnalysisYour database must be up and running in order for you to complete the steps required in the Data Source Wizard.
1. Login to the User Console as an administrator. Click Manage Data Sources.
The Data Sources window appears.
2. Click the Add icon, then choose Data Source Wizard from the drop-down menu.
3. Enter a name that identifies your new data source in the Data Source Name field.
The following characters are not allowed in Data Source Wizard source names:
$ < > ? &; # % ^ * ( ) ! ~ : ; [ ] { } |
4. Select Database Table(s) from the Source Type drop-down menu. Under Connection, click to choose a databaseconnection.
5. Click to select Reporting and Analysis. Click Next.
6. Choose a schema from the Schema drop-down menu.
A list of Available Tables appears.
| Create Database Sources | 19
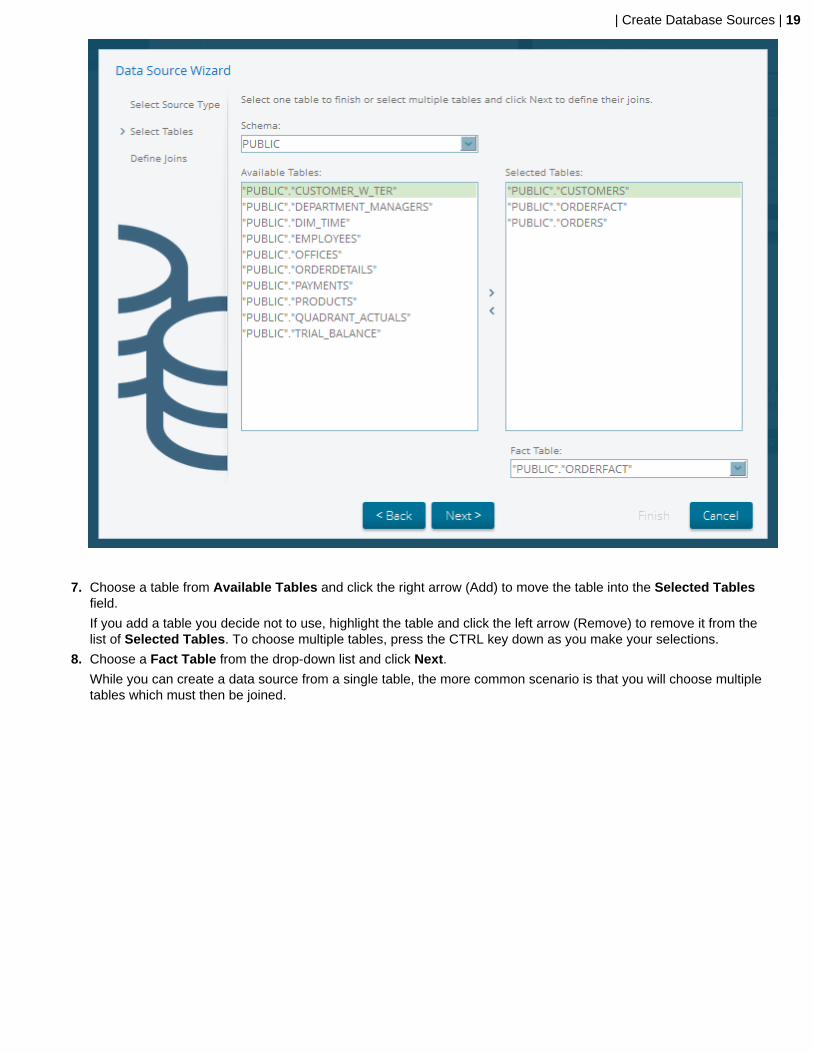
7. Choose a table from Available Tables and click the right arrow (Add) to move the table into the Selected Tablesfield.
If you add a table you decide not to use, highlight the table and click the left arrow (Remove) to remove it from thelist of Selected Tables. To choose multiple tables, press the CTRL key down as you make your selections.
8. Choose a Fact Table from the drop-down list and click Next.
While you can create a data source from a single table, the more common scenario is that you will choose multipletables which must then be joined.

| Create Database Sources | 20
9. Choose the fact table from the Left Table drop-down menu, then choose a table to join to it from the Right Tabledrop-down menu. Click Create Join to define the inner join between each table.
a) Create join conditions for each entry in the Left Table and Right Table drop-down menus.
The join relationship for each table is based on the field selected and is displayed in the lower portion of the dialogbox. To delete a join, select the join and click Delete Join.
10.Click Finish.
The Data Source Created window appears. You can choose to Keep default model or click Customize modelnow now to launch the Data Source Model Editor and refine the model. Click OK.
A multidimensional model is generated for use in Analyzer, Interactive Reports, and Dashboard reports, or the DataSource Model Editor appears.
| Tour the Data Source Model Editor | 21
Tour the Data Source Model Editor
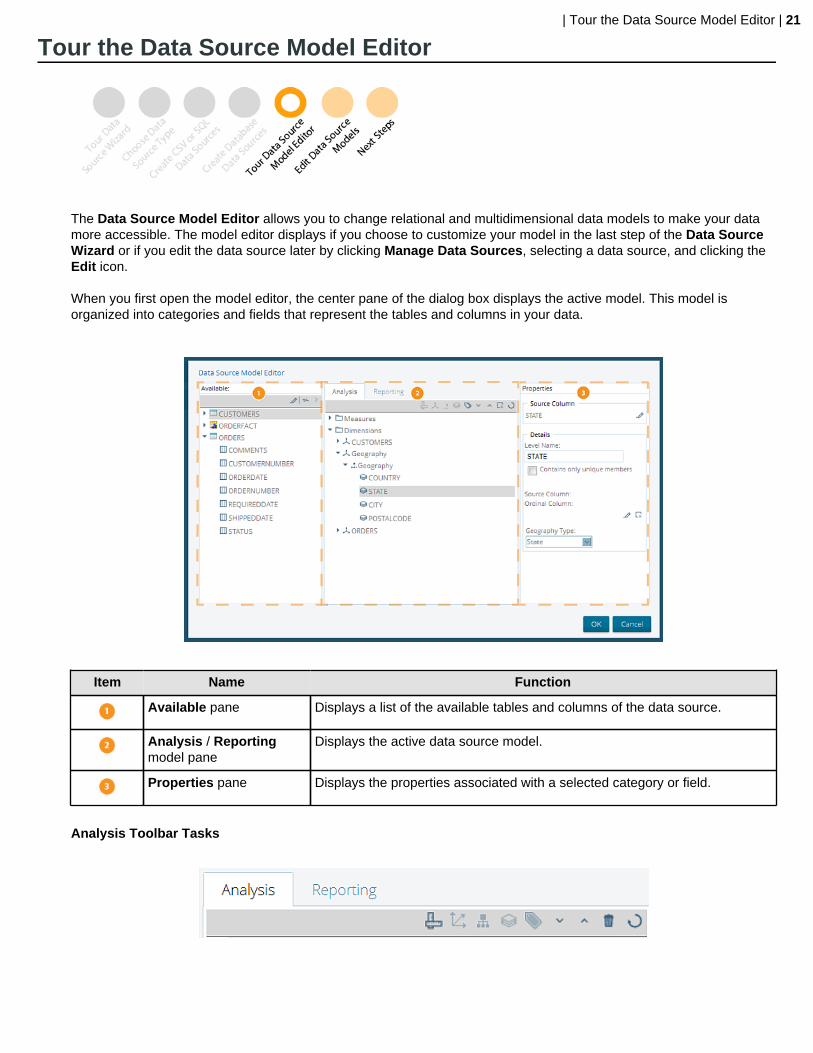
The Data Source Model Editor allows you to change relational and multidimensional data models to make your datamore accessible. The model editor displays if you choose to customize your model in the last step of the Data SourceWizard or if you edit the data source later by clicking Manage Data Sources, selecting a data source, and clicking theEdit icon.
When you first open the model editor, the center pane of the dialog box displays the active model. This model isorganized into categories and fields that represent the tables and columns in your data.
Item Name Function
Available pane Displays a list of the available tables and columns of the data source.
Analysis / Reportingmodel pane
Displays the active data source model.
Properties pane Displays the properties associated with a selected category or field.
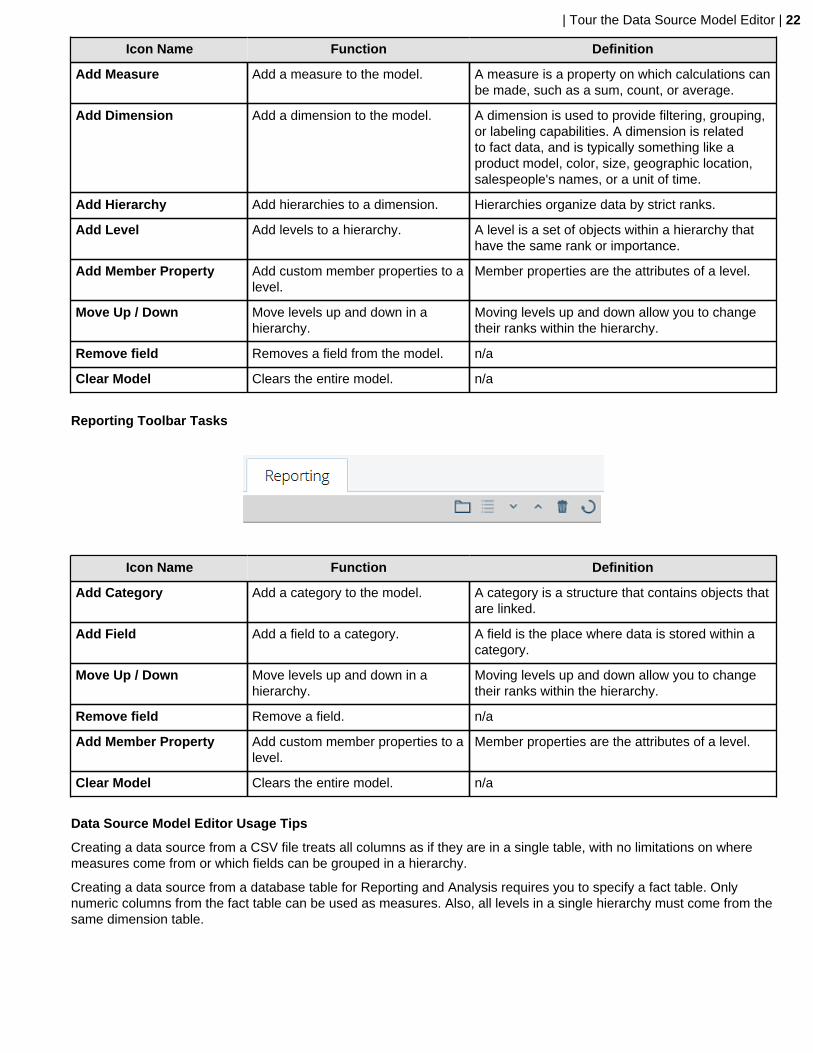
Analysis Toolbar Tasks
| Tour the Data Source Model Editor | 22
Icon Name Function Definition
Add Measure Add a measure to the model. A measure is a property on which calculations canbe made, such as a sum, count, or average.
Add Dimension Add a dimension to the model. A dimension is used to provide filtering, grouping,or labeling capabilities. A dimension is relatedto fact data, and is typically something like aproduct model, color, size, geographic location,salespeople's names, or a unit of time.
Add Hierarchy Add hierarchies to a dimension. Hierarchies organize data by strict ranks.
Add Level Add levels to a hierarchy. A level is a set of objects within a hierarchy thathave the same rank or importance.
Add Member Property Add custom member properties to alevel.
Member properties are the attributes of a level.
Move Up / Down Move levels up and down in ahierarchy.
Moving levels up and down allow you to changetheir ranks within the hierarchy.
Remove field Removes a field from the model. n/a
Clear Model Clears the entire model. n/a
Reporting Toolbar Tasks
Icon Name Function Definition
Add Category Add a category to the model. A category is a structure that contains objects thatare linked.
Add Field Add a field to a category. A field is the place where data is stored within acategory.
Move Up / Down Move levels up and down in ahierarchy.
Moving levels up and down allow you to changetheir ranks within the hierarchy.
Remove field Remove a field. n/a
Add Member Property Add custom member properties to alevel.
Member properties are the attributes of a level.
Clear Model Clears the entire model. n/a
Data Source Model Editor Usage Tips
Creating a data source from a CSV file treats all columns as if they are in a single table, with no limitations on wheremeasures come from or which fields can be grouped in a hierarchy.
Creating a data source from a database table for Reporting and Analysis requires you to specify a fact table. Onlynumeric columns from the fact table can be used as measures. Also, all levels in a single hierarchy must come from thesame dimension table.
| Edit Data Source Models | 23
Edit Data Source Models
The Data Source Model Editor guides you through editing relational and multidimensional models created using theData Source Wizard. The Data Source Model Editor gives you the ability to move fields by dragging them to theappropriate location, mix and match fields from different tables, add fields to more than one category, or remove a fieldaltogether.
You can edit the models with the Data Source Model Editor or use Schema Workbench or Metadata Editor for moreadvanced modifications.
Note: Relational and multidimensional models that have been edited in Metadata Editor and SchemaWorkbench can no longer be edited in the Data Source Model Editor.
Here are some things you can do to refine your relational and multidimensional data models with the Data SourceModel Editor.
• Edit a Data Source Model• Delete a Data Source• Add Member Properties
Here are some things that you can do specifically to refine your multidimensional data models.
• Assign Geographic Properties• Assign Time Dimension Properties• Use Ordinal Columns• Properties of Time Dimension Levels
Edit a Data Source ModelUse these steps to edit a data source model in the User Console.
1. Open the Data Source Model Editor by clicking Manage Data Sources, selecting a data source, and clicking theEdit icon.
The Data Source Model Editor appears.
2. Select the Reporting tab to edit a Reporting relational model, or the Analysis tab to edit the Analysismultidimensional model.
3. You can now edit the model or clear the model and start building a model from scratch.
For instance, you can choose a field and drag it to the appropriate folder on the Analysis/Reporting model pane.This causes that field to be displayed and used when designing reports.
4. Click OK when you are done editing your model.
The model builds and appears in the Data Source list.
Delete a Data SourceWhen you delete a data source, all reports or charts that end-users created using that data source no longer render.
1. Open the Data Sources window by clicking Manage Data Sources on the console Home page, selecting a datasource, and clicking the Edit icon.
2. Click on a data source in the list to highlight it.
3. Click on the Remove icon in the Data Sources tool bar.
| Edit Data Source Models | 24
The Remove Data Source window appears.
4. Click Remove to delete the data source.
If you choose not to delete the data source, you can click Cancel to exit the window.
The data source is removed and is no longer available to your users. All reports or charts using that data source nolonger work.
Add Member Properties to a LevelWithin the Data Source Model Editor, you can add member properties to any level of a data source model for use ingenerating Interactive and Analyzer Reports.
1. Click the Analysis tab.
2. Select a field from the Available pane to the Analysis pane.
3. With the field selected, click the Add Member Property icon.The New Member Property dialog appears.
4. Enter a name for the new member property. Click OK.
5. Set the source column for the new member property. Expand the level with new member property and choose themember property.A yellow caution icon appears next to the parent dimension, hierarchy, and level of the new child member property.The icon indicates you need to specify the source column for the new member properties before preceding.
6. Specify the source column for the new member property. Click Fix Missing Column.The Select Source Column dialog appears.
7. Chose a column from the available list. Click OK.
Edit Multidimensional Data Source ModelsFor multidimensional models, the Data Source Model Editor helps you add custom properties to a level, such asgeographic or time dimensions. You can also use the Data Source Model Editor to perform tasks such as moving fieldsby dragging them, setting properties to a measure, adding levels to a hierarchy, moving levels up and down within thehierarchy, and removing fields.
• Assign Geographic Properties• Assign Time Dimension Properties• Use Ordinal Columns• Properties of Time Dimension Levels
Assign Geographic Properties
Analyzer lets you visualize data on a geographic map. For common geography types, such as Country, State, City, orPostal Code, the Data Source Wizard automatically populates geographic parent-dimensions and subsequent child-levels to use in Analyzer.
To refine the use of Geography Map visualizations in Analyzer, you can associate custom data fields with aparticular geography type. After you identify the fields that represent a geography type, you can use Analyzer tovisualize this geographic information on a map.
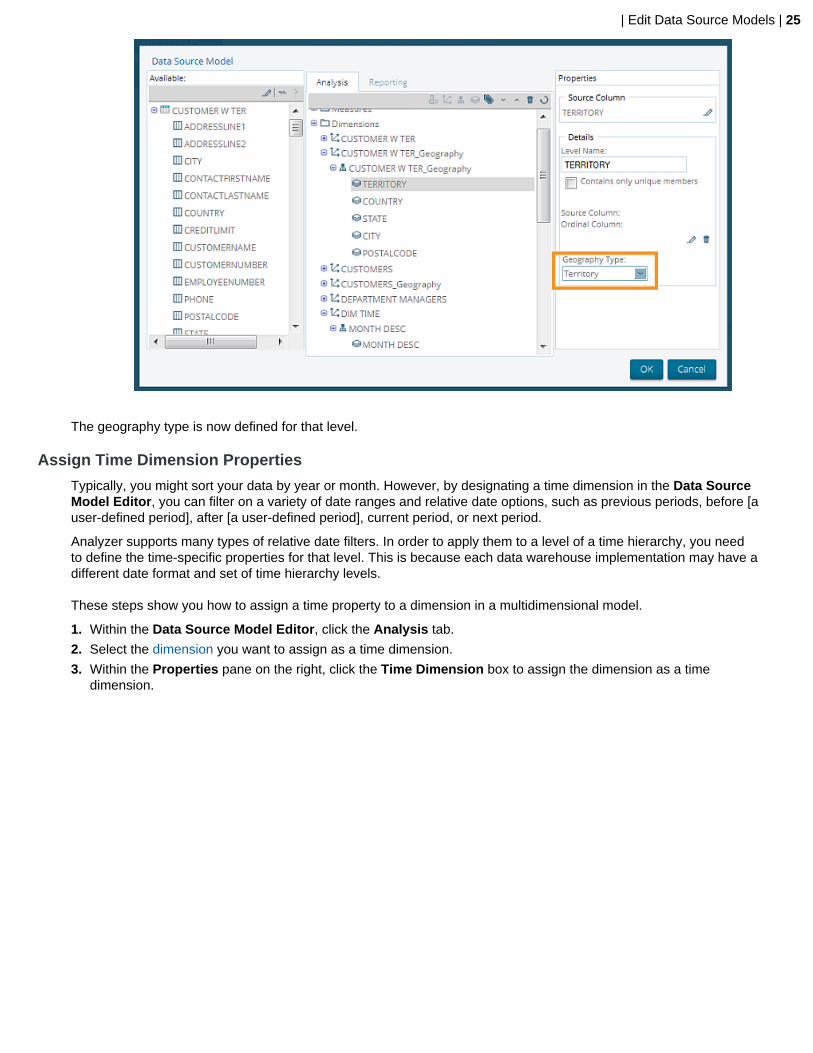
These steps show you how to assign geographic properties to a level with the User Console.
1. Within the Data Source Model Editor, click the Analysis tab.
2. Select each of the geographical levels individually and assign each level a Geography Type in the Propertiespane. This classifies the data with the correct geography type.
| Edit Data Source Models | 25
The geography type is now defined for that level.
Assign Time Dimension Properties
Typically, you might sort your data by year or month. However, by designating a time dimension in the Data SourceModel Editor, you can filter on a variety of date ranges and relative date options, such as previous periods, before [auser-defined period], after [a user-defined period], current period, or next period.
Analyzer supports many types of relative date filters. In order to apply them to a level of a time hierarchy, you needto define the time-specific properties for that level. This is because each data warehouse implementation may have adifferent date format and set of time hierarchy levels.
These steps show you how to assign a time property to a dimension in a multidimensional model.
1. Within the Data Source Model Editor, click the Analysis tab.
2. Select the dimension you want to assign as a time dimension.
3. Within the Properties pane on the right, click the Time Dimension box to assign the dimension as a timedimension.

| Edit Data Source Models | 26
4. Expand the dimension to display its hierarchy, then expand the hierarchy to display its levels. Choose the level forwhich you want to assign time dimension properties. The properties of the level display in the Properties pane.
The options for Time Level Type and Source Column Format do not display for a child-level if the time dimensionproperty is not set for its parent-dimension.
5. Set the Time Level Type and Source Column Format to match the format of your data.
The Time Level Type and Source Column Format must match the format of the data stored in your data source forrelative date filtering to work properly in Analyzer. This does not effect how your values display. For more informationregarding the time level types and formats, see the section Properties of Time Dimension Levels.
| Edit Data Source Models | 27
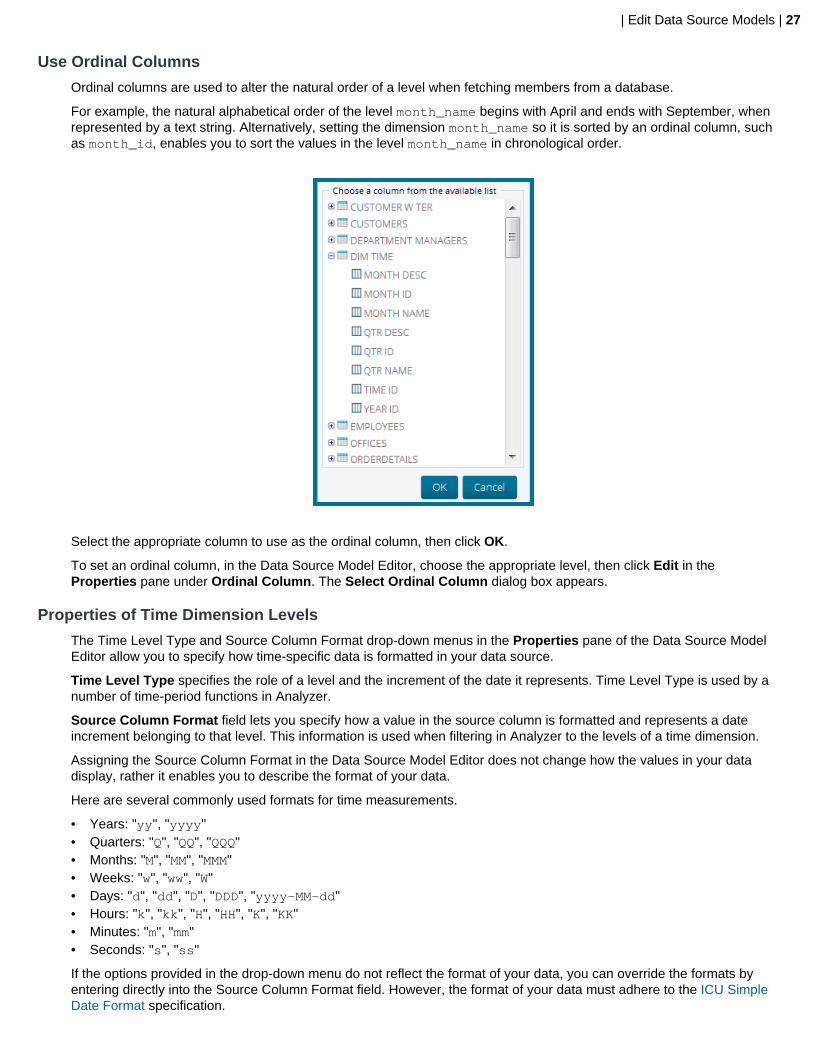
Use Ordinal Columns
Ordinal columns are used to alter the natural order of a level when fetching members from a database.
For example, the natural alphabetical order of the level month_name begins with April and ends with September, whenrepresented by a text string. Alternatively, setting the dimension month_name so it is sorted by an ordinal column, suchas month_id, enables you to sort the values in the level month_name in chronological order.
Select the appropriate column to use as the ordinal column, then click OK.
To set an ordinal column, in the Data Source Model Editor, choose the appropriate level, then click Edit in theProperties pane under Ordinal Column. The Select Ordinal Column dialog box appears.
Properties of Time Dimension Levels
The Time Level Type and Source Column Format drop-down menus in the Properties pane of the Data Source ModelEditor allow you to specify how time-specific data is formatted in your data source.
Time Level Type specifies the role of a level and the increment of the date it represents. Time Level Type is used by anumber of time-period functions in Analyzer.
Source Column Format field lets you specify how a value in the source column is formatted and represents a dateincrement belonging to that level. This information is used when filtering in Analyzer to the levels of a time dimension.
Assigning the Source Column Format in the Data Source Model Editor does not change how the values in your datadisplay, rather it enables you to describe the format of your data.
Here are several commonly used formats for time measurements.
• Years: "yy", "yyyy"• Quarters: "Q", "QQ", "QQQ"• Months: "M", "MM", "MMM"• Weeks: "w", "ww", "W"• Days: "d", "dd", "D", "DDD", "yyyy-MM-dd"• Hours: "k", "kk", "H", "HH", "K", "KK"• Minutes: "m", "mm"• Seconds: "s", "ss"
If the options provided in the drop-down menu do not reflect the format of your data, you can override the formats byentering directly into the Source Column Format field. However, the format of your data must adhere to the ICU SimpleDate Format specification.

| Edit Data Source Models | 28
For instance, a level may have Quarters as Time Level Type, indicating the level corresponds to quarter dateincrements. If that value is represented by the numbers 1 through 4, you would set the Source Column Format as Q.
Alternatively, the same increment could also be represented as strings Q1, Q2, Q3, and Q4. In this case you specify theSource Column Format with the value 'Q'Q. The first 'Q' indicates a string, while the second, unquoted Q represents anumerical value, 1 through 4.
Or, your source column could contain values like 2001-Q1, 2001-Q2, 2001-Q3, 2001-Q4, in which case you wouldinput yyyy-'Q'Q into the Source Column Format field.
| Next Steps | 29
Next Steps
After you have finished creating your first data models, you are ready to learn how to create web-based interactive andanalysis reports.
Learn More
• The Create and Refine Advanced Data Models section of the Pentaho InfoCenter provides information on usingMetadata Editor, Schema Workbench, and Aggregation Designer to work with relational and multi-dimensionalmodels for production environments.
• Create Analysis, Interactive Reports, and Dashboards provides in-depth details about creating eye-catchingbusiness intelligence deliverables for your user community.
• The Build Full-Featured Solutions section of the Pentaho InfoCenter contains a large number of topics on workingwith the BA Suite. Here you can learn about defining data models, fine-tuning your reports, how to create print-quality reports, or work with Big Data.
• Work with Big Data tells you how to use big data as a data source.


![[ Getting Acquainted with Pentaho Components ]reportes.fuxionbiotech.com/pentaho/docs/components.pdf · [ Getting Acquainted with Pentaho Components ]] ... Pentaho BA Suite helps](https://img.dokumen.tips/doc/110x75/5ad7ac027f8b9a991b8c5bad/-getting-acquainted-with-pentaho-components-getting-acquainted-with-pentaho-components.jpg)