Embed Size (px)
Citation preview

1663
DEFENSIVE MANAGEMENT: DOES THE SARBANES-OXLEY ACT DISCOURAGE CORPORATE RISK-TAKING?
Kate Litvak*
This Article uses a natural experiment to test whether the Sarbanes-Oxley Act of 2002 (“SOX”) may have induced managers to take fewer risks. Because SOX applies to all U.S. public companies, a U.S.-based test cannot rule out other possible causes of changes in risk levels. A cleaner test is available for cross-listed foreign firms: SOX applies to firms cross-listed in the United States on levels 2 and 3 (“level-23”), but not to firms cross-listed on levels 1 and 4 (“level-14”) or to foreign non-cross-listed firms. I use a triple difference methodology to estimate the effect of SOX on risk-taking by level-23 cross-listed firms. I match each cross-listed firm to a similar non-cross-listed firm from the same country based on propensity to cross list. I measure the pair risk—the difference between the risk of a cross-listed firm and the risk of its match (first difference). Then, I es-timate the after-minus-before SOX change in pair risk (second differ-ence). Finally, I compare the after-minus-before changes in pair risk for level-23 pairs (where the cross-listed company is subject to SOX) to the change for level-14 pairs (where the cross-listed company is not subject to SOX) (third difference). I use four sets of proxies for risk: volatility of returns, balance sheet liquidity, financial leverage, and operating leverage. I find that the risk of level-23 firms declined sig-nificantly after SOX on all three measures: volatility and leverage de-clined, while balance sheet liquidity increased. She finds larger de-clines in risk for high-growth and high-Tobin’s Q firms, as well as firms whose Tobin’s Q declined more strongly during the period when SOX was adopted. This evidence is consistent with the view that SOX induced cross-listed firms to take fewer risks, and placed a particular burden on riskier and high-growth firms.
* Professor, Northwestern University School of Law. I am grateful to Bernie Black, Jonathan Macey, and the participants in annual meetings of the Society for Empirical Legal Studies, European Financial Management Association, Canadian Law and Economics Association, and the Ribstein Symposium at the University of Illinois in Urbana-Champaign for comments. Benjamin Allaire and Lori Stuntz provided excellent research assistance.

1664 UNIVERSITY OF ILLINOIS LAW REVIEW [Vol. 2014
TABLE OF CONTENTS I. INTRODUCTION ............................................................................... 1664 II. LITERATURE REVIEW .................................................................... 1671
A. Studies of U.S. Firms ............................................................... 1671 B. Studies of Cross-Listed Firms ................................................. 1673 C. SOX and Risk Taking ............................................................. 1674
III. HYPOTHESIS DEVELOPMENT ........................................................ 1675 IV. SAMPLE AND VARIABLES .............................................................. 1677
A. Sample and Propensity Matching .......................................... 1677 B. Variables ................................................................................... 1679
V. METHODOLOGY .................................................................................... 1680 A. Before-Versus-After Approach, Looking at Changes in
Risk ........................................................................................... 1681 B. Panel Data with “After-SOX” Dummy, Looking at
Changes in Risk ....................................................................... 1683 C. Panel Data, Looking at Changes in Firm Value ................... 1683
VI. RESULTS........................................................................................... 1683 A. Main Results: Post-SOX Changes in Risk-Taking ............... 1683 B. Factors Predicting Risk Changes ............................................ 1684
VII. CONCLUSIONS ................................................................................. 1685
I. INTRODUCTION
The Sarbanes-Oxley Act of 2002 (“SOX”)1 is commonly cited as the single most important U.S. business legislation since the 1930s.2 It regu-lates virtually every profession dealing with public corporations—corporate directors and officers, lawyers, accountants, auditors, securities analysts, financial advisors, and so forth. It affects financial market insti-tutions (stock exchanges, credit rating agencies, investment banks); in-dustry organizations (the American Institute of Certified Public Ac-countants, the Financial Accounting Standards Board), and government
1. Sarbanes-Oxley Act of 2002, Pub. L. No. 107-204, 116 Stat. 745 (codified in scattered sections of 11, 15, 18, 28, and 29 U.S.C.). 2. President George W. Bush stated that SOX contains “the most far-reaching reforms of American business practices since the time of Franklin Delano Roosevelt,” and opined that the day of its signing into law was a “historic occasion.” Even the critic of SOX Harvey Pitt, then the Chairman of the Securities and Exchange Commission, called it “a very important first step in restoring confi-dence.” See Elisabeth Bumiller, Corporate Conduct: The President; Bush Signs Bill Aimed at Fraud in Corporations, N.Y. TIMES (July 31, 2002), http://www.nytimes.com/2002/07/31/business/corporate-conduct-the-president-bush-signs-bill-aimed-at-fraud-in-corporations.html. Former SEC Commis-sioner Harvey Goldschmid called it the “most sweeping reform since the Depression-era securities laws.” Shanon D. Murray, Is SEC Ready for Its Own Sweeping Changes?, N.Y. L.J. (Aug 29, 2002), at 6.

No. 5] DEFENSIVE MANAGEMENT 1665
bodies (the Securities and Exchange Commission, the Federal Sentenc-ing Commission).
More than a decade after its adoption, SOX remains highly contro-versial. Businessmen mostly loathe it, and many academics concur.3 Ma-jor figures in the legal academy have labeled SOX as “quack corporate governance,”4 a “debacle,”5 and “deeply flawed . . . policies that have no empirical support or economic justification,”6 representing the point where “the costs of regulation clearly exceed its benefits,”7 with its pas-sage through the Congress called “Sudden Acute Regulatory Syn-drome,”8 “legislating in haste,”9 and “a hasty, panicked reaction of an electorate looking for an easy fix to the apparent ‘problem’ that stock prices go down as well as up.”10 A report by the Paulson Committee, an ad hoc Committee on Capital Markets Regulation created by Treasury Secretary Henry Paulson and staffed by prominent academics, argued that SOX is hurting the competitiveness of U.S.firms and stock markets.11
Not everyone shares this view. Prominent scholars in both law and finance have opined that the United States remains the leader in adopt-ing value-increasing corporate governance rules, that SOX did no harm to this status,12 and that compliance costs are coming down as companies and accountants gain experience with the new rules.13 Others saw value in SOX from the start, describing SOX as needed “damage control,”14 “a 3. See infra notes 4–11 and accompanying text. 4. Roberta Romano, The Sarbanes-Oxley Act and the Making of Quack Corporate Governance, 114 YALE L.J. 1521, 1521 (2005). 5. HENRY N. BUTLER & LARRY E. RIBSTEIN, THE SARBANES-OXLEY DEBACLE: WHAT WE’VE
LEARNED; HOW TO FIX IT 1 (2006). 6 Stephen M. Bainbridge, The Creeping Federalization of Corporate Law, REG., Spring 2003, at 26. 7. William J. Carney, The Costs of Being Public After Sarbanes-Oxley: The Irony of “Going Private,” 55 EMORY L.J. 141, 141 (2006). 8. Larry E. Ribstein, Sarbox: The Road to Nirvana, 2004 MICH. ST. L. REV. 279, 293; see also Larry E. Ribstein, Bubble Laws, 40 HOUS. L. REV. 77, 89 (2003) (“regulating in a panic”). 9. Stephen M. Bainbridge, Sarbanes-Oxley: Legislating in Haste, Repenting in Leisure (UCLA Sch. of Law, Law-Econ Research, Paper No. 06-14, 2006), available at http://ssrn.com/abstract=899593. 10. Robert W. Hamilton, The Crisis in Corporate Governance: 2002 Style, 40 HOUS. L. REV. 1, 49 (2003). 11. LUIGI ZINGALES ET AL., INTERIM REPORT, COMM. ON CAPITAL MKTS. REGULATION 5 (Nov. 30, 2006), http://www.capmktsreg.org/pdfs/11.30Committee_Interim_ReportREV2.pdf; see also Luigi Zingales, Is the U.S. Capital Market Losing its Competitive Edge? 11–14 (European Corporate Governance Inst., Paper No. 192, 2007), available at http://papers.ssrn.com/sol3/papers.cfm?abstract _id=1028701; MICHAEL BLOOMBERG & CHARLES SCHUMER, “SUSTAINING NEW YORK’S AND THE
U.S.’S GLOBAL FINANCIAL SERVICES LEADERSHIP” (January 22, 2007) (Mr. Bloomberg is the former Mayor of New York City and Mr. Schumer is the senior U. S. Senator from New York). 12. John C. Coffee, Jr., Law and the Market: The Impact of Enforcement (Ctr. for Law and Econ. Studies, Paper No. 304, 2007), available at http://ssrn.com/abstract=967482; Craig Doidge et al., Has New York Become Less Competitive in Global Markets? Evaluating Foreign Listing Choices over Time 43 (European Corporate Governance Inst., Paper No. 173, 2007), available at http://ssrn.com/abstract =982193. See also Robert A. Prentice & David B. Spence, Sarbanes-Oxley as Quack Corporate Gov-ernance: How Wise is the Received Wisdom? 63–64 (McCombs Sch. of Bus., Paper No. IROM-10-06, 2006), available at http://srn.com/abstract=945796. 13. E.g., John C. Coates, IV, The Goals and Promise of the Sarbanes-Oxley Act, 21 J. ECON. PERSPECTIVES 91, 91–116 (2007) (“Sarbanes-Oxley should bring net long-term benefits.”). 14. Larry Cata Backer, The Sarbanes-Oxley Act: Federalizing Norms for Officer, Lawyer, and Accountant Behavior, 76 ST. JOHN’S L. REV. 897, 951 (2002).
1666 UNIVERSITY OF ILLINOIS LAW REVIEW [Vol. 2014
step in the right direction,”15 and welcomed it for “helping to strengthen emerging norms of active monitoring by directors and officers.”16 Some scholars applauded SOX as benefiting not only “corporations and their shareholders but their constellation of constituents as well.”17 The crimi-nal provisions of SOX were expected to provide “powerful incentives for targets of criminal fraud investigations to help prosecutors build cases against other participants in the fraud.”18
Finally, some reactions were of the “much ado about nothing” vari-ety.
[The Act] reenacts in a new federal guise . . . existing federal regula-tions, state laws, stock exchange and securities industry rules, ac-counting or auditing practices, and corporate governance norms. These codifications do little more than shine a spotlight on some best practices, an important function but hardly reform of any sort, sweeping or otherwise.19
“As a practical matter, [SOX’s provisions on obstruction of justice] crim-inalize very little new conduct and therefore carry very little, if any, addi-tional deterrence benefit,” while “penalty enhancements seem unlikely to deter corporate crime to any greater degree than current provisions.”20
The debate between pro and con groups continues, fueled by the empirical evidence produced (mostly) in business schools. The winner, however, has failed to emerge: empirical evidence on the impact of SOX is mixed. Some studies find a variety of negative effects, while others find positive effects, no effects, or mixed effects.21
Two main problems make it difficult to conduct empirical studies of SOX and interpret their results. First, the costs and benefits of SOX are hard to quantify. For example, on the cost side, both supporters and op-ponents of SOX agree that the direct costs of new requirements (such as increased audit fees or management time directly devoted to the prepa-ration of compliance documents) are only a portion of overall compli-ance costs. The rest—and a major focus for critics—are hard-to-measure costs of what one can call defensive management—excessive caution and bureaucratism designed to avert SOX-related litigation or investigation. Examples include redundant meetings; unnecessary requests for outside opinions from bankers, consultants, and lawyers; excessive vetting of
15. Neil H. Aronson, Preventing Future Enrons: Implementing the Sarbanes-Oxley Act of 2002, 8 STAN. J.L., BUS. & FIN. 127, 153 (2002). 16. Brett McDonnell, Sarbanes-Oxley, Fiduciary Duties, and the Conduct of Officers and Direc-tors 2 (Univ. of Minn. Legal Studies Research Paper Series, Paper No. 04-13, 2004), available at http://ssrn.com/abstract=570321. 17. Lawrence E. Mitchell, The Sarbanes-Oxley Act and the Reinvention of Corporate Govern-ance?, 48 VILL. L. REV. 1189, 1192 (2003). 18. Kathleen F. Brickey, From Enron to Worldcom and Beyond: Life and Crime After Sarbanes-Oxley, 81 WASH. U. L. Q. 357, 360 (2003). 19. Lawrence A. Cunningham, The Sarbanes-Oxley Yawn: Heavy Rhetoric, Light Reform (And It Just Might Work), 35 CONN. L. REV. 915, 918 (2003). 20. Michael A. Perino, Enron's Legislative Aftermath: Some Reflections on the Deterrence As-pects of the Sarbanes-Oxley Act of 2002, 76 ST. JOHN'S L. REV. 671, 681, 685 (2002). 21. See infra Part II for a discussion on the rapidly growing empirical literature on SOX.
No. 5] DEFENSIVE MANAGEMENT 1667
communications through inside counsel; multiplication of internal ap-provals, and beefing up internal procedures beyond the point that would be cost-justified. Other forms of defensive management could include restructuring a business in a way that would make it look more familiar and thus less suspicious to auditors who must vouch for the adequacy of the firm’s internal controls; avoiding novel management techniques and compensation arrangements; retaining inefficient business practices be-cause new practices call for new internal controls, which must be docu-mented and then vetted by counsel and accountants;22 moving away from flexible, decentralized, and often ad hoc decision making toward slower, more bureaucratized procedures; and discouragement of entrepreneuri-alism and initiative.23 While many commentators agree that SOX trig-gered some degree of defensive management, they disagree on the sever-ity of the problem.24
At the same time, SOX’s potential benefits are hard to quantify as well. SOX may create value not only by directly reducing fraud, but also by allowing corporate insiders to credibly promise not to engage in fraud in the future, which may reduce the cost of capital today. Indeed, in-creased investor confidence is often listed as one of the major goals of SOX by politicians,25 regulators,26 academics,27 business leaders,28 and
22. See BUTLER & RIBSTEIN, supra note 5, at 44. 23. See, e.g., Peter Wallison, Op-Ed., Capital Complaints, WALL ST. J. (Mar. 20, 2007), http:// online.wsj.com/news/articles/SB117435768966942326. 24. See, e.g., Joel Seligman, No One Can Serve Two Masters: Corporate and Securities Law After Enron, 80 WASH. U.L.Q. 449, 516 (2002) (arguing that bureaucratization costs of SOX are modest compared to benefits); McDonnell, supra note 16 (same); Michael A. Perino, American Reform Abroad: Sarbanes-Oxley and the Foreign Private Issuer, 4 EUR. BUS. OWNERS L. R. 213, 238 (2003) (arguing SOX compliance costs are modest for foreign cross-listed companies); Carney, supra note 7 (costs of defensive management too high to justify benefits); Larry E. Ribstein, Sarbanes-Oxley after Three Years 7 (Univ. of Ill. Law and Econ., Paper No. LE05-016, 2005), available at http:// ssrn.com/abstract=746884 (same); Donald C. Langevoort, Internal Controls After Sarbanes-Oxley: Re-visiting Corporate Law’s “Duty of Care as Responsibility for Systems”, 31 J. CORP. L. 949 (2006) (close call). 25. See Mike Allen, Bush Signs Corporate Reforms into Law: President Says Era of ’False Prof-its’ is Over, WASH. POST (July 31, 2002), http://www.washingtonpost.com/wp-dyn/content/article/2008/ 11/25/AR2008112500829.html. 26. See, e.g., William H. Donaldson, Chairman, Testimony Concerning the Impact of the Sar-banes-Oxley Act Before the House Committee on Financial Services (Apr. 21, 2005) (“The goals of the Sarbanes-Oxley Act are far-reaching, and aim to restore investor confidence in and assure the in-tegrity of our markets.”), available at http://www.sec.gov/news/testimony/ts042105whd.htm. 27. See, e.g., Stephen Kwaku Asare et al., The Sarbanes-Oxley Act: Legal implications and Re-search Opportunities 82 (Bos. Coll. Law Sch. Legal Studies Research Series, Paper No. 122, 2007), available at http://ssrn.com/abstract=947356 (“Congress passed the [Sarbanes-Oxley] Act to rehabili-tate investor confidence.”); William W. Bratton, Enron, Sarbanes-Oxley and Accounting: Rules Versus Principles Versus Rents, 48 VILL. L. REV. 1023, 1023–24 (2003) (“[SOX was] intended to address the scandals and restore confidence in the securities markets.”); Zabihollah Rezaee & Pankaj K. Jain, The Sarbanes-Oxley Act of 2002 and Security Market Behavior: Early Evidence 1 (May 22, 2005) (un-published manuscript), available at http://ssrn.com/abstract=498083 (“To restore investor confidence and reinforce corporate accountability . . . Congress passed the Sarbanes-Oxley Act.”). 28. See, e.g., John J. Castellani, Testimony Before the Senate Committee on Banking, Housing and Urban Affairs (October 2, 2003), available at http://www.banking.senate.gov/public/index.cfm? FuseAction=Files.View&FileStore_id=bb9b151a-6f42-499c-b8cf-54611d8524c7 (commenting, in a tes-timony called “Implementation of the Sarbanes-Oxley Act and Restoring Investor Confidence,” that

1668 UNIVERSITY OF ILLINOIS LAW REVIEW [Vol. 2014
other commentators.29 And yet, measuring investor confidence is notori-ously hard.
One common solution to estimating the hard-to-quantify costs and benefits of new legislation is to measure market reaction. If causation can be established (a big “if” that I address below), a positive stock price movement when legislative events occur signals an overall positive inves-tor reaction. This approach, however, has a variety of weaknesses. First, it measures the overall investor reaction, but does not tell us what exactly investors liked or disliked. Second, market studies indicate investor reac-tion to new information, not investor reaction to legislation itself. At the extreme, even if investors view new legislation negatively, markets may still move positively on legislative news if investors expected the bill to be even worse than it turned out at to be. Finally, if investors misjudged the long-term effects of SOX, their short-term reactions may be an unre-liable guide to its actual effects.
A bigger problem for empirical studies of SOX is that we cannot re-liably establish causation. There is no control group: SOX applies to all U.S. public companies.30 Thus, even if we can quantify a post-SOX change in the behavior of U.S. firms, we cannot show a causal relation-ship because we cannot separate the effect of SOX from the effect of other contemporaneous events.
This Article makes two principal contributions to our understanding of the effects of SOX. First, it provides evidence in the form that is most useful to policy makers—on specific effects of SOX (rather than overall market reactions). Second, this Article examines the worldwide impact of SOX. Prior research on the effect of SOX on non-U.S. companies has concentrated on market reactions and decisions to enter or exit the U.S. market.31 This Article, in contrast, provides evidence on adaptive steps that companies around the world took in response to SOX.
The primary innovation of this Article is in its research design, which allows us to establish causation. As mentioned before, studies of SOX in U.S. firms face severe causation challenges because we do not have a baseline against which we can measure firms’ adoptive response. “[a]ll of us—Congress, the SEC, the securities markets and the corporate community—have worked hard to restore investor confidence over the past two years, and we are proud of those efforts.”). 29. See Paul Lowengrub, The Impact Of Sarbanes Oxley On Companies, Investors, & Financial Markets, SARBANES-OXLEY COMPLIANCE J. (Dec 6, 2005, 12:00 PM), http://www.s-ox.com/dsp_get FeaturesDetails.cfm?CID=1141 (“The primary goal of SOX was to help investor confidence in the public marketplace”). 30. Sarbanes-Oxley Act of 2002, Pub. L. 107-204, § 2(7). See also, Note, The Good, the Bad, and Their Corporate Codes of Ethics: Enron, Sarbanes-Oxley, and the Problems with Legislating Good Be-havior, 116 Harv. L. Rev. 2123, 2123 (2003). 31. See, e.g., Kate Litvak, The Effect of the Sarbanes-Oxley Act on Non-US Companies Cross-Listed in the US, 13 J. CORP. FIN. 195 (2007) [hereinafter Litvac, SOX Event Study]; see also Marcelo Bianconi et al., Firm Value, the Sarbanes-Oxley Act and Cross-Listing in the US, Germany and Hong Kong Destinations (working paper, 2010), available at http://ssrn.com/abstract=1373897; Peter Hostak et al., An Examination of the Impact of the Sarbanes-Oxley Act on the Attractiveness of US Capital Markets for Foreign Firms (working paper, 2009), available at http://ssrn.com/abstract=956020; Joseph D. Piotorski & Suraj Srinivasan, Regulation and Bonding: The Sarbanes-Oxley Act and the Flow of International Listings (working paper, 2008), available at http://ssrn.com/abstract=956987.

No. 5] DEFENSIVE MANAGEMENT 1669
I overcome this challenge by using a natural experiment that isolates the effects of SOX. SOX applies not only to all U.S. public companies, but also to foreign firms whose securities are traded on major U.S. exchang-es—that is, firms cross-listed on levels 2 or 3 (“level-23” firms).32 SOX does not apply to foreign firms whose securities are traded in the United States in the over-the-counter market or the “PORTAL” private place-ment market with shares available only to large institutions.33 These firms are said to be cross-listed on levels 1 or 4 (“level-14” firms). SOX and U.S. regulation also do not apply to foreign firms whose securities are not traded in the United States.34 Thus, while the effects of SOX cannot be cleanly tested for U.S. firms, a more reliable test is available for foreign firms subject to SOX. For cross-listed firms, we have a “treatment group” (level-23 firms)—to which the SOX “treatment” was applied. We also have two “control groups” to which this treatment was not applied—level-14 firms and non-cross-listed firms.
I match each foreign cross-listed firm to a non-cross-listed firm from the same country based on a measure of propensity to cross-list. I esti-mate the propensity to cross-list based on company-level characteristics, estimated at year-end of 2001, just before SOX was adopted: industry, market capitalization, growth rate, return on assets, leverage, and volatil-ity of returns. I then compute, for a variety of measures of risk, the “pair risk difference”—the difference between the risk of a cross-listed firm and the risk of its non-cross-listed match. This is the first difference in my overall “triple differences” approach. I then estimate the after-SOX (mean of 2003–2005) minus before-SOX (year-end 2001) changes in the pair risk difference. This is the second difference. Other country and firm-level factors that affect firms’ propensity to take risks, and, most importantly, affect the changes in this propensity over time for each firm, should be similar for a level-23 firm and its match. Thus, the second dif-ference provides a measure of the effect of SOX on risk-taking, net of changes due to these other factors.
Finally, I ask whether pair risk differences change differently for level-23 pairs than for level-14 pairs. This third difference controls for the possibility that the risk-taking behavior of level-23 firms changes, rel-
32. Sarbanes-Oxley Act of 2002, Pub. L. 107-204, § 2(7) (SOX applies to an “issuer”; this section defines “issuer” as “an issuer (as defined in section 3 of the Securities Exchange Act of 1934 (15 U.S.C. § 78c)), the securities of which are registered under section 12 of the Act (15 U.S.C. § 781), or that is required to file reports under section 15(d) (15 U.S.C. § 78o(d)), or that files or has filed a regis-tration statement that has not yet become effective under the Securities Act of 1933 (15 U.S.C. § 77a et seq.), and that it has not withdrawn.” Any foreign company that fits this definition is an “issuer” under SOX and is subject to its requirements.). 33. Securities traded on PORTAL are issued pursuant to Rule 144A, which exempts them from the registration requirement under the Securities Act, and therefore exempts them from being an “is-suer” under SOX. See generally 17 C.F.R. § 230.144A (2008). These securities are restricted a qualified institutional buyer (institutional investors that own and invest on a discretionary basis at least $100 million in securities of non-affiliates). 34. These securities are typically not registered with the SEC under section 12 of the Securities Act and are not required to file reports under section 15(d) of the Securities Act; therefore, they are not “issuers” for the purposes of SOX. See Sarbanes-Oxley Act of 2002, Pub. L. 107-204, § 2(7).

1670 UNIVERSITY OF ILLINOIS LAW REVIEW [Vol. 2014
ative to their matches, for reasons that reflect the general exposure of level-23 firms to U.S. securities markets, rather than their exposure to SOX, because the level-14 firms also are exposed to U.S. markets, but not to SOX. If level-23 firms change their risk levels relative to their matches, while level-14 firms do not, this is evidence that exposure to SOX is causing—not just correlating with—the changes in risk.
I use four principal sets of proxies for risk: (1) volatility of share re-turns, which is a standard measure of the riskiness of shares, and thus of the riskiness of the underlying business (measured separately as unsys-tematic risk, systematic risk, and total risk); (2) balance sheet liquidity (measured as quick ratio and current ratio; higher liquidity implies lower risk); (3) financial leverage (measured separately as total debt over book value of assets and total debt net of cash reserves over book value of as-sets; higher financial leverage implies higher risk), and (4) operating lev-erage (sensitivity of changes in earnings to changes in sales; higher oper-ating leverage implies higher risk). I find evidence, across all measures, that the pair difference in risk declined significantly after SOX for level-23 pairs and did not decline for level-14 pairs. This is consistent with the view that it is the exposure to U.S. laws, not merely exposure to U.S. cap-ital markets, that caused changes in firms’ risk taking.
I also investigate which firm-level and country-level factors predict cross-sectional differences in the changes in risk. For volatility, firms from countries with bad disclosure regimes experienced stronger reduc-tions in risk than firms from high-disclosing countries; larger firms expe-rienced smaller declines in total volatility, though this result is strong on-ly for the measure of total risk. For balance sheet liquidity, high growth firms, firms that had higher Tobin’s Q before SOX, and firms whose To-bin’s Q dropped more sharply during 2002 (when SOX was adopted) ex-perienced larger increases in liquidity (and therefore larger declines in risk). Finally, high growth firms experiences significant declines in lever-age.
These results are robust to a variety of alternative specifications, in-cluding studying firm-level instead of pair-level changes in risk measures, varying the definition of the “before” and “after” SOX periods, using country fixed effects (instead of my principal approach, which uses coun-try random effects). They are generally, though not completely, robust to changing my regression methodology.
This evidence is consistent with the critics’ view that SOX negative-ly affected corporate risk taking, and may have particularly affected high growth firms. It is also consistent with my related research on the reac-tions of investors in cross-listed firms. In that research, I use a similar triple differences methodology to conduct an event study of the signifi-cant events surrounding the adoption of SOX and its application to level-23 firms, and find a decline in share prices of level-23 firms, relative to
No. 5] DEFENSIVE MANAGEMENT 1671
level-14 firms and matching non-cross-listed firms.35 That decline is not thereafter reversed.36 Thus, investors in cross-listed firms reacted nega-tively to SOX when it was adopted, and appear not to have changed their views since. The analysis in this Article offers a possible explanation for why investors may have reacted negatively to SOX.
Corporate managers often complain about overregulation. They may be wrong some of the time, perhaps even much of the time. But when it comes to SOX, the evidence to date suggests that they just may be right.
Finally, some caveats and limitations. First, to create a clean exper-iment, I study only cross-listed companies. It is possible that U.S. firms reacted to SOX differently. The logic, however, behind why SOX might have induced managers of cross-listed firms to take less risk should apply to U.S. firms as well. Moreover, preliminary evidence from a contempo-raneous study of U.S. firms indicates that they too may have reduced risk levels after SOX.37 Second, I find that SOX is associated with significant reduction of corporate risk, but I cannot tell whether such reduction is good or bad. It is possible that firms took too much risk before SOX and have now brought their risk to the right level. Maybe “defensive man-agement,” like defensive driving, has a good side. Third, I study only risk taking. It is possible other features of SOX had beneficial effects on firm performance. Additional tailored, specific studies of changes in corpo-rate behavior are needed to adequately address this possibility.
II. LITERATURE REVIEW
A number of recent empirical studies have examined the conse-quences of SOX measured by a variety of indicators, for both U.S. and foreign firms.
A. Studies of U.S. Firms
The results from studies of U.S. firms are mixed. On the negative side, the costs of compliance are significant. Average audit fees and premia charged by the Big Four audit firms increased significantly, espe-
35. See Litvak, SOX Event Study, supra note 31, at 198–99. See also Xi Li, An Examination of the Impact of the Sarbanes-Oxley Act on Cross Listed Foreign Private Issuers and the Legal Bonding Hypothesis 25 (Mar. 5, 2011) (unpublished manuscript), available at http://ssrn.com/abstract=952433; Geoffrey P. Smith, A Look at the Impact of Sarbanes-Oxley on Cross-Listed Firms (working paper 2007). 36. Kate Litvak, Sarbanes-Oxley and the Cross-Listing Premium, 105 MICH. L. REV. 1857, 1897 (2007) [hereinafter, Litvak, SOX and Listing Premium in 2002]; Kate Litvak, Long-Term Effect of Sarbanes-Oxley on Cross-Listing Premia 5 (Univ. of Tex. Law School Law and Econ., Paper No. 107, 2007), available at http://ssrn.com/abstract=994583 [hereinafter, Litvak, Long-Term Effect of SOX through 2005]. But see Doidge et al., supra note 12, at 43–44 (finding no long term decline in cross-listing premium enjoyed by level-23 firms). 37. Leonce Bargeron et al., Sarbanes-Oxley and Corporate Risk-Taking 4 (June 18, 2007) (un-published manuscript), available at http://www.aei.org/files/2007/06/18/20070615_LehnSOX.pdf.

1672 UNIVERSITY OF ILLINOIS LAW REVIEW [Vol. 2014
cially for bigger and riskier clients. 38 Some companies, particularly small-er ones, responded to high auditor fees by dismissing top auditors and hiring cheaper ones.39 Internal auditing costs increased.40 Board of direc-tors costs rose, especially for small firms.41 It is unclear whether these ex-tra costs reduced overall earnings management: Cohen, Dey, and Lys found that after passage of SOX, accrual-based earnings management declined, but real earnings management increased. 42 SOX has not altered firms’ propensity to manipulate earnings through changes in their effec-tive tax rates.43
On the positive side, measures of share liquidity, such as bid-ask spreads and depth of the available supply of shares, which worsened dur-ing the pre-SOX financial scandals, improved after SOX, particularly for large firms.44 Both firms and their auditors identified more internal con-trol weaknesses than during the pre-SOX period.45 After SOX, firms’ propensity to manage earnings to meet or beat analyst expectations has declined.46 Insiders are less likely to trade in the period before their firm restates its financial results.47 Informativeness of accounting earnings improved.48
Findings on SOX’s effect on executive compensation are mostly positive. The ratio of incentive compensation to salary increased.49 The faster reporting of option grants required by SOX appears to have re-duced managerial timing of option grants. 50
38. See Sharad Asthana et al., The Effect of Enron, Andersen, and Sarbanes-Oxley on the Market for Audit Services (working paper, 2004), available at http://ssrn.com/abstract =560963. 39. See Michael L. Ettredge et al., Audit Fees and Auditor Dismissals in the Sarbanes-Oxley Era 13 (Sept. 17, 2009) (unpublished manuscript), available at http://ssrn.com/abstract=929486. 40. Susan W. Eldridge & Burch T. Kealey, SOX Costs: Auditor Attestation under Section 404 20–21 (June 13, 2005) (unpublished manuscript) available at http://ssrn.com/abstract=743285. 41. James S. Linck et al., The Effects and Unintended Consequences of the Sarbanes-Oxley Act, and its Era, on the Supply and Demand for Directors 34 (Feb. 4 2009) (unpublished manuscript), available at http://ssrn.com/abstract=902665. 42. Daniel A. Cohen et al., Real and Accrual-based Earnings Management in the Pre- and Post- Sarabanes Oxley Periods (Sept. 28, 2005) (unpublished manuscript), available at http://ssrn.com/ abstract=813088, at 18-20. 43. Kirsten A. Cook et al., Earnings Management Through Effective Tax Rates: The Effects of Tax Planning Investment and the Sarbanes-Oxley Act of 2002 18 (Feb. 26, 2008) (unpublished manu-script), available at http://ssrn.com/abstract=897749. 44. See Pankaj K. Jain et al., Trends and Determinants of Market Liquidity in the Pre- and Post-Sarbanes-Oxley Act Periods 27 (January 20, 2004) (unpublished manuscript), available at http://ssrn. com/abstract=488142. 45. Yan Zhang et al., Audit Committee Quality, Auditor Independence, and Internal Control Weaknesses 26 (Apr. 22, 2006) (unpublished manuscript), available at http://ssrn.com/abstract=925732. 46. See Eli Bartov & Daniel A. Cohen, The “Numbers Game” in the Pre- and Post-Sarbanes-Oxley Eras 30 (Aug. 21, 2008) (unpublished manuscript), available at http://ssrn.com/abstract=954857. 47. Oliver Zhen Li & Yuan Zhang, Financial Restatement Announcements and Insider Trading (Sept. 12, 2006) (unpublished manuscript), available at http://ssrn.com/abstract=929539. 48. Jean Bédard, Sarbanes Oxley Internal Control Requirements and Earnings Quality 30 (Aug. 24, 2006) (unpublished manuscript), available at http://ssrn.com/abstract=926271. 49. Cohen et al., supra note 42, at 25–27. 50. See Lucian Arye Bebchuk et al., Lucky CEOs and Lucky Directors, 65 J. FIN. 2363, 2370–72 (2010); M.P. Narayanan & Hasan Nejat Seyhun, Effect of Sarbanes-Oxley Act on the Influencing of Executive Compensation 24 (Aug. 17, 2006) (unpublished manuscript), available at http://ssrn.com/ abstract=852964.

No. 5] DEFENSIVE MANAGEMENT 1673
Findings on the market reaction of U.S. firms are also mixed. In a much-cited article, Zhang found a significant decline in U.S. share prices during the events leading to the adoption of SOX.51 Others, using differ-ent methodologies and different control samples, have found that share prices increased.52 One study found that firms which had to make larger changes to comply with SOX reacted more positively than other firms, while a second reported that larger, older, and faster-growing firms re-acted to SOX-related information releases more negatively than other firms.53 Bond values declined around the SOX-related announcements.54
Some U.S. firms have apparently responded to SOX by removing themselves from its reach. The frequency of firms going private has in-creased,55 and SOX-imposed costs are cited as the primary reason, espe-cially by small firms.56 The rate of “going dark,” or ceasing to report to the Securities and Executive Commission (“SEC”), has increased as well.57 And private companies are now more likely to sell to private ac-quirers.58
B. Studies of Cross-Listed Firms
A much smaller set of studies have examined the effects of SOX on foreign cross-listed firms. Most found evidence of a negative investor re-action. Three event studies—my own and two others—estimated market reactions of investors of cross-listed firms to specific events leading to the adoption of SOX.59 All three concluded that investors of foreign compa-nies subject to SOX reacted strongly and negatively to SOX announce-ments, with estimated total losses of five to ten percent of market capital-ization, depending on specification.60
Four additional studies, my own among them, studied investors’ longer term reactions to SOX by investors of foreign cross-listed compa-
51. Ivy Xiying Zhang, Economic Consequences of the Sarbanes-Oxley Act of 2002, 44 J. ACCT. &
ECON. 74, 97 tbl. 2 (2007). 52. See Haidan Li et al., Market Reaction to Events Surrounding the Sarbanes-Oxley Act of 2002 and Earnings Management, 51 J.L. & ECON. 111, 122–25 (2008); Rezae & Jain, supra note 27, at 30–31. 53. Compare Vidhi Chhaochharia & Yaniv Grinstein, Corporate Governance and Firm Value: The Impact of the 2002 Governance Rules, 62 J. FIN. 1789, 1822 (2007), with M. Babajide Wintoki, Corporate Boards and Regulation: The Effect of the Sarbanes-Oxley Act and the Exchange Listing Re-quirements on Firm Value, 13 J. CORP. FIN. 229, 234 (2007). 54. Mark L. DeFond et al., Was the Sarbanes-Oxley Act Good News for Corporate Bondholders? 25 ACCT. HORIZONS 465, 483 (2011). 55. Ellen Engel et al., The Sarbanes-Oxley Act and Firms' Going-Private Decisions, 44 J. ACCT. & ECON. 116, 126, 142–43 (2007). 56. Stanley B. Block, The Latest Movement to Going Private: An Empirical Study, 14 J. APPLIED
FIN. 36, 37 (2004). 57. See Christian Leuz, et al., Why Do Firms Go Dark? Causes and Economic Consequences of Voluntary SEC Deregistrations, 45 J. ACCT. & ECON. 181, 195–96 (2008); András Marosi & Nadia Massoud, Why Do Firms Go Dark?, 42 J. FIN. & QUANTITATIVE ANALYSIS 421, 422 (2007). 58. Ehud Kamar et al., Going-Private Decisions and the Sarbanes-Oxley Act of 2002: A Cross-Country Analysis, 25 J.L. ECON. & ORG. 107, 129 (2008). 59. See generally Litvak, SOX Event Study, supra note 31; see also Li, supra note 35; Smith, supra note 35. 60. Litvak, SOX Event Study, supra note 31, at 210–26; see also Li, supra note 35, at 2.

1674 UNIVERSITY OF ILLINOIS LAW REVIEW [Vol. 2014
nies. Three of the four concluded that investors did not like SOX when it was adopted, and apparently have not changed their minds since.61 One study found that investors reacted to SOX negatively in 2002, but share prices rebounded the following year.62
U.S. firms cannot both stay public and avoid SOX. Foreign firms sometimes can—by delisting if they are already cross-listed, or by choos-ing to cross-list in a form that does not subject them to SOX.63 Delistings, which were negligible prior to SOX, have increased, and foreign compa-nies, especially smaller and less profitable ones, are more likely to bypass U.S. exchanges in favor of London’s Alternative Investment Market.64
Of course, the fact that foreign firms now increasingly avoid U.S. markets might mean that those firms are fleeing high quality corporate governance, rather than fleeing high costs. Two studies, using different samples and techniques, studied firms’ delisting decisions and reach op-posite conclusions. Hostak and coauthors found a negative investor re-action to delisting, and inferred that delisting decisions are motivated by controllers’ strive to preserve rents, which would be reduced by SOX.65 But Li found negative market reaction before SOX and positive reaction after SOX, concluding that firms’ delisting decisions previously used to harm investors, but since the SOX adoption, benefit them. 66
C. SOX and Risk Taking
To the best of my knowledge, there are two papers that address the impact of SOX on corporate risk taking. Both papers studied U.S. firms, suffer from an inability to isolate the effect of SOX, and thus cannot credibly establish causation. Kang and Liu examined U.S.-based firms and measured risk based on the “hurdle rate” that managers use to make investment decisions.67 A higher hurdle rate imposes more severe re-strictions on a firm’s ability to invest and therefore reduces its risk level. The authors found that hurdle rates increased after the adoption of SOX, particularly for more profitable, less risky, and better governed firms.68 Bargeron, Lehn, and Zutter69 compared changes in risk levels of U.S. and
61. Litvak, SOX and Listing Premium in 2002, supra note 36, at 1897–98 (measuring investor reaction through the end of 2002); Litvak, Long-Term Effect of SOX through 2005, supra note 36, at 23–24 (measuring investor reaction through the end of 2005); Luigi Zingales, Is the U.S. Capital Mar-ket Losing Its Competitive Edge? 22–23 (ECGI Working Papers Series in Finance, Paper No. 192, 2007), available at http://ssrn.com/abstract=1028701. 62. Doidge et al., supra note 12, at 49 fig.2. 63. See generally Sarbanes-Oxley Act of 2002, Pub. L. 107-204, § 2(7). 64. Doidge et al., supra note 12, at 420; Joseph D. Piotroski & Suraj Srinivasan, Regulation and Bonding: The Sarbanes-Oxley Act and the Flow of International Listings, 46 J. ACCT. RES. 383, 414 (2007). 65. Ivy Xiying Zhang, Economic Consequences of the Sarbanes-Oxley Act of 2002, 44 J. ACCT. &
ECON. 74, 97 tbl. 2 (2007). 66. Li, supra note 35, at 4. 67. Qiang Kang et al., The Sarbanes-Oxley Act and Corporate Investment: A Structural Assess-ment, 96 J. FIN. ECON. 291, 294 (2010). 68. Id. at 304. 69. Bargeron et al., supra note 37.

No. 5] DEFENSIVE MANAGEMENT 1675
U.K. firms. They found that compared to U.K. firms, U.S. firms signifi-cantly reduced their research and development (“R&D”) and capital ex-penditures, increased their cash holdings, and that the probability of new cross-listings declined particularly for high-R&D firms.70
In this Article, I focus on foreign rather than U.S. firms, use a dif-ferent methodology that allows me to establish a control group and therefore control for contemporaneous events, and employ more measures of risk. Still, the results of all three articles are broadly con-sistent, which likely increases the reliability of each.
III. HYPOTHESIS DEVELOPMENT
SOX may have affected corporate risk taking through several chan-nels. Some channels predict less risk taking, others predict more. On the risk reduction side, there is the potential for both direct and indirect channels. One direct channel: increased penalties (both against individ-ual managers and against the firm) for misstatements in disclosures and insufficient internal controls could dampen managers’ incentives to pur-sue novel or controversial strategies or invest in R&D and other hard-to-value assets.71 Indeed, U.S. firms significantly reduced their investment in R&D after SOX.72 Second, SOX section 304 requires the forfeiture of management’s bonuses, stock option gains, and other profits when a cor-poration restates its financials; this could induce firms to increase the riskless portion of executive compensation and reduce the risky portion;73 lesser incentives could lead managers to take fewer risks.
There are also potential indirect channels. One is a general bureau-cratization of corporate decision making brought by provisions requiring information flows between the corporation and its auditors (section 302)74 and attorneys (section 307),75 auditor review of internal controls requirements (section 404),76 and so forth.77 A second is the increased power of independent directors.78 This could increase the numbers of necessary approvals and intensify management’s need to document its actions, leading to delays and reducing opportunities for risky, time-sensitive actions, as well as put more power in the hands of people who face litigation risk if a risky project fails, but often have limited stakes in the firm and hence little to gain if it succeeds.
On the other hand, there are also reasons to expect that SOX could increase risk taking of affected firms. Outside the SOX context, John, Litov, and Yeung find that improvements in investor protection tend to 70. Id. at 35. 71. Id. at 36–37. 72. Cohen et al., supra note 42, at 774 fig.4. 73. See id. at 785. 74. Sarbanes-Oxley Act of 2002, Pub. L. 107-204, § 302, 116 Stat. 745, 777–78. 75. Id. at § 307. 76. Id. at § 404. 77. See generally id. 78. Id. at § 301.

1676 UNIVERSITY OF ILLINOIS LAW REVIEW [Vol. 2014
increase firm riskiness.79 They explain this effect by noting that manage-rial perks are a priority claim over equity investors; thus, higher perks align management’s incentives with those of creditors.80 If SOX reduced opportunities for perks, we might expect increased risk taking. Still, the dominant policy concern is that SOX may have discouraged risk taking. I thus test:
Hypothesis 1: After the adoption of SOX, risk levels of level-23 cross-listed firms decline, compared to risk levels of similar firms from the same countries not subject to SOX.
I find, in my prior research on investors’ near-term reaction to SOX, that more profitable and higher-disclosing foreign firms, and firms from countries with higher levels of investor protection, experienced more sig-nificant declines in stock prices during events related to adoption of SOX and its applicability to foreign issuers, as well as larger declines in cross-listing premia during the year when SOX was adopted (2002).81 Similar cross-sectional effects have also been found in U.S. firms’ reaction to SOX.82 It is possible that part of the near term price decline reflected in-vestors anticipating future changes in firm behavior. If so, these firms may have experienced larger post-SOX changes in risk taking. I there-fore test:
Hypothesis 2a: After the adoption of SOX, risk levels of higher dis-closing level-23 firms decline more than risk levels of lower disclos-ing level-23 firms. Hypothesis 2b: After the adoption of SOX, risk levels of more prof-itable level-23 firms decline more than risk levels of less profitable level-23 firms. Hypothesis 2c: After the adoption of SOX, risk levels of level-23 firms with higher Tobin’s Q decline more than risk levels of firms with lower Tobin’s Q. Hypothesis 2d: After the adoption of SOX, risk levels of level-23 firms from better-governed countries decline more than risk levels of level-23 firms from poorly governed countries.
Several prior studies find that smaller firms reacted to SOX more strong-ly and more negatively than larger firms.83 This is usually explained by the economies of scale associated with SOX compliance. I therefore test:
Hypothesis 2e: After the adoption of SOX, risk levels of smaller level-23 firms decreased more than risk levels of larger level-23 firms.
In addition, level-23 firms whose prices declined more when SOX was adopted might reduce their risk levels more than firms whose prices de-clined less. This could reflect either investors anticipating the effect of
79. Kose John et al., Corporate Governance and Risk-Taking, 63 J. FIN. 1679, 1725 (2008). 80. Id. at 31. 81. See Litvak, SOX Event Study, supra note 31, at 226–27; Litvak, SOX and Listing Premium in 2002, supra note 36, at 1897–98. 82. See Chhaochharia & Grinstein, supra note 53, at 1822; Wintoki, supra note 53, at 247–48. 83. See Kamar et al., supra note 58, at 56; Linck et al., supra note 41, at 3324.

No. 5] DEFENSIVE MANAGEMENT 1677
SOX on firm behavior, or managers responding to the SOX-induced price decline by reducing risk taking. I therefore test:
Hypothesis 2f: After the adoption of SOX, risk levels of level-23 firms whose prices declined more when SOX was adopted decline more than risk levels of level-23 firms whose prices declined less when SOX was adopted.
An alternative way to present the relationship between risk and firm val-ue is to measure whether firms that were riskier before SOX experienced stronger declines in market value than less risky firms. I therefore test:
Hypothesis 3: After the adoption of SOX, cross-listing premia (dif-ference between Tobin’s Q of a cross-listed firm and Tobin’s Q of its match) of riskier firms declined more than cross-listing premia of less risky firms.
IV. SAMPLE AND VARIABLES
A. Sample and Propensity Matching
To construct a sample of cross-listed companies, I begin with a list of all foreign companies cross-listed in the United States on all levels of listing (OTC = level 1, NYSE, AMEX, and NASDAQ = levels 2 and 3, and PORTAL = level 4) for the full period from 2000 through 2004. Shares of foreign companies can be traded either directly or as American Depository Receipts (ADRs)—securities issued by depository banks and representing a share of a foreign stock (or its portion or multiple). To obtain the list of ADRs, I combine the Citigroup Universal Issuance Guide with the Citigroup Capital Raising database.84 I then cross-check and supplement the Citigroup dataset with the list of ADRs from the Bank of New York. 85 Information on securities traded directly on NYSE and NASDAQ is obtained from the exchanges’ websites.86 The infor-mation on securities traded over the counter (both directly and as ADRs) is obtained from websites of Pink Sheets87 and the OTC Bulletin Board.88 For companies that had several listing types, I assign the most regulated listing level. That is, if a company is traded on NYSE (“level 2”) and also over-the-counter (“level 1”), I treat it as a level 2 company.
I match the cross-listed firms onto the Datastream database, which contains share price and financial data. I keep only firms with full or par-tial financial data in each year from 2000–2004. I drop firms if key finan-cial or accounting variables (size, EBITDA, sales, debt) are missing for more than two years in the row. If a firm is missing data for a particular
84. Depositary Receipt Services, CITIGROUP, http://wwss.citiadr.idmanagedsolutions.com (last visited Sept. 15, 2014). 85. ADRs (Depositary Receipts): Global Investing & Personal Finance with BNY Mellon, BNY
MELLON, http://www.adrbnymellon.com (last visited Sept. 15, 2014). 86. NYSE EURONEXT, http://www.nyse.nyx.com (last visited Feb. 25, 2014); NASDAQ, http:// www.nasdaq.com/ (last visited Sept. 15, 2014). 87. OTCMARKETS, http://otcmarkets.com/home (last visited Sept. 15, 2014). 88. OTC Bulletin Board, OTCBB, http://www.otcbb.com/ (last visited Sept. 15, 2014).

1678 UNIVERSITY OF ILLINOIS LAW REVIEW [Vol. 2014
financial variable in a particular year, I assign the median value for that country, industry, and year.
I match each cross-listed firm with a non-cross-listed firm from the same country based on propensity to cross list (the predicted values from a logit model of a firm’s decision to cross-list). Let Di be a dummy varia-ble, which equals 1 if a firm is cross-listed on any level and 0 otherwise, and let Xi be a vector of firm-level variables. For each country with one or more cross-listed firms, I construct a sample of all firms from that country with full or substantially complete financial data included in Datastream in each year from 2000–2005. I then estimate a logit model as follows:
prob (Di = 1) = α + βi * Xi +εi The independent variables Xi are computed as of 2001 (just before
the year of SOX adoption) and include measures of firm market capitali-zation, industry, profitability, growth, leverage, and volatility; more spe-cifically, ln(market capitalization), two-digit NAICS industry code; re-turn on assets (EBITDA/total assets); geometric average sales growth from 1999–2001; total debt over book value of equity; and standard devi-ation of daily stock returns during 2000–2004.
I then use the coefficients from the logit regression to compute the probability of cross-listing E(Di) for each firm:
E(Di) = α + βi * Xi
Within each country, I match each cross-listed firm to its “nearest neigh-bor” in cross-listing propensity among the non-cross-listed firms, without replacement. This creates matched pairs of companies that are as similar as possible in characteristics that predict cross-listing. In robustness checks, I obtain similar results when, instead of matching on country and propensity to cross-list, I conduct a simpler sequential match: first, on country; then, on industry, and then, as close as possible in firm size (market capitalization).
The total number of cross-listed companies that satisfy the require-ments of this study is 1140, of which 426 are listed on levels-23 and 714 are listed on levels-14. After removing firms without sufficient financial data for 2000–2004, I am left with 940 cross-listed firms, of which 343 are level-23 and 597 are level-14. After matching them to non-cross-listed firms, I get 340 matched pairs on level-23 and 591 matched pairs for lev-el-14. Three level-23 firms and six level-14 firms did not have non-cross-listed matches in their home countries.
Table 1 provides summary statistics on cross-listed firms and match-ing non-cross-listed firms for each country. On average, cross-listed companies are larger than their matches, although this is not the case in all countries.

No. 5] DEFENSIVE MANAGEMENT 1679
B. Variables
I use the following measures of risk. Unsystematic, systematic, and total risk: total risk is measured as the
standard deviation of daily returns; systematic risk is the beta of the firm’s returns relative to a country index, computed from a standard market model of returns, and unsystematic risk is the standard deviation of the abnormal returns computed from the market model, each meas-ured separately for each year. The data availability ranges from 907 matched pairs in 2001 to 910 pairs in 2003 and 2004; 334 of these pairs are level-23. The country index is an equally weighted index of all non-cross-listed matching firms. The market model is:
ri,t = αi + βi * rm,t + εi,t
Here ri,t is the return to firm i on day t; rm,t is the return to the country in-dex for that firm on day t, βi is a measure of the firm’s systematic risk, and εi,t is the abnormal return to firm i on day t.89
Financial leverage #1 (total debt to equity): total debt divided by the book value of common equity, at the end of each year. The number of matched pairs with available data is 931 (342 on level-23).
Financial leverage #2 ((total debt minus cash) to equity): (the differ-ence between total debt and cash), divided by the book value of common equity, at the end of each year. This is an alternative measure of lever-age. The number of matched pairs is the same (931 on all levels; 342 on level-23).
Operating leverage: percent change in operating income divided by percent change in sales; as an alternative measure, percent change in EBIT divided by percent change in sales. The number of matched pairs is 870 (318 for level-23).
Liquidity #1 (current ratio): current assets divided by current liabili-ties at the end of each year. Data are available for 715 matched pairs (284 on level-23).
Liquidity #2 (quick ratio): current assets minus inventory, divided by current liabilities, at the end of each year. Data are available for 706 matched pairs (285 on level-23).
I also use the following firm-level control variables. All data is from Datastream. I measure size as both ln(market capitalization) and ln (as-sets) at year-end 2001, in millions of U.S. dollars. Size data are available for 826 firms (322 on level-23).
I use sales growth as a proxy for growth opportunities. Sales growth is defined as the two-year geometric average of annual growth in sales
89. For overviews of event study methodology, see generally Stephen J. Brown & Jerold B. Warner, Using Daily Stock Returns: The Case of Event Studies, 14 J. FIN. ECON. 3 (1985); A. Craig MacKinlay, Event Studies in Economics and Finance, 35 J. ECON. LIT. 13 (1997).

1680 UNIVERSITY OF ILLINOIS LAW REVIEW [Vol. 2014
from 1999–2001. I use sales growth as a proxy for a firm’s growth oppor-tunities. Sales growth data is available for 758 firms (299 on level-23).
I compute Tobin’s Q as market value of common shares plus book value of preferred shares plus book value of debt, divided by book value of assets. Data is available for 816 firms (319 on level-23).
As a measure of profitability, I use return on assets, defined as EBITDA divided by book value of assets. Data is available for 770 firms (302 on level-23).
I also use the following country-level variables. First, I use a cumu-lative measure of antidirector rights developed by Holger Spamann.90 This is an expansion and reanalysis of the earlier measure developed by La Porta et al.91 I also study the La Porta measures, but they are not sig-nificant and thus not reported. I also investigate the measures of coun-tries’ political economies developed by Mark Roe—budget of the finan-cial regulator, government subsidies and transfers, and labor regulation. 92 These variables are not significant and thus not reported.
I also use a country-level measure of disclosure I developed,93 which equals the country median, for all firms in my sample, of the disclosure measure created by Standard and Poor’s (“S&P”) in 2001, the year be-fore the Act’s adoption. The S&P disclosure scores have been used by a number of other authors as a measure of firm disclosure.94 The total score is composed of three subscores—financial transparency and infor-mation disclosure, board and management structure and process, and ownership structure and investor relations.95 I report results from the overall S&P score; results using subscores are consistent (not reported).
Gross Domestic Product per capita is from the World Bank’s World Development Indicators database for 2001. 96
Table 2 presents correlation coefficients for my main variables.
V. METHODOLOGY
My central approach is a “difference-in-differences” (“DiD”) meth-odology, in which I compare “treatment” firms (level-23 firms) to a con- 90. See generally Holger Spamann, On the Insignificance and/or Endogeneity of La Porta Et Al.’s ‘Anti-Director Rights Index’ Under Consistent Coding (Eur. Corp. Governance Inst. Working Paper Series in Law, Paper No. 67, 2006), available at http://ssrn.com/abstract=894301. 91. See generally Rafael La Porta et al., Law and Finance, 106 J. POL. ECON. 1113 (1998); Rafael La Porta et al., What Works in Securities Laws?, 61 J. FIN. 1 (2006). 92. Mark J. Roe, Legal Origins, Politics, and Modern Stock Markets, 120 HARV. L. REV. 460, 482–94 (2006). 93. See Litvak, SOX Event Study, supra note 31, at 225. 94. See, e.g., Bernard S. Black et al., Corporate Governance Indices and Firms' Market Values: Time Series Evidence from Russia, 7 EMERGING MKT. REV. 361, 362 (2006); Art Durnev & E. Han Kim, To Steal or Not to Steal: Firm Attributes, Legal Environment, and Valuation, 60 J. FIN. 1461, 1462 (2005). 95. SANDEEP A. PATEL & GEORGE S. DALLAS, STANDARD & POOR’S, TRANSPARENCY AND
DISCLOSURE: OVERVIEW OF METHODOLOGY AND STUDY RESULTS—UNITED STATES, 3 (2002). 96. World Development Indicators 2001, THE WORLD BANK, http://econ.worldbank.org/external/ default/main?pagePK=64165259&theSitePK=469372&piPK=64165421&menuPK=64166093&entityID =000009486_20040819135251 (last visited Sept. 15, 2014).
No. 5] DEFENSIVE MANAGEMENT 1681
trol group of non-cross-listed firms. The underlying assumption is that if the risk characteristics of level-23 firms change relative to their matches, from before to after SOX, this difference is likely to be due to the impact of SOX, and not to other unobserved differences between cross-listed and non-cross-listed firms. To address the risk that unobserved differ-ences explain my results, I rely for the most part on a triple difference methodology, in which I compare the double difference between level-23 firms and their matches to the double difference between level-14 firms and their matches. This controls for both (1) unobserved differences be-tween cross-listed firms and matching non-cross-listed firms, as long as these differences are similar for level-23 and level-14 firms; and (2) fac-tors common to all cross-listed firms, such as general exposure to U.S. capital markets.
Below, I generally report triple difference results, by including all pairs on all levels in the sample, and looking for an extra effect of level-23 listing. I, however, obtain similar results if I limit the sample to level-23 pairs and use a double difference approach. I also generally find in unreported regressions that the risk profiles of level-14 firms did not change significantly, relative to their matches, from before to after SOX. These robustness checks further corroborate the basic results of the tri-ple difference tests.
Within this overall approach, I address the possibility that choice of a specific methodology drives my results by using several different meth-odologies to estimate changes in firms’ risk levels. This Part summarizes my principal approaches.
A. Before-Versus-After Approach, Looking at Changes in Risk
In the first series of tests, I calculate risk before SOX and after SOX and then compare them. For each risk measure, for each year between 2001 and 2005, I estimate the “pair difference in risk”—the difference be-tween the risk measure of a cross-listed firm and that of its non-cross-listed match. As a robustness check, I also measure “pair ratio of risk”—the ratio of the risk measure of a cross-listed firm to that of its non-cross-listed match.
I treat the 2001 pair difference in risk level as the “before SOX” dif-ference. I do not average across several pre-SOX years to avoid having the pre-SOX data affected by the NASDAQ bubble (roughly 1998–2000). I measure the “after SOX” difference in risk as the mean pair dif-ference for 2003–2005. I omit 2002 (the year when SOX was adopted). I use a several-year average for the after-SOX period because it may have taken time for firms to adjust their riskiness in response to SOX. How long a lag period to use is a judgment call. Using data beyond 2005 seems too likely to capture effects that were due to causes other than SOX. In robustness checks, I obtain similar results if I define the “after SOX” period as the mean of (2003 and 2004), and, alternatively, as the mean of (2004 and 2005). To limit the influence of outlier observations, I

1682 UNIVERSITY OF ILLINOIS LAW REVIEW [Vol. 2014
winsorize each before-SOX and after-SOX pair-level measure of risk at 0.5%/99.5%; I obtain similar results if I instead winsorize at 1%/99% or 2%/98%.97
I then compute the double difference in risk—the after-minus-before SOX change in the pair difference in risk. More formally, let c index countries, l index cross-listing level (l = 23, 14, or non-cross-listed match), i index cross-listed companies (for convenience, let i cumulate across all firms in all countries), t index time (after or before), andRc,l,i,t be the risk level (on a particular measure) of company i, from country c, on cross-listing level l, at time t. The double difference in risk level is: DDRc,l,i = (Rc,23or 14,i,after – Rc,match,i,after) – (Rc,23or 14,i,before – Rc,match,i,before) I estimate the following base models:
Double difference model, with the sample limited to level-23 pairs. The coefficient of interest is the constant term α. DDRc,l,i = α + Σ(βj * Xj) + μ * Imp14 + εc,l,i Here Xj is a vector of firm and country characteristics, indexed by j, and Imp14 is the country median of the double difference in risk for level-14 pairs, which controls for country-level changes in the differences in risk measures between level-14 firms and their matches.
Triple difference model, with the sample including all pairs. DDRc,l,i = α + θ * dum23 + Σj (βj * Xj) + μ * Imp14 + εc,l,i Here dum23 is a dummy variable that equals 1 for level-23 pairs, and
0 for level-14 pairs. The coefficient of interest is θ; a negative coefficient indicates that the risk level of level-23 cross-listed firms declined relative to their matches, and relative to any decline in level-14 pairs. This can be understood as a triple difference estimate (difference of double differ-ences, between level-23 pairs and level-14 pairs).
I also run cross-sectional regressions, to assess which firm-level and country-level characteristics predict a change in risk for level-23 firms:
DDRc,l,i = α + θ * dum23 + Σj (βj * Xj) + μ * Imp14 + Σj (ωj * dum23 * Xj) + εc,l,i
The coefficients on the interaction terms give the predicted effect of the firm-level or country-level variable on the triple difference in after-minus-before risk between level-23 pairs and level-14 pairs.
97. “Winsorizing” is a statistical procedure that replaces specified parts of the sample (here, highest and lowest 0.5%, 1%, or 2%) for the most extreme remaining values.

No. 5] DEFENSIVE MANAGEMENT 1683
All regressions include country random effects to control for other-wise uncaptured country-level characteristics that influence risk. I can-not use firm fixed effects because I only have one observation per firm (double difference—after minus before SOX difference in pair risk). In robustness checks, I also use country fixed effects, with similar results (not reported). I present random effects specifications because this al-lows me to report coefficients on country-level variables, which are dropped with country fixed effects.
B. Panel Data with “After-SOX” Dummy, Looking at Changes in Risk
In the alternative approach, I use panel data of all matched pairs from 1998 through the end of 2005. The dependent variable is the pair difference in each measure of risk X—the difference between the value of X of a cross-listed firm and its non-cross-listed match. I then run a firm fixed effects regressions with monthly dummies. The coefficient of interest is that on the interaction term between the after-SOX dummy and the dummy for the level-23 listing (the one that subjects a foreign firm to SOX).
C. Panel Data, Looking at Changes in Firm Value
As a final check, I ask whether riskier firms suffered larger losses (or experienced stronger gains) after the SOX adoption. This model is the same as in section V.B, except it uses monthly change in pair-level Tobin’s Q as a dependent variable, and the coefficient of interest is that on the interaction between dummy for the level-23 listing and pre-SOX volatility of returns (measure of risk).
VI. RESULTS
A Main Results: Post-SOX Changes in Risk-Taking
Table 3 presents my main results for changes in volatility of returns. The dependent variables are the after-SOX (mean of 2003, 2004, and 2005) pair-level measures of volatility minus the same measures before-SOX (2001). The coefficient of interest is that on “dummy-23” variable (dummy for the level-23 cross-listing). In Panel A, I report the results for unsystematic risk; in Panel B, for systematic risk, and in Panel C, for total risk. The results are consistent. The coefficient on Dummy-23 is negative and significant in all specifications, indicating wide across-the-board declines in volatility after SOX. Matched pairs where cross-listed firms are subject to SOX reduced their risk levels more than matched pairs where cross-listed firms are not subject to SOX. This is consistent with something in SOX, rather than the fact of cross-listing, spurring the post-SOX reduction in risk.

1684 UNIVERSITY OF ILLINOIS LAW REVIEW [Vol. 2014
Table 3 tells us that level-23 pairs reduced risk more than level-14 pairs, but it doesn’t tell us whether cross-listed firms subject to SOX re-duced their risk levels compared to their non-cross-listed matches. Table 4 addresses the latter question. The answer is yes, for unsystematic and systematic risk. The coefficient of interest here is that on the constant term. Cross-listed firms not subject to SOX did not reduce their risk lev-els compared to non-cross-listed matches.
In robustness checks, I define the after-SOX period as the average of 2003 and 2005, or average of 2004 and 2005, with similar results (not reported).
In Table 5, I turn to my second methodology (panel data, with firm fixed effects), and ask whether several measures of risk exhibited differ-ent patterns after SOX. Among measures of risk here, I use volatility of returns, balance sheet liquidity, and leverage. The coefficient of interest is that on the interaction between the after-SOX dummy and the dummy for level-23 listing. In all specifications, the coefficient of interest is sig-nificant and consistent with lower after-SOX levels of risk.
In Table 6, I ask the opposite question: whether the firms that had higher risk before SOX experienced greater losses in Tobin’s Q after SOX than less risky firms. The answer is yes. Table 6 contains panel da-ta regressions estimating before-and-after SOX changes in pair-level To-bin’s Q (Tobin’s Q of a cross-listed company minus Tobin’s Q of its non-cross-listed matched), calculated monthly between 1998 and 2006. The coefficient of interest is on the triple interaction among dummy-23, after-SOX dummy, and unsystematic risk (“Dum23*aftsox2002*Unsystematic Risk”). In all specifications, the coefficients are strongly negative. Risk-ier foreign firms subject to SOX experienced greater declines in value af-ter the adoption of SOX, both compared to their matches and compared to cross-listed firms not subject to SOX.
B. Factors Predicting Risk Changes
Table 7 provides a variety of regressions testing which factors pre-dict how level-23 firms’ volatility changes after SOX. The coefficients of interest are those on the interactions between Dummy-23 and each firm-level or country-level characteristic. None of the tested variables strong-ly predicts the changes in unsystematic risk. For systematic risk and total risk, the S&P country-level measure of disclosure predicts changes in risk positively (firms from countries with overall better disclosure practices increased risk (or decreased risk less) after SOX). The coefficient on S&P country-level disclosure, however, is small and insignificant for un-systematic risk.
In Tables 8 and 9, I look at different measures of risk: balance sheet liquidity and leverage. For balance sheet liquidity, I use two measures: current ratio (current assets over current liabilities) and quick ratio (cur-rent assets net of inventory over current liabilities). Higher liquidity im-plies lower risk, so a positive sign here indicates the decline in risk.

No. 5] DEFENSIVE MANAGEMENT 1685
Table 8 investigates which firm-level and country-level factors that predict the post-SOX changes in the balance sheet liquidity of level-23 firms. The coefficient on the interaction of sales growth and dummy-23 is consistently strong and positive, indicating that faster growing firms subject to SOX experienced larger increases in balance sheet liquidity (declines in risk). One intuition behind this is that the adverse effect of the SOX’s most onerous requirement (section 404, requiring auditors to attest to the soundness of a company’s internal controls) may fall dispro-portionally onto “unusual” firms—younger, riskier, or higher growth—which are more likely to have weak controls and hence to attract audi-tors’ concerns, which may increase their compliance costs.
Tobin’s Q also positively predicts changes in liquidity. This could again be a growth effect, since faster-growing firms typically have higher Tobin’s Q values. This could also reflect firms that were better governed (or had more skillful management) before SOX suffered particularly strong declines in risk levels. This is consistent with prior findings that better-governed firms suffered more from the adoption of SOX: their stock prices declined more during the events when the news about the SOX applicability to foreign issuers were released,98 and their cross-listing premia declined during 2002 more strongly than those of higher-disclosing firms.99 The intuition behind this result is that SOX probably contains a mix of good and bad provisions; well-governed firms are likely to have adopted the “good” provisions before SOX and thus had to carry the burden of the “bad” provisions without an offsetting benefit that poorly run firms received from SOX.
I also find a negative coefficient on the interaction of the firm’s af-ter-minus-before SOX change in Tobin’s Q and dummy-23. This implies that SOX-affected firms whose Tobin’s Q declined more strongly during the period of SOX adoption experienced larger increases in liquidity (de-clines in risk levels). One possible explanation for this result is that man-agers reacted to stock price declines by reducing their firms’ risk levels.
Finally, in Table 9, I present results for changes in leverage. I measure leverage ratio alternately as total debt/market value of equity and (total debt minus cash)/market value of equity. The results for sales growth are consistent with those presented in Table 8. While higher sales growth predicts a larger decline in leverage (i.e., stronger declines in risk) firm-level and country-level factors do not robustly predict changes in leverage for level-23 firms.
VII. CONCLUSIONS
This paper addresses two important and related questions. First, did SOX encourage corporations to reduce risk? Second, did SOX have an effect on foreign cross-listed companies? The answers seem to be yes
98. See Litvak, SOX Event Study, supra note 31, at 226. 99. See Litvak, SOX and Listing Premium in 2002, supra note 36, at 1898.

1686 UNIVERSITY OF ILLINOIS LAW REVIEW [Vol. 2014
to both, or at least a qualified yes—risk levels of foreign cross-listed companies subject to SOX declined after SOX, while risk levels of for-eign cross-listed companies not subject to SOX did not decline, control-ling for multiple firm- and country-level characteristics.
The conclusions about the changes in risk somewhat depend on the measure of risk that one adopts. The usual market-based measures (vol-atility of returns, unsystematic risk, and systematic risk) produce strong across-the-board results, with no cross-sectional predictors. The results for liquidity-based and leverage-based measures are generally consistent with volatility-based results, but are not identical.
Among questions remaining for future research are the causes of the differences between changes in different measures of risk. Perhaps the finding that volatility-based risk measures declined strongly across the board, but leverage-based risk measures declined only for high-growth firms is more than a result of measurement differences. It is pos-sible that SOX affected different ways in which corporations can reduce their risks differently, and future research may be able to tease out the differences in more detail.

No. 5] DEFENSIVE MANAGEMENT 1687
TABLE 1: SUMMARY STATISTICS

1688 UNIVERSITY OF ILLINOIS LAW REVIEW [Vol. 2014

No. 5] DEFENSIVE MANAGEMENT 1689
TABLE 3: VOLATILITY OF RETURNS
All Panels: The dependent variable is the after SOX (mean of 2003–2005) minus before SOX (2001) difference in volatility of returns of matched pairs. Each matched pair consists of one cross-listed company and one non-cross-listed company from the same country matched on cross-listing propensity based on market capitalization, industry, return on assets, sales growth, leverage, and standard deviation of returns. Matched pair volatility is the difference between the volatility of a cross-listed company and the volatility of its match. Differences in volatility are winsorized at 0.5%/99.5%. All regressions use country fixed effects; simi-lar results with country random effects. T-statistics are reported under regression coefficients. In Panel A, volatility is measured as unsystematic risk; in Panel B, as systematic risk; in Panel C, as total risk. The coeffi-cient of interest is that on Dummy-23; control variables include pre-SOX measures of a firm’s Tobin’s Q, sales growth, profitability, ln(assets), and leverage, and a constant term. Symbols *, **, *** indicate significance at 10%, 5%, and 1% levels. Significant results (at 5% level or better) are in boldface for variables of interest (dummy for level-23 cross-listing).

1690 UNIVERSITY OF ILLINOIS LAW REVIEW [Vol. 2014
TABLE 4: VOLATILITY OF RETURNS, BY LEVEL OF LISTING: CROSS-SECTIONAL RESULTS
All Panels: The dependent variable is the after SOX (mean of 2003–2005) minus before SOX (2001) difference in volatility of returns of matched pairs. Each matched pair consists of one cross-listed company and one non-cross-listed company from the same country matched on cross-listing propensity based on market capitalization, industry, return on assets, sales growth, leverage, and standard deviation of returns. Matched pair volatility is the difference between the volatility of a cross-listed company and the volatility of its match. Differences in volatility are winsorized at 0.5%/99.5%. All regressions use country random effects; similar results with country fixed effects. T-statistics are reported under regression coefficients. In Panel A, volatility is measured as unsystematic risk; in Panel B, as systematic risk; in Panel C, as total risk. Independent variables include Dummy-23; firm-level variables (pre-SOX measures of sales growth, profitability, ln(assets), Tobin’s Q, and ROA); country-level variables (ln GDP per capita, S&P measure of disclosure, Spamann measure of governance); an index for the country-level median of the af-ter-minus-before pair difference in leverage for level-14 pairs (“Index Level-14 Pairs”), and a constant term. Symbols *, **, *** indicate signifi-cance at 10%, 5%, and 1% levels. Significant results (at 5% level or bet-ter) are in boldface for variables of interest (constant term).
Panel A: Unsystematic Risk Panel B: Systematic Risk
Panel C: Total Risk
Level-23 Level-14 Level-23 Level-14 Level-23 Level-14
Sales Growth 0 -0.001 -0.034 -0.06 -0.029 -0.052
-1.59 (1.78)* -1.12 -1.49 -1.05 (1.78)*
Europe 0.003 0 0.179 0.216 0.164 0.297
(2.06)** -0.08 -1.21 -0.72 -0.38 (3.20)***
Ln Assets 0.001 0 0.1 0.012 0.322 0.118
-1.57 -0.77 (2.15)** -0.2 (6.52)*** (3.69)***
Disclosure S&P
-0.001 0 -0.017 -0.203 0.238 0.086
-1.49 -0.36 -0.27 -1.51 -1.3 (2.29)**
Profitability 0.001 0.01 0.043 0.283 0.065 2.996
-1.27 (1.98)** -0.81 -0.49 -1.36 (7.20)***
Leverage 0 0 0.011 0.067 -0.075 -0.435
-0.1 -0.18 -0.05 -0.32 -0.39 (2.76)***
Index of Lev-el-14 Pairs
0.095 0.781 19.13 63.834 -26.714 0.654
-0.58 (4.50)*** -1.16 -1.61 -0.63 -0.05
Constant -0.003 -0.001 -0.252 -0.139 -0.035 -0.005
(3.48)*** -1.02 (2.53)** -0.69 -0.13 -0.07
Number of Matched Pairs
241 424 241 424 235 416
Number of Countries
23 28 23 28 22 27

No. 5] DEFENSIVE MANAGEMENT 1691
TABLE 5: MONTHLY CHANGES IN RISK LEVELS: PANEL DATA; 1990–2005; FIRM FIXED EFFECTS
All Panels: The dependent variable is the pair-level difference in the indicated variable (unsystematic risk; total risk; long-term debt; total debt; operating leverage; quick ratio), measured monthly between 1990 and 2005. “After SOX” is defined as after December 31, 2002. The year of 2002 is excluded. Each matched pair consists of one cross-listed com-pany and one non-cross-listed company from the same country matched on cross-listing propensity based on market capitalization, industry, re-turn on assets, sales growth, leverage, and standard deviation of returns. All non-dummy independent variables are normalized to the mean of 0 and standard deviation of 1. T-statistics are reported under regression coefficients. The coefficient of interest is that on the interaction term “dummy23 * after SOX.” Other independent variables include After SOX, pre-SOX measures of ln(assets), return on assets, and sales growth. Symbols *, **, *** indicate significance at 10%, 5%, and 1% levels. Sig-nificant results (at 5% level or better) are in boldface for coefficients of interest (dummy-23 interacted with “after SOX” dummy).

1692 UNIVERSITY OF ILLINOIS LAW REVIEW [Vol. 2014
TABLE 6: MONTHLY CROSS-LISTING PREMIA FOR ALL PAIRS: PANEL DATA, 1990–2006, FIRM FIXED EFFECTS
Results from panel data regressions estimating differences in cross-listing premia (pair Tobin’s Q) before and after SOX. In Panel A, the dependent variable is the pair Tobin’s Q (Tobin’s Q of a cross-listed company minus Tobin’s Q of its non-cross-listed match), calculated monthly between 1998 and 2006, winsorized at 0.5%/95.5%. Non-cross-listed matching company is from the same country and has the closest available propensity to cross-list based on industry, market capitalization, return on assets, sales growth, leverage, and standard deviation of re-turns. Independent variables include a dummy for level-23 cross-listing; after-SOX dummy (starting with year-end of 2002); sales growth, ln of assets, unsystematic risk, Spamann’s measure of country-level govern-ance; ln GDP per capita, S&P country-level measure of transparency; the coefficients of interest are those on the triple interactions (dum23*aftersox*company/country characteristic). All non-dummy in-dependent variables are standardized. All regressions use firm fixed ef-fects. T-statistics are reported under regression coefficients. Symbols *, **, *** indicate significance at 10%, 5%, and 1% levels. Significant re-sults (at 5% level or better) are in boldface for variables of interest (un-systematic risk interacted with dummy-23 and after-SOX dummy).

No. 5] DEFENSIVE MANAGEMENT 1693
TABLE 7: VOLATILITY OF RETURNS: CROSS-SECTIONAL RESULTS
All Panels: The dependent variable is the after SOX (mean of 2003–2005) minus before SOX (2001) difference in volatility of returns of matched pairs. Each matched pair consists of one cross-listed company and one non-cross-listed company from the same country matched on cross-listing propensity based on market capitalization, industry, return on assets, sales growth, leverage, and standard deviation of returns. Matched pair volatility is the difference between the volatility of a cross-listed company and the volatility of its match. Differences in volatility are winsorized at 0.5%/99.5%. All regressions use country random effects; similar results with country fixed effects. T-statistics are reported under regression coefficients. In Panel A, volatility is measured as unsystematic risk; in Panel B, as systematic risk; in Panel C, as total risk. Independent variables include Dummy-23; firm-level variables (pre-SOX measures of sales growth, profitability, ln(assets), Tobin’s Q, and ROA); country-level variables (ln GDP per capita, S&P measure of disclosure, Spamann measure of governance); an index for the country-level median of the af-ter-minus-before pair difference in leverage for level-14 pairs (“Index Level-14 Pairs”), and a constant term. Symbols *, **, *** indicate signifi-cance at 10%, 5%, and 1% levels. Significant results (at 5% level or bet-ter) are in boldface for variables of interest (interactions between dum-my-23 and firm/country characteristics).

1694 UNIVERSITY OF ILLINOIS LAW REVIEW [Vol. 2014
TABLE 8: BALANCE SHEET LIQUIDITY BEFORE-AND-AFTER, CROSS-SECTIONAL RESULTS
All Panels: The dependent variable is the after SOX (mean of 2003-2005) minus before SOX (2001) difference in balance sheet liquidity of matched pairs. Each matched pair consists of one cross-listed company and one non-cross-listed company from the same country matched on cross-listing propensity based on market capitalization, industry, return on assets, sales growth, leverage, and standard deviation of returns. Matched pair liquidity is the difference between the liquidity of a cross-listed company and the liquidity of its match. Differences in liquidity are winsorized at 0.5%/99.5%. All regressions use country random effects; similar results with country fixed effects. T-statistics are reported under regression coefficients. In Panel A, liquidity is measured as current assets over current liabilities; in Panel B, current assets net of inventory over current liabilities. Liquidity as measured here is inversely related to risk. Independent variables include Dummy-23; firm-level variables (pre-SOX measures of sales growth, profitability, ln(assets), Tobin’s Q, and ROA); country-level variables (ln GDP per capita, S&P measure of disclosure, Spamann measure of governance); an index for the country-level median of the after-minus-before pair difference in leverage for level-14 pairs (“Index Level-14 Pairs”), and a constant term. Symbols *, **, *** indi-cate significance at 10%, 5%, and 1% levels. Significant results (at 5% level or better) are in boldface for coefficients of interest (dummy-23 and dummy-23 interacted with firm/country characteristics).
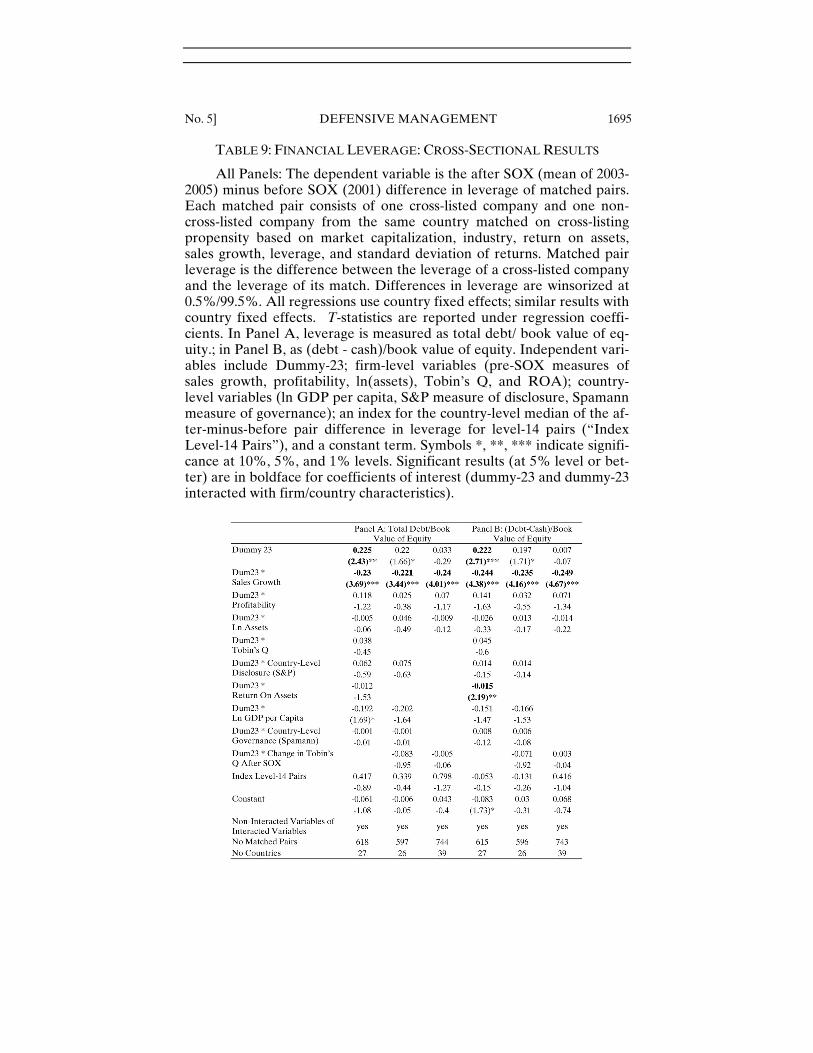
No. 5] DEFENSIVE MANAGEMENT 1695
TABLE 9: FINANCIAL LEVERAGE: CROSS-SECTIONAL RESULTS
All Panels: The dependent variable is the after SOX (mean of 2003-2005) minus before SOX (2001) difference in leverage of matched pairs. Each matched pair consists of one cross-listed company and one non-cross-listed company from the same country matched on cross-listing propensity based on market capitalization, industry, return on assets, sales growth, leverage, and standard deviation of returns. Matched pair leverage is the difference between the leverage of a cross-listed company and the leverage of its match. Differences in leverage are winsorized at 0.5%/99.5%. All regressions use country fixed effects; similar results with country fixed effects. T-statistics are reported under regression coeffi-cients. In Panel A, leverage is measured as total debt/ book value of eq-uity.; in Panel B, as (debt - cash)/book value of equity. Independent vari-ables include Dummy-23; firm-level variables (pre-SOX measures of sales growth, profitability, ln(assets), Tobin’s Q, and ROA); country-level variables (ln GDP per capita, S&P measure of disclosure, Spamann measure of governance); an index for the country-level median of the af-ter-minus-before pair difference in leverage for level-14 pairs (“Index Level-14 Pairs”), and a constant term. Symbols *, **, *** indicate signifi-cance at 10%, 5%, and 1% levels. Significant results (at 5% level or bet-ter) are in boldface for coefficients of interest (dummy-23 and dummy-23 interacted with firm/country characteristics).

1696 UNIVERSITY OF ILLINOIS LAW REVIEW [Vol. 2014


![CONSTITUTIONAL VIOLATIONS BY THE UNITED …illinoislawreview.org/wp-content/ilr-content/articles/...NOWLIN.DOC 10/19/2005 2:02:22 PM No. 5] SUPREME COURT CONSTITUTIONAL VIOLATIONS](https://img.dokumen.tips/doc/110x75/5fbf326ab7263011843d5faf/constitutional-violations-by-the-united-nowlindoc-10192005-20222-pm-no.jpg)


![THE JAPANESE QUASI-JURY AND THE AMERICAN JURY: A ...illinoislawreview.org/wp-content/ilr-content/articles/2011/2/Senger.pdf · SENGER.DOCX (DO NOT DELETE) 2/24/2011 2:18 PM No. 2]](https://img.dokumen.tips/doc/110x75/5eb1a5c7420bb64fe72dfa25/the-japanese-quasi-jury-and-the-american-jury-a-sengerdocx-do-not-delete.jpg)