Embed Size (px)
Citation preview

http://www.hci.mil/
Defense Acquisition WorkforceKey Information
OVERALLAs of FY17Q2 (31 March 2017)

AWF FY17Q2 Key Information
AWF – Annual Historical Workforce SizeFY08 – FY17Q2
AT&L DataMart (as of 31 Mar 2017) 2

AWF FY17Q2 Key Information
AWF – Quarterly Historical Workforce SizeFY16Q2 – FY17Q2
AT&L DataMart (as of 31 Mar 2017) 2

AWF FY17Q2 Key Information
Fact Sheet
4AT&L DataMart (As of 31 Mar 2017) RAND NDRI (as of 31 Dec 2016)
AT&LCivilian (Civ)
AT&LMilitary (Mil)
Total AT&L(Civ+Mil)
AT&LCivilian (Civ)
AT&LMilitary (Mil)
Total AT&L(Civ+Mil)
Size & CompositionWorkforce Size 110,934 14,945 125,879 147,533 15,491 163,024Change in size from 2008 - - - 33% 4% 30%Civilian/Military Composition 88% 12% - 90% 10% 90% / 10%Educational AttainmentBachelor’s Degree or Higher 77% 81% 77% 84% 83% 84%Post Graduate Degree 26% 44% 29% 38% 54% 40%Certification (Cert)Level I or Higher Achieved 73% 61% 72% 86% 76% 85%Level II or Higher Achieved 63% 41% 61% 31% 52% 73%Level III Achieved 38% 19% 36% 44% 24% 42%Position Cert Rqmt Met or Exceeded 61% 41% 58% 77% 59% 76%Within 24 Months of Cert Rqmt 25% 46% 27% 20% 36% 21%Does Not Meet Cert Rqmt 15% 12% 14% 3% 5% 3%Planning Considerations% Baby Boomer / Traditional Gen. 68% 17% 62% 36% 1% 33%Average Age 46.9 36.4 45.7 45.9 35.3 44.9Workforce Life-Cycle Model (YRE)% Future/Mid-Career/Senior 20/23/57(%) - - 24/25/51(%) - 24/25/51(%)
Average Years of Service 17.8 13.3 17.3 15.2 13.4 15.1Retirement Eligible 19,051(17%) - - 28,385(19%) - 28,385(19%)Retirement Eligible w/in 5 Years 21,315(19%) - - 25,803(17%) - 25,803(17%)Total Gains/Losses 14,245/15,030 - - 15,885/10,857 - 15,885/10,857
Human Capital Fact Sheet
Defense Acquisition Workforce AT&L
FY 2008 FY2017Q2
Source: The Human Capital Fact Sheet is based on end of FY2008 and FY2017Q2 data and was generated by OUSD(AT&L)/Human Capital Initiatives using the AT&L Workforce Data Mart.*Analysis support from RAND using FY2008 and FY2017Q2 DMDC data.
AWF FY17Q2 Key Information
AWF – Military and CivilianBy Component and Career Field
AT&L DataMart (as of 31 Mar 2017) 5

AWF FY17Q2 Key Information
AWF Size by Component and Career Field
AT&L DataMart (as of 31 Mar 2017) 6
AWF Count by Career CategoryFY17Q2 Army Navy Marine Corps Air Force 4th Estate Totals
%Total
Auditing - - - - 3,937 3,937 2.4%Business - CE 258 539 37 494 78 1,406 0.9%Business - FM 1,715 1,896 169 2,050 546 6,376 3.9%Contracting 7,942 5,869 538 8,426 7,869 30,644 18.8%Engineering 9,122 21,668 353 9,221 2,169 42,533 26.1%Facilities Engineering 2,981 5,458 33 512 83 9,067 5.6%Information Technology 1,725 2,893 227 1,262 860 6,967 4.3%Life Cycle Logistics 7,103 5,994 598 3,262 3,002 19,959 12.2%Production, Quality and Man 1,389 3,293 39 396 5,438 10,555 6.5%Program Management 3,261 5,497 790 5,720 1,722 16,990 10.4%Property 54 66 - 13 267 400 0.2%Purchasing 441 414 52 63 561 1,531 0.9%S&T Manager 459 550 4 2,762 121 3,896 2.4%Test and Evaluation 1,886 3,195 139 3,147 370 8,737 5.4%Unknown/Other 6 1 - 1 18 26 0.02%
FY17Q2 Totals (as of 3-31-2017 ) 38,342 57,333 2,979 37,329 27,041 Component % 23.5% 35.2% 1.8% 22.9% 16.6% 163,024
AWF FY17Q2 Key Information
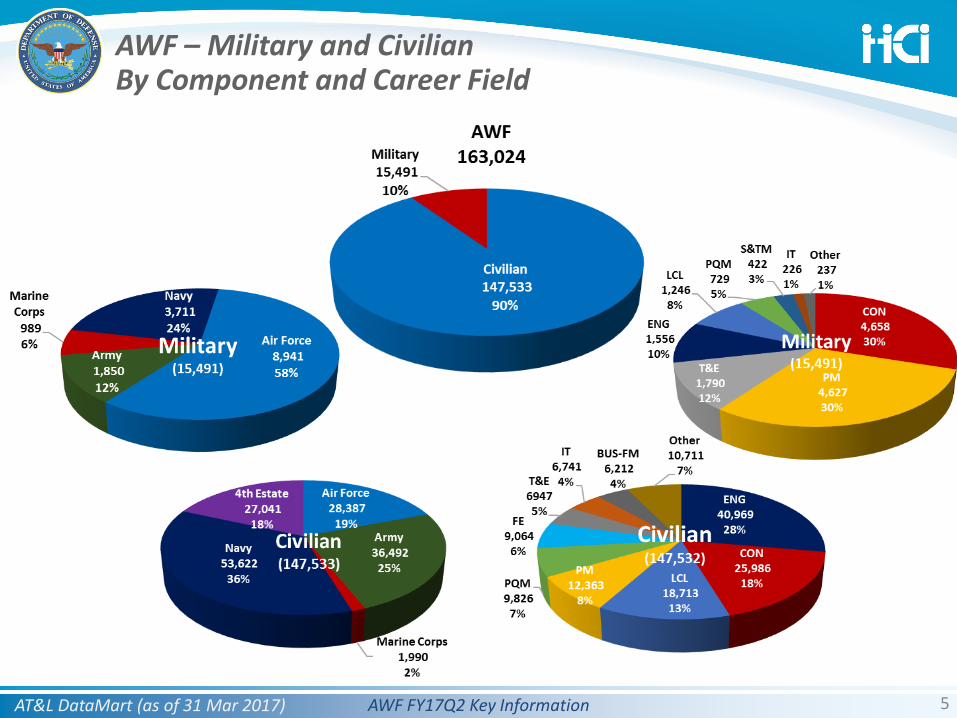
AWF Historical Size Detailby Component (Civilian & Military)
AT&L DataMart (as of 31 Mar 2017) 7
41,078 44,609 48,556 49,786 50,156 50,207 50,822 54,736 57,086 57,333 40% 0%1,988 2,363 2,862 3,005 2,902 3,007 2,863 2,829 3,002 2,979 50% -1%
40,269 40,356 43,634 43,476 41,877 40,037 37,342 36,633 37,146 38,342 -5% 3%24,827 27,174 31,382 34,147 34,637 34,534 34,395 35,665 36,975 37,329 50% 1%17,717 18,601 21,271 21,477 22,754 23,570 25,043 26,450 27,260 27,041 53% -1%
↑ ↑OVERALL DAW 30% 1%163,024
NavyMARINE CORPSARMYAIR FORCE4th ESTATE
161,469 152,326 147,705 151,891 125,879 133,103 156,313 150,465 151,355
FY16 % Change Since FY16
% Change Since FY08FY13 FY14 FY15 FY17Q2Defense Acq Workforce
Service
OverallFY12FY10 FY11FY08 FY09

AWF FY17Q2 Key Information
AWF Quarterly Historical Size Detailby Component (Civilian & Military)
AT&L DataMart (as of 31 Mar 2017) 8
Navy 55,201 55,711 56,374 57,086 57,268 57,333 3%
Marine Corps 2,840 2,864 2,941 3,002 2,998 2,979 4%
ARMY 36,798 36,562 36,560 37,146 37,343 38,342 5%
AIR FORCE 35,335 36,076 35,551 36,975 36,929 37,329 3%
4th ESTATE 26,283 26,999 27,082 27,260 27,174 27,041 0%
↑OVERALL DAW 3%163,024 161,712 158,508 161,469 156,457 158,212
OverallDefense Acq WorkforceService
FY16Q3 FY16Q4% Change
Since FY16Q2
FY16Q1 FY16Q2 FY17Q1 FY17Q2

AWF FY17Q2 Key Information
AWF Annual Historical Size Detailby Component/Agency (Civilian & Military)
AT&L DataMart (as of 31 Mar 2017) 9
Navy 41,078 44,609 48,556 49,786 50,156 50,207 50,822 54,736 57,086 57,333 40% 0%MARINE CORPS 1,988 2,363 2,862 3,005 2,902 3,007 2,863 2,829 3,002 2,979 50% -1%ARMY 40,269 40,356 43,634 43,476 41,877 40,037 37,342 36,633 37,146 38,342 -5% 3%AIR FORCE 24,827 27,174 31,382 34,147 34,637 34,534 34,395 35,665 36,975 37,329 50% 1%DCMA 7,344 7,909 8,722 8,421 8,699 9,618 9,645 9,773 9,993 9,895 35% -1%DLA 3,913 3,970 4,272 4,565 4,915 4,892 5,753 7,329 7,857 7,859 101% 0%DCAA 3,598 3,775 4,146 4,235 4,515 4,375 4,567 4,322 4,015 3,944 10% -2%MDA 788 938 1,638 1,709 1,828 1,957 1,916 1,892 1,962 1,973 150% 1%DISA 680 588 662 727 769 770 941 917 970 960 41% -1%DTRA 353 375 446 451 487 502 495 495 500 496 41% -1%DHA 98 96 190 258 228 216 497 439 393 367 274% -7%DAU 284 359 439 447 488 417 402 414 436 422 49% -3%NRO - - - - - - - - 236 248 #VALUE! 5%0SD 160 111 150 177 177 167 164 177 170 166 4% -2%DeCA 88 94 109 115 115 126 128 149 167 159 81% -5%WHS 47 35 39 73 104 111 123 122 118 114 143% -3%JCS 1 2 2 4 135 125 109 101 98 98 9700% 0%DFAS 59 53 69 63 65 61 61 64 68 65 10% -4%DoDEA 50 48 63 68 69 62 58 60 45 41 -18% -9%DMEA - 16 51 45 44 43 51 55 69 67 #DIV/0! -3%DoD HRA 20 6 23 23 24 23 24 23 27 36 80% 33%TRMC 13 10 12 13 17 18 23 23 24 25 92% 4%DTIC 2 - - - 4 10 15 19 25 24 1100% -4%DSCA 25 17 20 17 17 21 19 17 18 15 -40% -17%DSS 8 9 12 14 12 16 17 18 15 15 88% 0%DMA - 22 21 17 18 19 14 17 11 11 #DIV/0! 0%DARPA 13 13 12 12 13 13 12 13 14 15 15% 7%USUHS - - - - - - - - 17 15 #DIV/0! #DIV/0!NDU 13 4 6 9 6 5 6 8 7 7 -46% -13%POW/MIA - - - - - - - - 3 3 #DIV/0!IG 36 2 1 2 1 1 2 2 1 - -100% -50%ASD - 10 11 8 3 1 1 1 1 1 #DIV/0! 0%PFPA 2 1 1 1 1 1 - - - - -100% #DIV/0!4th Estate Other 122 138 154 3 - - - - - - #DIV/0! #DIV/0!
↑ ↑TOTAL 30% 1%133,103 147,705 151,891 152,326
FY17Q2
163,024 150,465 156,313 161,469 151,355
% Change Since FY08
% Change Since FY16Defense Acq Workforce
AgencyFY12 FY13 FY14 FY15 FY16FY11
OverallFY08 FY09 FY10
125,879

AWF FY17Q2 Key Information
AWF Quarterly Historical Size Detailby Component/Agency (Civilian & Military)
AT&L DataMart (as of 31 Mar 2017) 10
Navy 55,201 55,711 56,374 57,086 57,268 57,333 3%ARMY 36,798 36,562 36,560 37,146 37,343 38,342 5%AIR FORCE 35,335 36,076 35,551 36,975 36,929 37,329 3%MARINE CORPS 2,840 2,864 2,941 3,002 2,998 2,979 4%DCMA 9,672 9,871 9,924 9,993 9,947 9,895 0%DLA 7,324 7,636 7,748 7,857 7,815 7,859 3%DCAA 4,266 4,157 4,047 4,015 4,015 3,944 -5%MDA 1,901 1,907 1,925 1,962 1,982 1,973 3%DISA 906 963 964 970 955 960 0%DTRA 496 498 503 500 514 496 0%DHA 423 423 410 393 378 367 -13%DAU 419 425 431 436 432 422 -1%NRO - 227 230 236 241 248 9%0SD 176 171 173 170 166 166 -3%DeCA 150 162 160 167 164 159 -2%WHS 125 121 123 118 120 114 -6%JCS 99 100 103 98 98 98 -2%DFAS 67 67 64 68 68 65 -3%DoDEA 63 59 57 45 43 41 -31%DMEA 56 58 63 69 68 67 16%DoD HRA 24 27 25 27 32 36 33%TRMC 24 23 23 24 26 25 9%DTIC 19 20 21 25 24 24 20%DSCA 17 18 18 18 15 15 -17%DSS 17 16 16 15 16 15 -6%DMA 16 13 12 11 12 11 -15%DARPA 12 13 14 14 15 15 15%USUHS - 13 16 17 17 15 15%NDU 7 6 7 7 7 7 17%POW/MIA - 3 3 3 3 3 0%IG 3 1 1 1 - - -100%ASD 1 1 1 1 1 1 0%
↑TOTAL 3%
OverallDefense Acq WorkforceAgency
161,712
% Change Since FY16Q2FY16Q1 FY16Q2 FY16Q3 FY17Q1 FY17Q2FY16Q4
161,469 163,024 156,457 158,212 158,508

AWF FY17Q2 Key Information
AWF Historical Size Detail by Component (Civilian)
11AT&L DataMart (as of 31 Mar 2017)
Navy 37,336 41,220 45,029 46,234 46,839 46,671 47,181 51,033 53,374 53,622 44% 0%
Marine Corps 1,243 1,506 1,980 2,083 2,023 2,194 2,039 2,011 1,993 1,990 60% 0%
AIR FORCE 16,067 18,506 22,526 24,962 25,019 24,986 25,299 26,837 28,123 28,387 77% 1%
Army 38,689 38,612 42,015 41,696 40,079 38,092 35,246 34,631 35,238 36,492 -6% 4%
4th ESTATE 17,599 18,601 21,271 21,477 22,754 23,570 25,043 26,450 27,260 27,041 54% -1%
↑ ↑OVERALL DAW 33% 1%
FY14 FY17Q2
147,532
FY09 FY10 FY11 FY12 FY13Defense Acq WorkforceService
Overall (Civilian)
140,962
FY15 % Change Since FY16
135,513 134,808 110,934 118,445 132,821 136,452 136,714 145,988
FY16 % Change Since FY08FY08

AWF FY17Q2 Key Information
AWF Quarterly Historical Size Detail by Component (Civilian)
12AT&L DataMart (as of 31 Mar 2017)
Navy 51,461 52,002 52,587 53,374 53,622 3%
MARINE CORPS 2,000 1,990 1,998 1,993 1,990 0%
AIR FORCE 26,500 27,117 26,683 28,123 28,387 5%
ARMY 34,845 34,620 34,637 35,238 36,492 5%
4th ESTATE 26,283 26,999 27,082 27,260 27,041 0%
↑OVERALL DAW 3%147,532
Defense Acq WorkforceService
Overall (Civilian) % Change Since
FY16Q2FY17Q2FY16Q1 FY16Q2 FY16Q3 FY16Q4
142,728 142,987 145,988 141,089

AWF FY17Q2 Key Information
AWF Historical Size Detail by Component (Military)
13AT&L DataMart (As of 31 Mar 2017)
8,760 8,668 8,856 9,185 9,618 9,548 9,096 8,828 8,852 8,941 2% 1%
3,742 3,389 3,527 3,552 3,317 3,536 3,641 3,703 3,712 3,711 -1% 0%
745 857 882 922 879 813 824 818 1,009 989 33% -2%
1,580 1,744 1,619 1,780 1,798 1,945 2,096 2,002 1,908 1,850 17% -3%
↑ ↑
4% 0%15,657 15,351 15,481
FY17Q2
15,491 14,827 14,658 14,884 15,439 15,612 15,842
% Change Since FY08
% Change Since FY16
FY12 FY13 FY14 FY15 FY16FY11FY08 FY09 FY10
AWF FY17Q2 Key Information
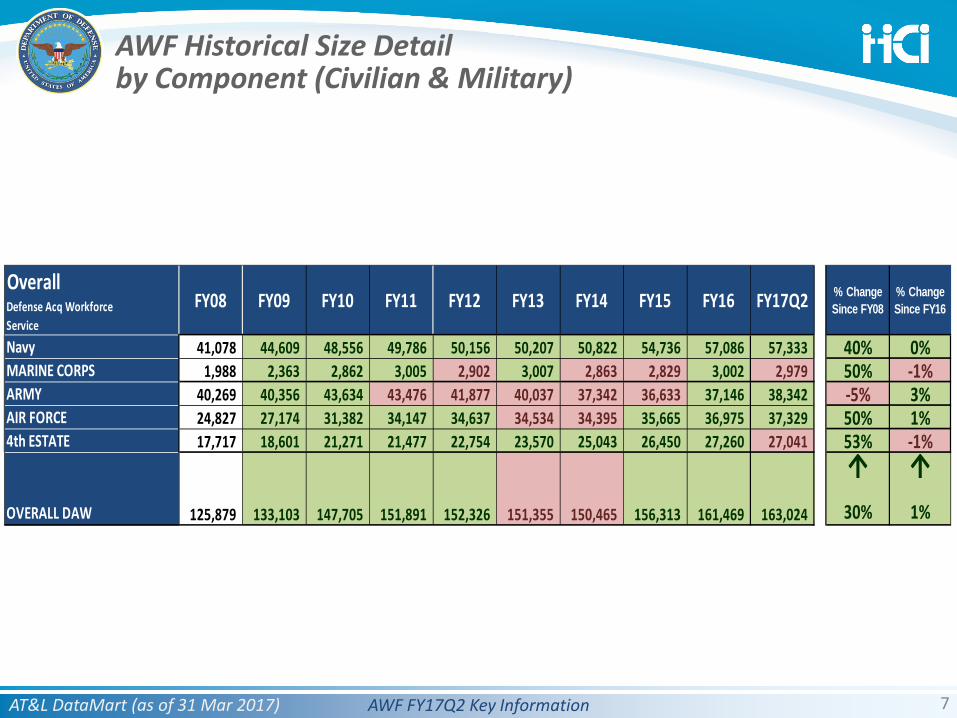
AWF Quarterly Historical Size Detail by Component (Military)
14AT&L DataMart (As of 31 Mar 2017)
AIR FORCE 8,835 8,959 8,868 8,852 8,874 8,941 0%
Navy 3,740 3,709 3,787 3,712 3,692 3,711 0%
Marine Corps 840 874 943 1,009 987 989 13%
ARMY 1,953 1,942 1,923 1,908 1,877 1,850 -5%
↑OVERALL DAW 0%
% Change Since
FY16Q2FY17Q1
15,481 15,368 15,484 15,521 15,430
FY16Q1 FY16Q2
15,491
Defense Acq WorkforceService
Overall (Military)FY16Q3 FY16Q4 FY17Q2

AWF FY17Q2 Key Information
AWF Historical Size Detail by Career Field (Civilian and Military)
AT&L DataMart (as of 31 Mar 2017) 15
Engineering 34,537 36,704 39,201 39,690 39,807 39,544 39,242 41,050 42,438 42,533 23% 0%
Contracting 25,680 27,655 29,792 30,327 30,292 30,271 29,826 30,230 30,669 30,644 19% 0%
Life Cycle Logistics 13,361 14,852 16,861 17,369 17,539 17,122 17,724 19,222 19,929 19,959 49% 0%
Program Management 12,781 13,422 14,915 15,683 15,824 16,171 16,003 16,585 17,002 16,990 33% 0%
Production, Quality and Man
9,138 9,023 9,727 9,601 9,458 9,658 9,671 9,822 10,544 10,555 16% 0%
Test and Evaluation 7,420 7,892 8,446 8,573 8,603 8,580 8,569 8,692 8,738 8,737 18% 0%
Business - FM 7,085 7,262 7,054 7,009 6,761 6,463 6,142 6,205 6,327 6,376 -10% 1%
Facilities Engineering 4,920 5,420 6,911 7,428 7,290 6,970 6,617 6,986 7,870 9,067 84% 15%
Information Technology 3,934 4,358 5,165 5,563 5,832 5,870 5,776 6,402 6,836 6,967 77% 2%
Auditing 3,638 3,777 4,143 4,231 4,505 4,368 4,560 4,316 4,011 3,937 8% -2%
Purchasing 1,196 1,238 1,287 1,276 1,340 1,283 1,205 1,330 1,475 1,531 28% 4%
Business - CE - - 1,070 1,252 1,278 1,312 1,309 1,346 1,378 1,406 #DIV/0! 2%
S&T Manager 480 623 2,561 3,062 3,209 3,293 3,401 3,681 3,814 3,896 712% 2%
Property 451 475 501 483 449 402 389 400 405 400 -11% -1%
Unknown/Other 1,258 402 71 344 139 48 31 46 33 26
↑ ↑TOTAL 30% 1%
Defense Acq WorkforceCareer Field
Overall % Change Since FY16
% Change Since FY08FY12 FY13 FY14 FY16 FY17Q2
163,024 156,313 161,469
FY15FY08 FY09
151,355 150,465 125,879 133,103 147,705 151,891 152,326
FY10 FY11
AWF FY17Q2 Key Information
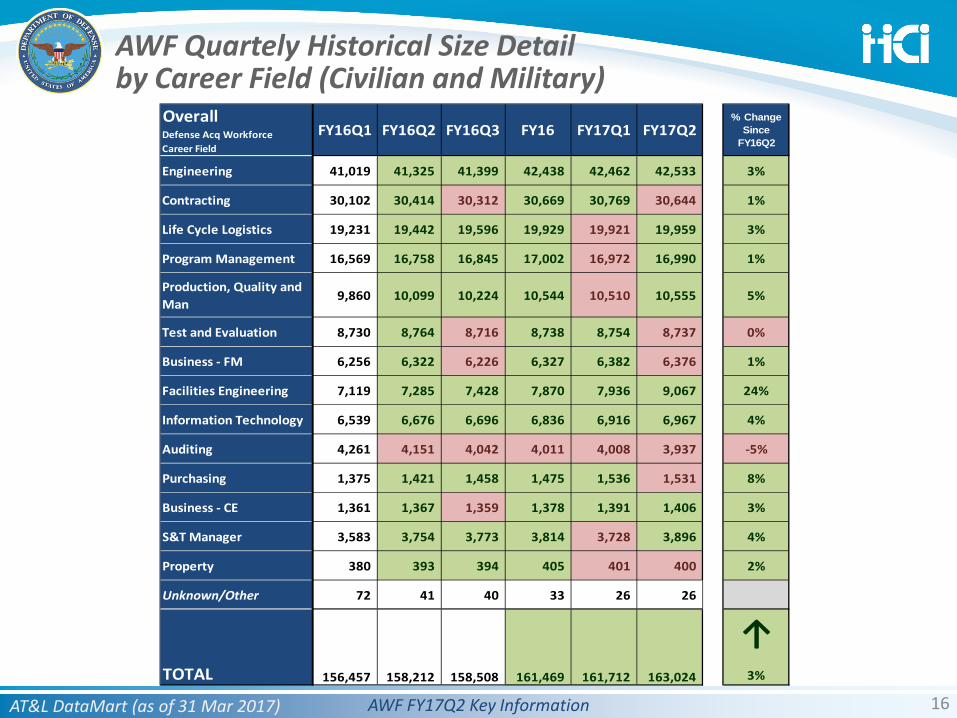
AWF Quartely Historical Size Detail by Career Field (Civilian and Military)
AT&L DataMart (as of 31 Mar 2017) 16
Engineering 41,019 41,325 41,399 42,438 42,462 42,533 3%
Contracting 30,102 30,414 30,312 30,669 30,769 30,644 1%
Life Cycle Logistics 19,231 19,442 19,596 19,929 19,921 19,959 3%
Program Management 16,569 16,758 16,845 17,002 16,972 16,990 1%
Production, Quality and Man
9,860 10,099 10,224 10,544 10,510 10,555 5%
Test and Evaluation 8,730 8,764 8,716 8,738 8,754 8,737 0%
Business - FM 6,256 6,322 6,226 6,327 6,382 6,376 1%
Facilities Engineering 7,119 7,285 7,428 7,870 7,936 9,067 24%
Information Technology 6,539 6,676 6,696 6,836 6,916 6,967 4%
Auditing 4,261 4,151 4,042 4,011 4,008 3,937 -5%
Purchasing 1,375 1,421 1,458 1,475 1,536 1,531 8%
Business - CE 1,361 1,367 1,359 1,378 1,391 1,406 3%
S&T Manager 3,583 3,754 3,773 3,814 3,728 3,896 4%
Property 380 393 394 405 401 400 2%
Unknown/Other 72 41 40 33 26 26
↑TOTAL 3%
FY17Q2OverallDefense Acq WorkforceCareer Field
FY16Q3 FY16% Change
Since FY16Q2
FY16Q1 FY16Q2 FY17Q1
163,024 161,712 158,508 161,469 156,457 158,212

AWF FY17Q2 Key Information
AWF Historical DAWIA CertificationFY08 – FY17Q2 (Rate)
AT&L DataMart (as of 31 Mar 2017) 17
AWF FY17Q2 Key Information
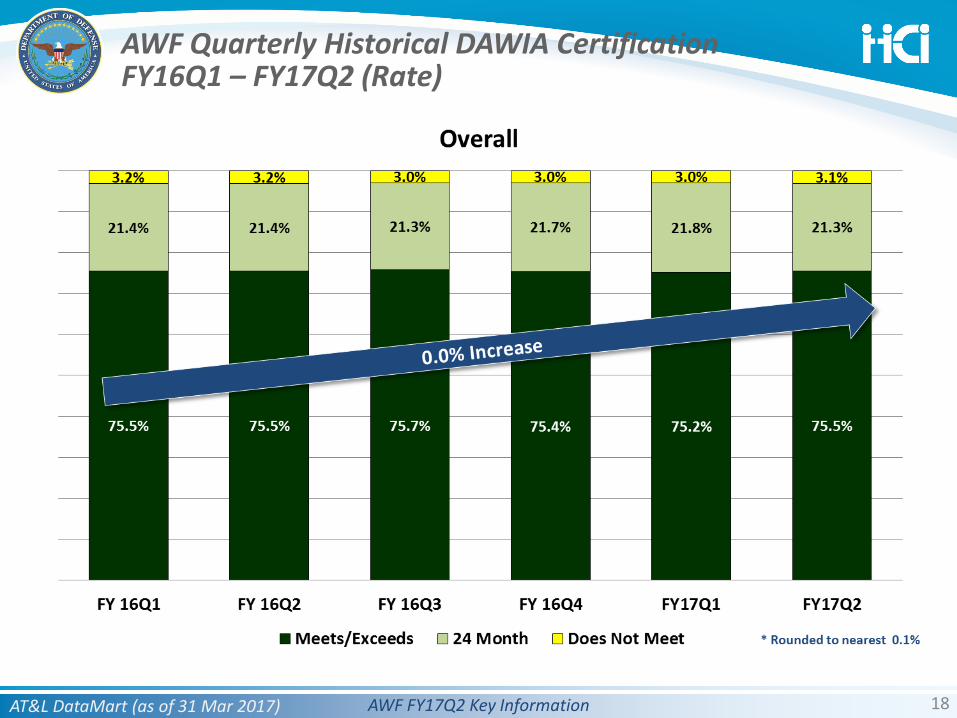
AWF Quarterly Historical DAWIA CertificationFY16Q1 – FY17Q2 (Rate)
AT&L DataMart (as of 31 Mar 2017) 18
AWF FY17Q2 Key Information
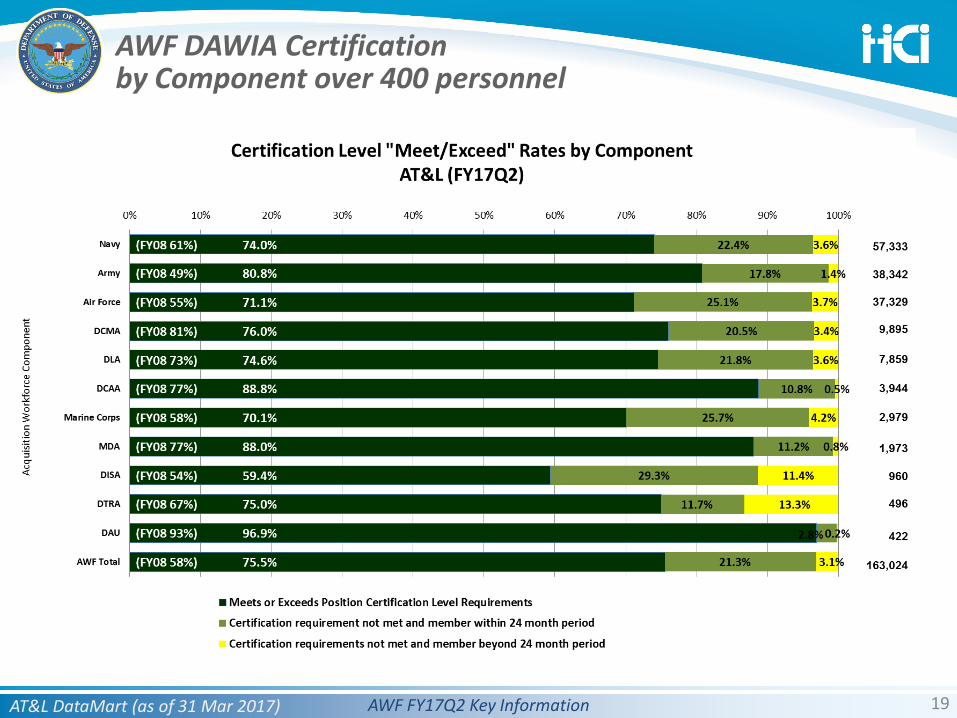
AWF DAWIA Certificationby Component over 400 personnel
AT&L DataMart (as of 31 Mar 2017) 19

AWF FY17Q2 Key Information
AWF DAWIA Certificationby Career Field
AT&L DataMart (as of 31 Mar 2017) 20

AWF FY17Q2 Key InformationAT&L DataMart (as of 31 Mar 2017) 21
DAWIA Certification Matrix + Bench StrengthDAW
Required Certification Level No Level Achieved Level I Level II Level III FY17Q2
TOTAL
% Meets Certification Requirement
Level I 7,953 8,932 2,397 769 20,051 60.3%Level II 12,202 9,785 43,021 18,219 83,227 73.6%Level III 3,625 1,624 4,558 49,769 59,576 83.5%Unspecified 69 38 45 18 170
FY17Q2 TOTAL 23,849 20,379 50,021 68,775 163,024 75.5%% TOTAL 14.6% 12.5% 30.7% 42.2%
No Level Achieved includes those within the 24 month grace period
Org# Meet or Exceeds
% Meets or Exceeds*
DAW 123,125 75.5%Army 30,969 80.8%Navy 42,435 74.0%Marine Cor 2,088 70.1%Air Force 26,555 71.1%4th Estate 21,078 77.9%
Certification RequirementMeets/ Exceeds
Within 24 Months
Does Not Meet
DAW TOTAL
Level I 12,098 7,571 382 20,051 12.3%Level II 61,240 19,197 2,790 83,227 51.1%Level III 49,769 7,909 1,898 59,576 36.5%
Unspecified 18 127 25 170 0.1%DAW TOTAL 123,125 34,804 5,095 163,024
% TOTAL 75.5% 21.3% 3.1%
= Compliance = Exceeds Requirement
* NOTE: Rounded to nearest 0.1%
Achieved Certification Level
Bench Strength

AWF FY17Q2 Key Information
AWF Demographics
AT&L DataMart (As of 31 Mar 2017)
Education
Mil / Civ
Race
GenderCAP / KLP
22
AWF FY17Q2 Key Information
KLPs Service/Agency Aud
iting
Bus
ines
s - C
ost E
stim
atin
g
Bus
ines
s - F
inan
cial
Mgm
t
Con
trac
ting
Eng
inee
ring
Fac
ilitie
s En
gine
erin
g
Indu
stria
l/Co
ntra
ct P
rope
rty
Mgt
Info
rmat
ion
Tech
nolo
gy
Life
Cyc
le L
ogis
tics
Pro
duct
ion,
Qua
lity
& M
anuf
.
Pro
gram
Man
agem
ent
Pur
chas
ing
S&
T M
anag
er
Tes
t and
Eva
luat
ion
Uns
peci
fied
FY17Q2 TOTAL
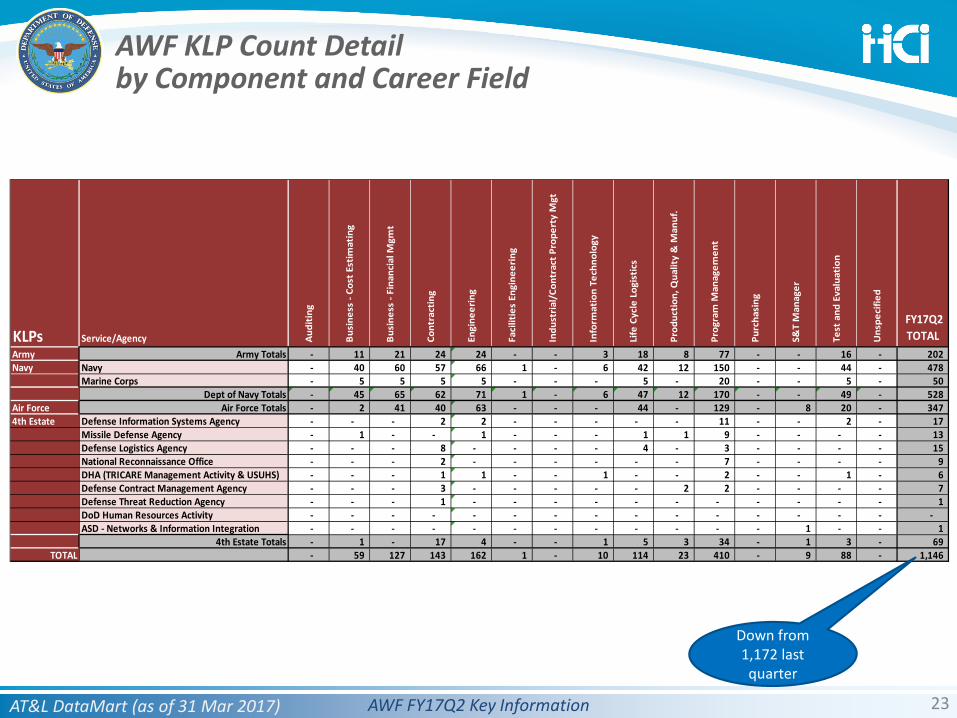
Army Army Totals - 11 21 24 24 - - 3 18 8 77 - - 16 - 202 Navy Navy - 40 60 57 66 1 - 6 42 12 150 - - 44 - 478
Marine Corps - 5 5 5 5 - - - 5 - 20 - - 5 - 50 Dept of Navy Totals - 45 65 62 71 1 - 6 47 12 170 - - 49 - 528
Air Force Air Force Totals - 2 41 40 63 - - - 44 - 129 - 8 20 - 347 4th Estate Defense Information Systems Agency - - - 2 2 - - - - - 11 - - 2 - 17
Missile Defense Agency - 1 - - 1 - - - 1 1 9 - - - - 13 Defense Logistics Agency - - - 8 - - - - 4 - 3 - - - - 15 National Reconnaissance Office - - - 2 - - - - - - 7 - - - - 9 DHA (TRICARE Management Activity & USUHS) - - - 1 1 - - 1 - - 2 - - 1 - 6 Defense Contract Management Agency - - - 3 - - - - - 2 2 - - - - 7 Defense Threat Reduction Agency - - - 1 - - - - - - - - - - - 1 DoD Human Resources Activity - - - - - - - - - - - - - - - - ASD - Networks & Information Integration - - - - - - - - - - - - 1 - - 1
4th Estate Totals - 1 - 17 4 - - 1 5 3 34 - 1 3 - 69 TOTAL - 59 127 143 162 1 - 10 114 23 410 - 9 88 - 1,146
AWF KLP Count Detailby Component and Career Field
AT&L DataMart (as of 31 Mar 2017) 23
Down from 1,172 last quarter
AWF FY17Q2 Key Information 24
RAND NDRI Forces and Resources Policy Center Data
Retirement, Gains/Losses Slides

AWF FY17Q2 Key Information
Overall Civilian Retirement Eligibility Distribution – FY08/FY17
25RAND NDRI (as of 31 Mar 17)

AWF FY17Q2 Key Information
Overall Civilian Retirement Eligibility Distribution – FY16Q2/FY17Q2
26RAND NDRI (as of 31 Mar 17)
2,187 (12%) increase

AWF FY17Q2 Key Information
Workforce Lifecycle Model by YRE
27RAND NDRI (as of 31 Mar 17)
2.4% increase since last quarter
AWF FY17Q2 Key Information
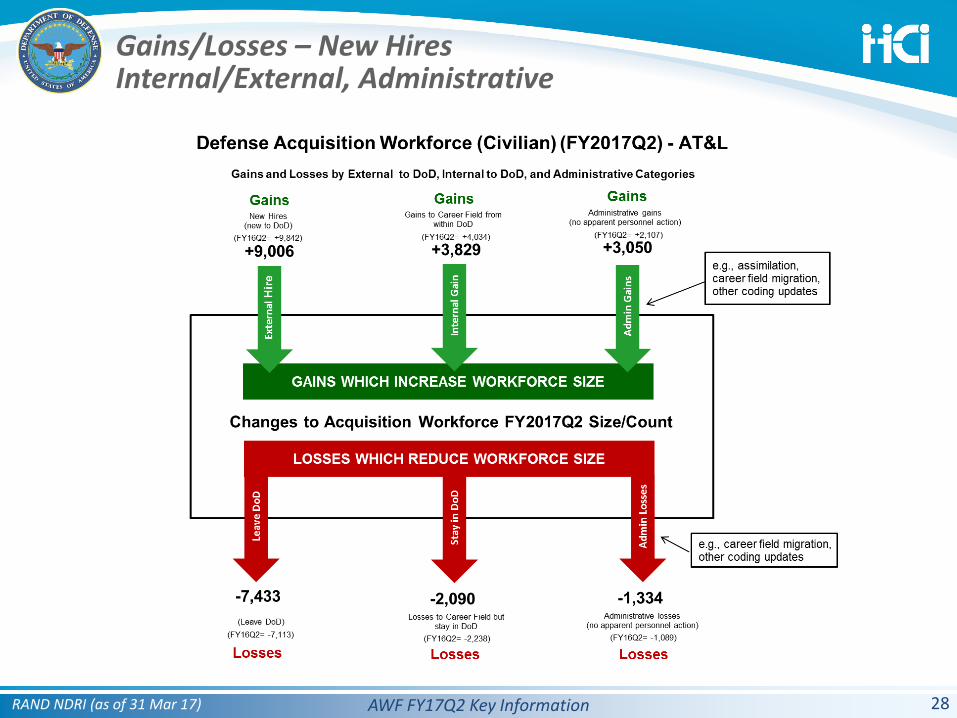
Gains/Losses – New HiresInternal/External, Administrative
28RAND NDRI (as of 31 Mar 17)

AWF FY17Q2 Key Information 29RAND NDRI (as of 31 Mar 17)

AWF FY17Q2 Key Information 30
Historical Gains and LossesFY08 – FY17Q2
RAND NDRI (as of 31 Mar 17)

AWF FY17Q2 Key Information 31
Historical Gains and Losses RatesFY08 – FY17Q2
RAND NDRI (as of 31 Mar 17)
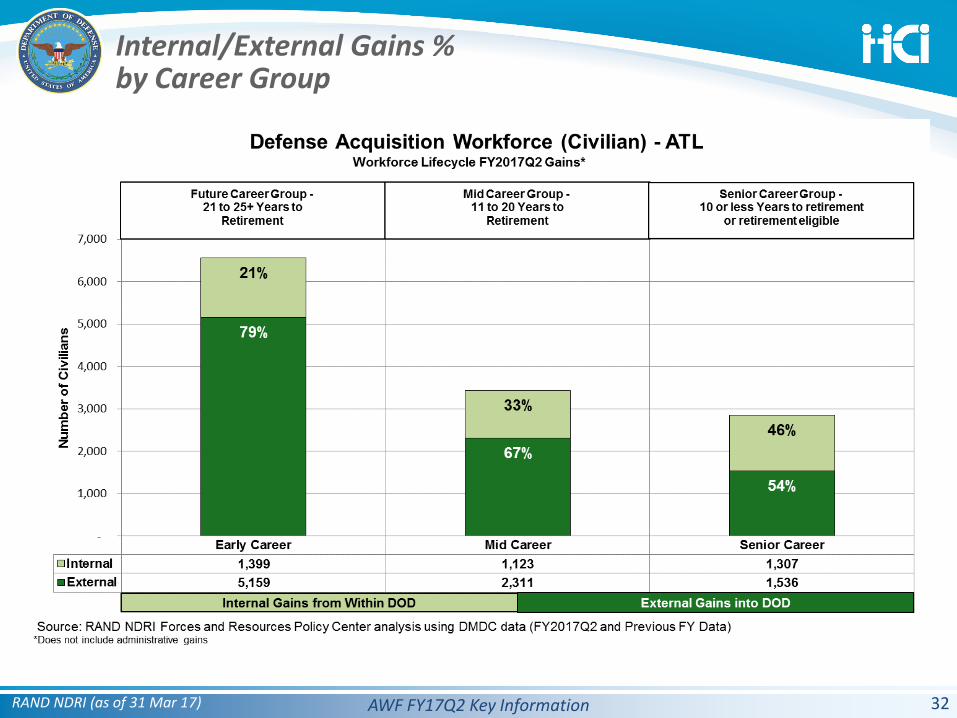
AWF FY17Q2 Key Information
Internal/External Gains %by Career Group
32RAND NDRI (as of 31 Mar 17)

AWF FY17Q2 Key Information
Internal/External Loss %by Career Group
33RAND NDRI (as of 31 Mar 17)
AWF FY17Q2 Key Information
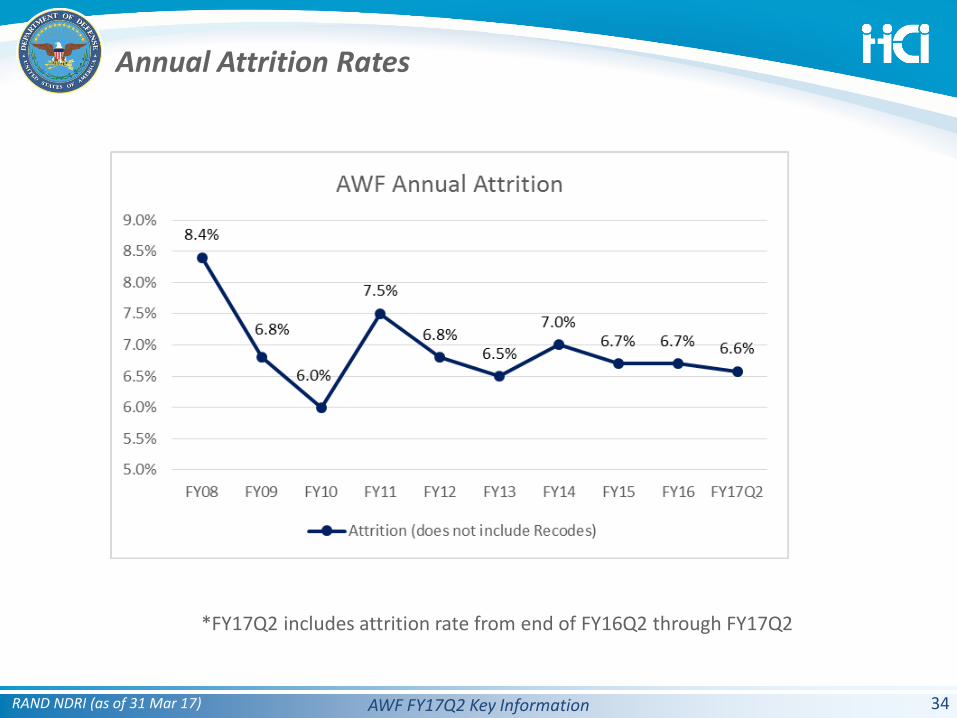
Annual Attrition Rates
34RAND NDRI (as of 31 Mar 17)
*FY17Q2 includes attrition rate from end of FY16Q2 through FY17Q2

AWF FY17Q2 Key Information
Attrition Rates by Career Group
35RAND NDRI (as of 31 Mar 17)
Needs updating
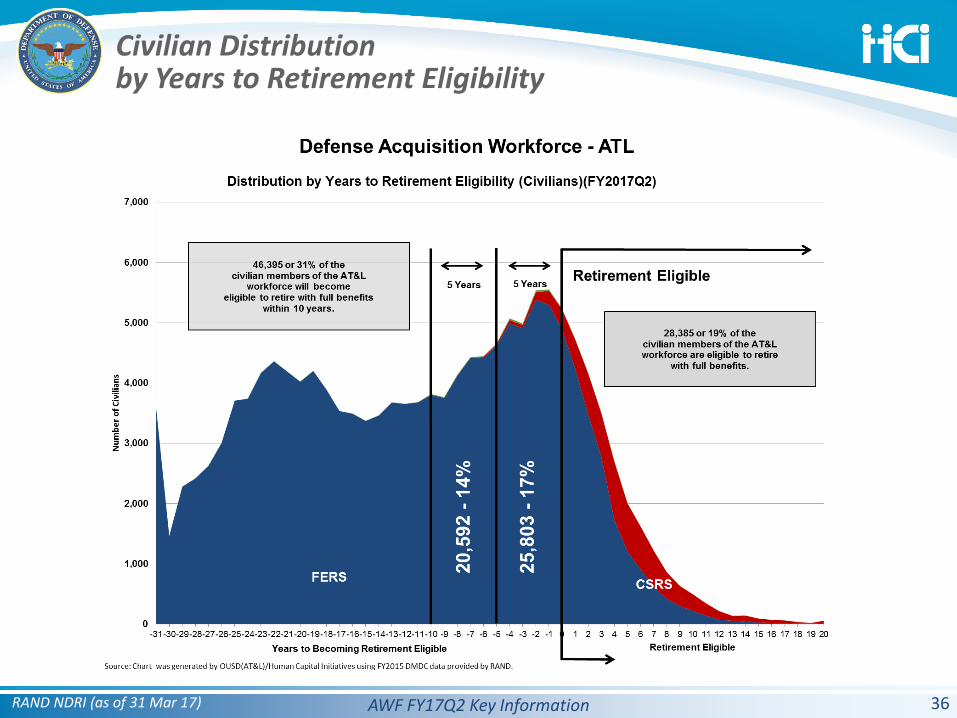
AWF FY17Q2 Key Information
Civilian Distributionby Years to Retirement Eligibility
36RAND NDRI (as of 31 Mar 17)