Embed Size (px)
Citation preview

30 years on the Road To Progressively Better Data
Deep Residual Network Architecture for Pavement Skid
Resistance Prediction By
Jashua Q. Li, Jason Zhan, Gary G. Yang, Kelvin WangSchool of Civil and Environmental Engineering
Oklahoma State University

30 years on the Road To Progressively Better Data
BackgroundRoadway departure: accounting for 53% of the total traffic fatalities in
the U.S. (FHWA 2017)25% of all European road fatalities related to diminished skid-resistanceDesired pavement friction: effective countermeasure to roadway
departure fatalities

30 years on the Road To Progressively Better Data
BackgroundPavement friction: the force resisting the relative motion between
vehicle tire and pavement surface Deteriorate with time under various factors
Some DOTs perform continuous monitoring
Friction Testing: British pendulum tester (BPT), dynamic friction tester (DFT), grip tester, locked-wheel trailer, Side-Force Coefficient Road Inventory Machine (SCRIM), etc.
DFT BPT

30 years on the Road To Progressively Better Data
Background
Locked-wheel Tester
Grip Tester
SCRIM

30 years on the Road To Progressively Better Data
BackgroundExisting friction measurements Require testing tire/rubber Require large water tank to wet the surface Disturbs the traffic flows during the tests Performed at project level Affected by temperature, test speed, contact pressure, water film
depth, tire tread, viscoelastic properties of testing tires et al.
• Predict pavement friction using non-contact measurements:
Challenging

30 years on the Road To Progressively Better Data
BackgroundPavement texture: the deviations of pavement surface from a true
planar surface High speed profiler Collect texture data at highway speed and network level Non-contact method Widely implemented by DOTs
• Predict pavement friction from the high speed profiler data:
Could be a surrogate of tradition friction testing

30 years on the Road To Progressively Better Data
Problem StatementNo consistent relationships between texture indicators and friction via
traditional methodologies Macro-texture
MPD: simplified representation of rich texture profiles
MTD: labor and time consuming, require traffic control, and subjective
Micro-texture: lab testing on limited area, high speed instrument not available
MPD Calculation in ASTM

30 years on the Road To Progressively Better Data
Problem StatementMachine-learning (ML) technology
Fail to process natural data in its raw form Require domain experts to pre-process the input data Developing customized feature extractor(s)
Deep learning (DL) neural networks
Allow a machine to be fed with raw data Automatically discover the representations needed for detection or classification Led to many breakthroughs for image classification and recognition However, deeper neural networks were much more difficult to train than
expected: degradation problem

30 years on the Road To Progressively Better Data
ObjectivesDeep Residual Network Architecture for pavement skid resistance prediction
Use non-contact high speed texture measurement to predict pavement friction
Learn and extract the textural features and classification boundaries automatically from raw input data
“Convolutional group” and “skipped connection” perfectly solves the problem of “degradation”
Develop Friction-ResNets model with 11 convolution layers: high prediction accuracy

30 years on the Road To Progressively Better Data
Data Source
FHWA, LONG TERM PERFORMANCE MONITORING OF HIGH FRICTION SURFACING TREATMENTS (HFST) SITES (3 YR)

30 years on the Road To Progressively Better Data
Data Source
(a) HFST from WV-I77
(b) AC from KY-605
(c) PCC from OK-I44
(d) Grooved AC from MO-I44
(e) Grooved PCC from IA-I80-Ramp
(f) Bridge Deck from TN-SR385
Distributiono 49 HFST Sites o In 12 states
Deviceso High Speed Profiler o Grip Tester

30 years on the Road To Progressively Better Data
Data Collection DevicesAMES 8300 High Speed Profiler Surface macro-texture data & standard profile data at highway speed
(25 - 65 mph ) Mean Profile Depth (MPD) & roughness index (IRI) Resolution: 0.045 mm in vertical direction and 0.5 mm profile
wavelength.

30 years on the Road To Progressively Better Data
Data Collection DevicesGrip Tester Continuously friction measurement equipment (CFME)
Operating around the critical slip of an anti-lock braking system (3.28-ft intervals, 40 mph testing speed and a constant water film thickness of 0.25 mm)
Airports and highways safety management

30 years on the Road To Progressively Better Data
Deep Residual Networks (ResNets)Newest trends in Artificial Intelligence: deep learning (DL)Top-ranked teams on ImageNet challenging all exploit “very deep” modelsPredict friction using non-contact texture measurementsDeeper neural networks are much more difficult to train than expected:
exploding/vanishing gradient problem
Training error (left) and test error (right) on CIFAR-10with 20-layer and 56-layer networks (He et al. 2016)

30 years on the Road To Progressively Better Data
Deep Residual Networks (ResNets)Lower gradients: circumvent the exploding gradient problem“Skipped connection” & “residual unit”: solve the “vanishing” problemResidual unit performs the following computation
𝑋𝑋𝑖𝑖 :input feature to the ith residual unit.
𝑊𝑊𝑖𝑖 = 𝑊𝑊𝑖𝑖,𝑘𝑘 1 ≤ 𝑘𝑘 ≤ 𝐾𝐾} : a set of weights (and biases)
associated with ith residual unit
K: number of layers in a residual unit.
Function F: denotes the type of residual work in each unit
𝑋𝑋𝑖𝑖+1 = 𝑋𝑋𝑖𝑖 + 𝐹𝐹 𝑋𝑋𝑖𝑖 ,𝑊𝑊𝑖𝑖
30 years on the Road To Progressively Better Data
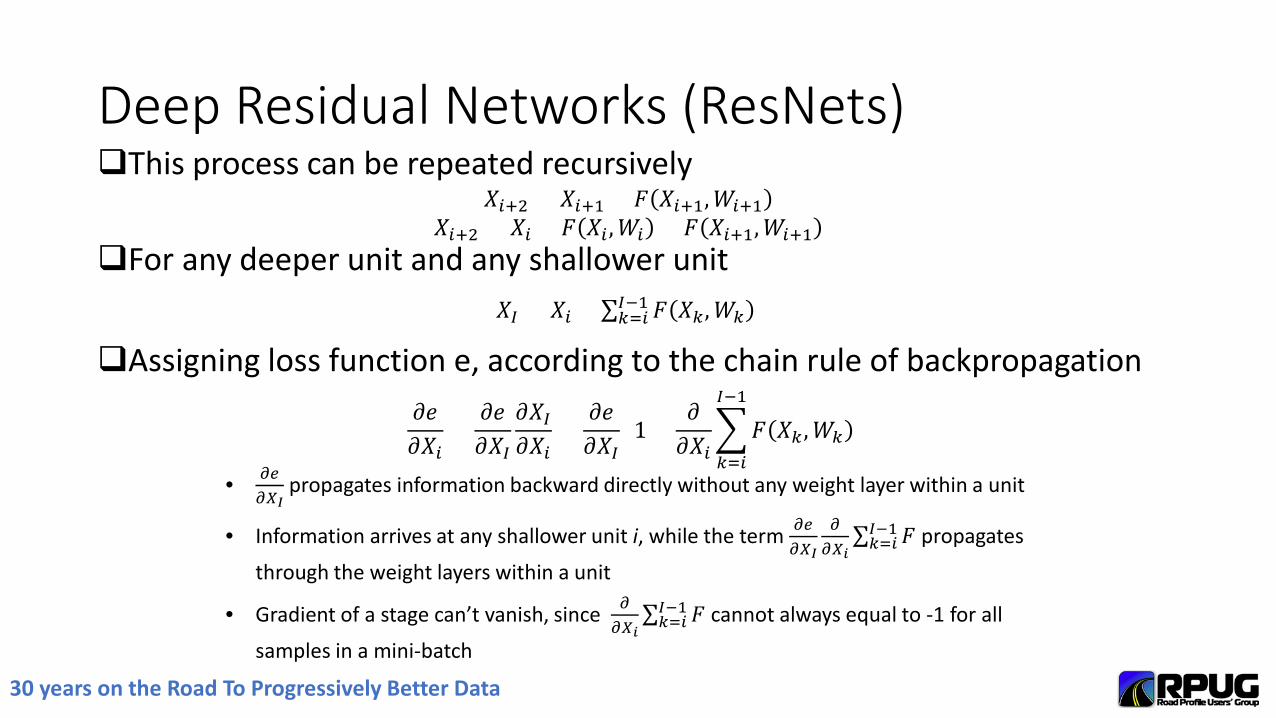
Deep Residual Networks (ResNets)This process can be repeated recursively
For any deeper unit and any shallower unit
Assigning loss function e, according to the chain rule of backpropagation𝑋𝑋𝐼𝐼 = 𝑋𝑋𝑖𝑖 + ∑𝑘𝑘=𝑖𝑖𝐼𝐼−1 𝐹𝐹 𝑋𝑋𝑘𝑘 ,𝑊𝑊𝑘𝑘
𝑋𝑋𝑖𝑖+2 = 𝑋𝑋𝑖𝑖+1 + 𝐹𝐹 𝑋𝑋𝑖𝑖+1,𝑊𝑊𝑖𝑖+1𝑋𝑋𝑖𝑖+2 = 𝑋𝑋𝑖𝑖 + 𝐹𝐹 𝑋𝑋𝑖𝑖 ,𝑊𝑊𝑖𝑖 + 𝐹𝐹 𝑋𝑋𝑖𝑖+1,𝑊𝑊𝑖𝑖+1
𝜕𝜕𝜕𝜕𝜕𝜕𝑋𝑋𝑖𝑖
=𝜕𝜕𝜕𝜕𝜕𝜕𝑋𝑋𝐼𝐼
𝜕𝜕𝑋𝑋𝐼𝐼𝜕𝜕𝑋𝑋𝑖𝑖
=𝜕𝜕𝜕𝜕𝜕𝜕𝑋𝑋𝐼𝐼
(1 +𝜕𝜕𝜕𝜕𝑋𝑋𝑖𝑖
�𝑘𝑘=𝑖𝑖
𝐼𝐼−1
𝐹𝐹 𝑋𝑋𝑘𝑘 ,𝑊𝑊𝑘𝑘 )
• 𝜕𝜕𝜕𝜕𝜕𝜕𝑋𝑋𝐼𝐼
propagates information backward directly without any weight layer within a unit
• Information arrives at any shallower unit i, while the term 𝜕𝜕𝜕𝜕𝜕𝜕𝑋𝑋𝐼𝐼
𝜕𝜕𝜕𝜕𝑋𝑋𝑖𝑖
∑𝑘𝑘=𝑖𝑖𝐼𝐼−1 𝐹𝐹 propagates
through the weight layers within a unit
• Gradient of a stage can’t vanish, since 𝜕𝜕𝜕𝜕𝑋𝑋𝑖𝑖
∑𝑘𝑘=𝑖𝑖𝐼𝐼−1 𝐹𝐹 cannot always equal to -1 for all
samples in a mini-batch

30 years on the Road To Progressively Better Data
Profile SpectrogramPair raw pavement texture profile with friction number for each 3.28-feet
segment
Spectrogram: a visual representation of the spectrum of signal frequencies as they vary with time or some other variable

30 years on the Road To Progressively Better Data
Convolutional GroupConvolution: adding each element of the 2D matrix to its local neighbors,
weighted by the 3*3 kernel
BN: makes normalization a part of the model architecture performs the normalization for each training mini-batchReLU: most commonly used activation function in DL Helps a network account for interaction
Capture non-linearity’s characteristics so as to improve discriminative performance

30 years on the Road To Progressively Better Data
Friction-ResNets ArchitectureFrcition-ResNets architecture 13 layers: 11 convolution, 1 average pooling, and 1 output layer
Stage Name Stage 1 Stage 2 Stage 3 Stage 4 Average pooling
Output Size 51*48 51*48 25*24 12*12 1*1
Number of kernels (3*3) 16 32 64 96 -
Number of Conv Units 1 conv layer 3 conv groups 1 conv group 1 conv group -

30 years on the Road To Progressively Better Data
Training/Validation/TestEight bins at every 0.1 interval ranging from 0.2 to 1.0
<0.2, 0.3, 0.4, 0.5, 0.6, 0.7, 0.8, >0.9
4,200 pairs of data randomly selected from each bin of friction level
70%, 15% and 15% for training, validation, and testing
Training platform: Pytorch
Training hardware: Intel (R) Core (TM) i7-4702HQ CPU @ 2.20 GHz
Training time: 9.2 hours with 8000 iterations (65 epochs)

30 years on the Road To Progressively Better Data
Learning Curve8000 iterations (65 epochs)Training accuracy: 99.85%Validation accuracy: 91.95%

30 years on the Road To Progressively Better Data
Testing Results EvaluationTesting
Distribution
Predicted Friction Level
<0.2 0.3 0.4 0.5 0.6 0.7 0.8 >0.9
Actual
Friction
Level
<0.2 579 11 10 9 12 3 2 4
0.3 11 565 10 12 11 9 8 4
0.4 10 17 568 8 7 4 8 8
0.5 11 5 9 582 7 5 7 4
0.6 1 8 7 8 590 9 6 1
0.7 2 2 11 3 12 588 7 5
0.8 3 10 15 10 6 16 551 19
>0.9 3 6 5 5 4 9 19 579
Test accuracy: 91.3%
30 years on the Road To Progressively Better Data
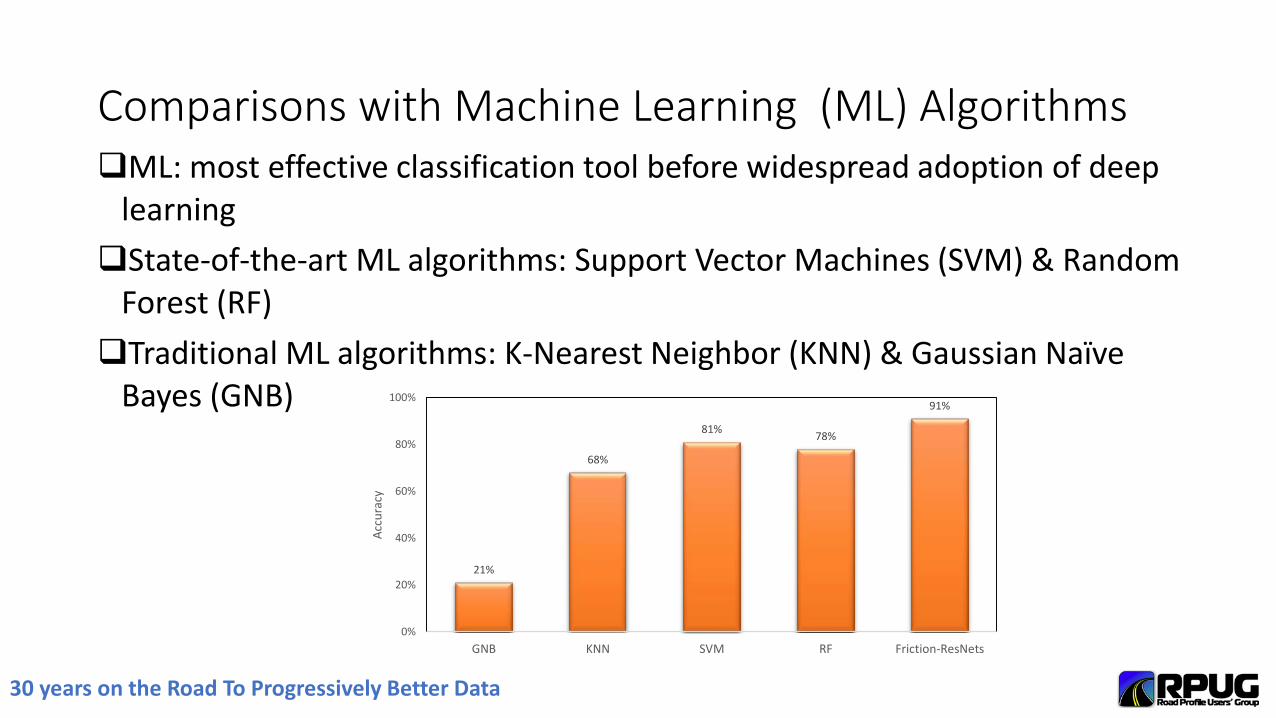
Comparisons with Machine Learning (ML) AlgorithmsML: most effective classification tool before widespread adoption of deep
learning State-of-the-art ML algorithms: Support Vector Machines (SVM) & Random
Forest (RF)Traditional ML algorithms: K-Nearest Neighbor (KNN) & Gaussian Naïve
Bayes (GNB)
21%
68%
81% 78%
91%
0%
20%
40%
60%
80%
100%
GNB KNN SVM RF Friction-ResNets
Accu
racy

30 years on the Road To Progressively Better Data
ConclusionsLarge amount of texture and friction data collected on diverse pavement
surfaces 23,520 pairs of data for training, 10,080 pairs of data for validation and testing
Friction-ResNets: ResNets based friction prediction model 11 convolutional layers with millions parameters
Achieve 99.85% training accuracy, 91.95% validation accuracy and 91.3% testing accuracy
Outperform other machine learning algorithms
Using non-contact texture measurements to predict friction

30 years on the Road To Progressively Better Data
Thanks and Questions?
Gary G. [email protected]
School of Civil and Environmental EngineeringOklahoma State University