Embed Size (px)
Citation preview

© 2016, Amazon Web Services, Inc. or its Affi liates. All rights reserved.
Pratim Das
Specialist Solutions Architect, Data & Analytics, EMEA
28th June, 2017
Deep Dive on Amazon Redshift

Agenda
Deep inside Redshift Architecture
Integration with AWS data services
Redshift Spectrum
Redshift Echo System
Redshift at Manchester Airport Group
Summary + Q&A
Performance tuning
Redshift Architecture
Architecture Tuning Integration SpectrumEcho
SystemMAG Summary

Managed Massively Parallel Petabyte Scale Data
Warehouse
Streaming Backup/Restore to S3
Load data from S3, DynamoDB and EMR
Extensive Security Features
Scale from 160 GB -> 2 PB Online
Fast
CompatibleSecure
ElasticSimple
Cost
Efficient
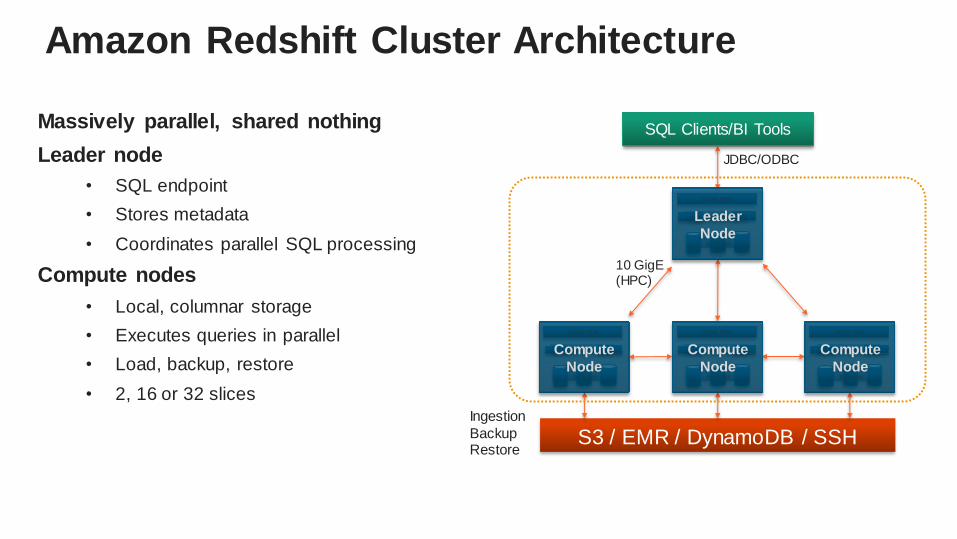
Amazon Redshift Cluster Architecture
Massively parallel, shared nothing
Leader node
• SQL endpoint
• Stores metadata
• Coordinates parallel SQL processing
Compute nodes
• Local, columnar storage
• Executes queries in parallel
• Load, backup, restore
• 2, 16 or 32 slices
10 GigE(HPC)
Ingestion
BackupRestore
SQL Clients/BI Tools
128GB RAM
16TB disk
16 cores
S3 / EMR / DynamoDB / SSH
JDBC/ODBC
128GB RAM
16TB disk
16 coresCompute
Node
128GB RAM
16TB disk
16 coresCompute
Node
128GB RAM
16TB disk
16 coresCompute
Node
Leader
Node
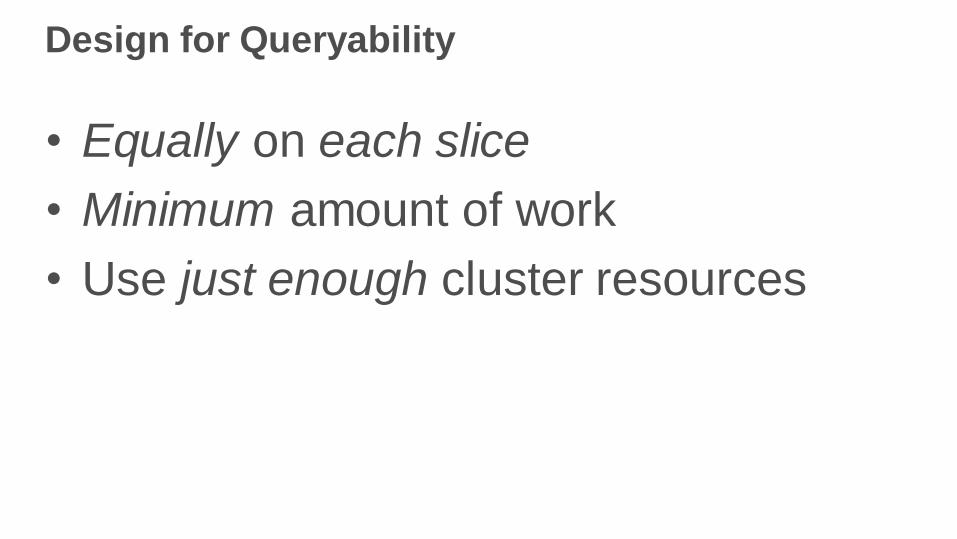
Design for Queryability
• Equally on each slice
• Minimum amount of work
• Use just enough cluster resources

Do an Equal Amount of Work
on Each Slice
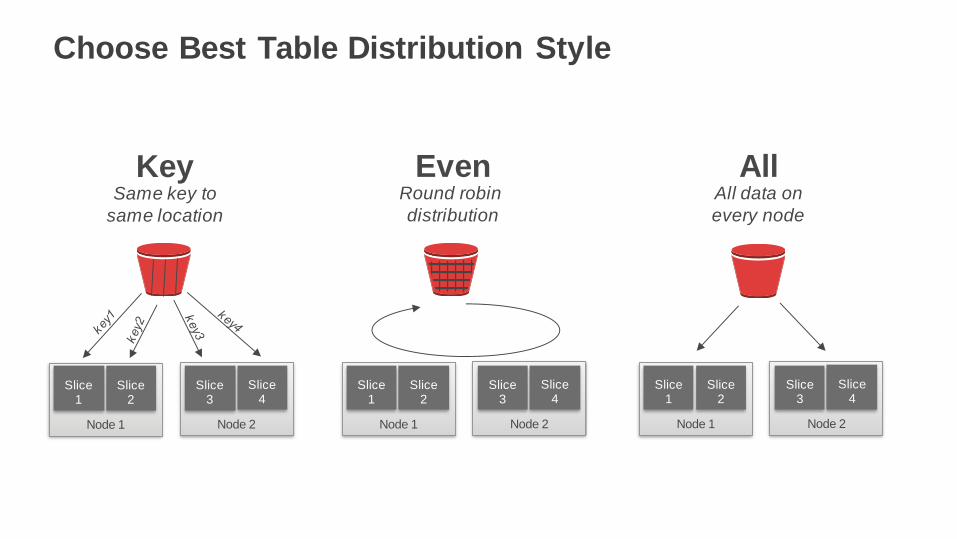
Choose Best Table Distribution Style
All
Node 1
Slice 1
Slice 2
Node 2
Slice 3
Slice 4
All data on
every node
Key
Node 1
Slice 1
Slice 2
Node 2
Slice 3
Slice 4
Same key to
same location
Node 1
Slice 1
Slice 2
Node 2
Slice 3
Slice 4
EvenRound robin
distribution

Do the Minimum Amount of
Work on Each Slice

Columnar storage
+
Large data block sizes
+
Data compression
+
Zone maps
+
Direct-attached storage
analyze compression listing;
Table | Column | Encoding
---------+----------------+----------
listing | listid | delta
listing | sellerid | delta32k
listing | eventid | delta32k
listing | dateid | bytedict
listing | numtickets | bytedict
listing | priceperticket | delta32k
listing | totalprice | mostly32
listing | listtime | raw
10 | 13 | 14 | 26 |…
… | 100 | 245 | 324
375 | 393 | 417…
… 512 | 549 | 623
637 | 712 | 809 …
… | 834 | 921 | 959
10
324
375
623
637
959
Reduced I/O = Enhanced Performance
Use Cluster Resources
Efficiently to Complete as
Quickly as Possible

Amazon Redshift Workload Management
Waiting
Workload Management
BI tools
SQL clients
Analytics tools
Client
Running
Queries: 80% memory
ETL: 20% memory
4 Slots
2 Slots
80/4 = 20% per slot
20/2 = 10% per slot

Redshift Performance Tuning
Architecture Tuning Integration SpectrumEcho
SystemMAG Summary
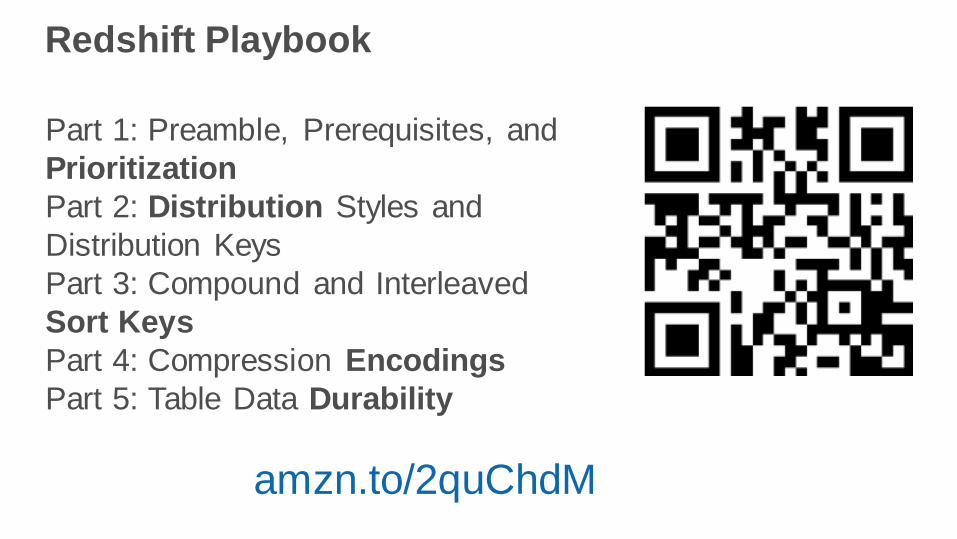
Redshift Playbook
Part 1: Preamble, Prerequisites, and
Prioritization
Part 2: Distribution Styles and
Distribution Keys
Part 3: Compound and Interleaved
Sort Keys
Part 4: Compression Encodings
Part 5: Table Data Durability
amzn.to/2quChdM

Optimizing Amazon Redshift by Using the AWS
Schema Conversion Tool
amzn.to/2sTYow1

Ingestion, ETL & BI
Architecture Tuning Integration SpectrumEcho
SystemMAG Summary

Getting data to Redshift using AWS DMS
Simple to use Minimal Downtime Supports most widely
used Databases
Low Cost Fast & Easy to Set-up Reliable
Loading data from S3
• Splitting Your Data into Multiple Files
• Uploading Files to Amazon S3
• Using the COPY Command to Load from
Amazon S3

ETL on Redshift
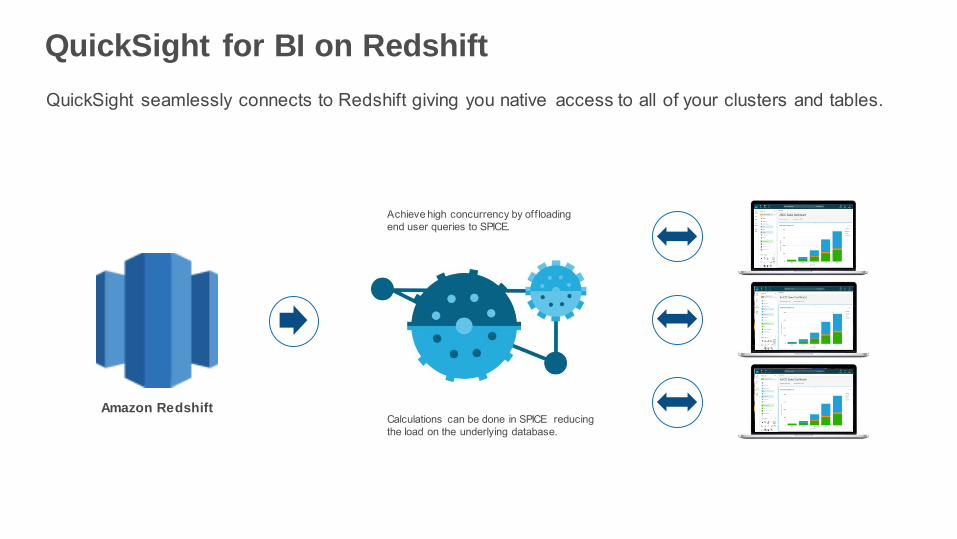
QuickSight for BI on Redshift
Amazon Redshift

Amazon Redshift Spectrum
Architecture Tuning Integration SpectrumEcho
SystemMAG Summary

Amazon Redshift Spectrum
Run SQL queries directly against data in S3 using thousands of nodes
Fast @ exabyte scale Elastic & highly available On-demand, pay-per-query
High concurrency: Multiple
clusters access same data
No ETL: Query data in-place
using open file formats
Full Amazon Redshift
SQL support
S3SQL

Query
SELECT COUNT(*)
FROM S3.EXT_TABLE
GROUP BY…
Life of a query
Amazon Redshift
JDBC/ODBC
...
1 2 3 4 N
Amazon S3Exabyte-scale object storage
Data CatalogApache Hive Metastore
1

Query is optimized and compiled at
the leader node. Determine what gets
run locally and what goes to Amazon
Redshift Spectrum
Life of a query
Amazon Redshift
JDBC/ODBC
...
1 2 3 4 N
Amazon S3Exabyte-scale object storage
Data CatalogApache Hive Metastore
2

Query plan is sent to
all compute nodes
Life of a query
Amazon Redshift
JDBC/ODBC
...
1 2 3 4 N
Amazon S3Exabyte-scale object storage
Data CatalogApache Hive Metastore
3

Compute nodes obtain partition info from
Data Catalog; dynamically prune partitions
Life of a query
Amazon Redshift
JDBC/ODBC
...
1 2 3 4 N
Amazon S3Exabyte-scale object storage
Data CatalogApache Hive Metastore
4

Each compute node issues multiple
requests to the Amazon Redshift
Spectrum layer
Life of a query
Amazon Redshift
JDBC/ODBC
...
1 2 3 4 N
Amazon S3Exabyte-scale object storage
Data CatalogApache Hive Metastore
5
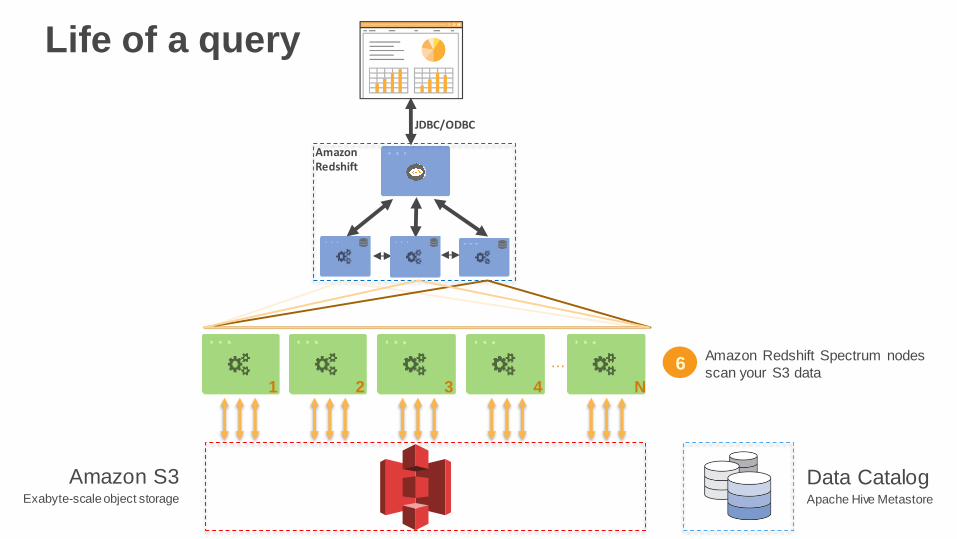
Amazon Redshift Spectrum nodes
scan your S3 data
Life of a query
Amazon Redshift
JDBC/ODBC
...
1 2 3 4 N
Amazon S3Exabyte-scale object storage
Data CatalogApache Hive Metastore
6

7Amazon Redshift
Spectrum projects,
filters, joins and
aggregates
Life of a query
Amazon Redshift
JDBC/ODBC
...
1 2 3 4 N
Amazon S3Exabyte-scale object storage
Data CatalogApache Hive Metastore

Final aggregations and joins
with local Amazon Redshift
tables done in-cluster
Life of a query
Amazon Redshift
JDBC/ODBC
...
1 2 3 4 N
Amazon S3Exabyte-scale object storage
Data CatalogApache Hive Metastore
8
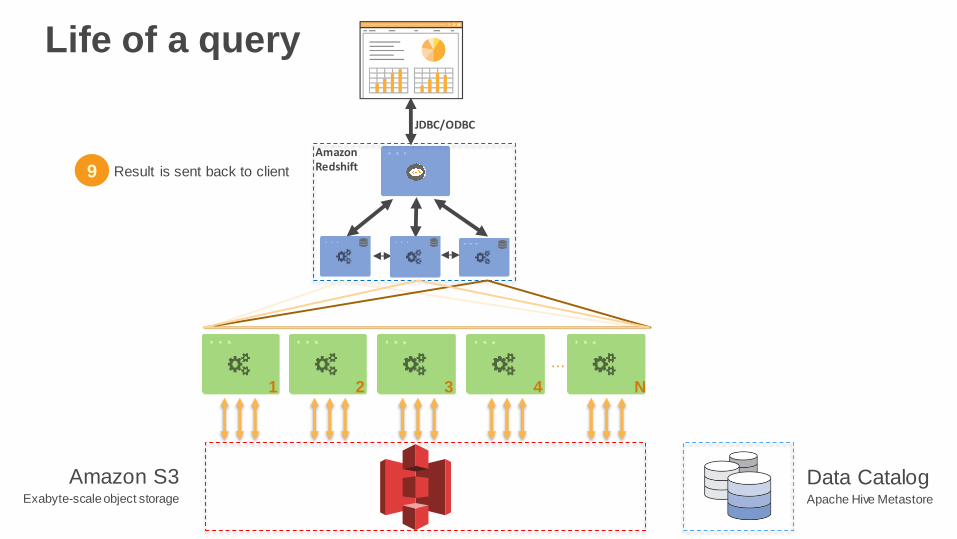
Result is sent back to client
Life of a query
Amazon Redshift
JDBC/ODBC
...
1 2 3 4 N
Amazon S3Exabyte-scale object storage
Data CatalogApache Hive Metastore
9

Demo:
Running an analytic query
over an exabyte in S3

Lets build an analytic query - #1
An author is releasing the 8th book in her popular series. How
many should we order for Seattle? What were prior first few
day sales?
Lets get the prior books she’s written.
1 Table
2 Filters
SELECT P.ASIN, P.TITLE
FROM products P
WHERE P.TITLE LIKE ‘%POTTER%’ ANDP.AUTHOR = ‘J. K. Rowling’
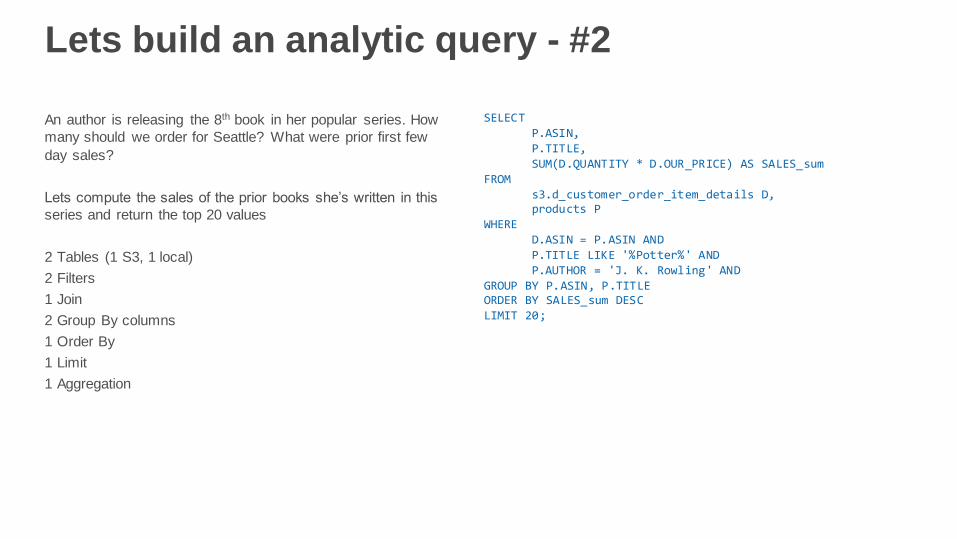
Lets build an analytic query - #2
An author is releasing the 8th book in her popular series. How
many should we order for Seattle? What were prior first few
day sales?
Lets compute the sales of the prior books she’s written in this
series and return the top 20 values
2 Tables (1 S3, 1 local)
2 Filters
1 Join
2 Group By columns
1 Order By
1 Limit
1 Aggregation
SELECTP.ASIN,P.TITLE,SUM(D.QUANTITY * D.OUR_PRICE) AS SALES_sum
FROMs3.d_customer_order_item_details D,products P
WHERED.ASIN = P.ASIN ANDP.TITLE LIKE '%Potter%' ANDP.AUTHOR = 'J. K. Rowling' AND
GROUP BY P.ASIN, P.TITLEORDER BY SALES_sum DESCLIMIT 20;

Lets build an analytic query - #3
An author is releasing the 8th book in her popular series. How
many should we order for Seattle? What were prior first few
day sales?
Lets compute the sales of the prior books she’s written in this
series and return the top 20 values, just for the first three days
of sales of first editions
3 Tables (1 S3, 2 local)
5 Filters
2 Joins
3 Group By columns
1 Order By
1 Limit
1 Aggregation
1 Function
2 Casts
SELECTP.ASIN,P.TITLE,P.RELEASE_DATE,SUM(D.QUANTITY * D.OUR_PRICE) AS SALES_sum
FROMs3.d_customer_order_item_details D,asin_attributes A,products P
WHERED.ASIN = P.ASIN ANDP.ASIN = A.ASIN ANDA.EDITION LIKE '%FIRST%' ANDP.TITLE LIKE '%Potter%' ANDP.AUTHOR = 'J. K. Rowling' ANDD.ORDER_DAY :: DATE >= P.RELEASE_DATE ANDD.ORDER_DAY :: DATE < dateadd(day, 3, P.RELEASE_DATE)
GROUP BY P.ASIN, P.TITLE, P.RELEASE_DATEORDER BY SALES_sum DESCLIMIT 20;
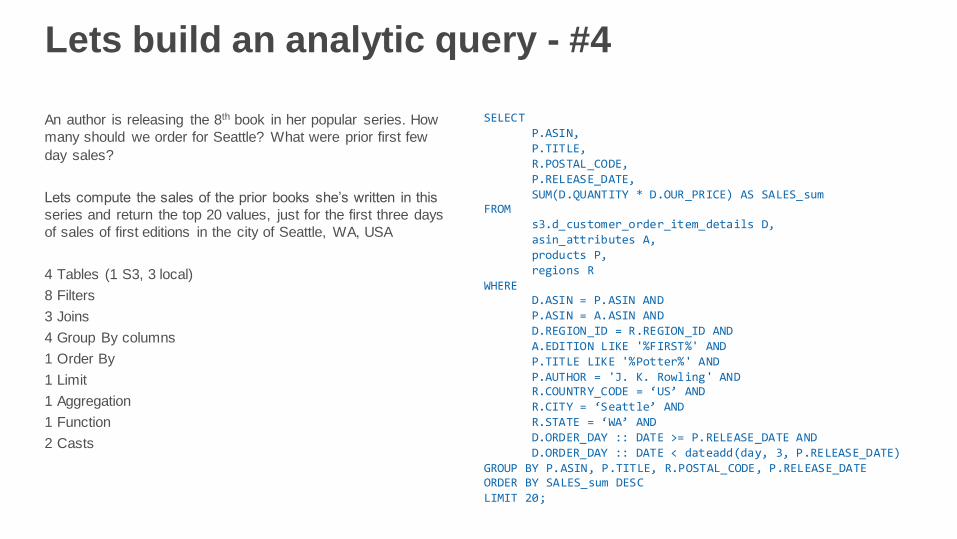
Lets build an analytic query - #4
An author is releasing the 8th book in her popular series. How
many should we order for Seattle? What were prior first few
day sales?
Lets compute the sales of the prior books she’s written in this
series and return the top 20 values, just for the first three days
of sales of first editions in the city of Seattle, WA, USA
4 Tables (1 S3, 3 local)
8 Filters
3 Joins
4 Group By columns
1 Order By
1 Limit
1 Aggregation
1 Function
2 Casts
SELECTP.ASIN,P.TITLE,R.POSTAL_CODE,P.RELEASE_DATE,SUM(D.QUANTITY * D.OUR_PRICE) AS SALES_sum
FROMs3.d_customer_order_item_details D,asin_attributes A,products P,regions R
WHERED.ASIN = P.ASIN ANDP.ASIN = A.ASIN ANDD.REGION_ID = R.REGION_ID ANDA.EDITION LIKE '%FIRST%' ANDP.TITLE LIKE '%Potter%' ANDP.AUTHOR = 'J. K. Rowling' ANDR.COUNTRY_CODE = ‘US’ ANDR.CITY = ‘Seattle’ ANDR.STATE = ‘WA’ ANDD.ORDER_DAY :: DATE >= P.RELEASE_DATE ANDD.ORDER_DAY :: DATE < dateadd(day, 3, P.RELEASE_DATE)
GROUP BY P.ASIN, P.TITLE, R.POSTAL_CODE, P.RELEASE_DATEORDER BY SALES_sum DESCLIMIT 20;
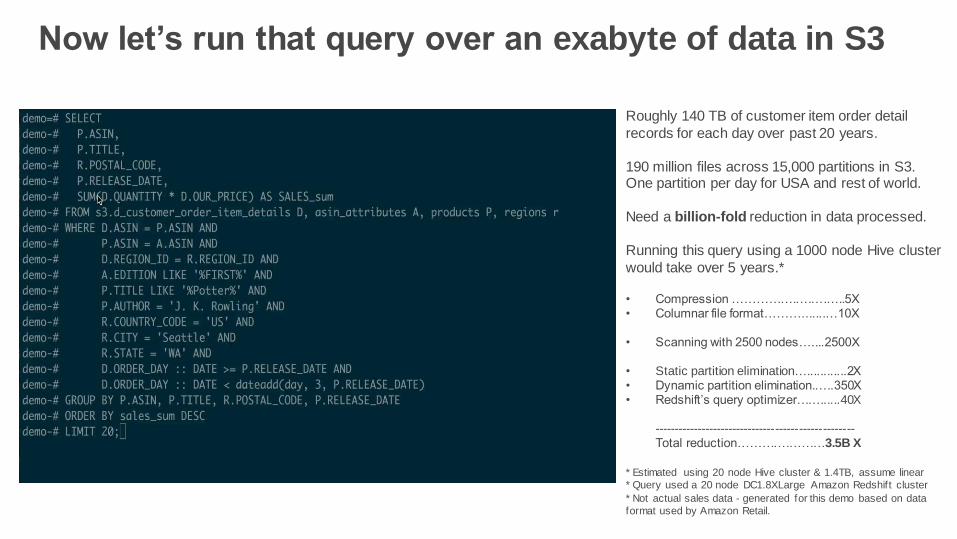
Now let’s run that query over an exabyte of data in S3
Roughly 140 TB of customer item order detail
records for each day over past 20 years.
190 million files across 15,000 partitions in S3. One partition per day for USA and rest of world.
Need a billion-fold reduction in data processed.
Running this query using a 1000 node Hive cluster
would take over 5 years.*
• Compression ……………..….……..5X• Columnar file format……….......…10X
• Scanning with 2500 nodes…....2500X
• Static partition elimination…............2X• Dynamic partition elimination..….350X• Redshift’s query optimizer……......40X
---------------------------------------------------Total reduction……….…………3.5B X
* Estimated using 20 node Hive cluster & 1.4TB, assume linear
* Query used a 20 node DC1.8XLarge Amazon Redshift cluster
* Not actual sales data - generated for this demo based on data
format used by Amazon Retail.

Is Amazon Redshift Spectrum useful if I don’t have an exabyte?
Your data will get bigger
On average, data warehousing volumes grow 10x every 5 years
The average Amazon Redshift customer doubles data each year
Amazon Redshift Spectrum makes data analysis simpler
Access your data without ETL pipelines
Teams using Amazon EMR, Athena & Redshift can collaborate using the same data lake
Amazon Redshift Spectrum improves availability and concurrency
Run multiple Amazon Redshift clusters against common data
Isolate jobs with tight SLAs from ad hoc analysis
Redshift Partner Echo System
Architecture Tuning Integration SpectrumEcho
SystemMAG Summary

4 types of partners
• Load and transform your data with Data Integration
Partners
• Analyze data and share insights across your
organization with Business Intelligence Partners
• Architect and implement your analytics platform
with System Integration and Consulting Partners
• Query, explore and model your data using tools and
utilities from Query and Data Modeling Partners
aws.amazon.com/redshift/partners/
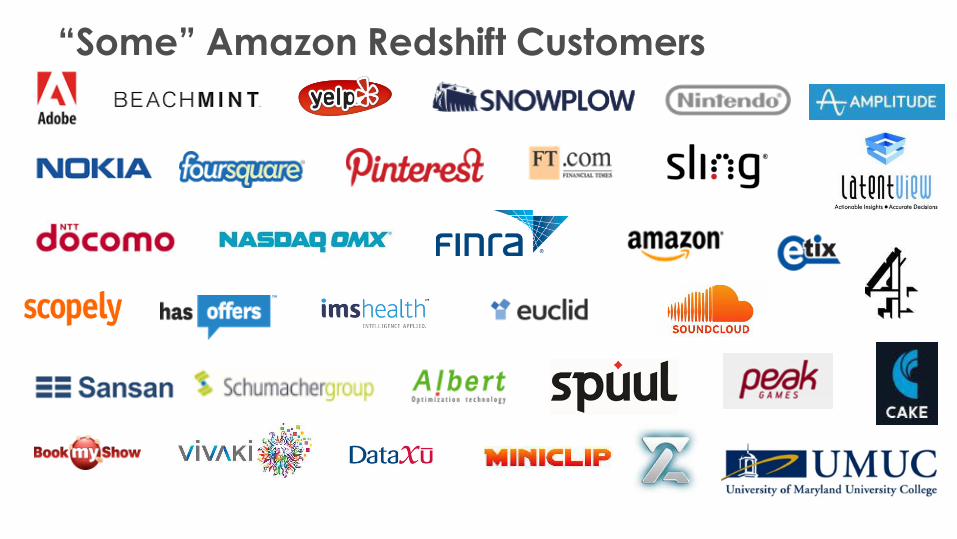
“Some” Amazon Redshift Customers

© 2016, Amazon Web Services, Inc. or its Affi liates. All rights reserved.
Stuart Hutson
Head of Data and BI, MAG
+
Munsoor Negyal
Director of Data Science, Crimson Macaw
Manchester Airport Group
An AWS Redshift customer story

MAG – take-off with cloud and dataStuart Hutson – Head of Data and BI

THE AVIATION PROFESSIONALS
MAG is privately managed on behalf of its shareholders, the local authorities of Greater Manchester
and Industry Funds Management (IFM). IFM is a highly experienced, long-term investor in airports
and already has significant interests in ten airports across Australia and Europe.
44
48.5 MILLION passengers serv ed per
year.
Ov er 80 AIRLINES serv ing 272
DESTINATIONS direct.
£134.3 MILLION RETAIL INCOME per
annum deliv ered v ia 200+ shops, bars
and restaurants.
£125.7 MILLION CAR PARKS INCOME
deliv ered v ia 96,000 parking spaces.
£623 MILLION property assets across all
airports, 5.67m sq ft of commercial
property.
£738.4 MILLION REVENUE +10.0%
increase from last year.
£283.6 MILLION EBITDA growth of 17.2%
in 2015.
£5.6 BILLION contribution to the UK
economy from MAG airports.
Voting: 50%
Economic: 35.5%Voting: 50%
Economic: 64.5%
MAG is a leading UK based airport company, which owns and operates Manchester, London Stansted, East Midlands and Bournemouth airports.
Source: FY15 Report & Accounts

OUR AIRPORTS…
MAG airports serve over 48.5 million people per annum from complementary catchment areas covering over 75% of the UK population.
45
c. 23m passengers per annum.
UK’s 3rd largest airport.
70+ airlines & 200+destinations.
2 runw ays w ith potential 62% capacity.
21.5m people w ithin a 2 hour drive.
Catchment area w ithin 2 hours’ drive of:
M AN STN
c. 0.7m passengers per annum.
Significant investment in new terminal increasing
passenger capacity to 3m p.a.
Wealthy catchment area.
Large land holding – on-site business park.
c. 4.5m passengers per annum.
UK’s largest freight airport after Heathrow – 310,000 tonnes p.a.
Located next to key road interchanges – four hours from
virtually all UK commerce.
c. 23m passengers per annum.
UK’s 4th largest airport.
150+ destinations.
1 runw ay w ith 50% spare capacity.
25m people w ithin 2 hour drive.
Acquired February 2015.
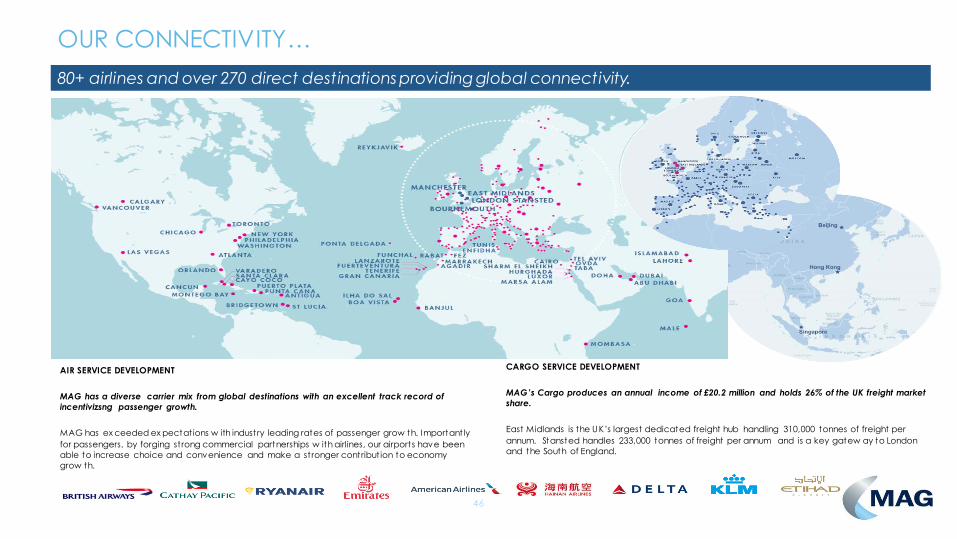
OUR CONNECTIVITY…
46
AIR SERVICE DEVELOPMENT
MAG has a diverse carrier mix from global destinations with an excellent track record of
incentivizsng passenger growth.
MAG has ex ceeded ex pectat ions w ith industry leading rates of passenger grow th. Important ly
for passengers, by forging st rong commercial partnerships w ith airlines, our airports have been
able to increase choice and convenience and make a st ronger contribut ion to economy
grow th.
CARGO SERVICE DEVELOPMENT
MAG’s Cargo produces an annual income of £20.2 million and holds 26% of the UK freight market
share.
East Midlands is the UK’s largest dedicated freight hub handling 310,000 tonnes of freight per
annum. Stansted handles 233,000 tonnes of freight per annum and is a key gatew ay to London
and the South of England.
80+ airlines and over 270 direct destinations providing global connectivity.

OUR DEVELOPMENTS…
Manchester Transformation Programme and London Stansted Transformation Programme are developments that all aim to drive improved customer service.
47
MANCHESTER TRANSFORMATION PROGRAMME
With investment of £1 billion, Manchester will become one of the most modern and customer focused airports in Europe demonstrating the importance of Manchester as a global gateway.
LONDON STANSTED TRANSFORMATION PROGRAMME
The £80 million terminal transformation project at London Stansted will transform the passenger experience and boost commercial yields.
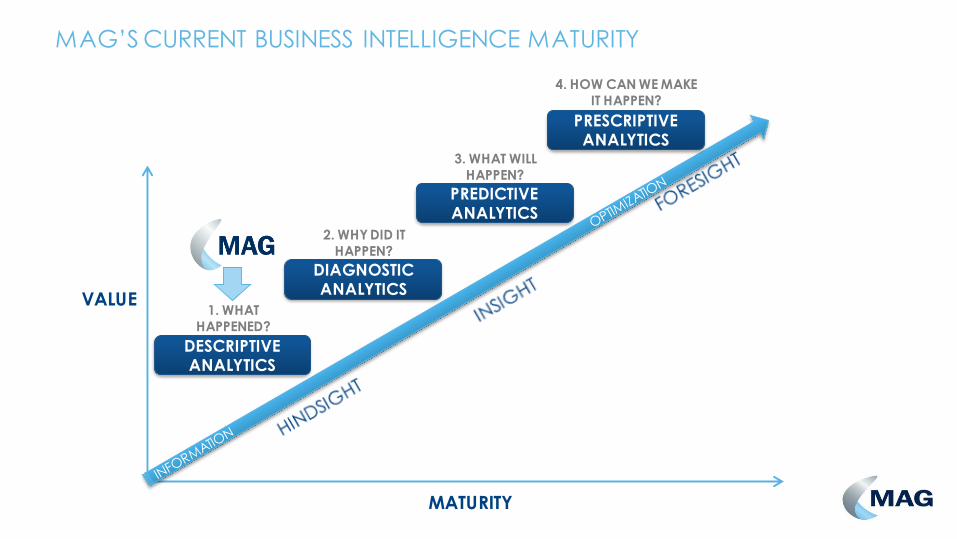
MATURITY
DESCRIPTIVE ANALYTICS
DIAGNOSTIC ANALYTICS
PREDICTIVE ANALYTICS
PRESCRIPTIVE ANALYTICS
VALUE1. WHAT
HAPPENED?
2. WHY DID IT
HAPPEN?
3. WHAT WILL
HAPPEN?
4. HOW CAN WE MAKE
IT HAPPEN?
MAG’S CURRENT BUSINESS INTELLIGENCE MATURITY
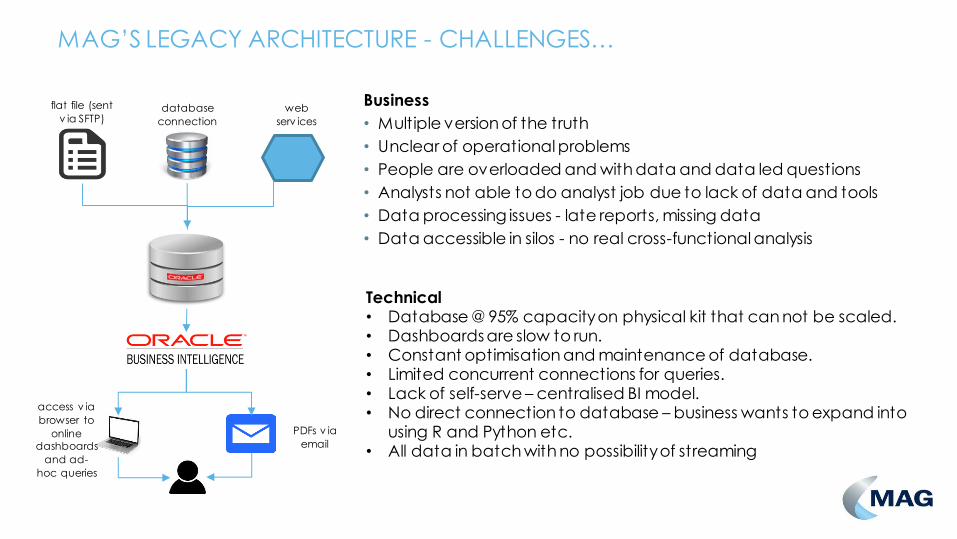
flat file (sent
v ia SFTP)database
connection
web
serv ices
access v ia
browser to
online dashboards
and ad-
hoc queries
PDFs v ia
Technical• Database @ 95% capacity on physical kit that can not be scaled.• Dashboards are slow to run.• Constant optimisation and maintenance of database.• Limited concurrent connections for queries.• Lack of self-serve – centralised BI model.• No direct connection to database – business wants to expand into
using R and Python etc.• All data in batch with no possibility of streaming
Business
• Multiple version of the truth
• Unclear of operational problems
• People are overloaded and with data and data led questions
• Analysts not able to do analyst job due to lack of data and tools
• Data processing issues - late reports, missing data
• Data accessible in silos - no real cross-functional analysis
MAG’S LEGACY ARCHITECTURE - CHALLENGES…
50
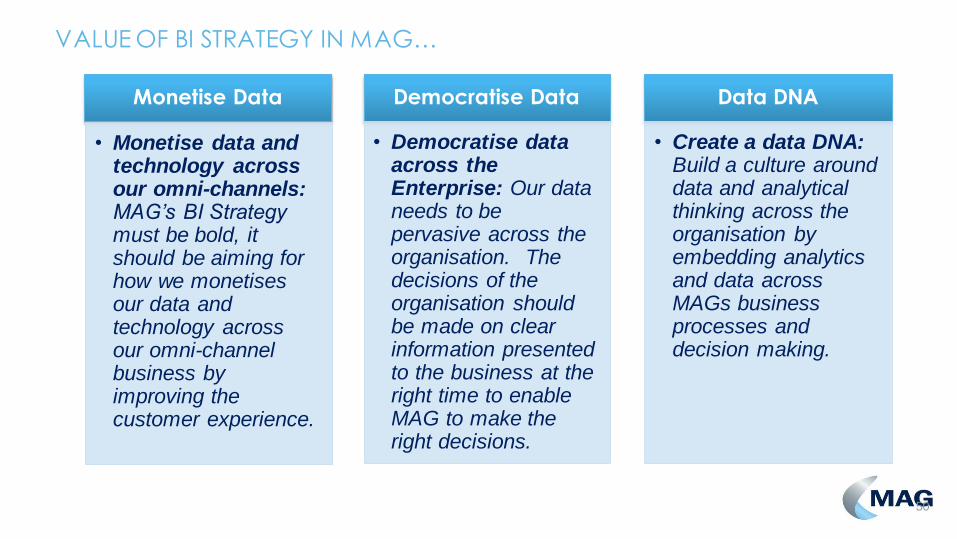
VALUE OF BI STRATEGY IN MAG…
Monetise Data
• Monetise data and technology across our omni-channels: MAG’s BI Strategy must be bold, it should be aiming for how we monetises our data and technology across our omni-channel business by improving the customer experience.
Democratise Data
• Democratise data across the Enterprise: Our data needs to be pervasive across the organisation. The decisions of the organisation should be made on clear information presented to the business at the right time to enable MAG to make the right decisions.
Data DNA
• Create a data DNA: Build a culture around data and analytical thinking across the organisation by embedding analytics and data across MAGs business processes and decision making.

Build Data and BI Foundation solution• To create an extensible and flexible data solution for MAG comprising of:
• Extended Data Warehouse.• Scalable and elastic compute.• Deal with seasonality spikes of passenger travel.
• Real-time streaming.• Enable MAG to become a real-time business across their customer journey.
• Cloud environment:• Secured.• Resilient.• Repeatable build.
• Enable MAG to quickly experiment at low cost and minimal risk.• MAG wants to trial new technologies, especially open-source.
• Create an architecture than can evolve over time to meets MAG’s new challenges.• Benefits delivered early and continuously.• No need for MAG to invest in a large, front-loaded EDW programme.
PHASE 1 - IMPLEMENT SELF-SERVE RETAIL BI SOLUTION
- 50+ PARTNERS GENERATING OVER £130M REVENUE…
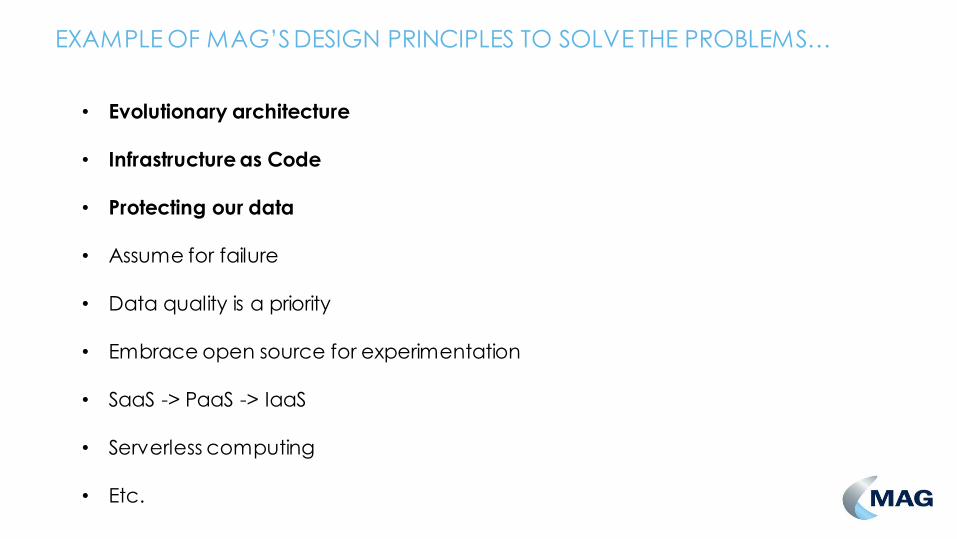
• Evolutionary architecture
• Infrastructure as Code
• Protecting our data
• Assume for failure
• Data quality is a priority
• Embrace open source for experimentation
• SaaS -> PaaS -> IaaS
• Serverless computing
• Etc.
EXAMPLE OF MAG’S DESIGN PRINCIPLES TO SOLVE THE PROBLEMS…

MAG – OUR 6 MONTH JOURNEY…
From To
Single instance database. → Scale-able Data Warehouse.
Daily sales rung in at store level.
→
Over 90% of all sales automatically ingested
at product level.
Car parking - flat files ingested in batch.
→
Ingest and interrogate streaming data
directly:
• Car park data is being added v ia Kinesis
Access to database limited to reporting
tool. →
Authorised users can use v isualisation and
data science tools (e.g. R and Python) of
their choice for self-serve analytics
No database writeback for end-users.
→
Sandboxes in Redshift for end user
experimentation.

MAG – NEXT 6-12 MONTHS…
• Moving to near-time streaming into Redshift for:
• Terminal Operations
• Security Services
• Car Park Management
• Streaming semi-structured data into Redshift
• Trialling IoT data streaming
• Passenger analysis
• Trial AWS Glue and AWS Redshift Spectrum
• Automated profile and catalogue of data across the enterprise
• Continuous integration of data into our data warehouse

Who Are Crimson MacawDriving customer success by unlocking the value of data.

Competency focused consultancy
Architectureand
Data Strategy
Data Engineering EnterpriseData
Solutions
DataScience
DevOps
1. Plan 3. Action2. Build
www.crimsonmacaw.com
Our partners ...
3 AWS Big Data Speciality
3 AWS Certified Solutions Architect Associate
2 AWS Certified Developer Associate
2 AWS Certified SysOps Administrator Associate

Key architectural components used
Visualisation in Tableau
Storage in S3
Streaming in Kinesis& Kinesis Firehose
Data Transformation in ODI
Data Warehouse in Amazon Redshift

Cloud Architecture + Data Architecture = Solution
• A horizontal analytical ‘slice’ across the estate.• Understand conformed dimensions.• Vertical slice of a business domain.• Reduced refactoring due to the prior horizontal
analysis.
How do you match the pace of infrastructure build in the cloud with understanding the data & BI requirements?
Deliver value quickly vs conformed dimensions?
Understand how the business will consume and use the data?
• Produce artefacts that are:• Shared by stakeholders and the delivery
team.• Understandable by all parties.• Highly visual, allow complex information to
be absorbed - sun modelling.

Sun modelling vs Enterprise Bus Matrix
Country
Date
Calendar Month
Calendar Week
Financial Year
Financial Quarter
Financial Period
Time
Employee ID
Name
Customer
Employee
Product
Customer ID
Salutation
Gender
Name
Postcode
CountyTown
SKU
Item Description
Product Type
Sales £Net Despatches £
Sales Units
Sun Model
Enterprise Bus Matrix
measure
dimension
hierarchy
Star Schema
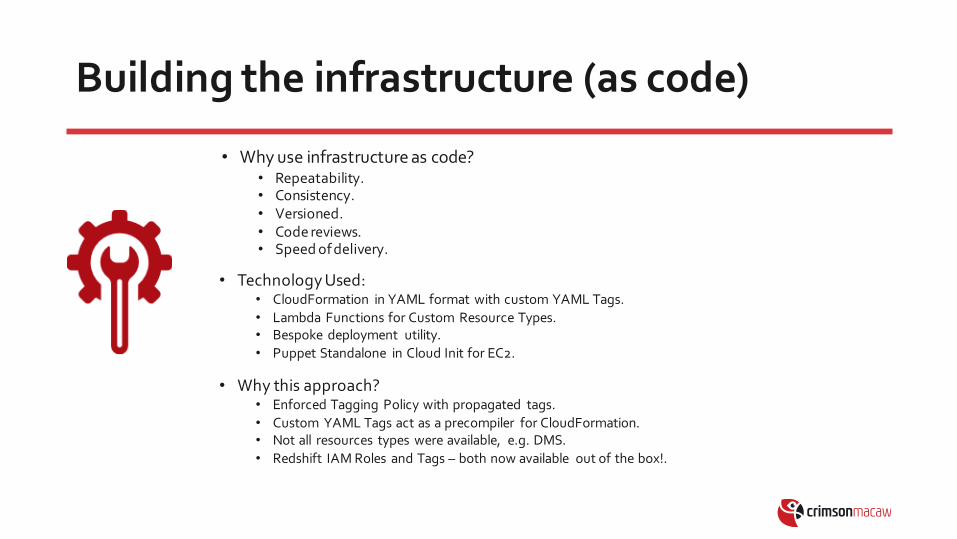
Building the infrastructure (as code)
• Why use infrastructure as code?• Repeatability.• Consistency.• Versioned.• Code reviews.• Speed of delivery.
• Technology Used:• CloudFormation in YAML format with custom YAML Tags.
• Lambda Functions for Custom Resource Types.• Bespoke deployment utility.
• Puppet Standalone in Cloud Init for EC2.
• Why this approach?• Enforced Tagging Policy with propagated tags.
• Custom YAML Tags act as a precompiler for CloudFormation.• Not all resources types were available, e.g. DMS.
• Redshift IAM Roles and Tags – both now available out of the box!.
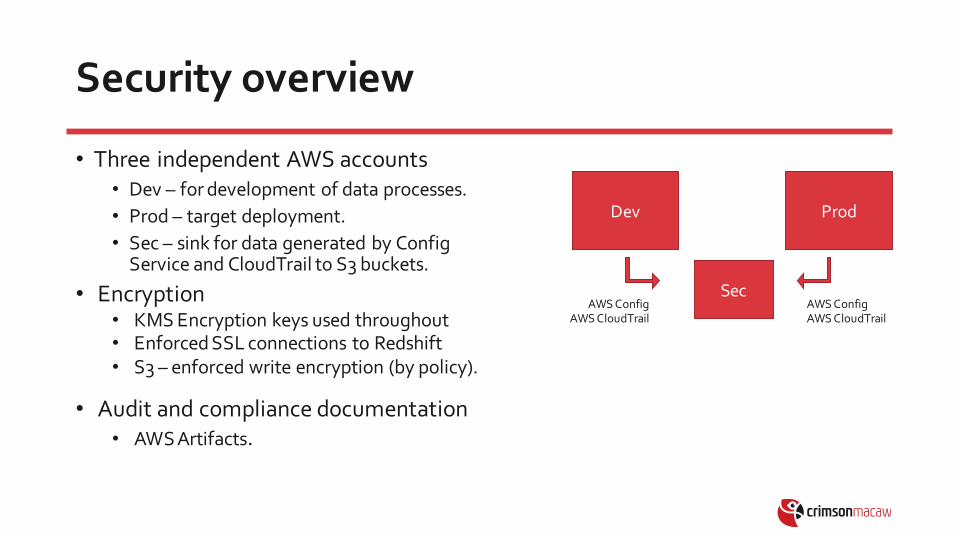
Security overview
• Three independent AWS accounts• Dev – for development of data processes.
• Prod – target deployment.
• Sec – sink for data generated by ConfigService and CloudTrail to S3 buckets.
Dev Prod
SecAWS Config
AWS CloudTrailAWS ConfigAWS CloudTrail
• Encryption• KMS Encryption keys used throughout• Enforced SSL connections to Redshift• S3 – enforced write encryption (by policy).
• Audit and compliance documentation• AWS Artifacts.

Redshift topology
• Storage Optimised (red)• Optimised for storing larger volumes of data (source).
• Ingestion point for newly arriving data.
• Transformation layer (large number of work tables).
• VPC - private subnet.
• Compute Optimised layer (blue)• Transformed data.• Near real-time operational data.• Present dimensional layer.• VPC – public subnet (whitelisted access).
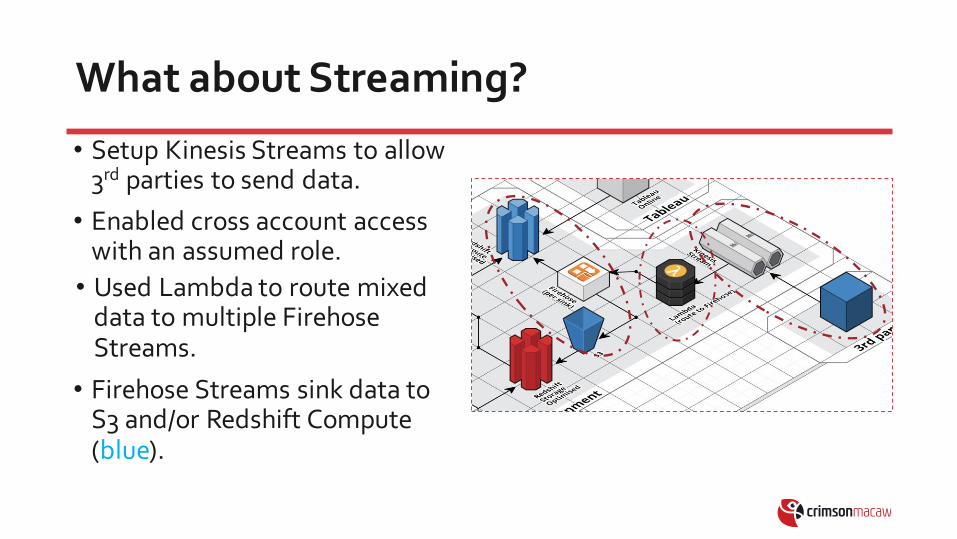
• Setup Kinesis Streams to allow 3rd parties to send data.
• Enabled cross account access with an assumed role.
What about Streaming?
• Used Lambda to route mixed data to multiple Firehose Streams.
• Firehose Streams sink data to S3 and/or Redshift Compute (blue).

ODI and Redshift
• Problem: ODI initiated Redshift tasks not completing.
• Problem: No native knowledge modules in ODI for Redshift.
• Solution: Customised existing generic SQL knowledge modules for Redshift.
• Evaluating 3rd party solution Knowledge Module.
Solution: Increase Array Fetch Size in ODI

Tableau and Redshift
• How does Tableau Online connect to Redshift?
• JDBC via SSL.
• Whitelisted to Redshift.
• Tableau available in multiple regions (US, Ireland).
• Enable Redshift constraints:
• Foreign Key and Primary Key and Unique constraints – ensure they are created in Redshift (even though they are not enforced).
• Enable Tableau “Assume Referential Integrity”
• in Tableau workbooks (if you have it!).
• Queries in Tableau:
• Executed via Redshift cursor – minimise IO.
• Current activity: stv_active_cursors.
• For recent activity (two - five days): stl_query and stl_utility_text.
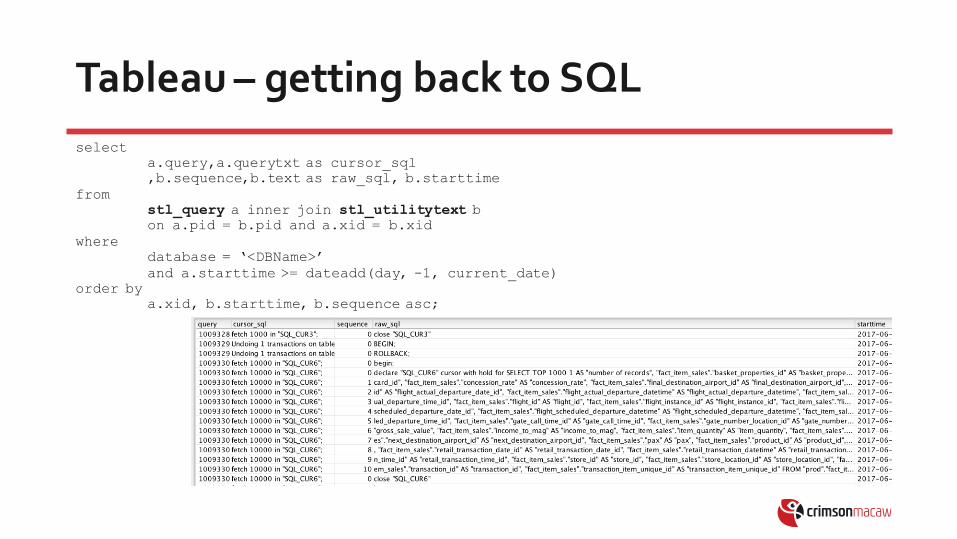
Tableau – getting back to SQL
select
a.query,a.querytxt as cursor_sql
,b.sequence,b.text as raw_sql, b.starttime
from
stl_query a inner join stl_utilitytext b
on a.pid = b.pid and a.xid = b.xid
where
database = ‘<DBName>’
and a.starttime >= dateadd(day, -1, current_date)
order by
a.xid, b.starttime, b.sequence asc;

Redshift
• Performance so far has been very good.
• A lot to do with the design of Redshift.• Optimisations so far have been limited to:
• Fields:• lengths• datatypes
• compression datatypes.
• Distribution keys.• Sort keys.• Skew analysis.• Vacuum and ANALYZE.
• But we intend to do some more work on below:• Work queue management.• User load analysis.• Attribute pushdown.
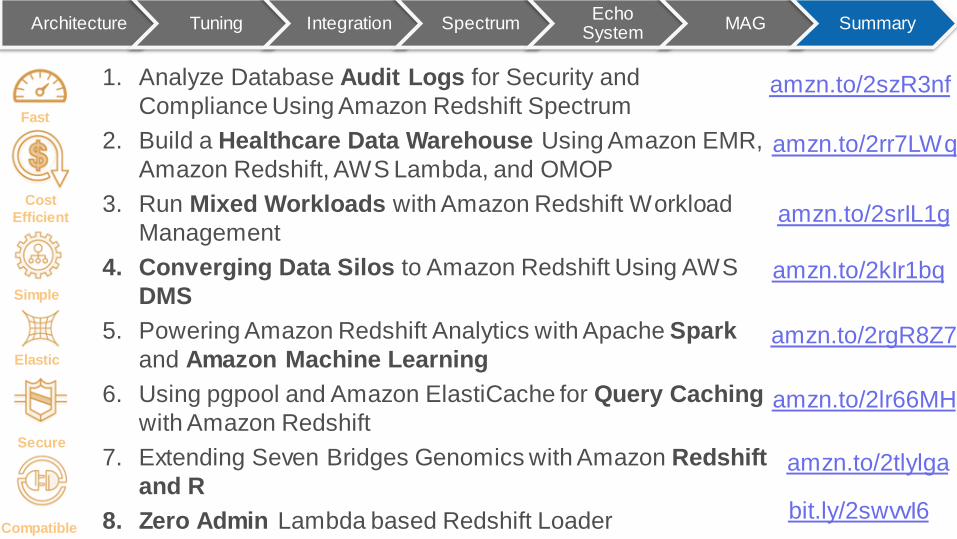
1. Analyze Database Audit Logs for Security and
Compliance Using Amazon Redshift Spectrum
2. Build a Healthcare Data Warehouse Using Amazon EMR,
Amazon Redshift, AWS Lambda, and OMOP
3. Run Mixed Workloads with Amazon Redshift Workload
Management
4. Converging Data Silos to Amazon Redshift Using AWS
DMS
5. Powering Amazon Redshift Analytics with Apache Spark
and Amazon Machine Learning
6. Using pgpool and Amazon ElastiCache for Query Caching
with Amazon Redshift
7. Extending Seven Bridges Genomics with Amazon Redshift
and R
8. Zero Admin Lambda based Redshift Loader
Architecture Tuning Integration SpectrumEcho
SystemMAG Summary
Fast
Compatible
Secure
Elastic
Simple
Cost
Efficient
amzn.to/2tlylga
amzn.to/2srIL1g
amzn.to/2rgR8Z7
amzn.to/2lr66MH
amzn.to/2kIr1bq
amzn.to/2rr7LWq
amzn.to/2szR3nf
bit.ly/2swvvI6
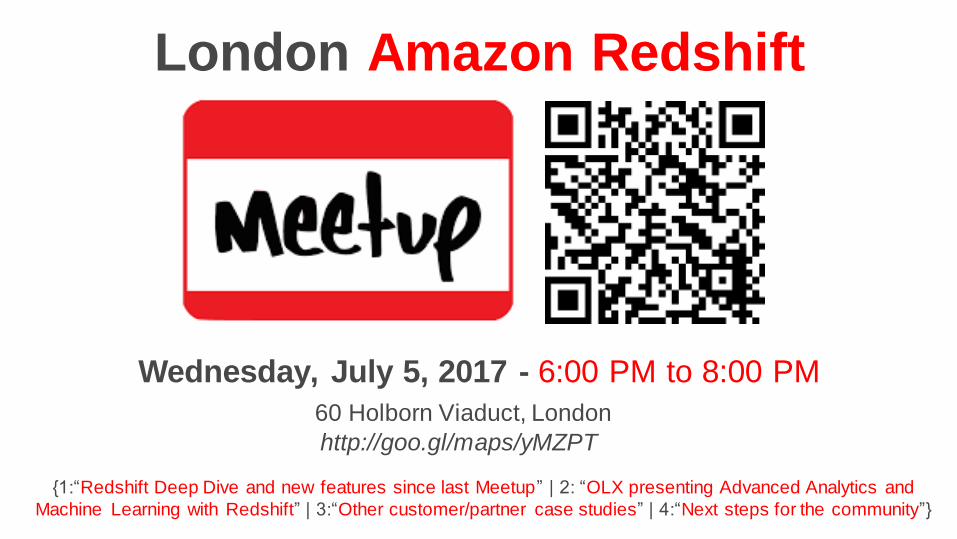
http://goo.gl/maps/yMZPT
60 Holborn Viaduct, London
Wednesday, July 5, 2017 - 6:00 PM to 8:00 PM
London Amazon Redshift
{1:“Redshift Deep Dive and new features since last Meetup” | 2: “OLX presenting Advanced Analytics and
Machine Learning with Redshift” | 3:“Other customer/partner case studies” | 4:“Next steps for the community”}

Thank You
Data is magic!