Embed Size (px)
Citation preview

DEEP ARTESIAN AQUIFERS OF SANIBEL AND CAPTIVA ISLANDS,
LEE COUNTY, FLORIDA
By D. H. Boggess and T. H. O'Donnell
U.S. GEOLOGICAL SURVEY
Open-File Report 82-253
Prepared in cooperation with the
CITY OF SANIBEL and theBOARD OF COMMISSIONERS OF LEE COUNTY, FLORIDA
Tallahassee, Florida
1982

UNITED STATES DEPARTMENT OF THE INTERIOR
JAMES G. WATT, Secretary
GEOLOGICAL SURVEY
Dallas L. Peck, Director
For additional information write to:
U.S. Geological Survey Suite F-240 325 John Knox Rd. Tallahassee, FL 32303
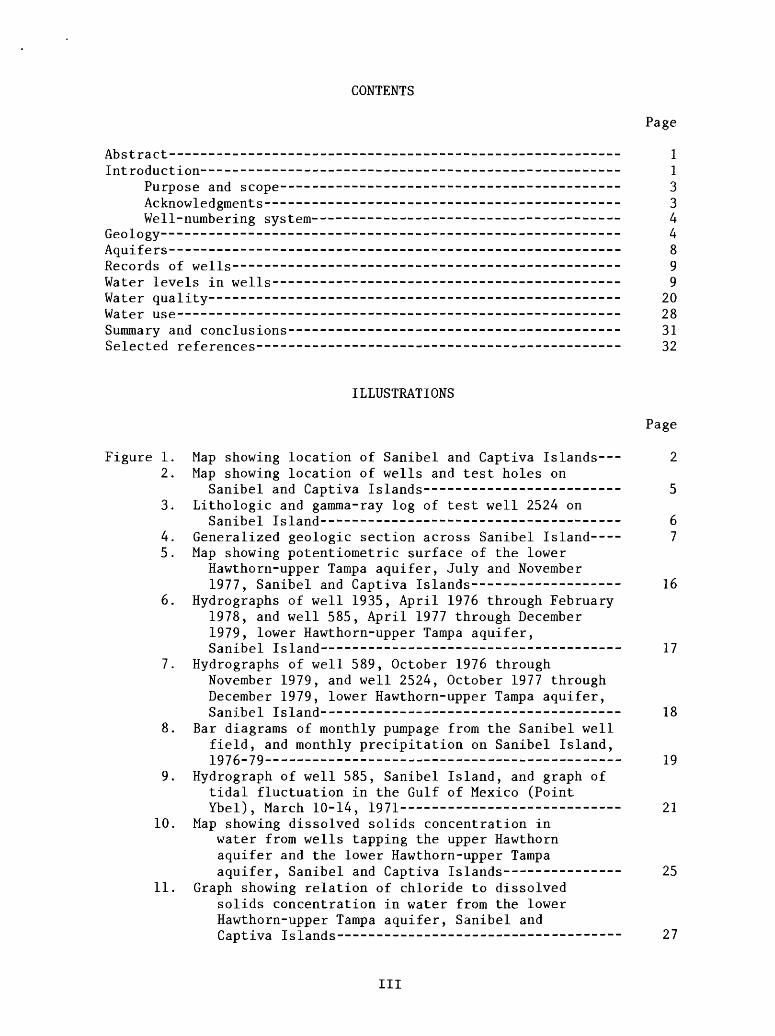
CONTENTS
Page
Abstract--------------------------------------------------------- 1Intreduction----------------------------------------------------- l
Purpose and scope------------------------------------------- 3Acknowledgments--------------------------------------------- 3Well-numbering system--------------------------------------- 4
Geology---------------------------------------------------------- 4Aquifers-------------------------------------------- ----------- gRecords of wells------------------------------------------------- 9Water levels in wells-------------------------------------------- 9Water quality---------------------------------------------------- 20Water use----------------------- ------ ...______..._________ 28Summary and conclusions------------------------------------------ 31Selected references---------------------------------------------- 32
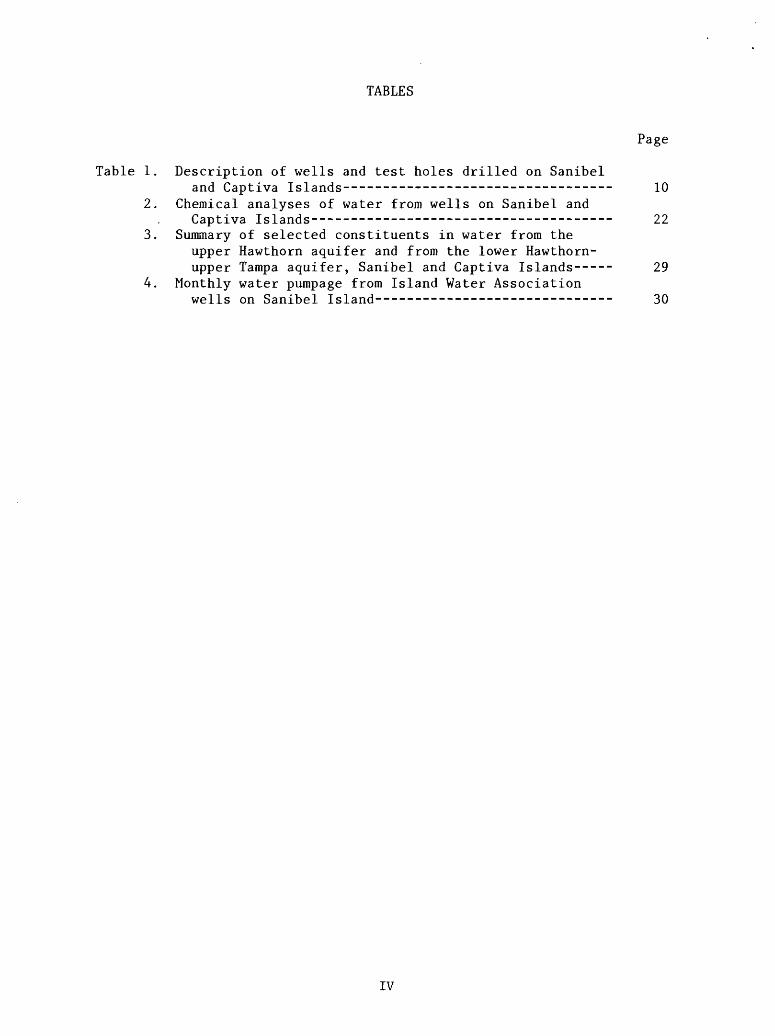
ILLUSTRATIONS
Page
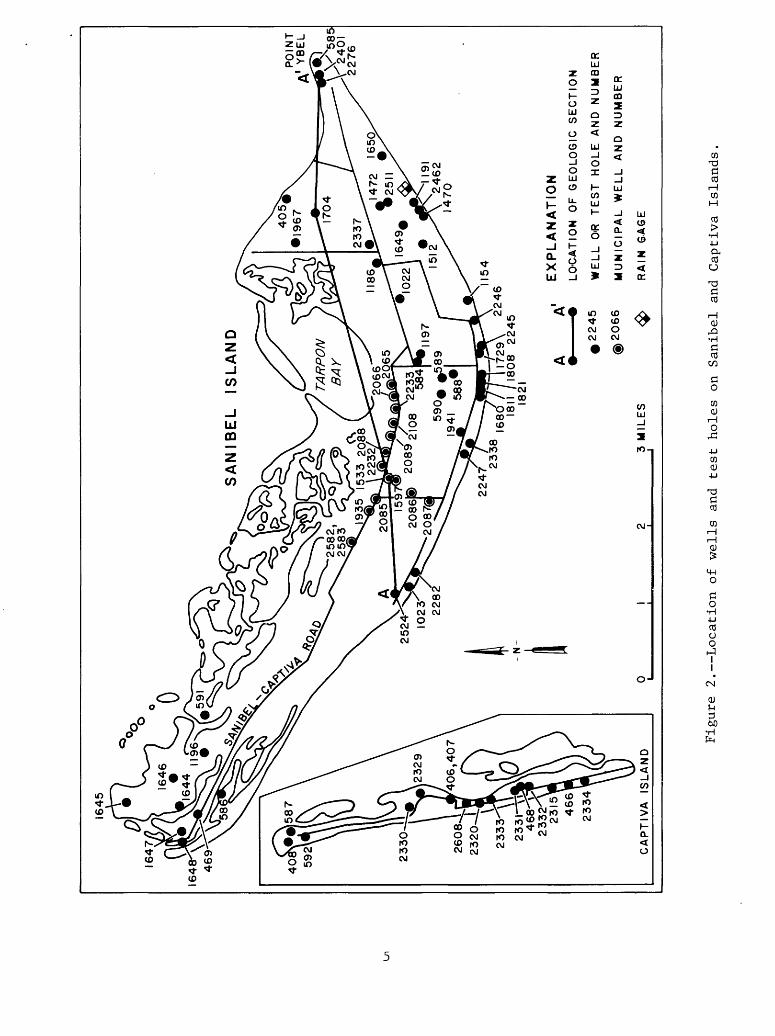
Figure 1. Map showing location of Sanibel and Captiva Islands--- 22. Map showing location of wells and test holes on
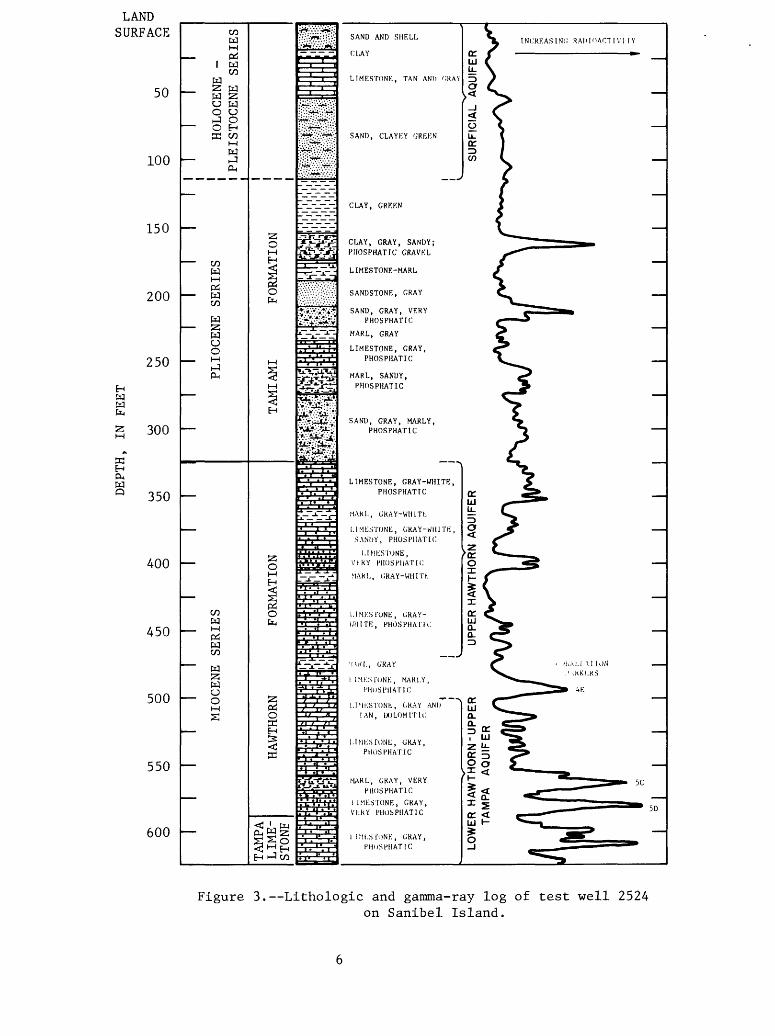
Sanibel and Captiva Islands------------------------- 53. Lithologic and gamma-ray log of test well 2524 on
Sanibel island-------------------------------------- 64. Generalized geologic section across Sanibel Island---- 75. Map showing potentiometric surface of the lower
Hawthorn-upper Tampa aquifer, July and November1977. Sanibel and Captiva Islands--- -------- --- 16
6. Hydrographs of well 1935, April 1976 through February1978. and well 585, April 1977 through December1979. lower Hawthorn-upper Tampa aquifer,Sanibel Island-------------------------------------- 17
7. Hydrographs of well 589, October 1976 throughNovember 1979, and well 2524, October 1977 through December 1979, lower Hawthorn-upper Tampa aquifer, Sanibel Island -- 18
8. Bar diagrams of monthly pumpage from the Sanibel well field, and monthly precipitation on Sanibel Island, 1976-79 19
9. Hydrograph of well 585, Sanibel Island, and graph of tidal fluctuation in the Gulf of Mexico (Point Ybel), March 10-14, 1971 21
10. Map showing dissolved solids concentration in water from wells tapping the upper Hawthorn aquifer and the lower Hawthorn-upper Tampa aquifer, Sanibel and Captiva Islands--------------- 25
11. Graph showing relation of chloride to dissolved solids concentration in water from the lower Hawthorn-upper Tampa aquifer, Sanibel and Captiva islands------------------------------------ 27
III
TABLES
Page
Table 1. Description of wells and test holes drilled on Sanibeland Captiva Islands---------------------------------- 10
2. Chemical analyses of water from wells on Sanibel andCaptiva Islands-------------------------------------- 22
3. Summary of selected constituents in water from theupper Hawthorn aquifer and from the lower Hawthorn- upper Tampa aquifer, Sanibel and Captiva Islands----- 29
4. Monthly water pumpage from Island Water Associationwells on Sanibel Island------------------------------ 30
IV

DEEP ARTESIAN AQUIFERS OF SANIBEL AND CAPTIVA ISLANDS,
LEE COUNTY, FLORIDA
By D. H. Boggess and T. H. O'Donnell
ABSTRACT
Sanibel and Captiva Islands, two of the barrier islands off the lower west coast of Florida, have a resident population of about 6,000 and an additional 6,000 visitors during the peak of the tourist season. Rapid growth and extensive development in recent years have imposed progressively greater stress on the water resources of the islands.
Sanibel and Captiva Islands are underlain by a series of geologic formations containing some zones of relatively freshwater and other zones of more mineralized, or even very saline water. Two aquifers are the principal sources of water supply on the islands. The upper aquifer is in the upper part of the Hawthorn Formation. The lower aquifer is in the lower part of the Hawthorn Formation and the underlying upper part of the Tampa Limestone. Both aquifers are under sufficient artesian pressure to permit wells to flow at land surface. The potentiometric surface of the lower Hawthorn-upper Tampa aquifer has been lowered in the central part of Sanibel Island where the Island Water Association operates about 10 wells that tap the lower aquifer.
In 1977, the average pumpage from these 10 wells was 1.4 million gallons per day. The water is processed through a desalination plant before distribution. In 1977, the total volume of water withdrawn from both the lower and upper aquifers for all purposes was 690 million gallons, an average of about 1.9 million gallons per day.
Water from the upper Hawthorn aquifer during the period 1975-77 contained dissolved solids concentrations ranging from 721 to 2,390 milli grams per liter. Water from the lower Hawthorn-upper Tampa aquifer during the same period contained concentrations ranging from 1,700 to 4,130 milli grams per liter. Water from both aquifers is hard and contains relatively high concentrations of sodium, sulfate, and chloride.
INTRODUCTION
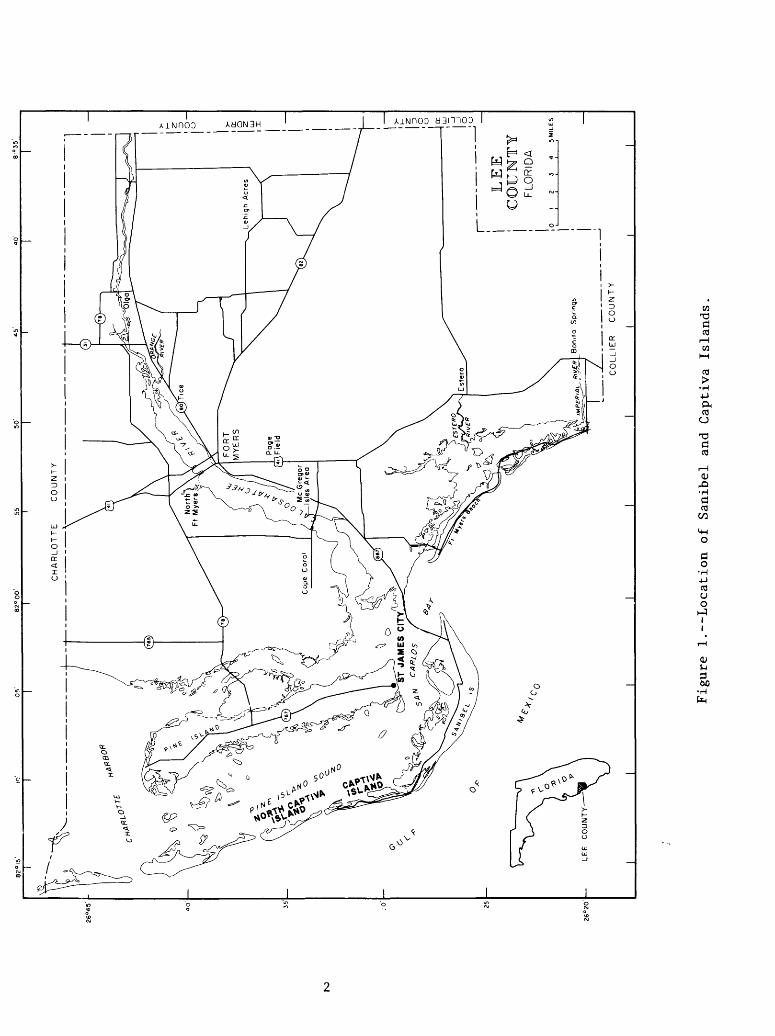
Sanibel and Captiva Islands form part of the barrier island chain off the lower west coast of Lee County, Florida (fig. 1). Both islands are resort areas and have a resident population of 6,000 and an additional 6,000 people during the peak of the tourist season (Sanibel Planning Council, 1977, written commun.). Rapid growth and extensive development in decent years have imposed progressively greater stress on the land and water resources of the islands.
H- 00
Co PH-cr n>
rt H-
Co Pcx

Historically, fresh ground water on Sanibel and Captiva Islands has been obtained from shallow wells, generally less than 15 feet deep. These wells provide only small supplies and frequently yield brackish or saline water during the dry season.
A pipeline was constructed in 1966 which transports water purchased from the Greater Pine Island Water Association well field and treatment plant on the mainland to provide a dependable water supply to the islands. This pipeline extends beneath San Carlos Bay from St. James City to the northern end of Sanibel Island. The water-supply system on Sanibel and Captiva Islands at that time (1966) consisted of pumping stations and water distribution lines. Beginning in 1973, a number of deep (about 300 to 900 feet) artesian wells were drilled for public supply. The saline water from these wells (Boggess, 1974a, fig. 4) is processed by electrodialysis for domestic use. The pipeline and the desalination plant provided sufficient water for most needs, but recent increased demand has resulted in increased importation of water from the mainland.
Purpose and Scope
During the time that the desalination plant has been in operation, questions have been raised by water-management agencies concerning the ability of the deep artesian aquifers underlying Sanibel and Captiva Islands to continue supplying the water needed to meet the increasing demand with a salinity low enough for the desalination plant to operate effectively. The purpose of this investigation was to evaluate the water- supply potential of the deeper aquifers.
During the 24-month investigation, October 1975-77, an important objective was to locate and inventory all existing wells that tapped the deep artesian aquifers. Except for a few, all known wells were found. Water levels and water samples were obtained at the wells. No test wells were drilled as part of this investigation, although one observation well was drilled on Sanibel Island as part of a countywide monitoring network. The data included in this report will provide a better understanding of the water quality of the deep aquifers underlying these offshore islands for the effective development of the water resources.
Acknowledgments
The authors gratefully acknowledge the cooperation and assistance of the residents of Sanibel and Captiva Islands in providing data included in this report. All well owners, including the Island Water Association of Sanibel, freely permitted access to their wells so that water-level data and water samples could be obtained. The cooperation and support of officials of the city of Sanibel and the Board of County Commissioners are also gratefully acknowledged.

Well-Numbering System
All wells listed in this report or for which data are cited are numbered as part of a countywide system. The wells were numbered in sequence as each well or test hole was inventoried. The locations of wells and test holes on which information was obtained during the investigation are shown in figure 2.
GEOLOGY
The surficial deposits on Sanibel and Captiva Islands are Holocene and Pleistocene in age and include sand, shells, clay, and limestone generally less than 120 feet thick. Below these deposits is the Tamiami Formation of Pliocene age which consists chiefly of gray and green clay and sandy clay. Thin beds of sandstone, sand, or limestone occur locally in the Tamiami, and phosphorite is a common accessory mineral. Thickness of the Tamiami ranges from about 200 feet beneath central Sanibel Island to less than 100 feet beneath other parts of the islands.
The Hawthorn Formation and Tampa Limestone of Miocene age successively underlie the Tamiami Formation and range in thickness from about 300 feet beneath central Sanibel Island to about 400 feet beneath other parts of the islands. Both formations consist predominantly of gray and gray-white phosphatic limestone with interbedded marl or calcareous clay. Phosphorite is abundant with major concentrations in the lower part of the Hawthorn Formation.
Below the Tampa Limestone, the Suwannee Limestone is usually penetra ted 600 to 700 feet below land surface. This formation consists predomi nantly of tan limestone. The Suwannee Limstone may extend to 1,100 feet or more beneath Sanibel Island.
The sequence of geologic units and water-bearing units are shown in figure 3 with lithologic and gamma-ray logs of well 2524 on the southwest shore of Sanibel. The gamma-ray activity of the phosphorite is high because it contains a minute quantity of uranium (Altschuler and others, 1958). The gamma-ray peaks in the lower part of the Hawthorn have been assigned numbers (4E, 5C, and 5D) and are used as markers for correlation purposes. They have been identified in nearly all the test holes and wells on Sanibel and Captiva Islands for which gamma-ray logs have been obtained. On the basis of gamma-ray correlation, the lithology is fairly consistent (fig. 4). The geologic section (fig. 4) is constructed from data of four test wells along an east-trending line across Sanibel Island (fig. 2).
Comparable beds penetrated at greater depth in well 1704 than in well 2401 may indicate that some vertical displacement has occurred (fig. 4). For example, the gray-white, phosphatic limestone (which marks the top of the Hawthorn Formation) occurs at a depth of about 200 feet in well 2401, and at a depth of 350 feet in well 1704. These wells are 1.7 miles apart, so that the intevening slope of the top of the phosphatic limestone is about 90 ft/mi. Although the top of the limestone is an erosional surface, the beds lying at greater depths have similar slopes. Displacement of beds by folding is possible in this general area. Missimer and Gardner (1976)
16
47
164
POINT
YBEL
SA
NIB
EL
IS
LA
ND
2582,
' ~~
25
83
.
935
1533
2088
_
,2232
20
85
TA
RP
ON
B
AY
1472
I6
5Q
2
511
159
2086
2087
I 191
2
46
2
1470
590^ 0
58
9
1941
588^'
1680
/
/ |I
729\
2246
1811
/I
808
22
45
18
21
CA
PT
IVA
IS
LA
ND
EXPLANATION
LO
CA
TIO
N
OF
G
EO
LO
GIC
S
EC
TIO
N
02245
WE
LL
O'R
T
ES
T
HO
LE
A
ND
N
UM
BE
R
<§>
2066
MU
NIC
IPA
L
WE
LL
A
ND
N
UM
BE
R
<£>
RA
IN
GA
GE
Figure 2. Location of wells an
d test holes on Sanibel an
d Captiva Islands.
DE
PTH
, IN
FE
ET
O oo
oo
oLO Ul
o
OJ o
oo
N)
O oo
oL
n
O
a r
1
> o
o w
H-
OQ ro OJ ir
1H
- rt O
OQ
I I
I
MIOCENE SERIES
I I
I I
I
PLIOCENE SERIES
I I
I I
HOLOCENE -
PLEISTOCENE SERIES
TAMPA
LIME
STONE
HAWTHORN
FORMATION
TAMIAMI
FORMATION
CD
OQa"
ro H
1-1
CO
(13 O
OQ O
H
)
rt n> CO
rt S! n> N)
Ui
N)
-a c
3: z
o r
a
> 50
H >
LOW
ER
H
AW
TH
OR
N"U
PP
ER
T
AM
PA
A
QU
IFE
RU
PP
ER
HA
WTH
OR
N A
QU
IFE
RS
UR
FIC
IAL
A
QU
IFE
R
I I
I I
I

o o oI*
«2FEET
50 -i
SEA LEVEL
CVJinCVJ
c. Q.ro roH2 coo
O
100-
200-
300-
400-
500-
600-
700
800
Tarpon Bay
A1o FEETCVJ
50
GAMMA RAYCORRELATIONMARKERS
SAND AND SHELL, FINE TO MEDIUM GRAINED,
GRAY AND TAN
FINE GRAINED, CLAYEY, GREEN
CLAY, GREEN
SAND, SANDSTONE,
=S^-LIMESTONE
AND LIMESTONE -
CLAY, GRAY
SAND, FINE GRAINED, GRAY
MARLLIMESTONE, PHOSPHATIC, GRAY-WHITE
LIMESTONE AND INTERBEDDED MARL,
_\__5C-..__ GRAY, GRAY-WHITE, AND TAN ~~~~~"~"~ 5D " - rcr ~^
LIMESTONE, TAN
TAN
SEA LEVEL
-fOO
200
-300
-400
-500
-600
-700
Vertical Exaggeration X 40800
0 3 MILES
Figure 4. Generalized geologic section across Sanibel Island.

have shown by seismic reflection profiles that folding has occurred in the Hawthorn Formation underlying the Caloosahatchee River. The inferred vertical displacement of beds beneath Sanibel Island may be related to folding due to differential subsidence.
Seismic-reflection profiles were made during this study by the U.S. Geological Survey in several areas around Sanibel Island including Pine Island Sound and the Gulf of Mexico. These profiles indicate folding with vertical displacement of about 75 feet from trough to crest over a lateral distance of about 0.5 mile in Pine Island Sound approximately 2 miles east of the south end of Captiva Island. The seismic-reflection profiles could be made in navigation channels only, and most of the data were obtained offshore. Consequently, they may not be representative of formations underlying the islands.
AQUIFERS
The uppermost 15 to 30 feet of sand, shells, silt, and clay underlying Sanibel and Captiva Islands comprise the water-table zone of the surficial aquifer. This zone yields small amounts of water to shallow wells. The permeability of these materials decreases with depth because of a gradual decrease of sand particle size and an increase of silt and clay. Below the water-table zone is a gray and tan sandy limestone that comprises the shallow artesian zone and that extends from a depth of about 30 feet to more than 120 feet beneath Sanibel Island.
Thin beds of sand, sandstone, and limestone within the Tamiami Formation yield small amounts of water to wells but do not constitute a significant source of water in the islands.
Underlying the Tamiami Formation are two deep artesian aquifers which are the principal sources of water supply on the islands. A zone of permeable materials in the upper part of the Hawthorn Formation constitutes the upper artesian aquifer, locally referred to as the upper Hawthorn aquifer. The upper Hawthorn aquifer is a source of water both on Captiva and North Captiva Islands as well as the northwestern part of Sanibel Island, although the upper Hawthorn aquifer contains saline water on much of Sanibel Island. Wells drilled into the upper Hawthorn aquifer flow as much as 15 gal/min.
Clay and marly limestone separate the upper Hawthorn aquifer from the underlying permeable limestone in the lower part of the Hawthorn Formation and the upper part of the Tampa Limestone, locally referred to as the lower Hawthorn aquifer. Wells that tap the lower Hawthorn-upper Tampa aquifer flow as much as 160 gal/min.
Permeable zones in the lower part of the Tampa Limestone and in the upper part of the Suwannee Limestone also constitute a source of water (Sproul and others, 1972). Few wells tap this source, however, and its hydrologic and chemical quality characteristics are not well known.

RECORDS OF WELLS
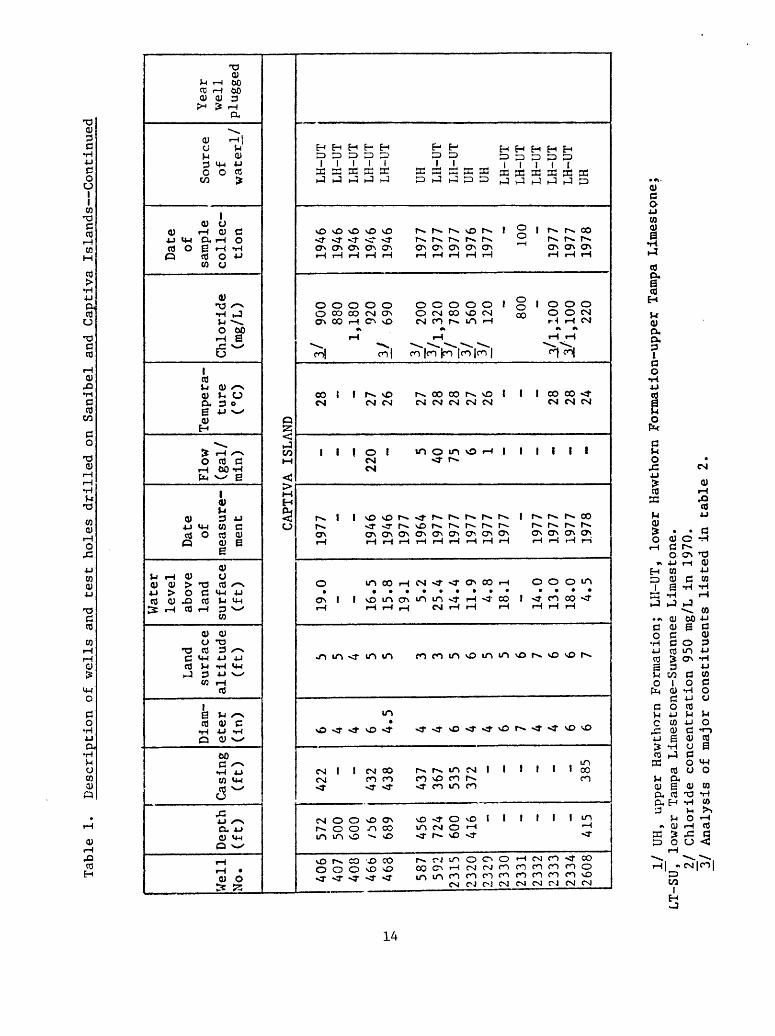
An important part of the investigation was the collection of data on wells that tap the Hawthorn Formation, Tampa Limestone, and Suwannee Lime stone (table 1). Information was collected for 76 wells ranging in depth from 335 to 896 feet--60 on Sanibel Island and 16 on Captiva. Eleven wells tap the upper Hawthorn aquifer; 57 wells tap the lower Hawthorn-upper Tampa aquifer; 2 wells tap both the upper Hawthorn and the lower Hawthorn-upper Tampa aquifers; 3 wells tap both aquifers in the lower Hawthorn, Tampa, and Suwannee; 1 well taps the lower Tampa and Suwannee aquifer; and for 2 wells the water-producing zones are not known (table 1).
Most wells inventoried on Sanibel and Captiva Islands were drilled by the cable tool (percussion) method. When cable-tool equipment is used, the steel well casing is driven into place as the well is drilled. Rotary dilling has become popular in recent years, and many of the newer wells were drilled by rotary. When rotary drilling is used, a hole is first drilled, then either metal or polyvinyl chloride (PVC) casing is installed and cemented into the hole. After the casing is cemented, an open hole is drilled below the bottom of the casing. The open-hole section is open to one or more water-yielding zones which yield water to the well. The length of open hole is determined largely by the quantity and quality of the water encountered.
Wells on both islands are cased to greater depths than similar wells on the adjacent mainland because of poor quality water in the shallow deposits on the islands. The cased depth of wells on the islands range from 319 to 700 feet and averages 458 feet. According to Boggess (1974b, p. 28), the average depth of casing in similar wells on the adjacent main land was 202 feet. More casing is required in wells on the two islands to case out saline water in the Tamiami Formation and overlying deposits. Metal cased wells not protected by cement grout corrode and eventually develop holes opposite the zones of saline water. This potential problem increases both with age of the well and salinity of adjacent formation water. When holes develop in the casing, water either leaks out of the well, or saline formation water leaks into the well. Consequently, usable water is either lost to the adjacent formation or the usable water is contaminated by saline water leaking into the well. Under normal condi tions, water leaks outward from the well because of high artesian pressure. Where the artesian pressure has been lowered by pumping, however, water will leak inward. Contamination from inward leakage of poor quality water would be greatest in the zone where the salinity is high and the artesian pressure in the underlying deeper aquifers is low. Salinity monitoring in areas where this condition is present can help detect possible leakage through holes in well casings.
WATER LEVELS IN WELLS
Water in the deep artesian aquifers is generally under sufficient pressure to cause wells to flow at land surface. On Sanibel Island, the average water level in the upper Hawthorn aquifer is 7 feet above land surface, and in the lower Hawthorn-upper Tampa aquifer, 18 feet above land surface. On Captiva Island, average water levels are slightly lower.

Tabl
e 1. Description of wells
and
test
ho
les
drilled
on Sa
nibe
l and
Capt
iva
Islands
Well
No.
Depth
(ft)
Casing
(ft)
Diam
eter
(in)
Land
surf
ace
alti
tude
(ft)
Water
level
abov
ela
ndsurface
(ft)
Date of
measure
ment
Flow
(gal/
min)
Temp
era
ture
CO
Chlo
ride
(mg/
L)
Date of
sample
collec
tion
Sour
ceof
water I/
Year
well
plugged
SANIBEL ISLAND
405
469
584
585
586
588
589
590
591
1022
1023
1154
1186
1191
1196
1197
1470
1472
500
400
421
475
700
557
609
620
654
631
490
400
700
600
600
500
542
786
_37
0
393
335
415
403
380
464
405
440
461
388
500 -
480
420
660
6 4 '-, 6 8 4 6 4 6 4 6 4 6 6 6 4 4 4
4 4 4 2 4 3 4 4 3 4 7 6 5 5 6 4 (\ 5
26.6 8.0
5.5
- 25.1
23.3
13.1
14.4
14.0
24.2
20.5 _. - 17.2
24.5
19.1
13.6
16.7
1970
1946
1977-
1964
1964
1964
1964
1964
1964
1970_ -
1970
1970
1970
1977
1971
_ 7 - 50 100 60 100 60 60 _ 2 - - - 5 -
125
26 26 - 27 27 27 27 28 27 26 _ - - - 27 - - 31
1/1,040
V
380
1,530
1,390
1/1,000
920
3,1.
150
if
950
2/1,000
510
3/
340
1/1,020
1,500
I/
980
I/
600
1,050
5,850
1946
1946
-19
6419
6419
7019
7519
6419
7019
7019
7919
701970
1970
1970
1971
1971
1971
LH-UT
UH
UH
UH, LH-UT
LH-UT
LH-UT
LH-UT
LH-UT
LH-UT
LH-UT
LH-UT
UH LH-UT
LH-UT
LH-UT
LH-UT
LH-UT
LH-UT
1971
\J UH,
uppe
r Ha
wtho
rn Fo
rmation; LH-UT, lower Hawthorn Formation-upper
Tampa
Lime
ston
e;
LT-SU, lo
wer
Tamp
a Li
mest
one-
Suwa
nnee
Limestone.
_2/ Chloride concentration
950 mg/L in 19
70.
_3/ Analysis of major
constituents li
sted
in table
2.

Tabl
e 1.
Des
crip
tion
of wells
and
test
ho
les
dril
led
on Sanibel
and
Captiva
Islands .Continued
Well
No.
Depth
(ft)
Casi
ng(ft)
Diam
eter
(in)
Land
surf
ace
altitude
(ft)
Wate
rlevel
abov
eland
surf
ace
(ft)
Date of
measure
ment
Flow
(gal/
rain
)
Tempera
ture
(°c)
Chlo
ride
(mg/L)
Date of
sample
collec
tion
SANI
BEL
ISLAND (C
onti
nued
)
1512
1533
1597
1644
1645
1646
1647
1648
1649
1650
1680
1704
1729
565
895
575
335
540
673
444
388
622
613
700
732
600
465
496
503
319
442
382
415
342
442
462 -
546
6 4 10 4 4 4 4 _ 8 6 4 8 4
5 4 3 3 4 5 4 4 6 6 6 4 4
22.8 - 17.4 7.8
7.8
19.8
11.4 5.8
17.4
20.9
14.1 7.4
20.9
1977-
1972
1972
1972
1972
1972
1977
1977
1972
1973
1977
1978
-
25 150 45 5 40 3 15 30 75 30 130 5
27 28 - 26 27 27 26 26 27 29 26 30 28
3/2,
300
1,050
I/
680
1,940
200
I/
300
I/
840
3/
460
!/
230
!/
880
1/1, 4CO
1,52
0
I/
900
1,050
1972
1972
1972
1977
1972
1972
1972
1977
1977
1972
1972
1973
1973
1973
Sour
ce
°l i/
water
Year
well
plugged
LH-UT
I.H-
UT,
LT-SU
LH-UT
UH LH-UT
LH-UT
UH
UH LH-UT
LH-UT
LH-UT
LH-U
T,LT-SU
LH-UT
1972
1978
1973
I/ UH
, up
per
Hawthorn Formation; LH-UT, lower
Hawt
horn
Formation-upper
Tampa
Lime
ston
e-
LT-SU, lo
wer
Tamp
a Limestone-Suwannee Limestone.
_2/ Ch
lori
de co
ncen
trat
ion
950 mg
/L in
19
70.
J3/ An
alys
is of
major
constituents listed in
table
2.

Tabl
e 1. Description of
wells
and
test holes
drilled
on Sanibel
and
Captiva
Islands Continued
Well
No.
Depth
(ft)
Casi
ng(ft)
Diam
eter
(in)
Land
surface
altitude
(ft)
Wate
rle
vel
above
land
surf
ace
(ft)
Date of
measure
ment
Flow
(gal/
min)
Temp
era
ture
<°C)
Chlo
ride
(mg/L)
Date of
sample
collec
tion
Sour
ceof
water
Year
well
plugged
SANIBEL ISLAND (C
onti
nued
)
1808
1811
1821
1935
1941
1967
2065
2066
2085
2086
2087
2088
2089
2108
2232
2233
2245
2246
2247
640
500
860
549
525
896
627
608
651
580
600
634
620
609
635
623 _ _
600
m. - - - _
700
501
507
561
455 _
500
516
495
480
500 _
4 4 6 8 4 6 10 10 - 10 10 10 10 1C 6 8 4
6 6 6 5 5 3 4 4 5 4 6 4 4 6 4 r 5 5 6
11.8 - 9.7
2.9
2.0
- - . - - - 10.5 ~
1977 -
1977
1976
1977 - - .. - -
1977 ~
_ 2 - - 250
160 - - 80 150 - - 5 40 15
_ - - - - 26 27 27 26 26 26 26 27 - 28 27 27 27
1,880
1,220
1,360
1/8,500
580
2,03
04/1,380
±1
450
1/1,200
/1,6
002/1,300
1/1,400
1/1, ?00
I/
690 -
I/
800
1,05
0 }/
»
.f/1
,200
I/
950
1973
1973
1977
1974
1977
1974
1975
1977
1975
1975
1975
1975
1975
1975 -
1977
1975
1975
1975
LH-UT
LH-UT
LH-UT,
LT-SU
LH-UT
LH-UT
LT-SU-
LH-UT
LH-UT
LH-UT
LH-UT
LH-UT
LH-UT
LH-UT
LH-UT
LH-UT
LH-UT
-
LH-UT
LH-UT
1978
_!/ UH,
uppe
r Hawthorn Formation; LH-UT, lo
wer Hawthorn Fo
rmat
ion-
uppe
r Tampa
Lime
ston
e;
LT-SU, lo
wer
Tampa
Lime
stone-Suwannee L
imes
tone
. 2J
Chloride concentration
950 mg/L in 19
7.0.
J3/ An
alys
is of major
constituents listed in
ta
ble
2.

Tabl
e 1. Description of wells
and
test ho
les
drilled
on Sanibel
and
Capt
iva
Islands Continued
1
Well
No.
Depth
(ft)
Casing
(ft)
Diam
eter
(in)
and
surf
ace
alti
tude
(ft)
Water
level
abov
ela
ndsu
rfac
e(f
t)
Date of
meas
ure
ment
Flow
(gal/
min)
Temp
era
ture
(°c)
Chlo
ride
(mg/L)
Date of
samp
leco
llec
tion
Source
of i/
water
Year
well
plugged
SANI
BEL
ISLAND (Continued)
2276
2282
2337
2338
2401
2462
2511
2524
2582
2583
472
600
423 -
591
600
625
650
650
354 -
395 -
470
450
512
610
610
4 4 6 6 6 8 8 4 10 4
4 6 5 7 5 4 4 5 4 4
23.7
19.1
11.0 - 26.6 - 14.5
21.0
20.5
1976
1976
1978 -
1977-
1977
1978
1978
13 -160 - - - 40 - 60
28 28 29 - 28 28 27 28
1/780
2./880
11,800
1,100
1,35
01,160
740
-3/4
40 620
600
1976
1976
1976
1978
1977
1978
1978
1977
1978
1978
UH, LH-UT
LH-UT
UH LH-UT
LH-UT
LH-UT
_LH-UT
LH-UT
LH-UT
u>
\J UH
, up
per
Hawthorn Fo
rmat
ion;
LH-UT, lo
wer
Hawt
horn
Fo
rmat
ion-
uppe
r Tampa
Lime
ston
e;
LT-SU, lo
wer
Tampa
Lime
stone-Suwannee Li
mest
one.
2f
Chloride concentration
950 mg/L in 19
70.
3J Analysis of major
constituents li
sted
in
ta
ble
2.
Tabl
e 1.
Desc
ript
ion
of wells
and
test
holes
drilled
on Sanibel
and
Captiya
Islands Continued
Well
No.
Depth
(ft)
Casing
(ft)
Diam
eter
(in)
Land
surf
ace
alti
tude
(ft)
Water
leve
lab
ove
land
surf
ace
(ft)
Date of
measure
ment
Flow
(gal/
rain)
Tempera
ture
Chloride
(mg/L)
Date of
sample
collec
tion
Sour
ceof
water_L/
Year
well
plug
ged
CAPTIVA IS
LAND
406
407
408
466
468
587
592
2315
2320
2329
2330
2331
2332
2333
2334
2608
572
500
600
06
689
456
724
600
416 - - _ -
415
422 - -
432
438
437
367
535
372 - - - _ -
385
6 4 4 6 4.5
4 4 6 4 4 6 7 4 4 6 6
5 5 4 5 5 3 3 5 6 5 5 6 7 6 6 7
19.0 - - 16.5
15.8
19.1 5.2
25.4
14.4
11.9 4.8
18.1 - 14.0
13.0
18.0 4.5
1977- -
1946
1946
1977
1964
1977
1977
1977
1977
1977-
1977
1977
1977
1978
- 22
0 - 540 75 6 1 - - _ _ - *
28 - - 27 26 27 28 28 27 26 - - 28 28 24
I/
900
880
1,18
092
0I/
690
I/
200
4/1,320
£/
780
I/
560
I/
120 -
800
3/1,100
.1/1,100 220
1946
1946
1946
1946
1946
1977
1977
1977
1976
1977-
100
1977
1977
1978
LH-UT
LH-UT
LH-UT
LH-UT
LH-UT
UH
LIl-UT
LH-UT
UHUH
LH-UT
LH-UT
LH-UT
LH-UT
LH-UT
UH
JL/
UH,
uppe
r Hawthorn Formation; LH-UT, lo
wer
Hawt
horn
Format ion-upper. Tampa
Lime
ston
e;
LT-SUT
lo
wer
Tamp
a Li
mest
one-
Suwa
nnee
Li
mest
one.
2]
Chloride co
ncen
trat
ion
950 mg/L in 19
70.
_3/ An
alys
is of major
constituents listed in ta
ble
2.

Water-level measurements for the lower aquifer indicate that water levels are lowest where ground-water pumping is most intense. The frequency of measurement is not adequate to determine when pumping began to affect water levels areally, although water-level measurements were made as early as 1946 in wells tapping both aquifers.
Most of the wells that tap the upper Hawthorn aquifer are on Captiva Island and the northwest tip of Sanibel Island. Water levels have ranged from 11.4 (1972) to 4.8 feet (1977) above land surface or about 8 to 15 feet above sea level.
Many of the water-level measurements in wells that tap the lower Hawthorn-upper Tampa aquifer were made in July and November 1977. These measurements show that the potentiometric surface was lowest, less than 10 feet above sea level, in the central part of Sanibel Island, and highest, more than 30 feet above sea level, at the east end of Sanibel Island (fig. 5).
The low artesian pressure in the central part of Sanibel Island results from pumping the production wells of the Island Water Association located along the Sanibel-Captiva Road (fig. 2). Hydrographs of wells 1935 and 585 (fig. 6) and wells 589 and 2524 (fig. 7) illustrate pressure fluctuations in the lower Hawthorn-upper Tampa aquifer. Although these hydrographs are short term and the frequency of measurement is not always adequate, some conclusions can be made from them. The large range of fluctuations in wells 589, 1935, and 2524 shows the influence of pumping from the production wells in central Sanibel. The subdued fluctuation in well 585 suggests normal changes in water level at the east tip of Sanibel, somewhat unaffected by the pumping.
A bar graph of the monthly pumpage from the Sanibel well field is shown at the top of figure 8, and a bar graph of the precipitation on Sanibel is shown at the bottom. These graphs show that pumping decreases as rainfall increases. The water level in well 1935 was highest, about 19 feet above land surface, late in 1977 when none of the production wells were being pumped. Lower water levels shown on the graph are largely the effects of pumping of nearby wells. The range in water-level fluctuation of 18 feet in well 1935 in 1977 contrasts with a range of less than 3 feet in well 585 over the same time period.
The periodic water-level measurements made in wells 589 and 2524 in the central part of Sanibel Island indicate that both wells are affected by pumping of nearby wells as shown in figure 7, but not necessarily by the same pumping wells. For example, during the latter part of 1978 when the water level in well 589 was rising, the water level in well 2524 about 3 miles away was declining to a new low at the end of November. The upward trend of water level in well 589 and downward trend in well 2524 were still occurring in 1979 and may have been caused by a westward shift of pumping in the well field.
15

o o
EX
PL
AN
AT
ION
+19
WE
LL
AN
D A
LT
ITU
DE
OF
W
AT
ER
S
UR
FA
CE
IN
F
EE
T,
JUL
Y
19
77
. +
18
WE
LL
AN
D A
LT
ITU
DE
O
F
WA
TE
R
SU
RF
AC
E
IN
FE
ET
,NO
VE
MB
ER
1
97
7.
PO
TE
NT
IOM
ET
RIC
C
ON
TO
UR
S
HO
WS
A
LT
ITU
DE
A
T W
HIC
H
WA
TE
R
LE
VE
L
WO
UL
D
HA
VE
S
TO
OD
IN
T
IGH
TLY
C
AS
ED
W
EL
LS
. C
ON
TO
UR
IN
TE
RV
ALS
5
FE
ET
A
ND
10
F
EE
T.
DA
TU
M
IS
SE
A
LE
VE
L.
0 I
2 3 MILES
+30
+ 13
Figure 5.
--Po
tent
iome
tric
su
rfac
e of the
lower
Hawthorn-upper Ta
mpa
aquifer,
July
and
November 19
77,
Sani
bel
and
Captiva
Islands.

UJo
or:DCO
UJ
QQ <
UJ UJ U_
WELL 1935 i i I i i i I i i i i
25
23
21
19
17
15
II
7
UJ >UJ
UJ CO
UJ
oQQ
H UJ UJu.
UJ
UJ
UJ>UJ
WELL 585 I I I I I I I I I I
22 24
1976 1977 1978 1979
Figure 6.--Hydrographs of well 1935, April 1976 through February 1978, and well 585, April 1977 through December 1979, lower Hawthorn-upper Tampa aquifer, Sanibel Island.
17

Ulo
a:13
UJ > O ffi
UJ UJ
18
16
14
12
10
8
6
4
I I I I I I I I I I I
/
WELL 589
I I I I II I I I I
I I I I I I I I I I I 22
20
18
UJ_i
2 <UJ CO
8
O00<
UJ UJ
~ 22
ui>UI 20
18
14
Til MIT I I I I
10
"WELL 2524
M M M I M I i i
MM T I Mill I I M I Ml I I I I II M II I I II
M
UJ27 >
UJ
25
23
1976 1977 1978
17
151979
Figure 7. Hydrographs of well 589, October 1976 through November 1979, and well 2524, October 1977 through December 1979, lower Hawthorn-upper Tampa aquifer, Sanibel Island.
18

I
z 600
K 5°
LJ Q.
LJ"O) 40o z< 9|j 30
°~z 20
0
_J 10
^ n
-
_
-
"~
mm
mm
mm
mm
mm
mm
mm
mm
mm
mm
mm
mmmm
mm
mm
mm
mmmm
mm
mm
mm
mm
mm mm
mm
mm
mm
mm
~
-
-
OII 10
oLJ
5
0 Tlrf
mm
mm
mm
fkIrff
M
M
n--rMMl
]hrIM
MH
J1976 977 1978 1979
Figure 8. Monthly pumpage from the Sanibel well field, and monthly precipitation on Sanibel Island, 1976-79. (Pumpage data from Island Water Association of Sanibel. Precipitation data from USGS rain gage.)
19
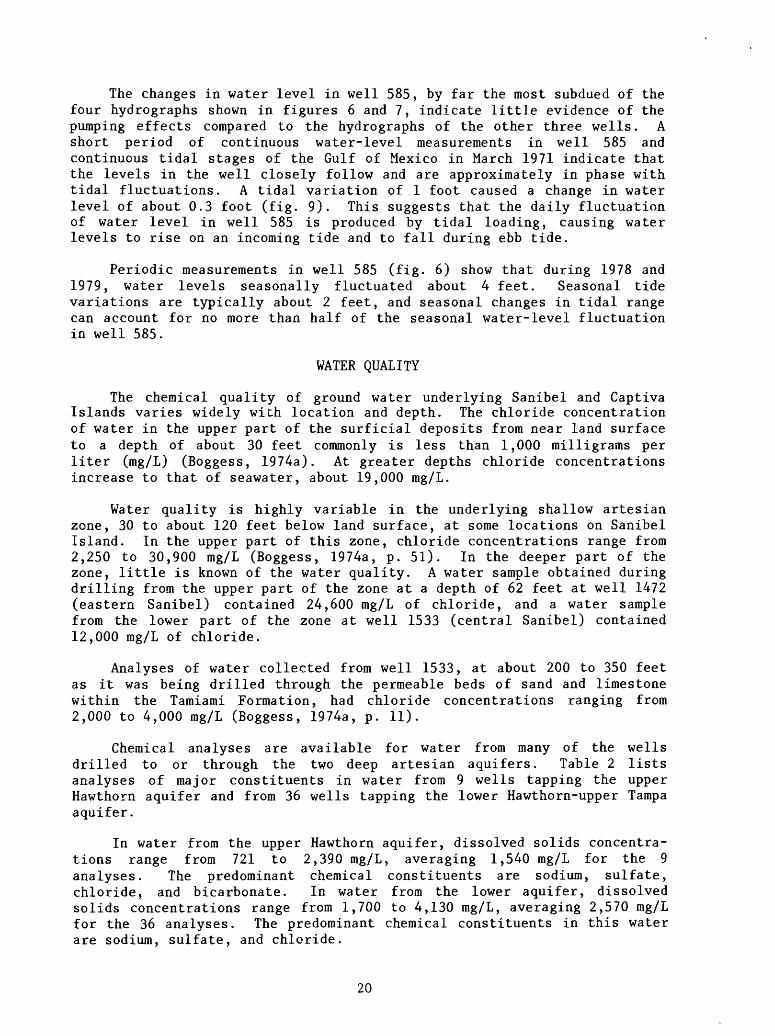
The changes in water level in well 585, by far the most subdued of the four hydrographs shown in figures 6 and 7, indicate little evidence of the pumping effects compared to the hydrographs of the other three wells. A short period of continuous water-level measurements in well 585 and continuous tidal stages of the Gulf of Mexico in March 1971 indicate that the levels in the well closely follow and are approximately in phase with tidal fluctuations. A tidal variation of 1 foot caused a change in water level of about 0.3 foot (fig. 9). This suggests that the daily fluctuation of water level in well 585 is produced by tidal loading, causing water levels to rise on an incoming tide and to fall during ebb tide.
Periodic measurements in well 585 (fig. 6) show that during 1978 and 1979, water levels seasonally fluctuated about 4 feet. Seasonal tide variations are typically about 2 feet, and seasonal changes in tidal range can account for no more than half of the seasonal water-level fluctuation in well 585.
WATER QUALITY
The chemical quality of ground water underlying Sanibel and Captiva Islands varies widely with location and depth. The chloride concentration of water in the upper part of the surficial deposits from near land surface to a depth of about 30 feet commonly is less than 1,000 milligrams per liter (mg/L) (Boggess, 1974a). At greater depths chloride concentrations increase to that of seawater, about 19,000 mg/L.
Water quality is highly variable in the underlying shallow artesian zone, 30 to about 120 feet below land surface, at some locations on Sanibel Island. In the upper part of this zone, chloride concentrations range from 2,250 to 30,900 mg/L (Boggess, 1974a, p. 51). In the deeper part of the zone, little is known of the water quality. A water sample obtained during drilling from the upper part of the zone at a depth of 62 feet at well 1472 (eastern Sanibel) contained 24,600 mg/L of chloride, and a water sample from the lower part of the zone at well 1533 (central Sanibel) contained 12,000 mg/L of chloride.
Analyses of water collected from well 1533, at about 200 to 350 feet as it was being drilled through the permeable beds of sand and limestone within the Tamiami Formation, had chloride concentrations ranging from 2,000 to 4,000 mg/L (Boggess, 1974a, p. 11).
Chemical analyses are available for water from many of the wells drilled to or through the two deep artesian aquifers. Table 2 lists analyses of major constituents in water from 9 wells tapping the upper Hawthorn aquifer and from 36 wells tapping the lower Hawthorn-upper Tampa aquifer.
In water from the upper Hawthorn aquifer, dissolved solids concentra tions range from 721 to 2,390 mg/L, averaging 1,540 mg/L for the 9 analyses. The predominant chemical constituents are sodium, sulfate, chloride, and bicarbonate. In water from the lower aquifer, dissolved solids concentrations range from 1,700 to 4,130 mg/L, averaging 2,570 mg/L for the 36 analyses. The predominant chemical constituents in this water are sodium, sulfate, and chloride.
20

LJ
LJ C/)
LU
LU OQ
27
"3 26
25| WELL 585
LU LU
LU SEA > LEVELLU
a:LU
MARCH 12 | MARCH 13 | MARCH 14
I
1971
Figure 9. Hydrograph of well 585, Sanibel Island, and graph of tidal fluctuation in the Gulf of Mexico (Point Ybel), March 10-14, 1971.
21

zz
J_4
co
O
O N3 O
co \o oo o> oo
NJ (-
oooooooooo
oooooooooo
oooooooooo
i c T T ft 5^
H
Td>
II-IT ft?ti
OOOOOOOOOO
oooooooooo
oooooooooo
OOOOOOOOOO
NJI » V-n
h- ' *^J UJ
C>4>J>-O CO CT* H- Ooooo oooo
OOOOO
oooooooo
oooooooo
> I-1 to M U> 1 -P* JO-f^vO Ui^ONOJH1U3OO OOOOO
OO OO vOoooooooo
LnOOOOOOO
WellNo.
Dateof
collection
Silica (Si02)
Calcium (Ca)
Magnesium (Mg)
Strontium (Sr)
Sodium (Na)
Potassium (K)
Sulfate ($04)
Chloride (Cl)
Fluoride (F)
Bicarbonate (HC03)
Calcium- Magnesium
Non-
carbonate
o a. {B 3O CDO COCO CO
Dissolved solids (resi due at 180°C)
Specific conduc tance (micromhos
at 25°C)
pH____________ Temperature
COft
r: wft co
CM
PCO
-o n<
rt n
9o*
N>
O
§
O
toCO
oH»
§ft
CO
o
CO
a4 n>
Oa it
CO
a.CO

NJ ro NJ 1*0 K; ro INJ NJ K/ NJ to .-o NJ NJ r-o to NJ t-o M M t M
ro o co LO t cc j -o -o LO o co oo co r: co .£> i--1 -o U) ui NJ CT> --J o co co ^ :~ -vi a-- (..n
O oo m .?» c- £> o v -c- O O -o o*- vji -~i NJ
OOOOOOOO>(-Jvi3O^~J(-nOOOOO'wnCOCDUTOOOOJO -C- O
MH1H* H1 1 '
M I-1 > W > <
x^Jc»c>'Oi^o ^ oON^roo^*-JCTNt >N3Ot '-^cjtvJOONJMso-c^oou^ooo^- co ooooooooooooooooooooooooooo o oo
HJ*~n'sDO<-JON;^ "O ^ OUJOOOOOOOOOOOOOOOOOOOOOOO O OO
l_i j_iI-- I *-< h- 1 ' 1 ' (- » H-'l-'to
-OUiN3<-nOOOOOro -O OO
OOOOOOOOOOOOOOOOOOOOOOOOUi O OO
Ml 'MM
-£>>NJ4:>-vOCrNMaNMU>rovOK>t-'OO>sO l-n OOooooooooooooooooooooooooo o oo
cooOJO
ooooooooooooooooooooooooo o oo
OOOOOiMOOl OJCOOv.OUiO-^-U>UJUn>.O-£>-UiOOOUOCOO^<^n "^ OOJooooooooooooooooooooooooo c- oo
ooooooooooooooooooooooooo ° oo
ffi
hd
M
WellNo.
Dateof
collection
Silica (Si02)
Calcium (Ca)
Magnesium (Mg)
Strontium (Sr)
Sodium (Na)
Potassium (K)
Sulfate (S04)
Chloride (Cl)
Fluoride (F)
Bicarbonate (HC03)
Calcium- Magnesium
Non-
carbonate
O Cu
O (DO W
(jj {/)
Dissolved solids (resi due at 180°C)
Specific conduc tance (microinhos
at 25°C)
pH
Temperature
5?u*
NJ
o
o
co rrrr'C O P rr co
fi>
(D MMcn
Sani
OQ
O
n
rtH-
cnM
cn I In ortH-p c(D

The distribution of dissolved solids in water from wells tapping both the upper and lower aquifers on Sanibel and Captiva Islands is shown in figure 10. Generally the water from wells on the east end of Sanibel Island have the highest concentrations, more than 4,000 mg/L in wells 1650 and 1512 in the lower Hawthorn-upper Tampa aquifer. In the central part of the island, dissolved solids concentrations range from 1,700 mg/L in well 2524 to 3,800 mg/L in well 1597; both wells tap the lower Hawthorn-upper Tampa aquifer. On the northwest end of Sanibel Island and on Captiva Island, water bearing zones in both the upper and lower aquifers have been equally developed for domestic use. In most of that area, dissolved solids concentrations are slightly less in water from the upper Hawthorn aquifer than from the lower aquifer.
Only wells 587 and 2329 on Captiva Island and well 1644 on Sanibel Island, which tap the upper Hawthorn aquifer, yield water which meets the recommended limit of 250 mg/L of chloride and 250 mg/L of sulfate for drinking water. None of the water analyzed meets the recommended limit of 500 mg/L for dissolved solids. The calcium magnesium hardness of water in the upper Hawthorn aquifer ranges from hard (121 to 180 mg/L) to very hard (more than 180 mg/L) (Swenson and Baldwin, 1965, p. 17); water from well 2320 had a hardness of 440 mg/L. Water from the lower Hawthorn-upper Tampa aquifer is classed as very hard, ranging from 290 to 1,200 mg/L (table 2).
The quality of the water obtained from wells on the islands depends, in part, on the well location and the water-yielding zone penetrated. Water enters the well bore at one or more intervals between the bottom of the well casing and the bottom of the well. As previously described, wells drilled into the Hawthorn penetrate the shallow artesian zone containing highly saline water as well as other shallower zones that may also contain salty water. Where water from any part of these saline water zones enters the well as a result of improper sealing of the well casing, inadequate length of well casing, or deterioration of the casing from corrosion, the water quality in the well will be degraded.
As reported by Boggess (1974a), water quality in the deep artesian aquifers underlying Sanibel and Captiva Islands is highly variable, both vertically and horizontally (table 2). Because of this variability, it is difficult if not impossible, using data at hand, to determine the reasons for poor water quality in any given well without a considerable amount of field research. For example, well 1512 near the east end of Sanibel Island had the highest concentration (4,130 mg/L) of dissolved solids in water from any well in the deep artesian aquifers on the islands. Water from this well also contains the highest concentrations of calcium, magnesium, sodium, and chloride. This well is 565 feet deep and contains 465 feet of 6-inch metal casing. Well 1649, less than 0.5 mile from well 1512, is 622 feet deep and contains 442 feet of 8-inch metal casing. Well 1649, however, yields water containing about half the concentration of dissolved solids (2,460 mg/L) and lower concentrations of most other chemical con stituents. Therefore, saline water from a shallower water zone evidently is entering well 1512 probably because of corroded metal casing, casing damaged during construction of the well, or downward leakage of saline water along the outside of the well casing.
24

1645
PO
INT
Y
BE
L
K3
Ln
SA
NIB
EL
IS
LA
ND
2750
/ 2088
29
40
EX
PL
AN
AT
ION
2320
I720>
23
33
*
2610
WE
LL
TA
PP
ING
U
PP
ER
H
AW
TH
OR
N A
QU
IFE
R
WE
LL T
AP
PIN
G
LOW
ER
H
AW
TH
OR
N-U
PP
ER
TA
MP
A
AQ
UIF
ER
2282
UP
PE
R
NU
MB
ER
IS
W
EL
L
20
lcF
N
UM
BE
R,
LOW
ER
N
UM
BE
R
IS D
ISS
OLV
ED
S
OLI
DS
C
ON
CE
NT
RA
TIO
N
IN
MIL
LIG
RA
MS
P
ER
L
ITE
R
CA
PT
IVA
IS
LA
ND
Fig
ure
10. D
isso
lved
soli
ds
concentr
ati
on
in w
ate
r fr
om
w
ell
s ta
ppin
g
the
upper
H
awth
orn
aq
uif
er
and
th
e
low
er
Haw
tho
rn-u
pp
er
Tam
pa aquif
er,
S
an
ibel
and
C
ap
tiv
a Is
lan
ds.

The relation of chloride concentrations to dissolved solids concentra tions in water from the lower Hawthorn-upper- Tampa aquifer is shown in figure 11. Data for this figure are from analyses of water samples collected from wells on Sanibel and Captiva Islands. This diagram also illustrates the variability of the quality of water from the lower Hawthorn-upper Tampa aquifer, with chloride concentrations ranging from less than 500 mg/L to more than 2,000 mg/L and dissolved solids concentra tions ranging from about 1,700 mg/L to more than 4,000 mg/L. If the value for one of the parameters is known, then the other parameter can be estimated from the diagram.
The lowest dissolved solids concentration in water from the lower Hawthorn-upper Tampa aquifer was found in observation well 2524 in the central part of Sanibel Island. This well is 625 feet deep and contains 512 feet of 4-inch PVC well casing cemented in place. Water from this well in 1977 contained 1,700 mg/L dissolved solids, 440 mg/L chlorides, and 460 mg/L sodium concentrations. This well also contained water with the lowest calcium magnesium hardness (290 mg/L) of any well on the islands tapping the lower aquifer. This comparatively low dissolved solids concen tration may be consistent through a considerable depth range. For example, well 1023 (near well 2524) open to an interval from 461 to 490 feet yielded water in 1979 with a chloride concentration of 510 mg/L (table 1), similar to that in the water from well 2524. This indicates (fig. 11) a dissolved solids concentration of about 1,700 mg/L, or about the same as in well 2524. The two wells span the depth interval 461 to 625 feet, indicating that water in the lower Hawthorn-upper Tampa aquifer in the vicinity of these wells and within that depth range may be less saline than elsewhere in the islands. This presumed uniformity is apparently an exception. In general, variation in quality, both vertically and horizontally, is the rule.
Heavy pumping from wells may cause changes in the quality of water from them or from nearby wells, as suggested earlier. For example, in 1972 production well 1597 (now plugged) contained water with a chloride concen tration of 680 mg/L when drilled in an area where the overlying deposits contain water with as much as 12,000 mg/L chloride concentration. By March 1974, the chloride concentration in the well had increased to 1,900 mg/L (table 2). This well, drilled at the site of test well 1533, was 575 feet deep and contained 503 feet of 10-inch casing.
Pumping of well 1597 over a period of several years may have caused some downward leakage of saline water, which resulted in a substantial increase in chloride concentration. Well 1935, also a production well now plugged, may have undergone similar water-quality degradation. In 1974, it yielded water containing 8,500 mg/L of chloride, although a sample collected in 1976 contained only 1,100 mg/L of chloride, about average for that sequence of deposits open to the well.
26

25
00
cr UJ Jj 2000
O
500
UJ o X o
o UJ
1000
50
0 1000
II
I
1500
20
00
2
50
0
3000
35
00
4000
DIS
SO
LV
ED
S
OLID
S,IN
M
ILLIG
RA
MS
P
ER
LIT
ER
4500
Figu
re 11.--Relation
of ch
lori
de to dissolved
solids co
ncen
trat
ion
in water fr
om th
e lo
wer
Hawt
horn
-upp
er Tampa
aqui
fer,
Sanibel
and
Captiva
Islands.

If wells tapping water-bearing zones are being degraded by saline water entering the wells through the casing or by other means, more detailed field study will be required to determine the mechanism by which the degradation is occurring. Of 24 wells from which water samples were collected at least 1 year apart, the chloride concentration increased in 3, decreased in 10, and remained the same in 5. The pattern is random, and there is no relation between increase in chloride concentration and distance to the center of pumping.
A summary of selected chemical constituents in water from the deep aquifers is shown on table 3. When comparing the range in chemical constituents and their averages, it is evident that the water from the lower Hawthorn-upper Tampa aquifer is generally more saline. Chloride, magnesium, and calcium concentrations in water from this aquifer are at least twice as great as in water from the upper Hawthorn aquifer; sulfate is about the same, and bicarbonate is less. Water from the upper Hawthorn aquifer, however, has a greater range in concentrations of chemical constituents.
WATER USE
Two deep artesian aquifers are the principal sources of water supply on Sanibel and Captiva Islands. Most of the water used is obtained from deep wells that tap the lower aquifer in the lower part of the Hawthorn Formation and the upper part of the Tampa Limestone, chiefly those wells of the Island Water Association which treat and distribute water throughout the islands. The average pumpage from these wells in 1977 was 1.4 Mgal/d or 496 Mgal for the year (table 4). This water is processed through a desalination plant on Sanibel Island before distribution. Additional treated water is purchased from the Greater Pine Island Water Association, when needed, and is transmitted to the island through a pipeline underlying San Carlos Bay. About 22 Mgal were purchased in 1977. In addition, wells 408 and 587 on the northern part of Captiva Island are used as an emergency supply for the Island Water Association. In 1977, the two wells produced about 300,000 gallons.
Most of the remaining deep artesian wells on Sanibel and Captiva Islands are used for irrigation of lawns and golf courses. Private pumpage in 1977 from wells in both of the deep artesian aquifers for all purposes is estimated at about 135 Mgal (0.37 Mgal/d) on Sanibel and about 59 Mgal (0.16 Mgal/d) on Captiva. Most of this water was withdrawn during the dry season, November to June.
The total volume of water withdrawn in 1977 from the deep aquifers was estimated to be 690 Mgal, an average of about 1.9 Mgal/d. The total capa city of all existing wells tapping the deep artesian aquifers is estimated at about 6 Mgal/d, or about 3 times the 1977 daily average use.
28

Table 3.--Summary of selected constituents in water from the upper Hawthorn aquifer and from the lower Hawthorn-upper Tampa aquifer, Sanibel and Captiva Islands
[All values in milligrams per liter]
Upper Hawthorn aquiferLower Hawthorn-
upper Tampa aquifer
Calcium
Magnesium
Sodium
Potassium
Sulfate
Chloride
Average
43
35
439
29
379
403
Range
18-75
13-60
230-700
18-40
100-890
140-730
Average
94
92
664
39
381
1,078
Range
48-160
40-180
440-1,000
14-60
270-700
440-2,200
Fluoride
Bicarbonate
Carbonate haidness
Dissolved solids
3.2 2.0-3.6
322 200-427
254 99-440
1,540 721-2,390
2.2 1.1-3.5
210 128-288
610 290-1,200
2,571 1,700-4,130
29

Tab1e 4. Monthly water pumpage from Island Water Association wells on Sanibel Island
[Millions of gallons]
Month
JanuaryFebruaryMarchAprilMayJuneJulyAugustSeptemberOctoberNovemberDecember
Total
DailyAverage
197A
«_--
36.21/34.22/30.71/33.01/28.1
25.421.231.329.3
269.4
1.0
1975
1/35.224.1
1/33.740.041.943.538.839.329.633.238.042.1
439.4
1.2
1976
43.543.852.451.642.736.544.838.532.135.739.943.2
504.7
1.4
1977
39.241.058.448.743.340.540.140.928.933.741.640.0
496.3
1.4
1978
37.129.039.133.429.528.630.731.121.927.427.931.0
366.8
1.0
1979
34.435.741.441.034.833.333.938.827.931.544.742.6
440.0
1.2
I/ Estimated
30

SUMMARY AND CONCLUSIONS
Sanibel and Captiva Islands are underlain by a series of freshwater and saline-water zones. The water-table zone, from land surface to a depth of about 15 to 30 feet, commonly contains freshwater in the upper part of the zone and saline water in the lower part. A shallow artesian zone underlies the water-table zone and extends from a depth of about 30 to as much as 120 feet. This aquifer contains saline water with chloride concen trations ranging from 2,250 to 30,900 mg/L. The Tamiami Formation, which underlies the shallow artesian zone, locally provides small amounts of potable water to wells, although at some localities this zone contains salty water.
The Hawthorn Formation and Tampa Limestone successively underlie the Tamiami Formation. These formations consist predominantly of gray-white phosphatic limestone with interbeddea carbonate clay or marl. The Hawthorn Formation and Tampa Limestone contain two widely used artesian aquifers: (1) the upper Hawthorn aquifer in the upper part of the Hawthorn Formation, and (2) the lower Hawthorn-upper Tampa aquifer in the lower part of the Hawthorn Formation and upper part of the Tampa Limestone.
Water from the upper Hawthorn aquifer is used to supply water mostly to residents on North Captiva Island, Captiva Island, and northwestern Sanibel Island. Water from this aquifer is usually better quality than that from the lower Hawthorn-upper Tampa aquifer. North Captiva Island, Captiva Island, and northwestern Sanibel Island are areas where the water can be used without desalination. Water from the upper Hawthorn aquifer contains dissolved solids concentration which averages 1,540 mg/L. The water contains about 440 mg/L of sodium, 400 mg/L of chloride, and 380 mg/L of sulfate plus smaller concentrations of other chemical constituents. Water levels in wells that tap the upper Hawthorn aquifer range from 8 to 15 feet above sea level; most wells flow at land surface.
The lower Hawthorn-upper Tampa aquifer is the principal source of water supply for most uses on Sanibel and Captiva Islands. Desalinated water from this aquifer constitutes part of the public supply for these islands. Wells that tap this lower aquifer may flow at rates as much as 160 gal/min. The water ranges in calcium magnesium hardness from 330 to 1,200 mg/L. The dissolved solids concentration in water ranges from 1,700 to 4,130 mg/L and averages 2,570 mg/L. The water contains about 660 mg/L of sodium, 1,080 mg/L of chloride, and 380 mg/L of sulfate. Between July and November 1977, water levels in the aquifer ranged from about 7 to 32 feet above sea level throughout Sanibel and Captiva. Water levels were lowest in the central part of Sanibel Island where most of the production wells for the Island Water Association are located.
Pumpage from both deep artesian aquifers for all purposes during 1977 was about 690 Mgal, averaging 1.9 Mgal/d. During 1977, pumpage from wells of the Island Water Association open to the lower Hawthorn-upper Tampa aquifer averaged about 1.4 Mgal/d.
31
SELECTED REFERENCES
Altschuler, Z. S., Clarke, R. S., Jr., and Young, E. J., 1958, The geochem istry of uranium in apatite and phosphorite: U.S. Geological Survey Professional Paper 314-D, p. 45-90.
Boggess, D. H., 1974a, The shallow fresh-water system of Sanibel Island, Lee County, Florida, with emphasis on the sources and effects of saline water: Florida Bureau of Geology Report of Investigations 69 52 p.
______1974b, Saline ground water resources of Lee County, Florida: U.S.Geological Survey Open-File Report FL 74-247, 62 p.
Boggess, D. H., Missimer, T. M., and O'Donnell, T. H., 1981, Hydrogeologic sections through Lee County and adjacent areas of Hendry and Collier Counties, Florida: U.S. Geological Survey Water-Resources Investiga tions Open-File Report 81-638.
Missimer, T. M., and Gardner, R. A., 1976, High-resolution seismic reflec tion and profiling for mapping shallow aquifers in Lee County, Florida: U.S. Geological Survey Water-Resources Investigations 76-45, 30 p.
Sproul, C. R., Boggess, D. H. , and Woodard, H. J., 1972, Saline-water intrusion from deep artesian sources in the McGregor Isles area of Lee County, Florida: Florida Bureau of Geology Information Circular 75, 30 p.
Swenson, H. A., and Baldwin, H. L. , 1965, A primer on water quality: U.S. Geological Survey, 27 p.
*U.S. GOVERNMENT PRINTING OFFICE: 1981-546-161/51
32