Embed Size (px)
Citation preview

DECOMPOSITION KINETICS OF THE ROCKET
PROPELLANT RP-1 AND ITS CHEMICAL KINETIC
SURROGATES
A DISSERTATION
SUBMITTED TO THE DEPARTMENT OF MECHANICAL
ENGINEERING
AND THE COMMITTEE ON GRADUATE STUDIES
OF STANFORD UNIVERSITY
IN PARTIAL FULFILLMENT OF THE REQUIREMENTS
FOR THE DEGREE OF
DOCTOR OF PHILOSOPHY
Megan Edwards MacDonald
January 2012

http://creativecommons.org/licenses/by-nc/3.0/us/
This dissertation is online at: http://purl.stanford.edu/ng820gf9574
© 2012 by Megan Edwards MacDonald. All Rights Reserved.
Re-distributed by Stanford University under license with the author.
This work is licensed under a Creative Commons Attribution-Noncommercial 3.0 United States License.
ii

I certify that I have read this dissertation and that, in my opinion, it is fully adequatein scope and quality as a dissertation for the degree of Doctor of Philosophy.
Ronald Hanson, Primary Adviser
I certify that I have read this dissertation and that, in my opinion, it is fully adequatein scope and quality as a dissertation for the degree of Doctor of Philosophy.
Craig Bowman
I certify that I have read this dissertation and that, in my opinion, it is fully adequatein scope and quality as a dissertation for the degree of Doctor of Philosophy.
Reginald Mitchell
Approved for the Stanford University Committee on Graduate Studies.
Patricia J. Gumport, Vice Provost Graduate Education
This signature page was generated electronically upon submission of this dissertation in electronic format. An original signed hard copy of the signature page is on file inUniversity Archives.
iii

iv
Abstract
High-temperature fuel decomposition is an important aspect of fuel chemistry, and
a thorough understanding of this process is necessary in order to accurately de-
scribe combustion chemistry. The study of kerosene rocket fuels is especially of
interest today as the launch industry grows. Two major motivations drive the
study of kerosene decomposition. First, it is a vital building block upon which ox-
idation chemistry can be built, and second, it is used as a coolant in many rockets
and high-speed aircraft. As state-of-the-art pushes combustor temperatures higher
(requiring greater cooling capabilities), additional studies of the high-temperature
decomposition of kerosene fuels will be necessary. Previous studies of the decom-
position of rocket propellants are limited to temperatures below approximately
1100 K.
Measurements of fuel and ethylene time histories during decomposition of RP-
fuels and their possible surrogate components were carried out between 1000 and
1500 K in two shock tubes, the Aerosol Shock Tube (AST), for experiments between
4 and 8 atm, and the High Pressure Shock Tube (HPST), for experiments between
18 and 51 atm. Three diagnostics were utilized, a visible or near-infrared diode
laser for aerosol scattering measurements in the AST, a 3.39 µm mid-infrared
HeNe gas laser for measurements of fuel mole fractions, and a CO2 gas laser for
measurements of ethylene mole fractions near 10.5 µm. Prior to shock tube studies
of the decomposition of these fuels, their absorption cross sections were measured
at 3.39 µm and at the two CO2 laser wavelengths utilized for this study. Low-
temperature (300 to 800 K) absorption cross sections were measured in a Fourier
Transform Infrared (FTIR) Spectrometer and high-temperature (800 to 1500 K)
cross sections were measured in the shock tube.
Measurements of the fuel time histories and overall fuel decomposition rates
for six fuels (RP-1, RP-2, JP-7, n-dodecane, methylcyclohexane, and iso-cetane)
v

are reported. Similar measurements were also completed on mixtures of the poten-
tial fuel additives 1,2,3,4-tetrahydroquinoline and benzyl alcohol with RP-1 and
n-dodecane. A new method was developed for correcting the 3.39 µm HeNe ab-
sorbance measurement for interfering species.
Measurements of the ethylene time histories and ethylene yields for four fuels
(RP-1, n-dodecane, methylcyclohexane, and iso-cetane) are also reported. The
ethylene diagnostic was improved to utilize two wavelengths as a means of ac-
counting for interference in the ethylene measurement, and adapted for utilization
at high temperatures.
An RP-fuel surrogate was formulated based on three targets, or characteristics
to be matched with the real fuel: compound class, overall fuel decomposition rate,
and ethylene yield. This resulted in a surrogate containing 32% n-dodecane, 59%
methylcyclohexane, and 9% iso-cetane. Modeling e!orts with this surrogate have
shown good agreement with experimental measurements of actual RP-1 fuel.
vi

Acknowledgements
First, I would like to thank my advisor, Ron Hanson, for his guidance through
this process and for teaching me to be an independent thinker. Thanks also to
Dave Davidson, who has always been available to o!er advice and guidance. The
Hanson Lab is an incredible group of students who have been supportive and
helpful through the times when nothing is working and then excited to hear when
experiments are finally going well. Thanks to all. I would especially like to thank
Dan Haylett, Matt Campbell, Genny Pang, Adela Bardos, and Greg Rieker for the
many conversations about both lab and life.
I could not have asked for a better group of friends from which to draw support
during this work. Thanks to Todd White, Brandon Oliver, and Ariane Chepko for
the many thoughtful conversations and fun times throughout the years, both before
and during my time at Stanford. Thanks to Emily Sayles for being a fantastic
listener and for encouraging me to push myself beyond my self-perceived limits.
And thanks to all my friends who have been integral in maintaining my mental
health over the last few years.
Lastly, and most importantly, I would like to thank my mom, dad, and sister
Abby (who beat me to doctor), who have been a constant anchor and support in
times of trouble and with whom I am blessed to share times of joy.
vii

Contents
Abstract v
Acknowledgements vii
1 Introduction 1
1.1 Motivation . . . . . . . . . . . . . . . . . . . . . . . . . . . . . . . . 1
1.2 Objectives . . . . . . . . . . . . . . . . . . . . . . . . . . . . . . . . 4
1.3 Organization . . . . . . . . . . . . . . . . . . . . . . . . . . . . . . 4
2 Literature Review 5
2.1 Kerosenes . . . . . . . . . . . . . . . . . . . . . . . . . . . . . . . . 5
2.2 n-Dodecane . . . . . . . . . . . . . . . . . . . . . . . . . . . . . . . 7
2.3 Methylcyclohexane (MCH) . . . . . . . . . . . . . . . . . . . . . . . 8
2.4 2,2,4,4,6,8,8-Heptamethylnonane (iso-Cetane) . . . . . . . . . . . . 9
2.5 Additives . . . . . . . . . . . . . . . . . . . . . . . . . . . . . . . . 9
2.6 Summary of Historic Decomposition Rates . . . . . . . . . . . . . . 10
3 Theoretical Background 12
3.1 Spectroscopic and Kinetic Theory . . . . . . . . . . . . . . . . . . . 12
3.2 Selection of Laser Lines . . . . . . . . . . . . . . . . . . . . . . . . . 13
3.3 Corrections for Interfering Species . . . . . . . . . . . . . . . . . . . 15
3.4 Soot . . . . . . . . . . . . . . . . . . . . . . . . . . . . . . . . . . . 20
4 Experimental Setup 22
4.1 Aerosol Shock Tube . . . . . . . . . . . . . . . . . . . . . . . . . . . 23
4.2 High-Pressure Shock Tube . . . . . . . . . . . . . . . . . . . . . . . 25
4.3 HPST Window Design . . . . . . . . . . . . . . . . . . . . . . . . . 28
viii

4.4 Fuels . . . . . . . . . . . . . . . . . . . . . . . . . . . . . . . . . . . 30
5 Absorption Cross Sections 34
5.1 n-Dodecane . . . . . . . . . . . . . . . . . . . . . . . . . . . . . . . 35
5.2 RP-1 . . . . . . . . . . . . . . . . . . . . . . . . . . . . . . . . . . . 36
5.3 RP-2 . . . . . . . . . . . . . . . . . . . . . . . . . . . . . . . . . . . 38
5.4 JP-7 . . . . . . . . . . . . . . . . . . . . . . . . . . . . . . . . . . . 39
5.5 JP-8 . . . . . . . . . . . . . . . . . . . . . . . . . . . . . . . . . . . 41
5.6 THQ . . . . . . . . . . . . . . . . . . . . . . . . . . . . . . . . . . . 41
5.7 MCH . . . . . . . . . . . . . . . . . . . . . . . . . . . . . . . . . . . 43
5.8 iso-Cetane . . . . . . . . . . . . . . . . . . . . . . . . . . . . . . . . 43
5.9 Small Alkenes . . . . . . . . . . . . . . . . . . . . . . . . . . . . . . 45
5.10 Summary . . . . . . . . . . . . . . . . . . . . . . . . . . . . . . . . 47
6 Shock Experiments on Six Fuels 50
6.1 RP-1 . . . . . . . . . . . . . . . . . . . . . . . . . . . . . . . . . . . 50
6.1.1 Facilities and Diagnostics . . . . . . . . . . . . . . . . . . . . 50
6.1.2 Fuel Measurements . . . . . . . . . . . . . . . . . . . . . . . 51
6.1.3 Ethylene Measurements . . . . . . . . . . . . . . . . . . . . 54
6.1.4 Discussion of Findings . . . . . . . . . . . . . . . . . . . . . 55
6.2 RP-2 . . . . . . . . . . . . . . . . . . . . . . . . . . . . . . . . . . . 58
6.2.1 Facilities and Diagnostics . . . . . . . . . . . . . . . . . . . . 58
6.2.2 Fuel Measurements . . . . . . . . . . . . . . . . . . . . . . . 58
6.2.3 Discussion of Findings . . . . . . . . . . . . . . . . . . . . . 59
6.3 JP-7 . . . . . . . . . . . . . . . . . . . . . . . . . . . . . . . . . . . 61
6.3.1 Facilities and Diagnostics . . . . . . . . . . . . . . . . . . . . 61
6.3.2 Fuel Measurements . . . . . . . . . . . . . . . . . . . . . . . 61
6.3.3 Discussion of Findings . . . . . . . . . . . . . . . . . . . . . 62
6.4 n-Dodecane . . . . . . . . . . . . . . . . . . . . . . . . . . . . . . . 63
6.4.1 Facilities and Diagnostics . . . . . . . . . . . . . . . . . . . . 63
6.4.2 Fuel Measurements . . . . . . . . . . . . . . . . . . . . . . . 64
6.4.3 Ethylene Measurements . . . . . . . . . . . . . . . . . . . . 65
6.4.4 Discussion of Findings . . . . . . . . . . . . . . . . . . . . . 66
6.5 Methylcyclohexane (MCH) . . . . . . . . . . . . . . . . . . . . . . . 72
6.5.1 Facilities and Diagnostics . . . . . . . . . . . . . . . . . . . . 72
ix

6.5.2 Fuel Measurements . . . . . . . . . . . . . . . . . . . . . . . 72
6.5.3 Ethylene Measurements . . . . . . . . . . . . . . . . . . . . 73
6.5.4 Discussion of Findings . . . . . . . . . . . . . . . . . . . . . 74
6.6 2,2,4,4,6,8,8-Heptamethylnonane (iso-Cetane) . . . . . . . . . . . . 77
6.6.1 Facilities and Diagnostics . . . . . . . . . . . . . . . . . . . . 77
6.6.2 Fuel Measurements . . . . . . . . . . . . . . . . . . . . . . . 77
6.6.3 Ethylene Measurements . . . . . . . . . . . . . . . . . . . . 78
6.6.4 Discussion of Findings . . . . . . . . . . . . . . . . . . . . . 78
6.7 Summary . . . . . . . . . . . . . . . . . . . . . . . . . . . . . . . . 82
7 Shock Experiments with Fuel Additives 86
7.1 1,2,3,4-Tetrahydroquinoline (THQ) . . . . . . . . . . . . . . . . . . 86
7.2 Benzyl Alcohol (BzOH) . . . . . . . . . . . . . . . . . . . . . . . . . 89
7.3 Summary . . . . . . . . . . . . . . . . . . . . . . . . . . . . . . . . 91
8 Formulation of an RP-1 Pyrolysis Surrogate 92
8.1 Compound Class . . . . . . . . . . . . . . . . . . . . . . . . . . . . 93
8.2 Overall Fuel Decomposition Rate . . . . . . . . . . . . . . . . . . . 95
8.3 Ethylene Yield . . . . . . . . . . . . . . . . . . . . . . . . . . . . . 96
8.4 Determination of Surrogate Component Mole Fractions . . . . . . . 96
8.5 Mechanism Predictions . . . . . . . . . . . . . . . . . . . . . . . . . 100
9 Summary and Future Work 103
9.1 Summary . . . . . . . . . . . . . . . . . . . . . . . . . . . . . . . . 103
9.2 Future Work . . . . . . . . . . . . . . . . . . . . . . . . . . . . . . . 104
A Fuel Time History Correction 107
A.1 Overall Fuel Decomposition Rate . . . . . . . . . . . . . . . . . . . 109
A.2 Fuel Mole Fraction . . . . . . . . . . . . . . . . . . . . . . . . . . . 110
A.3 Comparison of Simple Model with Detailed Mechanism Method . . 112
B Shock Data 115
C Supercritical Fluid vs. Gas-Phase Kinetics 126
Bibliography 129
x

List of Tables
2.1 Multi-component RP-1 surrogate #1 . . . . . . . . . . . . . . . . . 6
2.2 Multi-component RP-1 surrogate #2 . . . . . . . . . . . . . . . . . 6
2.3 Multi-component surrogates for RP-1 and RP-2 . . . . . . . . . . . 7
4.1 7-Coe"cient NASA polynomials for RP-1 . . . . . . . . . . . . . . . 31
4.2 7-Coe"cient NASA polynomials for THQ . . . . . . . . . . . . . . . 32
4.3 7-Coe"cient NASA polynomials for n-Dodecane . . . . . . . . . . . 33
4.4 7-Coe"cient NASA polynomials for MCH . . . . . . . . . . . . . . 33
4.5 7-Coe"cient NASA polynomials for iso-Cetane . . . . . . . . . . . . 33
5.1 Absorption Cross Section Fits for Fuels at 3.39 µm . . . . . . . . . 47
6.1 Carbon accounting during RP-1 decomposition (2 ms) . . . . . . . . 57
6.2 Chemical kinetic mechanisms describing dodecane chemistry . . . . 68
6.3 Carbon accounting during n-dodecane decomposition (2 ms) . . . . 70
6.4 Chemical kinetic mechanisms describing MCH chemistry . . . . . . 74
6.5 Carbon accounting during MCH decomposition (2 ms) . . . . . . . 76
6.6 Product distribution during iso-cetane decomposition assuming car-
bon conversion to only these three products (2 ms) . . . . . . . . . 81
6.7 Activation Energies for Fuel Decomposition . . . . . . . . . . . . . 84
8.1 Average RP-1/RP-2 Class Composition . . . . . . . . . . . . . . . . 93
8.2 Best-fit polynomials to measured overall fuel decomposition rates
and ethylene yields (in Figs. 8.1 and 8.2) . . . . . . . . . . . . . . . 97
xi

List of Figures
2.1 Comparison of historic data with data from the current study . . . 10
2.2 Historic decomposition rates for all fuels . . . . . . . . . . . . . . . 11
3.1 Example fuel and ethylene absorption features . . . . . . . . . . . . 14
3.2 Ethylene cross sections at three wavelengths . . . . . . . . . . . . . 15
3.3 Sample data for an RP-2 shock in the AST . . . . . . . . . . . . . . 16
3.4 Illustration of the e!ects of interfering species on ethylene yield dur-
ing RP-1 decomposition . . . . . . . . . . . . . . . . . . . . . . . . 19
4.1 AST Setup . . . . . . . . . . . . . . . . . . . . . . . . . . . . . . . . 24
4.2 HPST mixing tank evaporation checks . . . . . . . . . . . . . . . . 26
4.3 HPST laser absorption experimental setup . . . . . . . . . . . . . . 28
4.4 Comparison of historic data with the RP-1 specific heat capacity
calculated from the new NASA polynomial . . . . . . . . . . . . . . 31
5.1 Absorption cross sections of n-dodecane at the HeNe wavelength . . 36
5.2 Absorption cross sections of RP-1 measured by FTIR . . . . . . . . 37
5.3 Absorption cross sections of RP-1 at the HeNe wavelength . . . . . 37
5.4 Absorption cross sections of RP-2 measured by FTIR . . . . . . . . 38
5.5 Absorption cross sections of RP-2 at the HeNe wavelength . . . . . 39
5.6 Absorption cross sections of JP-7 measured by FTIR . . . . . . . . 39
5.7 Absorption cross sections of JP-7 at the HeNe wavelength . . . . . 40
5.8 Absorption cross sections of JP-8 measured by FTIR . . . . . . . . 41
5.9 Absorption cross sections of THQ measured by FTIR . . . . . . . . 42
5.10 Absorption cross sections of THQ at the HeNe wavelength . . . . . 42
5.11 Absorption cross sections of MCH at the HeNe wavelength . . . . . 43
5.12 Absorption cross sections of iso-cetane at the HeNe wavelength . . . 44
xii

5.13 iso-Cetane absorption cross section at the P14 and P28 wavelengths 44
5.14 Low-temperature cross sections for ethylene and interfering species . 45
5.15 Absorption cross sections for ethylene, propene, and 1-butene at
P14 and P28 . . . . . . . . . . . . . . . . . . . . . . . . . . . . . . . 46
5.16 Absorption cross sections for ethylene, propene, and 1-butene at
3.39 µm . . . . . . . . . . . . . . . . . . . . . . . . . . . . . . . . . 47
5.17 Comparison of absorption cross sections for all fuels studied . . . . 49
6.1 RP-1 pyrolysis in the AST . . . . . . . . . . . . . . . . . . . . . . . 51
6.2 RP-1 pyrolysis in the HPST . . . . . . . . . . . . . . . . . . . . . . 51
6.3 Measured RP-1 fuel time histories . . . . . . . . . . . . . . . . . . . 52
6.4 Comparison of overall fuel decomposition rates for low- and high-
pressure RP-1 experiments . . . . . . . . . . . . . . . . . . . . . . . 53
6.5 Measured ethylene time histories during RP-1 decomposition . . . . 54
6.6 Carbon accounting during RP-1 decomposition . . . . . . . . . . . . 56
6.7 RP-2 pyrolysis in the AST . . . . . . . . . . . . . . . . . . . . . . . 58
6.8 RP-2 decomposition . . . . . . . . . . . . . . . . . . . . . . . . . . 59
6.9 Overall fuel decomposition rates for RP-1 and RP-2 . . . . . . . . . 60
6.10 JP-7 pyrolysis in the AST . . . . . . . . . . . . . . . . . . . . . . . 61
6.11 JP-7 decomposition . . . . . . . . . . . . . . . . . . . . . . . . . . . 62
6.12 Overall fuel decomposition rates for JP-7 and RP-1 . . . . . . . . . 62
6.13 Dodecane pyrolysis sample data . . . . . . . . . . . . . . . . . . . . 63
6.14 Dodecane fuel time histories . . . . . . . . . . . . . . . . . . . . . . 64
6.15 Comparison of overall fuel decomposition rates for low- and high-
pressure n-dodecane experiments . . . . . . . . . . . . . . . . . . . 65
6.16 Ethylene time histories during dodecane decomposition . . . . . . . 66
6.17 Overall fuel decomposition rates for n-dodecane . . . . . . . . . . . 67
6.18 Dodecane decomposition, comparison with kinetic mechanisms . . . 68
6.19 Carbon accounting during n-dodecane decomposition . . . . . . . . 69
6.20 Comparison of model-predicted and measured absorbance at 3.39 µm 71
6.21 MCH pyrolysis sample data . . . . . . . . . . . . . . . . . . . . . . 72
6.22 MCH time histories and overall fuel decomposition rates . . . . . . 73
6.23 MCH ethylene time histories and yields . . . . . . . . . . . . . . . . 74
6.24 Comparison of measured and modeled MCH decomposition . . . . . 75
xiii

6.25 Carbon accounting during MCH decomposition . . . . . . . . . . . 76
6.26 iso-Cetane pyrolysis sample data . . . . . . . . . . . . . . . . . . . . 77
6.27 iso-Cetane time histories and overall fuel decomposition rates . . . . 78
6.28 Range of possible solutions for product mole fractions during iso-
cetane decomposition . . . . . . . . . . . . . . . . . . . . . . . . . . 80
6.29 Comparison of measured and modeled iso-cetane decomposition . . 81
6.30 Overall fuel decomposition rates for RP-1, RP-2, JP-7, n-dodecane,
MCH, and iso-cetane . . . . . . . . . . . . . . . . . . . . . . . . . . 82
6.31 Summary of overall fuel decomposition rates for various kerosenes . 83
6.32 Overall fuel decomposition rates and peak ethylene yields for RP-1,
n-dodecane, MCH, and ico-cetane . . . . . . . . . . . . . . . . . . . 85
7.1 Molecular structure of THQ . . . . . . . . . . . . . . . . . . . . . . 86
7.2 Neat THQ decomposition fuel time histories and overall fuel decom-
position rates . . . . . . . . . . . . . . . . . . . . . . . . . . . . . . 87
7.3 Measured overall fuel decomposition rates for THQ, dodecane, and
RP-1 . . . . . . . . . . . . . . . . . . . . . . . . . . . . . . . . . . . 87
7.4 Decomposition of a 5 vol% THQ in RP-1 mixture . . . . . . . . . . 88
7.5 E!ect of THQ on the overall fuel decomposition rates of RP-1 and
dodecane . . . . . . . . . . . . . . . . . . . . . . . . . . . . . . . . . 89
7.6 Comparison of RP-1 fuel time histories with and without 5 vol%
BzOH . . . . . . . . . . . . . . . . . . . . . . . . . . . . . . . . . . 90
7.7 RP-1 overall fuel decomposition rates with and without 5 vol% ben-
zyl alcohol . . . . . . . . . . . . . . . . . . . . . . . . . . . . . . . . 90
8.1 Measured overall fuel decomposition rates of RP-1 and possible sur-
rogate components . . . . . . . . . . . . . . . . . . . . . . . . . . . 95
8.2 Ethylene yields during decomposition of RP-1 and three possible
surrogate components . . . . . . . . . . . . . . . . . . . . . . . . . . 96
8.3 Composition of an RP-1 decomposition surrogate as a function of
temperature . . . . . . . . . . . . . . . . . . . . . . . . . . . . . . . 98
8.4 Comparison of measured RP-1 overall fuel decomposition rates with
the linear combination of the measured overall fuel decomposition
rates from the surrogate components . . . . . . . . . . . . . . . . . 99
xiv

8.5 Comparison of measured RP-1 ethylene yields with the linear com-
bination of the measured overall ethylene yields from the surrogate
components . . . . . . . . . . . . . . . . . . . . . . . . . . . . . . . 99
8.6 Measured and predicted absorbance at 3.39 µm . . . . . . . . . . . 100
8.7 Comparison of measured and modeled ethylene time history and
yields during RP-1 decomposition . . . . . . . . . . . . . . . . . . . 101
A.1 Summary of the detailed kinetic mechanism interference correction
method . . . . . . . . . . . . . . . . . . . . . . . . . . . . . . . . . 112
A.2 Comparison of fuel mole fractions determined from three di!erent
methods . . . . . . . . . . . . . . . . . . . . . . . . . . . . . . . . . 113
B.1 RP-1 shock log . . . . . . . . . . . . . . . . . . . . . . . . . . . . . 116
B.2 RP-2 shock log . . . . . . . . . . . . . . . . . . . . . . . . . . . . . 117
B.3 JP-7 shock log . . . . . . . . . . . . . . . . . . . . . . . . . . . . . . 118
B.4 Dodecane shock log . . . . . . . . . . . . . . . . . . . . . . . . . . . 119
B.5 MCH shock log . . . . . . . . . . . . . . . . . . . . . . . . . . . . . 120
B.6 iso-Cetane shock log . . . . . . . . . . . . . . . . . . . . . . . . . . 121
B.7 THQ shock log . . . . . . . . . . . . . . . . . . . . . . . . . . . . . 122
B.8 Dodecane/THQ shock log . . . . . . . . . . . . . . . . . . . . . . . 123
B.9 RP-1/THQ shock log . . . . . . . . . . . . . . . . . . . . . . . . . . 124
B.10 RP-1/BzOH shock log . . . . . . . . . . . . . . . . . . . . . . . . . 125
xv

xvi

Chapter 1
Introduction
1.1 Motivation
Rocket fuel pyrolysis is of current scientific interest for two main reasons. First,
pyrolysis is an initial, necessary step of combustion, so in order to accurately
describe the oxidation of a fuel, its pyrolytic behavior must be well-characterized.
The second reason to study the pyrolysis of rocket fuel stems from its use as a
coolant. The fuels community has shown interest in studies of fuel pyrolysis at a
wide variety of conditions in order to better understand the entire process of coke
formation.
A recent e!ort to more fully characterize the causes of coking (the formation
of solid carbonaceous deposits) in the cooling systems of high-speed aircraft and
rockets has led to increased interest in the pyrolytic behavior of fuels. Since in these
vehicles the fuel is often utilized as the coolant, the chemistry of this coke formation
process, from the initial breakdown of the fuel to the formation of coke precursors
and eventually coke itself, is of vital interest. Although the fuel is supercritical
as it passes through the cooling channels and the current study deals with gas-
phase chemistry, e!orts to understand decomposition chemistry over a wide range
of conditions will lead to a more generalized understanding of the fuel’s chemical
behavior, which will assist in the study of coke formation. Indeed, Gokulakrishnan
et al. have based their studies of the supercritical decomposition of large n-alkanes
on existing mechanisms for describing its gas-phase decomposition [1]. A cursory
literature review concerning the relationship between gas-phase and supercritical
fuel chemistry is given in Appendix C.
1

Although three main mechanisms of coke formation have been described in the
literature: oxidative, catalytic, and pyrolytic [2–6], here, the focus is on under-
standing the initial kinetic processes that lead to the formation of pyrolytic coke.
This coking mechanism is predominant at temperatures above 825 K and occurs
when the fuel is heated enough to decompose into reactive fuel radicals, leading
to the eventual formation of coke [4]. Fuel additives have long been utilized as a
method for slightly altering fuel chemistry, and the current study is no exception.
Low-temperature studies of additives intended to slow decomposition and thus de-
lay the onset of coke formation have brought to light a few viable options. Here,
preliminary studies of the e!ects of two of these additives were performed to more
fully understand their methods of slowing the fuel’s decomposition.
To study the chemistry of the fuels of interest, surrogate fuels are often em-
ployed as alternatives to a complex fuel composed of hundreds of components.
Surrogates have long been a method for assisting in the study of a complex multi-
component fuel by acting as a similar, but simpler fuel. In many instances, conclu-
sions formed based on the study of a surrogate can be extended to the fuel itself.
They also provide modelers (both kinetic and CFD) with a method of representing,
during simulation, a fuel that may have hundreds of components. Computing the
conditions for a reacting flow or running a kinetic simulation for the oxidation or
pyrolysis of every component of a real distilled fuel is beyond the current state-
of-the-art. For such studies, it is important to know not only how quickly a fuel
breaks apart, but also what products are formed during this process. Once these
kinetic parameters have been determined for a fuel, a suitable surrogate mixture
can be formulated to mimic these parameters. However, despite all that it o!ers
to both experimentalist and computationalist, a surrogate is quite limited in the
number of real-fuel properties that it can match. The user must be aware of the
surrogate’s intended purpose in order to utilize it correctly. A surrogate is nor-
mally formulated to match specific fuel targets; a surrogate designed to simulate
the chemical kinetic behavior of high-temperature fuel decomposition or pyrolysis
may need to match fuel decomposition rates and decomposition products.
This is the case for RP-1, which is the standard rocket kerosene in the United
States, and a fuel frequently utilized in regeneratively-cooled liquid rocket engines.
Representative components from the general chemical groups found in RP-1 are
expected to be needed in the final surrogate mixture, if the decomposition rates
2

and products of the surrogate mixture are to match those of RP-1. A major
fraction of the fuel is represented by including components from the normal alkane,
cyclo-alkane, and branched alkane chemical groups [7]. Archetypal examples of
these three groups are n-dodecane, methylcyclohexane (MCH), and 2,2,4,4,6,8,8-
heptamethylnonane (iso-cetane).
The need for a fuel concentration measurement is obvious. However, the addi-
tion of a diagnostic to measure ethylene concentration is a vital step toward un-
derstanding the process by which large hydrocarbon fuels such as RP-1 and RP-2
break down into their product species. Eventually, simultaneous measurements of
multiple primary products such as ethylene, propene, 1-butene, iso-butene, and
1,3-butadiene will give an even deeper understanding of the chemistry that occurs
during decomposition, but because ethylene is the predominant product in decom-
position of these fuels, it is the ideal species with which to begin. With the ethylene
diagnostic, we gain critical information about the total amount of ethylene formed
for a given amount of the parent fuel. For the case of dodecane, which is not a
mixture of hydrocarbons, this “ethylene yield” can be thought of as the number
of ethylene molecules formed from each molecule of dodecane. The ethylene yield
can also be calculated for hydrocarbon mixtures, but in this case it is simpler to
think of the yield as a ratio of the final ethylene mole fraction to the initial fuel
mole fraction or as a form of the carbon conversion e"ciency.
A secondary reason for studying ethylene is to assess its possible role in coke
formation. In 1992, Nohara and Sakai proposed a model for hydrocarbon ring
growth in alkane pyrolysis in which butadiene and alkenes (including ethylene)
bonded to form initial hydrocarbon rings that then progressed to form much larger
molecules and eventually coke [3]. In 1998, Wickham, et al. discussed the impor-
tance of ethylene in the coke formation process, experimentally measured ethylene
concentration, and found a correlation between the amount of ethylene and ring
formation [4]. Edwards discusses ethylene in his 2006 paper, indicating that al-
though it does not have a high propensity to form coke (as compared to other
alkenes), its high mole fraction in a system may still mean that it is a major coke-
forming source [8]. The measurement of ethylene throughout the decomposition
process is therefore of vital interest in the chemistry of coke formation.
3
1.2 Objectives
This dissertation describes experimental studies intended to achieve six main ob-
jectives. The end goal and first objective is the formulation of an RP-1 pyrolysis
surrogate. In order to achieve this, it is necessary to employ measurable kinetic
parameters as targets for the selection of suitable components. The kinetic pa-
rameters selected were overall fuel decomposition rate and ethylene yield. To this
end, the second objective is the measurement of overall fuel decomposition rates
for RP-1 and its possible surrogate components and the third is the measure-
ment of ethylene yields for the same. The fourth objective is the measurement
of fuel and ethylene time histories for RP-1 and its possible surrogate compo-
nents. Time histories allow closer comparison with model predictions, and are
thus a valuable part of this study. In order to compare RP-1 decomposition to
that of similar fuels, the fifth objective is the measurement of fuel time histories
and overall fuel decomposition rates for the similar kerosenes, RP-2 and JP-7.
The sixth, and final, objective is to investigate the e!ects of two possible fuel
additives, 1,2,3,4-tetrahydroquinoline (THQ) and benzyl alcohol (BzOH), on the
decomposition chemistry of RP-1 and n-dodecane.
1.3 Organization
As a background for the work to be presented here, Chapter 2 contains a literature
review of the previous research into each fuel studied. Chapters 3 through 5 give the
required spectroscopic theory, experimental setup description, and the results of
the absorption cross section experiments that were required to enable quantitative
measurements of fuel and ethylene mole fractions. Results for the studies of the
fuels themselves are presented in Chapter 6. These fuels are discussed one by
one, with the simultaneous presentation of experimental data and mechanism-
predicted results. Chapter 7 includes the discussion of fuel additives and their
e!ects on RP-1 and n-dodecane overall fuel decomposition rates. Formulation of
the RP-1 pyrolysis surrogate is covered in Chapter 8, along with comparisons to a
newly-compiled mechanism containing all three components of this surrogate. In
Chapter 9, the work is summarized and future needs suggested.
4

Chapter 2
Literature Review
A need exists to characterize the high-temperature decomposition behavior of both
rocket fuels and the fuel surrogates used to simulate the kinetic behavior of these
fuels. Numerous studies have been completed below approximately 1100 K (see
Fig. 2.1), but this study seeks to push the high-temperature limits by adding
experimental data up to temperatures of approximately 1500 K.
2.1 Kerosenes
Overall fuel decomposition rates for RP-fuels and other kerosenes have often ap-
peared in the literature. In 1984, Van Camp et al. reported rate coe"cients for
steam-diluted kerosene subjected to temperatures of 930 to 1100 K while flowing
through a 1 cm diameter, 22 m long cell encased in a furnace. In order to re-
port a rate for this mixture of hydrocarbons, the kerosene was considered a single
“pseudo-component” and a GC-MS analysis of the kerosene sample was included
in order to define its components [9]. Dworzanski et al. performed studies on
pentadecane and JP-7 at atmospheric pressure and reported Arrhenius plots con-
taining rate constants for both in the 800 to 1100 K temperature range [10]. The
National Institute of Standards and Technology (NIST) has recently published de-
composition rate constants for Jet A [11], RP-1 [12, 13], and RP-2 [13, 14] from
experiments carried out in ampule reactors at pressures near 34.5 MPa (340 atm)
and temperatures from 648 to 773 K.
There is also a historical precedence for simulating the behavior of kerosene-
type fuels with surrogates. A great number of surrogates exist in the literature that
5
target the oxidation characteristics of kerosenes such as JP-8 and Jet-A [15–37],
however, few have been proposed to simulate the behavior of RP-1. Those that
exist are given in Tables 2.1 to 2.3.
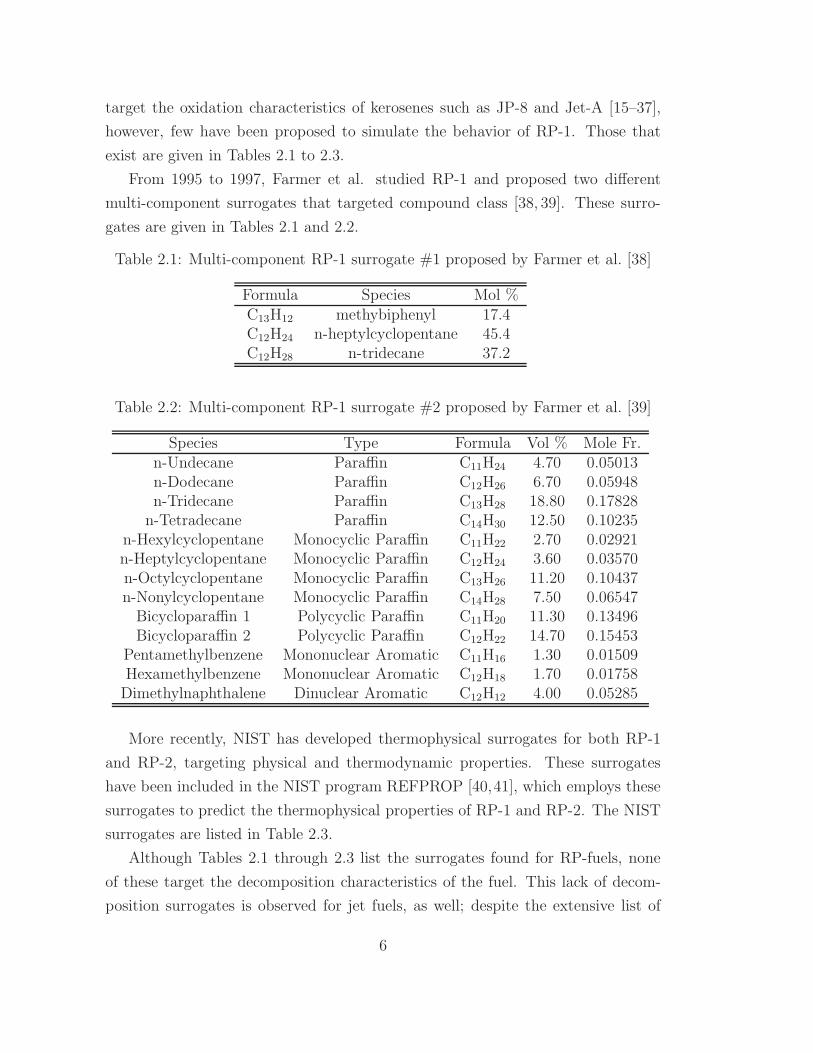
From 1995 to 1997, Farmer et al. studied RP-1 and proposed two di!erent
multi-component surrogates that targeted compound class [38, 39]. These surro-
gates are given in Tables 2.1 and 2.2.
Table 2.1: Multi-component RP-1 surrogate #1 proposed by Farmer et al. [38]
Formula Species Mol %C13H12 methybiphenyl 17.4C12H24 n-heptylcyclopentane 45.4C12H28 n-tridecane 37.2
Table 2.2: Multi-component RP-1 surrogate #2 proposed by Farmer et al. [39]
Species Type Formula Vol % Mole Fr.n-Undecane Para"n C11H24 4.70 0.05013n-Dodecane Para"n C12H26 6.70 0.05948n-Tridecane Para"n C13H28 18.80 0.17828
n-Tetradecane Para"n C14H30 12.50 0.10235n-Hexylcyclopentane Monocyclic Para"n C11H22 2.70 0.02921n-Heptylcyclopentane Monocyclic Para"n C12H24 3.60 0.03570n-Octylcyclopentane Monocyclic Para"n C13H26 11.20 0.10437n-Nonylcyclopentane Monocyclic Para"n C14H28 7.50 0.06547Bicyclopara"n 1 Polycyclic Para"n C11H20 11.30 0.13496Bicyclopara"n 2 Polycyclic Para"n C12H22 14.70 0.15453
Pentamethylbenzene Mononuclear Aromatic C11H16 1.30 0.01509Hexamethylbenzene Mononuclear Aromatic C12H18 1.70 0.01758Dimethylnaphthalene Dinuclear Aromatic C12H12 4.00 0.05285
More recently, NIST has developed thermophysical surrogates for both RP-1
and RP-2, targeting physical and thermodynamic properties. These surrogates
have been included in the NIST program REFPROP [40,41], which employs these
surrogates to predict the thermophysical properties of RP-1 and RP-2. The NIST
surrogates are listed in Table 2.3.
Although Tables 2.1 through 2.3 list the surrogates found for RP-fuels, none
of these target the decomposition characteristics of the fuel. This lack of decom-
position surrogates is observed for jet fuels, as well; despite the extensive list of
6

Table 2.3: Multi-component surrogates for RP-1 and RP-2 from Huber et al. [40]
FluidComposition, Mole Fraction
RP-1 Surrogate RP-2 Surrogate!-methyldecalin 0.354 0.3545-methylnonane 0.150 0.084
2,4-dimethylnonane 0.000 0.071n-dodecane 0.183 0.158
heptylcyclohexane 0.313 0.333
oxidation surrogates for JP-8 and Jet-A, very few decomposition surrogates were
found for these fuels [24, 28, 42].
2.2 n-Dodecane
Overall fuel decomposition rates were identified as a useful means of observing
the decomposition of fuels such as n-dodecane as early as 1939 when Tilicheev
published “cracking velocity constants” for n-alkanes from C5 to C32 at 150 atm
and 673 to 848 K [43]. Since that time, n-dodecane decomposition rates have been
measured under a variety of conditions. In 1945, Greensfelder and Voge published
a “first-order thermal velocity constant” for the thermal cracking of n-dodecane as
it passed through a continuous flow reactor at 773 K and atmospheric pressure [44].
In a following publication, Voge and Good reported similar measurements for n-
hexadecane, listed the currently existing thermal cracking rates for n-alkanes from
C4 to C16, and proposed an empirical correlation between decomposition rate and
carbon number [45]. In 1986, Zhou and Crynes reported pseudo-first-order rate
constants at 623 and 673 K for the decomposition of n-dodecane in a batch reactor
pressurized to 9.2 MPa (91 atm) with nitrogen or hydrogen [46]. A continuation
of this work resulted in the publication of decomposition rates for n-alkanes and
mixtures of n-alkanes from C9 to C22 in a flowing tube reactor at atmospheric
pressure and temperatures from 623 to 893 K [47]. In 1996, Yoon et al. completed
micro-reactor studies of n-dodecane decomposition rates in nitrogen at pressures
of 0.69 to 1 MPa (6.8 to 9.9 atm) and temperatures of 673 to 723 K [42, 48]. A
subsequent publication reported additional n-dodecane decomposition rates [49].
In 2007, shock tube studies of high-temperature (1100 to 1300 K) decomposition
7

of n-dodecane were completed in the 0.3 to 6 atm pressure range [50]. In 2001,
Watanabe et al. gave a thorough overview of rate constants for a wide range of
n-alkanes and proposed a model for estimating these rates [51]. Work by Dahm
et al. in 2004 in a plug flow reactor at atmospheric pressure and 950 to 1050 K
reported the mole fraction of ethylene during n-dodecane decomposition at 1050
K [52]. Similar work was conducted by Herbinet et al. in 2007 in which time
histories of n-dodecane and various product species were reported for a jet-stirred
reactor at 106 kPa (1.0 atm) in the 793 to 1073 K temperature range [53]. The
current study adds to the understanding of n-dodecane chemistry by extending
experimental data to higher pressures and temperatures.
2.3 Methylcyclohexane (MCH)
MCH decomposition was studied as early as 1987 when Kralikova et al. performed
studies in a stainless steel tubular flow reactor at 0.1 MPa and temperatures from
773 to 1093 K. They reported both decomposition rates and time histories of fuel
and predominant products [54]. In 1988, Taylor and Rubey published gas-phase
thermal decomposition curves for MCH at atmospheric pressure and temperatures
from 300 to 1050 K [55]. Brown and King employed a reactor designed for very low
pressure pyrolysis to study MCH decomposition from 861 to 1218 K and published
decomposition rates in the fall-o! regime in 1989 [56]. Turbulent flow reactor
studies were performed by Zeppieri et al. in 1997 for MCH pyrolysis and oxidation.
Decomposition rates were reported at four temperatures between 1058 and 1192
K and at one atmosphere, while fuel and ethylene time histories were reported
only at 1155 K [57]. In 2005, studies of MCH decomposition and the resulting
products were carried out by McEnally and Pfe!erle in nonpremixed methane/air
flames at atmospheric pressure. The height above the burner was set such that
the temperatures studied were near 1400 K [58]. In 2006, Orme et al. completed a
model for the prediction of species time histories and ignition delay times during
MCH pyrolysis and oxidation [59]. This model matched the experimental data of
Zeppieri et al. [57] relatively well.
8

2.4 2,2,4,4,6,8,8-Heptamethylnonane
(iso-Cetane)
An early study (1966) of the pyrolysis of iso-cetane [60] in a heated glass chamber
at 333 K and atmospheric pressure identified some predominant products (mainly
iso-butene). Interest in iso-cetane has increased in recent years due to its possible
use in diesel surrogates, but most current kinetic studies focus on its oxidation.
One such study, completed by Oehlschlaeger et al. in 2009, measured ignition delay
times in a heated shock tube at pressures from 8 to 47 atm and in the temperature
range 879 to 1347 K which led to the formation of an iso-cetane kinetic mechanism
[61]. In 2004, Agosta et al. studied the oxidation of iso-cetane/dodecane mixtures
in a pressurized flow reactor at 8 atm over the temperature range 600 to 900 K and
developed a mechanism that included iso-cetane chemistry [62]. In 2009, Dagaut
and Hadj-Ali published a jet-stirred reactor study on the oxidation of iso-cetane
at 10 atm from 770 to 1070 K [63]. A study of the sooting tendencies of pure iso-
cetane and iso-cetane mixtures was performed in 2009 by Mathieu et al. at 10.8 to
18.5 atm and from 1465 to 2675 K. This study included pyrolysis conditions, but
did not investigate decomposition; rather it reported soot volume fractions, soot
induction delay times, and soot yields [64].
2.5 Additives
Studies of various additives intended to alter the decomposition and deposition
rates of fuels have also been conducted and reported in the literature [5,14,42,48,
65–70]. Studies such as those completed by Wickham et al. [65] and Heneghan et
al. [70] showed promise for some proprietary additives which were not identified.
In 1996, however, Yoon et al. compared the performance of twenty-two identified
additives by thermally stressing samples of each mixed with n-dodecane (utilized
here as a jet-fuel surrogate) in micro-reactors and measuring the resulting products
with a gas chromotograph [42]. Of the additives tested, 1,2,3,4-tetrahydroquinoline
(THQ) was shown to be the most e!ective at decreasing pyrolytic deposits. Benzyl
alcohol (BzOH), was also found to be e!ective at lowering the decomposition rate
of n-dodecane for temperatures less than 700 K [48].
9

2.6 Summary of Historic Decomposition
Rates
Many of the studies listed above reported fuel decomposition rates; included in
Fig. 2.1 are historic decomposition rates for all fuels considered in the current
work. The large scatter in both prior work and the current work is simply due to
the fact that decomposition rates for n-dodecane, MCH, iso-cetane, THQ, RP-1,
RP-2, JP-7, and various other kerosenes are included in the figure. Figure 2.1
is intended only as an overview, showing the lack of experimental data at high
temperatures prior to this work and the agreement in the general trend of the
current work with previous data. Figure 2.2 shows a more detailed summary of
prior work, and di!erentiates between fuels.
10-8
10-6
10-4
10-2
100
102
104
106
Ove
rall
Fuel
Dec
ompo
sitio
n R
ate
[1/s
]
1.81.61.41.21.00.80.6
1000/T [1/K]
Data from Current Study Previous Studies
1250 K 625 K
Figure 2.1: Comparison of historic data with data from the current study, currentwork expands to higher temperatures.
10

10-7 10-5
10-3 10-1 101
103 105
k [1
/s]
1.61.41.21.00.8
1000/T [1/K]
1250 K 625 K
Figure 2.2: Historic decomposition rates for all fuels. Red symbols are kerosenes,green symbols are MCH, blue symbols are dodecane, black symbols are dodecanewith additives. ! RP-1 [12,13], # RP-2 [13], " Jet-A [11], - JP-7 [10], # Kerosene[9], $ MCH [54], % n-dodecane [50], • n-dodecane [48], & n-dodecane [47], 'n-dodecane [45], ( n-dodecane [46], "# n-dodecane [49], ) n-dodecane [43], ! n-dodecane [53], " n-dodecane [71], # 10% THQ/n-dodecane [48], $ 10% BzOH/n-dodecane [48].
11
Chapter 3
Theoretical Background
3.1 Spectroscopic and Kinetic Theory
To determine time-histories and decomposition rates from shock tube/infrared
laser absorption measurements, two key tools are employed: Beer’s law, given as
Eq. (3.1), and the assumption of pseudo-first-order reactions. Beer’s law relates
the fractional transmission of monochromatic light through an absorbing medium,
(I/Io)!, to the number density of absorbers.
(I/Io)! = exp(%$!NL) (3.1)
N can be expressed as N = XfuelPtotal/RT , which enables the relation of ab-
sorbance, !! & % ln(I/Io)!, to fuel mole fraction:
Xfuel(t) = !!RT/$!PtotalL (3.2)
Each fuel has a relatively unique absorption band structure. The cross section at
wavelength %, $!, in m2/mol, is a measure of the absorption strength of the fuel
vapor. It is a function of wavelength and of the temperature of the fuel vapor, but
for the high molecular weight fuels in this study it is e!ectively independent of
pressure. Because the intensity is also attenuated by scattering due to any aerosol
present, as in the Aerosol Shock Tube (AST), a diagnostic utilized specifically for
indicating the presence of aerosol was necessary to ensure complete evaporation
of the fuel so that Beer’s Law could be employed to determine the mole fraction
12
of the absorbing fuel vapor. This diagnostic will be discussed in more detail in
Chapter 4.
The second important tool required to determine the overall fuel decomposition
rate is the use of a pseudo-first-order kinetics model to describe the decomposition
reactions of these fuels. Pseudo-first-order reactions follow the form shown in Eq.
(3.3) where koverall is the rate of fuel removal for this decomposition reaction.
fuelkoverall%%%%' products (3.3)
Solving the equation describing pseudo-first-order kinetics, X(t) =
Xo exp(%koverallt), for the normalized time-varying mole fraction and equating to
Eq. (3.2) at time t and time zero gives Eq. (3.4).
Xfuel(t)
Xfuel(0)= exp(%koverallt) =
!(t)
!(0)(3.4)
Thus the measurements of overall fuel decomposition rate are actually independent
of the absorption cross section.
3.2 Selection of Laser Lines
As laid out in Chapter 1, all objectives for this work rely on the measurement of
either fuel or ethylene mole fractions. Therefore, diagnostics for both are impera-
tive to this work. The fuel diagnostic relies on the strong absorption band near 3.4
µm due to the C-H stretch vibration. Since all fuels studied here have many C-H
bonds, they all have strong absorption features near 3.4 µm. The mid-infrared
HeNe laser line at 3.39 µm (2947.909 cm!1) lies on the features of all of these
fuels. An example of the low-temperature RP-1 absorption feature with the HeNe
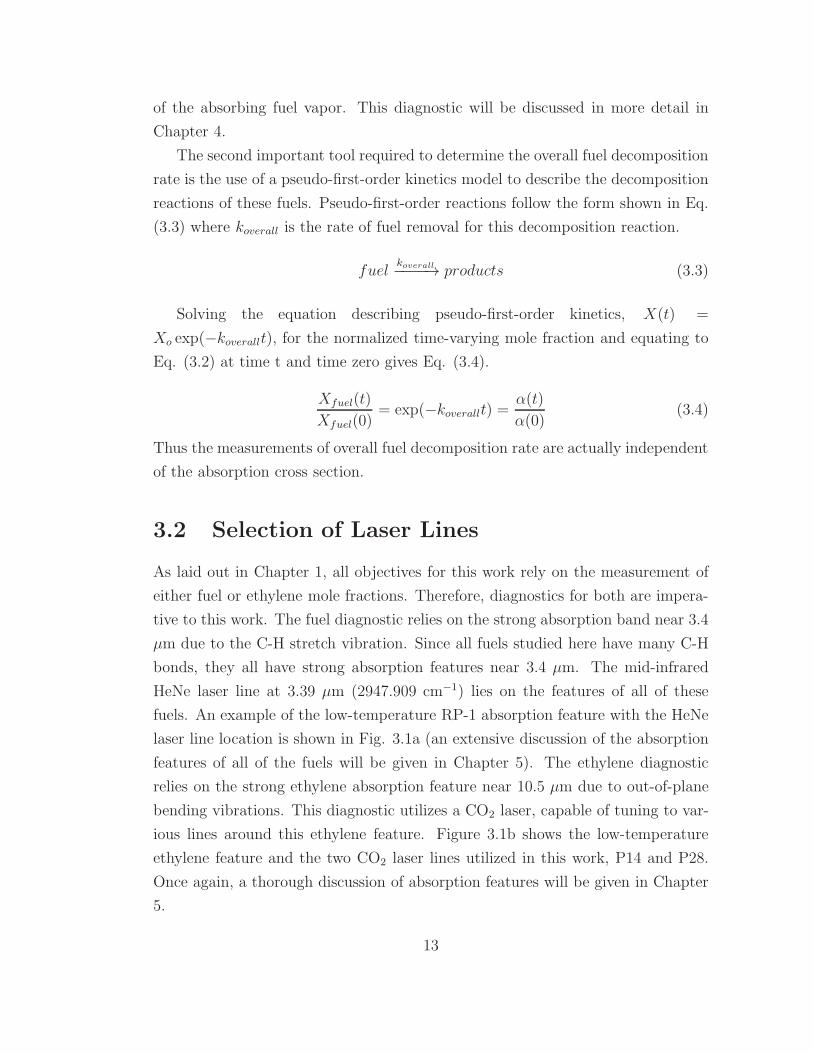
laser line location is shown in Fig. 3.1a (an extensive discussion of the absorption
features of all of the fuels will be given in Chapter 5). The ethylene diagnostic
relies on the strong ethylene absorption feature near 10.5 µm due to out-of-plane
bending vibrations. This diagnostic utilizes a CO2 laser, capable of tuning to var-
ious lines around this ethylene feature. Figure 3.1b shows the low-temperature
ethylene feature and the two CO2 laser lines utilized in this work, P14 and P28.
Once again, a thorough discussion of absorption features will be given in Chapter
5.
13
100
80
60
40
20
0Cro
ss S
ectio
n [m
2 /mol
]
3.603.503.403.30Wavelength [µm]
RP-1 FTIRP = 3.5 torrT = 448 K
(a)
100
80
60
40
20
0Cro
ss S
ectio
n [m
2 /mol
]
10.810.710.610.510.4Wavelength [µm]
P14
P28
Ethylene573 K1 atmFTIR
(b)
Figure 3.1: Location of a) the HeNe laser line on the RP-1 absorption feature andb) the CO2 laser lines on the ethylene absorption feature.
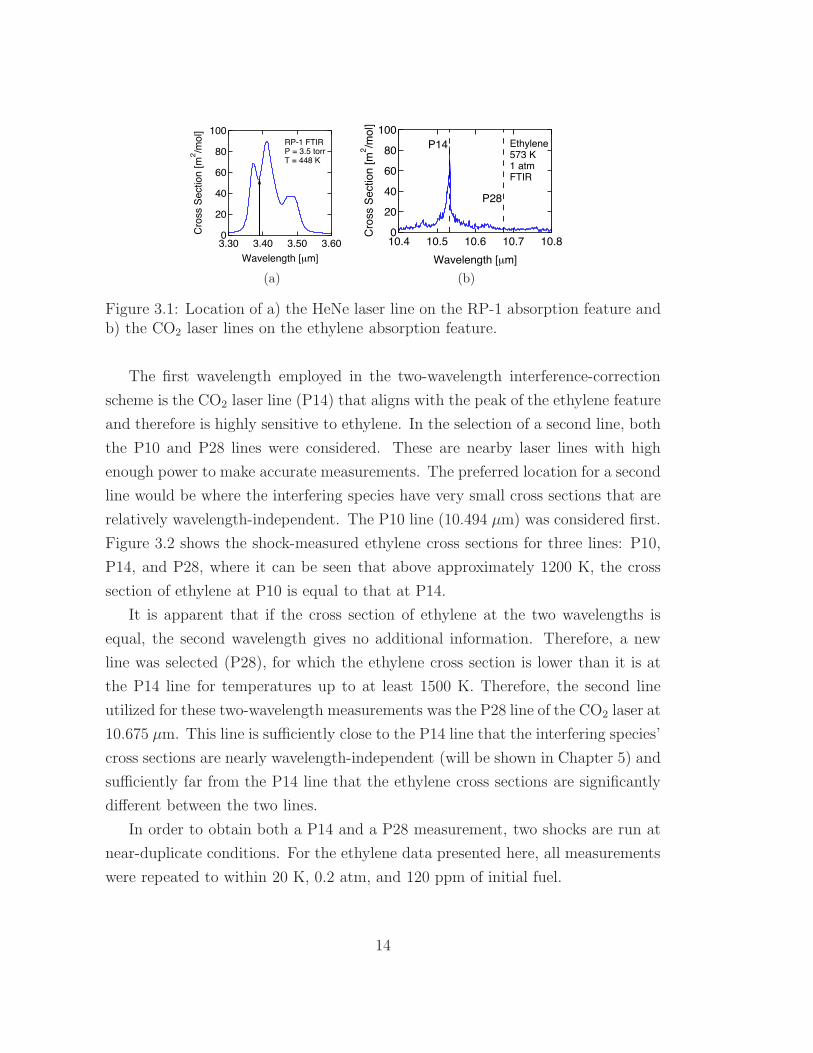
The first wavelength employed in the two-wavelength interference-correction
scheme is the CO2 laser line (P14) that aligns with the peak of the ethylene feature
and therefore is highly sensitive to ethylene. In the selection of a second line, both
the P10 and P28 lines were considered. These are nearby laser lines with high
enough power to make accurate measurements. The preferred location for a second
line would be where the interfering species have very small cross sections that are
relatively wavelength-independent. The P10 line (10.494 µm) was considered first.
Figure 3.2 shows the shock-measured ethylene cross sections for three lines: P10,
P14, and P28, where it can be seen that above approximately 1200 K, the cross
section of ethylene at P10 is equal to that at P14.
It is apparent that if the cross section of ethylene at the two wavelengths is
equal, the second wavelength gives no additional information. Therefore, a new
line was selected (P28), for which the ethylene cross section is lower than it is at
the P14 line for temperatures up to at least 1500 K. Therefore, the second line
utilized for these two-wavelength measurements was the P28 line of the CO2 laser at
10.675 µm. This line is su"ciently close to the P14 line that the interfering species’
cross sections are nearly wavelength-independent (will be shown in Chapter 5) and
su"ciently far from the P14 line that the ethylene cross sections are significantly
di!erent between the two lines.
In order to obtain both a P14 and a P28 measurement, two shocks are run at
near-duplicate conditions. For the ethylene data presented here, all measurements
were repeated to within 20 K, 0.2 atm, and 120 ppm of initial fuel.
14
1
2
46
10
2
4
Cro
ss S
ectio
n [m
2 /mol
]
200016001200800400Temperature [K]
P14 [Pilla 2011] P10 P28
Figure 3.2: Ethylene cross sections at three wavelengths. P14 data from [72].
3.3 Corrections for Interfering Species
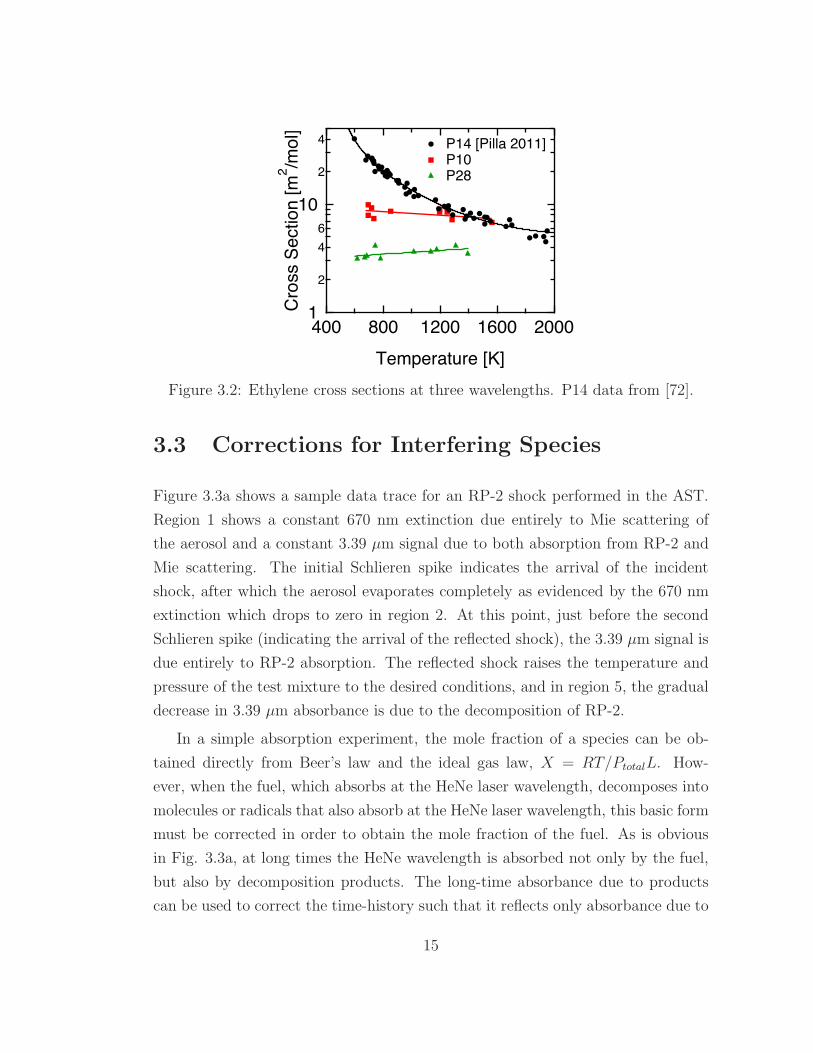
Figure 3.3a shows a sample data trace for an RP-2 shock performed in the AST.
Region 1 shows a constant 670 nm extinction due entirely to Mie scattering of
the aerosol and a constant 3.39 µm signal due to both absorption from RP-2 and
Mie scattering. The initial Schlieren spike indicates the arrival of the incident
shock, after which the aerosol evaporates completely as evidenced by the 670 nm
extinction which drops to zero in region 2. At this point, just before the second
Schlieren spike (indicating the arrival of the reflected shock), the 3.39 µm signal is
due entirely to RP-2 absorption. The reflected shock raises the temperature and
pressure of the test mixture to the desired conditions, and in region 5, the gradual
decrease in 3.39 µm absorbance is due to the decomposition of RP-2.
In a simple absorption experiment, the mole fraction of a species can be ob-
tained directly from Beer’s law and the ideal gas law, X = RT/PtotalL. How-
ever, when the fuel, which absorbs at the HeNe laser wavelength, decomposes into
molecules or radicals that also absorb at the HeNe laser wavelength, this basic form
must be corrected in order to obtain the mole fraction of the fuel. As is obvious
in Fig. 3.3a, at long times the HeNe wavelength is absorbed not only by the fuel,
but also by decomposition products. The long-time absorbance due to products
can be used to correct the time-history such that it reflects only absorbance due to
15

1.5
1.0
0.5
0.0
-ln(I/
I o)
3210-1Time [ms]
1 2 Region 5
670 nm
3.39 µm
Incident Shock
Reflected shock
fuel
prod
(a)
3.0x10⁻³
2.52.01.51.00.50.0
Fuel
Mol
e Fr
actio
n
3.02.01.00.0Time [ms](b)
-3
-2
-1
0
1
ln((
mea
s-pr
od)/(
fuel-
prod
))
1.51.00.50.0-0.5Time [ms](c)
Figure 3.3: a) Sample data for an RP-2 shock in the AST with 0.28% fuel concen-tration in argon: Vshock = 740 m/s, P1 = 0.29 atm, T1 = 297 K, P5 = 7.1 atm,T5 = 1215 K. Regions 1, 2, and 5 have been labeled. The red curve shows 670 nmextinction, due only to fuel aerosol scattering. b) Fuel mole fraction time-historyfor the shock in a). c) Linear fit of corrected absorbance (see Eq. (3.6)), t = 0 mscorresponds to the arrival of the reflected shock.
the fuel. According to the simple model given by Eq. (3.3) and described in detail
in Appendix A, the rate of removal of fuel is equivalent to the rate of production
of products. With this observation, the assumption that the fuel completely de-
composes at long times (100% conversion), and the ideal gas assumption, the fuel
mole fraction (corrected for interfering product species) can be determined from
Eq. (3.5) according to the method described in Appendix A.
Xfuel(t)
Xfuel(0)=
!meas(t)% !prod
!fuel % !prod(3.5)
16

In Eq. 3.5,!fuel is the initial (t = 0) absorbance, due only to fuel, and !prod is
the final (t = inf) absorbance, due entirely to products. In this manner, the RP-2
mole fraction in Fig. 3.3b was determined from the data in Fig. 3.3a. Examining
Eq. (3.4) in light of Eq. (3.5) results in Eq. (3.6), the initial slope of which, when
plotted versus time (Fig. 3.3c), is koverall.
%koverallt = ln
!!meas(t)% !prod
!fuel % !prod
"(3.6)
Figure 3.3c shows the initial first-order behavior of RP-2 decomposition, but also
shows the extent of the deviation from first-order behavior as time increases beyond
0.3 ms.
Similar interference occurs with the ethylene diagnostic; there are additional
products that interfere with the measurement of ethylene when they absorb weakly
at the wavelength of the ethylene diagnostic. The absorption feature used for the
ethylene measurement is due to the out-of-plane bending of the molecule, and
it is expected that molecules with a similar chemical structure will also absorb
near this feature. Indeed, other small alkenes such as propene and 1-butene have
absorption features near the strong ethylene feature. However, their cross sections
are not strongly wavelength-dependent in the region of interest for this study (see
Chapter 5), which is an important observation that will come into play shortly.
The correction utilized for this diagnostic is a two-line measurement technique
for subtracting out the interfering absorbance from the ethylene measurements.
Absorbance at the P14 wavelength is given by Eq. (3.7) and absorbance at the
P28 wavelength is given by Eq. (3.8).
!P14(t) = !C2H4,P14(t) + !IS,P14(t)
=PtotalL
RT($C2H4,P14XC2H4(t) + $IS,P14XIS(t)) (3.7)
!P28(t) = !C2H4,P28(t) + !IS,P28(t)
=PtotalL
RT($C2H4,P28XC2H4(t) + $IS,P28XIS(t)) (3.8)
Here, IS represents the absorbance due to all interfering species. If IS can be
identified and $IS measured at both wavelengths, this is simply a system of two
17

equations with XC2H4 and XIS as the unknowns. Solving this for XC2H4 gives Eq.
(3.9).
XC2H4(t) =RT
PtotalL
#
$!P14(t)%
%"IS,P14
"IS,P28
&!P28(t)
$C2H4,P14 %%"IS,P14
"IS,P28
&$C2H4,P28
'
( (3.9)
The identity of IS varies from one fuel to the next, and Chapter 6 will give a more
detailed discussion of the suspected interfering species for each fuel, but here they
will be previewed. For dodecane, there is negligible interference for the ethylene
diagnostic and the ethylene mole fraction is simply Eq. (3.10).
XC2H4(t) =!P14RT
$P14PtotalL(3.10)
However, for MCH, multiple species interfere with the measurement of ethylene.
In this case, the two-line method is necessary. Fortunately, the suspected interfer-
ing species, propene, 1-butene, and 1,3-butadiene, all have nearly identical cross
sections between P14 and P28, making the ratio $IS,P14/$IS,P28 very nearly one.
The ethylene mole fraction then reduces to Eq. (3.11).
XC2H4(t) =RT
PtotalL
!!P14(t)% !P28(t)
$C2H4,P14 % $C2H4,P28
"(3.11)
For iso-cetane, there is very little ethylene produced, as evidenced by the nearly-
equivalent absorbance time histories at the P14 and P28 lines. Because of the
drastically di!erent ethylene cross sections between the two lines, even a small
amount of ethylene will result in di!ering absorbance values between P14 and
P28. Therefore, the analysis of the ethylene diagnostic results di!ers slightly from
that previously discussed. According to Holman et al. [60], iso-butene is a major
product of iso-cetane decomposition, and iso-butene has an absorption cross section
that di!ers between the P14 and P28 lines [73]. This molecule can therefore no
longer be included in IS and the absorbance at the P14 wavelength is now given
by Eq. (3.12) while the absorbance at the P28 wavelength is given by Eq. (3.13).
!P14(t) = !C2H4,P14(t) + !IS,P14(t) + !iC4H8,P14(t) (3.12)
!P28(t) = !C2H4,P28(t) + !IS,P28(t) + !iC4H8,P28(t) (3.13)
18

There are now three unknowns and it is necessary to employ a third equation to
solve this system. This third equation comes in the form of a carbon balance,
but because the species under consideration do not account for 100% of the initial
carbon, this third equation can only put bounds on the possible values of ethylene
mole fraction. However, this will be su"cient to confirm that there is very little
ethylene in the product mixture. Further discussion and results will be given in
Chapter 6.
The products of RP-1 will include a mixture of the decomposition products of
all three fuels discussed here. For all data points except for the lowest temperature,
su"cient amounts of ethylene are produced to outweigh the small amounts of iso-
butene and the two-line method given by Eq. (3.11) is used. However, at the
lowest temperature measured, the absorbance time histories at P14 and P28 are
nearly equivalent, indicating that the amount of ethylene in the product mixture
is very small. For this point, the iso-cetane method is used to analyze the data
from the ethylene diagnostic.
An example ethylene time history measured during RP-1 decomposition is
shown in Fig. 3.4 as calculated with and without interference correction. Ethylene
yield is defined as the mole fraction of ethylene divided by the initial fuel mole
fraction. Here it is obvious that interfering species indeed absorb at the primary
ethylene line.
4
3
2
1
0
Ethy
lene
Yie
ld
3.02.01.00.0Time [ms]
One-line C2H4 (from Eq. 3.10) Two-line C2H4 (from Eq. 3.11)
Figure 3.4: Illustration of the e!ects of interfering species on ethylene yield duringRP-1 decomposition. 1262 K, 18.4 atm, 0.17% RP-1 in argon.
19

The minimum detectivity for the fuel diagnostic varies slightly based on fuel,
but is approximately 50 ppm for the low-pressure experiments, and approximately
100 ppm for the high pressure experiments. The minimum detectivity for the
ethylene measurements is 200 ppm.
3.4 Soot
High-temperature hydrocarbon pyrolysis reactions often involve the formation of
coke or soot, as is clear from the motivation for this study. The intention of the
current work, however, is to study the initial decomposition chemistry of these
fuels, prior to the formation of condensed particulates. For this reason, it was nec-
essary to ensure that the current study avoided interference from soot formation.
A review of the literature concerning hydrocarbon pyrolysis was completed and it
was determined that soot formation occurs in a relatively small temperature range.
This range varies slightly based on fuel identity, but typically ranges from 1600 to
2500 K, above the temperatures studied here.
In 1983, Frenklach et al. [74] studied soot formation during the pyrolysis of
acetylene, allene, and 1,3-butadiene at 0.28 to 8.28 atm and reported soot yields
that peaked between 1800 and 2200 K. These soot yields all decayed to zero below
1600 K.
In 1995, Alexiou and Williams [75] studied the pyrolysis of toluene/n-heptane
and toluene/iso-octane mixtures from 1.8 to 3.6 atm and reported soot yields that
peaked near 2000 K and decayed toward zero as temperatures approached 1600 K.
In 2000, Douce et al. [76] studied the pyrolysis and oxidation of n-hexadecane,
toluene, n-heptylbenzene, and 1-methylnaphthalene between 2 and 17.8 atm. It
was observed that aromatic molecules tend to produce peak soot yields at lower
temperatures than non-aromatic molecules. Also, the pyrolysis of n-hexadecane
produced a much lower peak soot yield than the other hydrocarbons studied, and
negligible soot was formed below 1600 K.
In 2009, Mathieu et al. [64] performed pyrolysis and oxidation studies from
10.4 to 18.5 atm on three hydrocarbons intended as a possible diesel surrogate
(n-propylcyclohexane, n-butylbenzene, and 2,2,4,4,6,8,8-heptamethylnonane) and
a mixture including all three. While the pyrolysis of most fuels and fuel mixtures
produced no soot below 1600 K, n-butylbenzene pyrolysis results showed that
20

small soot yields were observed down to about 1500 K. This is to be expected
since n-butylbenzene is aromatic in nature, and as was also observed in [76], these
molecules have a higher soot yield and begin to form soot at lower temperatures.
Fortunately, the cycloalkane and iso-alkane studied followed previous experimental
observation and did not form soot below 1600 K.
As an additional check, since the low-pressure Aerosol Shock Tube measure-
ments include a scattering diagnostic, it was utilized not only as an indication
of when the aerosol has completely evaporated, but also as a soot monitor. No
scattering was observed by this diagnostic after the arrival of the reflected shock,
indicating that no soot formed in the low-pressure studies.
It was thus determined that sooting would not interfere with the optical mea-
surements in the current study.
21

Chapter 4
Experimental Setup
Shock tubes are often used to study the chemical kinetic behavior of gaseous fuels.
A conventional shock tube is comprised of two sections, a driver and a driven
section, separated by a diaphragm. The driven section is filled to the desired
pressure with a mixture of fuel and bath gas, and the driver is filled with a light
gas, often helium, until the diaphragm bursts causing a shock wave to propagate
down the tube into the fuel mixture, heating and pressurizing this mixture. The
shock then reflects from the end wall of the shock tube and travels back toward the
driver section, again increasing the temperature and pressure of the fuel mixture,
now to the desired test conditions. Diagnostics are located at or near the endwall
for observation of this high-temperature, high-pressure fuel vapor. The initial fuel
mixture is typically prepared manometrically in a mixing tank by sequentially
filling the evacuated tank, first with the desired partial pressure of fuel and then
to the desired total pressure with bath gas. The fuel/bath gas mixture is stirred
mechanically until a uniform mixture is obtained, which is then introduced into the
driven section of the tube. Filling the tank with fuel is a straightforward process
when the fuel is a gas at room temperature, and even liquid fuels can be introduced
into the mixing tank as vapor without di"culty if their room-temperature vapor
pressures are high enough. However, this vapor-pressure fill method is di"cult to
carry out for low-vapor-pressure fuels. In such cases, heating the fuel, mixing tank,
and shock tube can extend the range of a shock tube to include studies of slightly
heavier fuels, but care must be taken to avoid fuel decomposition in the mixing
assembly. To study extremely heavy fuels with vapor pressures that are low even
when the fuel, mixing tank, and shock tube are heated, an aerosol shock tube has
22

been developed [77].
Three lasers were employed for these experiments. The first was a Jodon
HN-10GIR fixed-wavelength mid-infrared HeNe gas laser operating at 3.39 µm
(2947.909 cm!1), a wavelength that is strongly absorbed by all of the fuels stud-
ied. The second was an Access Laser Company water-cooled LASY-4G CO2 gas
laser which was operated at either the 10.532 µm P14 line or the 10.675 µm P28
line. The third was either a 1335 nm or 670 nm diode laser, utilized to measure
scattering in the aerosol shock tube as an indication of when complete evaporation
had occurred. The 1335 nm wavelength was abandoned in favor of the 670 nm
wavelength early in the current study to avoid the possibility of absorption from
the fuel feature near 1400 nm a!ecting the scattering diagnostic.
4.1 Aerosol Shock Tube
Dodecane and kerosene fuels such as RP-fuels and JP-7 lie in a region of overlap
where both aerosol and heated shock tube methods can be used as complemen-
tary measurement tools. Hence, the low-pressure (< 8 atm) experiments were
performed in the Second-Generation Aerosol Shock Tube (AST) facility in the
High Temperature Gasdynamics Laboratory at Stanford University. The AST is
an ideal method for measurement of high-carbon-number, multi-component (dis-
tilled) fuels for two major reasons. First, the fuel mole fractions that can be
obtained in the AST are much higher than those obtained in a conventional shock
tube. For conventional gas-phase shock tube studies, the maximum fuel mole frac-
tion is limited by the vapor pressure of the fuel. This makes mid-infrared studies
of low-vapor-pressure fuels di"cult because unless the shock tube is heated, only
very low concentrations of fuel can be loaded into the shock tube, and as a result,
absorption is frequently too small to make accurate, quantitative measurements.
The second major advantage of the AST comes as a result of its unique fuel in-
troduction method. The fuel is nebulized into an aerosol, which is carried into
the shock tube by a bath gas (in the current study, argon), therefore delivering
all components of a distillate fuel into the shock tube and maintaining the orig-
inal ratios of components from that distilled fuel. For a multi-component fuel,
the vapor-pressure fill method could lead to a re-distillation of the fuel, leaving
the heaviest components in the mixing tank. This can be avoided in certain cases
23
by careful and proper use of a heated shock tube, but the aerosol method o!ers
greater certainty that the ratio of components in a distilled fuel is preserved.
The operation of the AST is slightly di!erent than that of a conventional shock
tube. An aerosol is generated in an aerosol mixing tank and then introduced
via plug flow into the driven section of the tube through an endwall gate valve.
The incident shock vaporizes this aerosol leaving behind a uniform fuel vapor that
is subsequently heated and pressurized to the desired conditions by the reflected
shock. Absorption and extinction measurements are recorded at a window located
4 cm from the endwall across a path length of 10 cm. Further details concerning
the aerosol delivery method can be found in the literature [77–82].
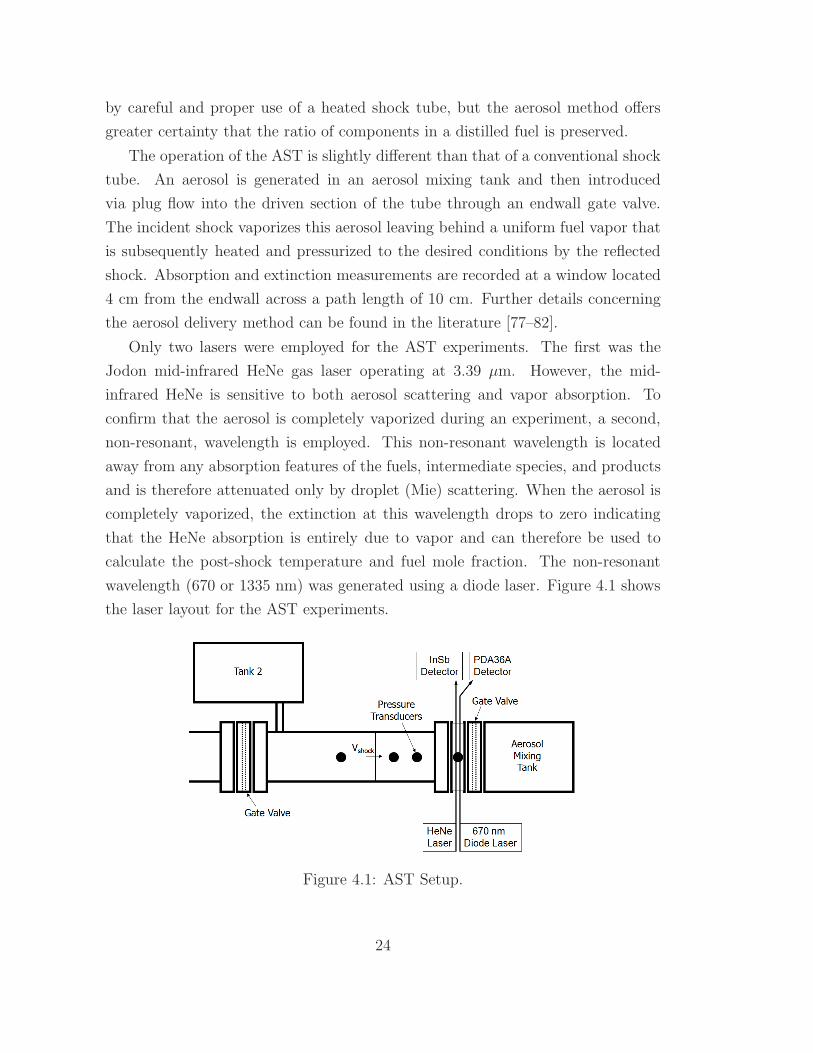
Only two lasers were employed for the AST experiments. The first was the
Jodon mid-infrared HeNe gas laser operating at 3.39 µm. However, the mid-
infrared HeNe is sensitive to both aerosol scattering and vapor absorption. To
confirm that the aerosol is completely vaporized during an experiment, a second,
non-resonant, wavelength is employed. This non-resonant wavelength is located
away from any absorption features of the fuels, intermediate species, and products
and is therefore attenuated only by droplet (Mie) scattering. When the aerosol is
completely vaporized, the extinction at this wavelength drops to zero indicating
that the HeNe absorption is entirely due to vapor and can therefore be used to
calculate the post-shock temperature and fuel mole fraction. The non-resonant
wavelength (670 or 1335 nm) was generated using a diode laser. Figure 4.1 shows
the laser layout for the AST experiments.
Figure 4.1: AST Setup.
24

4.2 High-Pressure Shock Tube
Because the AST was not designed to withstand high test pressures, high-pressure
(> 18 atm) experiments were carried out in the High-Pressure Shock Tube (HPST)
facility for RP-1, n-dodecane, MCH, and iso-cetane. The HPST is not equipped
with an aerosol delivery system, but is equipped with a system for heating both
the tube and mixing tank. In order to ensure that all components of RP-1 were
completely evaporating in the mixing tank, a simple experiment was carried out.
Various amounts of fuel were injected into the 12.84 L mixing tank (heated to at
least 110"C) in liquid form and then allowed 10 minutes to evaporate. The fuel
pressure was then was recorded and it was observed that for small amounts of
injected fuel, the resulting pressure in the mixing tank increased nearly linearly
with amount of fuel injected. In this linear region, there was so little fuel in the
tank that all components completely evaporated. This was observed to be the
case up to about 2 mL of injected fuel for RP-1 and dodecane, and 1 mL for
iso-cetane, at which point the mixing tank pressure began rolling o! to a plateau.
This roll-o! was an indication that the heaviest components of RP-1 were no
longer evaporating and for the neat fuels it was an indication that the injected fuel
was nearing the vapor pressure at that temperature. As long as the amount of
fuel injected was below the point at which significant roll-o! occurred, complete
evaporation could be assumed. The plateau can be observed in Fig. 4.2 for RP-1,
n-dodecane, and iso-cetane and corresponds to the vapor pressure of each fuel. For
dodecane at 115"C, this is 29.7 torr and for iso-cetane at 115"C, it is 12.8 torr [83].
As a distilled fuel consisting of hundreds of components, it is di"cult to define a
unique vapor pressure for RP-1. However, extrapolating the limited RP-1 vapor
pressure data in the CPIA/M4 Liquid Propellant Manual [84] up to 112"C gives
a “calculated vapor pressure based on initial boiling point” of 47 torr. The MCH
experiments were carried out in the same facility, however, the vapor pressure of
MCH is much higher than that of dodecane or iso-cetane (approximately 1100 torr
at 115"C [85]), so the fuel was instead introduced into the mixing tank in vapor
form from a flask connected to the tank through a heated manifold.
In the present study, the maximum RP-1 volume injected into the mixing tank
was 1 mL, the maximum dodecane volume injected was 2 mL, and the maximum
iso-cetane volume injected was 0.8 mL. Argon was then added up to the desired
25

35
30
25
20
15
10
5
0
Mix
ing
Tank
Pre
ssur
e [to
rr]
543210
Injected Volume [mL]
Pvapor
Dodecane115°C
(a)
50
40
30
20
10
0
Mix
ing
Tank
Pre
ssur
e [to
rr]
6543210
Injected Volume [mL]
Pvapor-calc
RP-1112°C
(b)
14
12
10
8
6
4
2
0Mix
ing
Tank
Pre
ssur
e [to
rr]
543210
Injected Volume [mL]
Pvapor
Iso-cetane115°C
(c)
Figure 4.2: HPST mixing tank evaporation checks. Tank volume 12.84 L. Signifi-cant deviation from linear behavior occurs to the right of the dashed lines. Solidlines are linear fits to data below roll-o!.
total pressure and the mixture was stirred in the tank for up to two hours. It was
determined through a series of filling measurements that as long as the injected
volume was below the roll-o! point, complete mixing occurred relatively quickly,
within ten minutes of the argon fill.
The ethylene diagnostic was employed as a check for decomposition in the
mixing tank, since decomposition of most of these fuels would lead to large mole
fractions of ethylene. To complete this mixing tank check, a mixture was left to
stir for long times, and periodically used to fill the shock tube. Measurements of
the ethylene in the mixture showed that even after long mixing times (up to five
days for RP-1), the ethylene mole fraction in the mixture was still less than 250
ppm and therefore fuel decomposition was not a concern for the mixing times and
26

temperatures considered here. In general, mixtures were stirred for a time between
ten minutes and two hours. Once it was certain that the fuel had completely
evaporated and no decomposition was occurring in the mixing tank, attention was
turned to the shock tube itself.
Because of the low room-temperature vapor pressures of the fuels tested, the
entire shock tube driven section and transfer lines were heated to at least 83"C in
order to accommodate enough fuel in the gas phase to make absorption measure-
ments. Since the mole fraction is constant between the mixing tank and the shock
tube, and the shock tube total pressure is much lower than the mixing tank total
pressure, the partial pressure of fuel is also much lower in the shock tube. This
means that a lower temperature (and therefore vapor pressure) is acceptable for
the shock tube, and the fuel partial pressure can still be maintained well below its
vapor pressure. For the round of experiments performed on higher concentration
fuel mixtures, the tube was heated to 90"C and the partial pressures of dodecane
loaded into the shock tube varied from 5.2 to 7.6 torr, well below the 9.4 torr vapor
pressure of dodecane at 90"C. For the round of experiments performed with lower
concentrations of fuel, the tube was heated to 83"C and the partial pressures of
dodecane loaded into the shock tube varied from 0.6 to 1.8 torr, well below the 6.3
torr vapor pressure of dodecane at 83"C. The partial pressure of iso-cetane loaded
into the shock tube varied from 1.2 to 2.5 torr, below the 2.6 torr vapor pressure
of iso-cetane at 83"C [86]. Although fuel detection limits (with SNR of 1) for this
diagnostic vary slightly based on the fuel, this limit was near 100 ppm for all fu-
els studied here (except RP-1, which was closer to 200 ppm) while the ethylene
detection limit was 200 ppm. The RP-1 and n-dodecane fuel mole fractions were
measured in the shock tube just prior to the shock using 3.39 µm laser absorp-
tion with the cross section calculated from the fits that will be given in Chapter
5 and the measured temperature in region 1. The mole fraction calculated from
the fuel and total pressures in the mixing tank was generally within 10% of the
absorption-measured mole fraction. The MCH and iso-cetane cross sections were
determined in the current study from manometrically-determined mole fractions
and are shown in Chapter 5. Because only vapor was present in the high-pressure
shock tube studies, no non-resonant laser was needed for these experiments. How-
ever, two lasers were again employed, the HeNe laser for fuel measurements and
the CO2 laser for ethylene measurements. The high-pressure shock tube has a
27
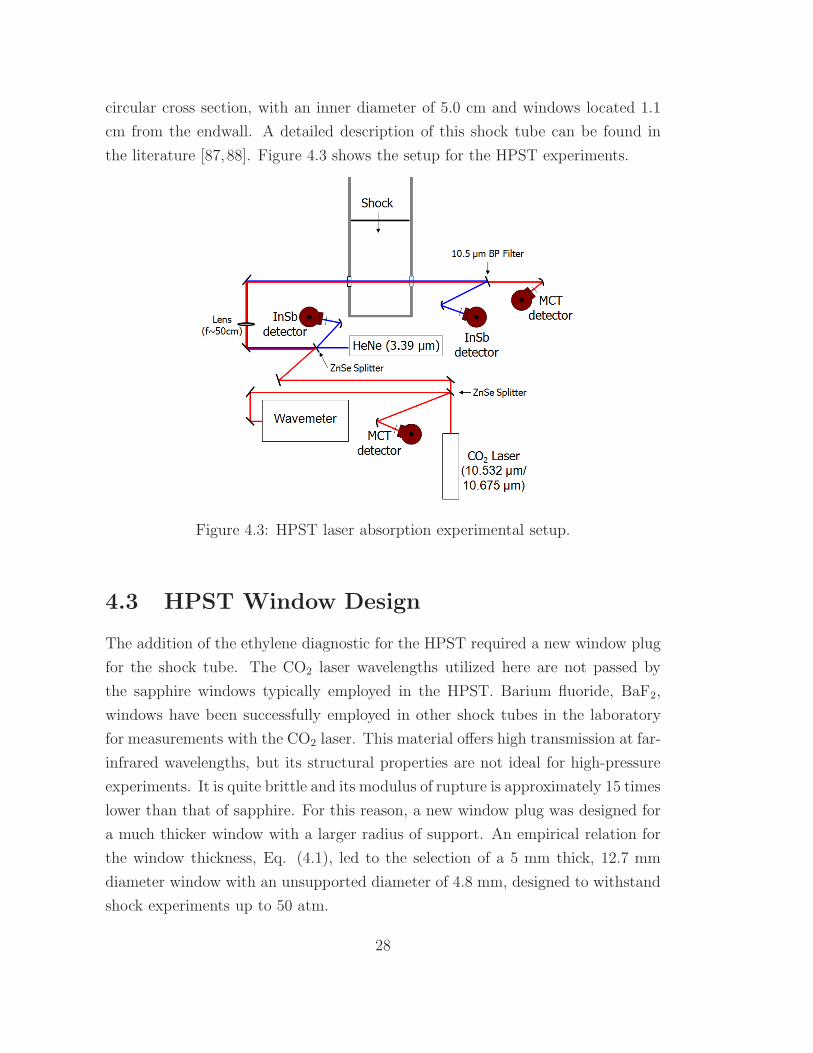
circular cross section, with an inner diameter of 5.0 cm and windows located 1.1
cm from the endwall. A detailed description of this shock tube can be found in
the literature [87, 88]. Figure 4.3 shows the setup for the HPST experiments.
Figure 4.3: HPST laser absorption experimental setup.
4.3 HPST Window Design
The addition of the ethylene diagnostic for the HPST required a new window plug
for the shock tube. The CO2 laser wavelengths utilized here are not passed by
the sapphire windows typically employed in the HPST. Barium fluoride, BaF2,
windows have been successfully employed in other shock tubes in the laboratory
for measurements with the CO2 laser. This material o!ers high transmission at far-
infrared wavelengths, but its structural properties are not ideal for high-pressure
experiments. It is quite brittle and its modulus of rupture is approximately 15 times
lower than that of sapphire. For this reason, a new window plug was designed for
a much thicker window with a larger radius of support. An empirical relation for
the window thickness, Eq. (4.1), led to the selection of a 5 mm thick, 12.7 mm
diameter window with an unsupported diameter of 4.8 mm, designed to withstand
shock experiments up to 50 atm.
28
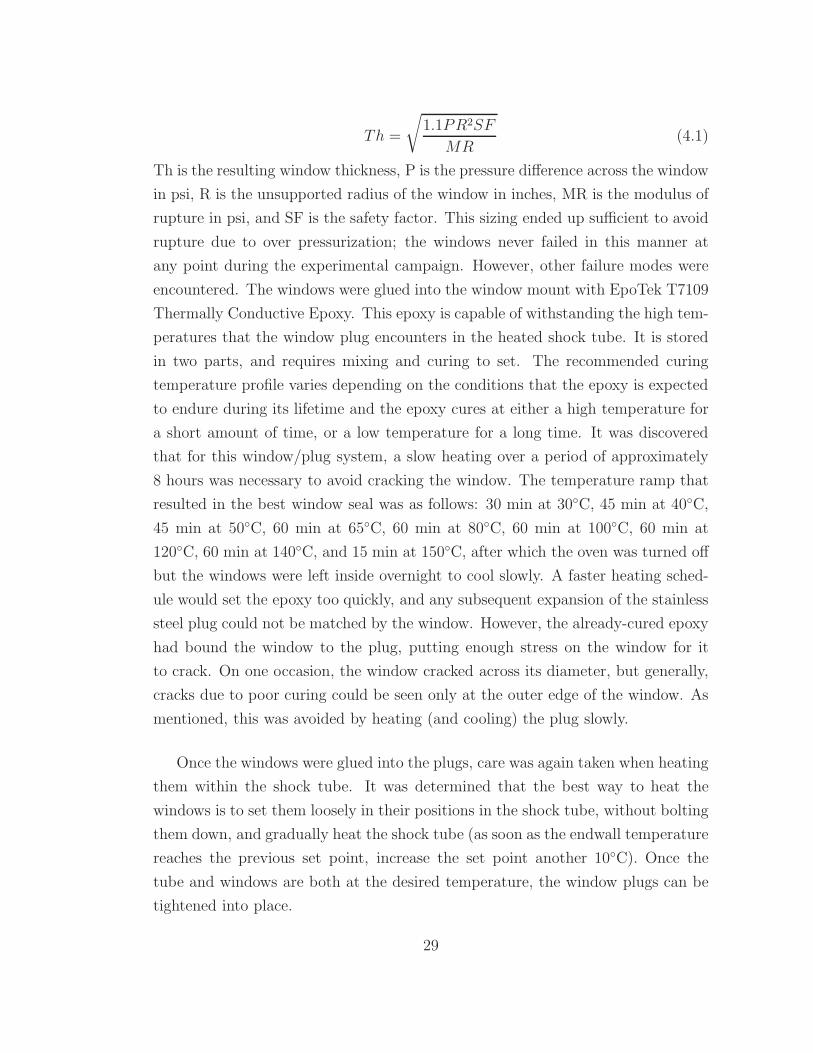
Th =
)1.1PR2SF
MR(4.1)
Th is the resulting window thickness, P is the pressure di!erence across the window
in psi, R is the unsupported radius of the window in inches, MR is the modulus of
rupture in psi, and SF is the safety factor. This sizing ended up su"cient to avoid
rupture due to over pressurization; the windows never failed in this manner at
any point during the experimental campaign. However, other failure modes were
encountered. The windows were glued into the window mount with EpoTek T7109
Thermally Conductive Epoxy. This epoxy is capable of withstanding the high tem-
peratures that the window plug encounters in the heated shock tube. It is stored
in two parts, and requires mixing and curing to set. The recommended curing
temperature profile varies depending on the conditions that the epoxy is expected
to endure during its lifetime and the epoxy cures at either a high temperature for
a short amount of time, or a low temperature for a long time. It was discovered
that for this window/plug system, a slow heating over a period of approximately
8 hours was necessary to avoid cracking the window. The temperature ramp that
resulted in the best window seal was as follows: 30 min at 30"C, 45 min at 40"C,
45 min at 50"C, 60 min at 65"C, 60 min at 80"C, 60 min at 100"C, 60 min at
120"C, 60 min at 140"C, and 15 min at 150"C, after which the oven was turned o!
but the windows were left inside overnight to cool slowly. A faster heating sched-
ule would set the epoxy too quickly, and any subsequent expansion of the stainless
steel plug could not be matched by the window. However, the already-cured epoxy
had bound the window to the plug, putting enough stress on the window for it
to crack. On one occasion, the window cracked across its diameter, but generally,
cracks due to poor curing could be seen only at the outer edge of the window. As
mentioned, this was avoided by heating (and cooling) the plug slowly.
Once the windows were glued into the plugs, care was again taken when heating
them within the shock tube. It was determined that the best way to heat the
windows is to set them loosely in their positions in the shock tube, without bolting
them down, and gradually heat the shock tube (as soon as the endwall temperature
reaches the previous set point, increase the set point another 10"C). Once the
tube and windows are both at the desired temperature, the window plugs can be
tightened into place.
29

Two windows underwent drastic failure, rendering them unusable, during the
HPST campaign. The failure mode of the first was that the already-cured window
and plug were tightened into the shock tube before heating the tube. As the
temperature of the tube increased, the window and stainless steel plug expanded
at di!erent rates, resulting in a cracked window. The second failure was due to a
poor curing schedule, before the schedule described above was implemented. This
resulted in enough small cracks in the window that its seal with the plug was not
su"cient to hold it in place. It was pulled into the tube while under vacuum and
shattered as it hit the window across from it.
4.4 Fuels
99+% anhydrous n-dodecane, 98% 1,2,3,4-tetrahydroquinoline (THQ), 99+% an-
hydrous methylcyclohexane (MCH), 99+% benzyl alcohol (BzOH), and 98%
2,2,4,4,6,8,8-heptamethylnonane (iso-cetane) were obtained from Sigma-Aldrich
and used as received. The JP-7 sample (POSF 3327) was obtained from the Air
Force Research Laboratory (Wright-Patterson Air Force Base) while the RP-1 (lot
number SH2421LS05) and RP-2 (lot number WC0721HW01) were obtained from
the Air Force Research Laboratory (Edwards Air Force Base). All blended fu-
els were refrigerated prior to use in order to prevent evaporation of the lightest
components.
The properties of JP-7, RP-1, and RP-2 are all dictated by military specifica-
tion (MIL-DTL-25576E for RP-1 and RP-2 [89], MIL-DTL-38219D for JP-7 [90]),
but these specifications limit mainly chemical and physical properties, and for anal-
ysis of shock tube experiments, knowledge of the thermodynamic properties of the
fuels is required. The fuel thermodynamic properties are used to calculate the ratio
of specific heats for the fuel mixture. This ratio plays a key role in determining
the temperature and pressure after both the incident and reflected shocks. These
conditions are calculated with an in-house code called FROSH (for the HPST) that
solves the normal shock jump equations. A similar, but significantly modified ver-
sion called AEROFROSH is employed for the AST, and this version also requires
the specific heat and enthalpy of a fuel in order to iteratively determine the post-
shock temperature, pressure, and fuel mole fraction. AEROFROSH is described
in more detail by Davidson et al. [78]. The REFPROP database, which includes
30

a surrogate mixture for the thermophysical properties of RP-1, was employed to
provide thermodynamic properties for RP-1 [40]. The specific heat capacity deter-
mined from the resulting NASA polynomial fits (shown in Table 4.1) was compared
to historical data [84,91] and agreed quite well (see Fig. 4.4), considering the vari-
able nature of the composition of RP-1 [7,41]. The transition from the low- to the
high-temperature polynomial was made at 475 K.
Table 4.1: 7-Coe"cient NASA polynomials for RP-1
Low Temperature High Temperaturea1 2.22655300E+01 -2.73270218e+01a2 -3.17395800E-04 2.35031125E-01a3 3.09829900E-04 -2.25678615E-04a4 -5.21069400E-07 1.13132066E-07a5 3.34905300E-10 -2.31358409E-11a6 -1.66350000E+04 -1.68000000E+03a7 -1.57750000E+02 8.90800000E+01
4.0
3.5
3.0
2.5
2.0
1.5
Spec
ific
Hea
t Cap
acity
, kJ/
kgK
1000800600400200Temperature [K]
Figure 4.4: Comparison of historic data with the RP-1 specific heat capacity cal-culated from the new NASA polynomial in Table 4.1. Closed symbols are liquid,open symbols are vapor. New RP-1 polynomial in red, historic RP-1 in blue, T-1kerosene in green, Jet-A in light blue, n-dodecane in black. - new RP-1 poly-nomial, ! liquid RP-1 [84], & liquid RP-1 [91], " vapor RP-1 [91], • liquid T-1kerosene [92], ( vapor T-1 kerosene [92], - vapor Jet-A [93], - vapor n-dodecane [93].
31

Equations 4.2 to 4.4 show how the NASA polynomial coe"cients in Table 4.1
are used to calculate the heat capacity, enthalpy, and entropy of a fuel.
Cp/R = a1 + a2T + a3T2 + a4T
3 + a5T4 (4.2)
H/RT = a1 + a2T/2 + a3T2/3 + a4T
3/4 + a5T4/5 + a6/T (4.3)
S/R = a1 ln(T ) + a2T + a3T2/2 + a4T
3/3 + a5T4/4 + a7 (4.4)
It was assumed during data analysis that RP-2 and JP-7 have identical ther-
modynamic properties to RP-1, which is a reasonable assumption since they are
both kerosenes with similar physical specifications to RP-1. The low-temperature
thermodynamic properties of THQ were obtained from Steele et al. [94] while the
high-temperature properties were assumed to be equivalent to the chemically sim-
ilar molecule naphthalene, which is listed in the database published by Goos et
al. [93]. The NASA polynomial determined from this process is listed in Table 4.2.
Table 4.2: 7-Coe"cient NASA polynomials for THQ
Low Temperature High Temperaturea1 2.33080000E+01 2.33080000E+01a2 -2.79350000E-02 -2.79350000E-02a3 2.18930000E-04 2.18930000E-04a4 -2.54680000E-07 -2.54680000E-07a5 9.08940000E-11 9.08940000E-11a6 -2.25000000E+03 -2.25000000E+03a7 -1.03200000E+02 -1.03200000E+02
The n-dodecane thermodynamic properties were taken from the Goos et al.
database [93], MCH from Pitz et al. [95], and iso-cetane from Oehlschlaeger et
al. [61]. The corresponding NASA polynomials are given in Tables 4.3 to 4.5.
32

Table 4.3: 7-Coe"cient NASA polynomials for n-Dodecane (from Goos et al. [93])
Low Temperature High Temperaturea1 3.70187925E+01 2.13264480E+01a2 5.54721488E-02 -3.86394002E-02a3 -1.92079548E-05 3.99476113E-04a4 3.08175574E-09 -5.06681097E-07a5 -1.84800617E-13 2.00697878E-10a6 -5.26984458E+04 -4.22475053E+04a7 -1.61453501E+02 -4.85848300E+01
Table 4.4: 7-Coe"cient NASA polynomials for MCH (from Pitz et al. [95])
Low Temperature High Temperaturea1 2.14785343E+01 -8.09426478E+00a2 3.32215917E-02 1.00736150E-01a3 -1.14861934E-05 -7.00859796E-05a4 1.79638933E-09 2.48687934E-08a5 -1.04761864E-13 -3.59166681E-12a6 -3.04164647E+04 -1.99875643E+04a7 -9.93118588E+01 6.00729224E+01
Table 4.5: 7-Coe"cient NASA polynomials for iso-Cetane (from Oehlschlaeger etal. [61])
Low Temperature High Temperaturea1 5.65856523e+01 -1.07545408e+01a2 6.92869560e-02 2.33995831e-01a3 -2.34931111e-05 -1.78076331e-04a4 3.62720220e-09 6.96956034e-08a5 -2.09665225e-13 -1.10282035e-11a6 -7.80105076e+04 -5.55719693e+04a7 -2.79045957e+02 7.96404133e+01
33

Chapter 5
Absorption Cross Sections
As discussed in Chapter 3, Beer’s Law (%ln(I/Io) = $NL) is a fundamental tool
required for quantitative measurements of mole fraction. It quickly became appar-
ent that the absorption cross section, $, must be quantified in order to measure
the mole fraction of an absorbing species. This cross section is a measure (per
mole) of how much light the fuel absorbs. It is in general a function of pressure
and temperature, although for all of the fuels considered here the dependence on
pressure is negligible. The temperature dependence of the cross sections for these
fuels is su"cient to warrant a detailed study, and that will be reported here.
The absorption cross sections of RP-1, RP-2, JP-7, JP-8, and THQ in gaseous
form were measured in a heated cell using a Nicolet 6700 Fourier Transform In-
fraRed spectrometer (FTIR) over the 3.3 to 3.6 µm wavelength region at temper-
atures up to 775 K. Absorption cross sections for n-dodecane were measured by
a previous student (Adam Klingbeil [96]). Klingbeil et al. [97] describes the pro-
cedure for measuring the gaseous cross sections of liquid fuels. The current study
di!ered in procedure from Klingbeil’s methodology only in that here, measure-
ments have been performed on undiluted, fully-evaporated fuels at low pressures.
The 3.3 to 3.6 µm wavelength region was studied in order to determine the ab-
sorption cross section at the mid-infrared HeNe laser wavelength. The selection of
the HeNe laser wavelength was discussed in detail in Chapter 3. The heated-cell
temperature-dependent cross sections of these fuels at 3.39 µm are shown in the
following sections.
34

High-temperature measurements of cross sections were measured in a shock
tube by once again utilizing Beer’s Law (Eq. (3.1)) and the ideal gas law. This
results in Eq. (5.1).
! =$XPL
RT(5.1)
Since the fuel mole fraction is constant across a non-reacting shock wave, solving
Eq. (5.1) for the mole fraction in region 2 (the region after the incident shock
and before the reflected shock) and equating to the mole fraction in region 5 (the
post-reflected shock region) gives Eq. (5.2). This relationship between the cross
sections in regions 2 and 5 holds for a single wavelength.
$5 =!5T5P2
!2T2P5$2 (5.2)
The fuel cross section, $5, at the higher pressure and temperature of region 5,
immediately behind the reflected shock wave (where the fuel mole fraction is un-
changed from region 2), can be determined from the known temperature, pressure,
concentration, and absorbances in regions 2 and 5 and the cross section values in
region 2.
5.1 n-Dodecane
The low-temperature cross section of n-dodecane as measured by Klingbeil et al.
was reported previously [96] while the high-temperature cross section of n-dodecane
was measured by Davidson et al. [78]. Additional high-temperature cross section
points (shown in Fig. 5.1) were taken in the current study and have also been
reported [98]. At the highest tempertures reported, decomposition begins at time
zero, and because of the physical limitations of the optical setup, measurement of
the fuel absorbance does not begin until about five microseconds after time zero.
Therefore, at high temperatures, when the fuel has already begun to decompose
during those initial five microseconds, we must extrapolate back to time zero to
get the initial fuel absorbance and therefore the fuel cross section. Extrapolating
back from a curve with a steep slope (as is the case at high temperatures) results
in a large uncertainty in the absorbance at time zero. This large uncertainty at
high temperatures can be seen in Fig. 5.1.
35

80
60
40
20
0
Cro
ss S
ectio
n [m
2 /mol
]
140012001000800600400
Temperature [K]
Figure 5.1: Heated-cell FTIR-based absorption cross sections for n-dodecane at3.39 µm (300-800 K) from [96] in open symbols, shock-based absorption crosssections at 3.39 µm (800 - 1400 K) from the current study in closed symbols, andpolynomial fit to all data.
The polynomial fit describing the n-dodecane 3.39 µm temperature-dependent
absorption cross section is given in Table 5.1 in the final section of this chapter.
5.2 RP-1
The FTIR-measured absorption cross section as a function of wavelength for RP-
1 is shown at eight temperatures in Fig. 5.2. This illustrates a general trend
observed in all of the fuel spectra measured at multiple temperatures. As tem-
perature increases, the peaks fall and the valleys rise, resulting in an apparent
smoothing of the feature at higher temperatures. As described by Klingbeil [99],
for temperatures below approximately 900 K, “integration of the absorption cross
section over the entire rovibrational band will yield a temperature-independent
value... called the ‘band intensity’.” The RP-1 feature shown in Fig. 5.2 agrees
with this statement; the band intensities for the spectra shown never deviate from
the band intensity at the lowest temperature (448 K) by more than 3% when the
band is integrated from 3.13 to 3.85 µm.
The cross section at 3.39 µm for these eight temperatures is plotted in Fig. 5.3
in open symbols. The measured FTIR cross sections were limited to temperatures
36
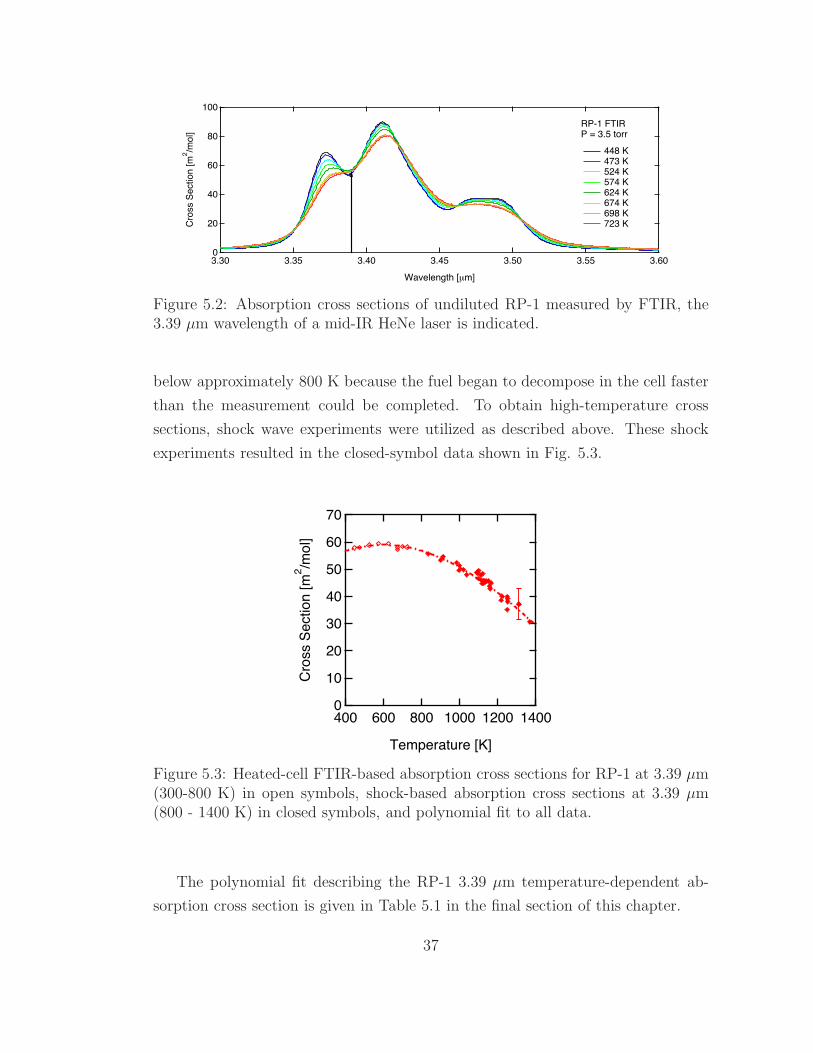
100
80
60
40
20
0
Cro
ss S
ectio
n [m
2 /mol
]
3.603.553.503.453.403.353.30
Wavelength [µm]
448 K 473 K 524 K 574 K 624 K 674 K 698 K 723 K
RP-1 FTIRP = 3.5 torr
Figure 5.2: Absorption cross sections of undiluted RP-1 measured by FTIR, the3.39 µm wavelength of a mid-IR HeNe laser is indicated.
below approximately 800 K because the fuel began to decompose in the cell faster
than the measurement could be completed. To obtain high-temperature cross
sections, shock wave experiments were utilized as described above. These shock
experiments resulted in the closed-symbol data shown in Fig. 5.3.
70
60
50
40
30
20
10
0
Cro
ss S
ectio
n [m
2 /mol
]
140012001000800600400
Temperature [K]
Figure 5.3: Heated-cell FTIR-based absorption cross sections for RP-1 at 3.39 µm(300-800 K) in open symbols, shock-based absorption cross sections at 3.39 µm(800 - 1400 K) in closed symbols, and polynomial fit to all data.
The polynomial fit describing the RP-1 3.39 µm temperature-dependent ab-
sorption cross section is given in Table 5.1 in the final section of this chapter.
37

5.3 RP-2
Similarly, low-temperature FTIR measurements of the RP-2 absorption cross sec-
tion at eight temperatures are shown in Fig. 5.4 and the high-temperature shock-
measured cross sections at 3.39 µm are shown in Fig. 5.5. Once again, the RP-2
feature shown in Fig. 5.4 agrees with Klingbeil’s observations [99]; the band in-
tensities for the spectra shown never deviate from the band intensity at the lowest
temperature (450 K) by more than 4% when the band is integrated from 3.00 to
4.00 µm.
100
80
60
40
20
0
Cro
ss S
ectio
n [m
2 /mol
]
3.603.503.403.30Wavelength [µm]
450 K 500 K 552 K 579 K 626 K 674 K 723 K 773 K
RP-2 FTIRP = 4 torr
Figure 5.4: Absorption cross sections of undiluted RP-2 measured by FTIR, the3.39 µm wavelength of a mid-IR HeNe laser is indicated.
The polynomial fit describing the RP-2 3.39 µm temperature-dependent ab-
sorption cross section is given in Table 5.1 in the final section of this chapter.
38

70
60
50
40
30
20
10
0C
ross
Sec
tion
[m2 /m
ol]
140012001000800600400
Temperature [K]
Figure 5.5: Heated-cell FTIR-based absorption cross sections for RP-2 at 3.39 µm(300-800 K) in open symbols, shock-based absorption cross sections at 3.39 µm(1000 - 1300 K) in closed symbols, and polynomial fit to all data.
5.4 JP-7
Davidson et al. [78] reported preliminary JP-7 cross sections, which were updated
in the current study [98]. These newly-measured cross sections are shown in Figs.
5.6 and 5.7. Similar to RP-1 and RP-2, the JP-7 feature shown in Fig. 5.6 agrees
with the observations of Klingbeil et al. [99]; the band intensities for the spectra
shown never deviate from the band intensity at the lowest temperature (372 K)
by more than 3% when the band is integrated from 2.94 to 4.17 µm.
120
100
80
60
40
20
0
Cro
ss S
ectio
n [m
2 /mol
]
3.603.503.403.30Wavelength [µm]
372 K 474 K 571 K 673 K
JP-7 FTIRP = 3.5 torr
Figure 5.6: Absorption cross sections of undiluted JP-7 measured by FTIR, the3.39 µm wavelength of a mid-IR HeNe laser is indicated.
39

70
60
50
40
30
20
10
0
Cro
ss S
ectio
n [m
2 /mol
]
140012001000800600400
Temperature [K]
Figure 5.7: Heated-cell FTIR-based absorption cross sections for JP-7 at 3.39 µm(400-700 K) in open symbols, shock-based absorption cross sections at 3.39 µm(1000 - 1200 K) in closed symbols, and polynomial fit to all data.
The polynomial fit describing the JP-7 3.39 µm temperature-dependent ab-
sorption cross section is given in Table 5.1 in the final section of this chapter.
40

5.5 JP-8
The JP-8 absorption cross section was also measured in the FTIR setup because
of its similarity to RP-fuels and JP-7. However, only the low-temperature FTIR-
measured cross sections were determined in this study. These are shown in Fig.
5.8. Again, the JP-8 feature shown in Fig. 5.8 agrees with the observations of [99];
the band intensities for the spectra shown never deviate from the band intensity
at the lowest temperature (424 K) by more than 3% when the band is integrated
from 2.94 to 4.17 µm.
80
60
40
20
0
Cro
ss S
ectio
n [m
2 /mol
]
3.603.553.503.453.403.353.30
Wavelength [µm]
JP-8 FTIRP = 3.5 torr
424 K 474 K 524 K 573 K
Figure 5.8: Absorption cross sections of undiluted JP-8 measured by FTIR.
5.6 THQ
Low-temperature FTIR measurements of the THQ absorption cross section are
shown in Fig. 5.9 and the high-temperature shock-measured cross sections are
shown in Fig. 5.10. Because THQ decomposed quite rapidly in the heated cell
at temperatures above approximately 472 K and the higher-temperature spectra
were influenced by decomposition products, only two FTIR-measured spectra are
reported here. The noise in these measurements is greater than that of the previous
fuels because it was necessary to take the measurements quickly to avoid the e!ects
of decomposition, and therefore the measured cross sections were not averaged over
multiple runs, as they were for all other fuels. The observations of Klingbeil [99]
helped to determine when decomposition had occurred during these THQ cross
41

section measurements. The band intensity (integrated from 2.86 to 4.17 µm) at 472
K was only 2% lower than that at 425 K, while the band intensity calculated for a
524 K measurement was 24% lower than that at 425 K. It was therefore determined
that the 524 K measurement was a!ected by decomposition, and therefore it is not
included in Fig. 5.9.
30
20
10
0Cro
ss S
ectio
n [m
2 /mol
]
3.73.63.53.43.33.23.1Wavelength [µm]
425 K 472 K
THQ FTIRP = 1.7 torr
Figure 5.9: Absorption cross sections of undiluted THQ measured by FTIR, the3.39 µm wavelength of a mid-IR HeNe laser is indicated.
30
25
20
15
10
5
0
Cro
ss S
ectio
n [m
2 /mol
]
140012001000800600400
Temperature [K]
Figure 5.10: Heated-cell FTIR-based absorption cross sections for THQ at 3.39µm (400-500 K) in open symbols, shock-based absorption cross sections at 3.39µm (1200 - 1400 K) in closed symbols, and polynomial fit to all data.
The polynomial fit describing the THQ 3.39 µm temperature-dependent ab-
sorption cross section is given in Table 5.1 in the final section of this chapter.
42

5.7 MCH
Since the MCH studies were carried out in the HPST with only vapor (no aerosol)
in all three regions, cross sections could be determined from shock data alone. The
absorption cross section of MCH was measured in the HPST in the current study
and is given in Fig. 5.11. The large scatter at the lowest temperatures is due to
the uncertainty in fuel mole fraction that was determined manometrically.
605040302010
0Cro
ss S
ectio
n [m
2 /mol
]
16001200800400Temperature [K]
1 atm 6 atm 20 atm
Figure 5.11: Absorption cross sections and polynomial fit at 3.39 µm for MCH.Triangles are data from the current study, circle is from [100].
The polynomial fit describing the MCH 3.39 µm temperature-dependent ab-
sorption cross section is given in Table 5.1 in the final section of this chapter.
5.8 iso-Cetane
The absorption cross section of iso-cetane at 3.39 µm was also measured in the
HPST in the current study and is given in Fig. 5.12. The low-temperature cross
section of iso-cetane was again determined in region 1 in the HPST. The large
scatter at the lowest temperature is again due to the uncertainty in fuel mole
fraction that was determined manometrically.
The polynomial fit describing the MCH 3.39 µm temperature-dependent ab-
sorption cross section is given in Table 5.1 in the final section of this chapter.
43

80
60
40
20
0Cro
ss S
ectio
n [m
2 /mol
]
1200800400Temperature [K]
1 atm 6 atm 20 atm
Figure 5.12: Absorption cross sections and polynomial fit at 3.39 µm for iso-cetane.
Although none of the other fuels studied here have measurable cross sections
near 10.5 µm, iso-cetane has a small, but non-negligible cross section at both the
P14 and P28 lines. This is shown in Fig. 5.13. As the cross section is quite small
and since this diagnostic was not designed specifically to measure it, the scatter in
the cross section is fairly large.
3
2
1
0Cro
ss S
ectio
n [m
2 /mol
]
150012501000750500250Temperature [K]
P14 P28
Figure 5.13: iso-Cetane absorption cross section at the P14 (10.532 µm) and P28(10.675 µm) wavelengths.
44

5.9 Small Alkenes
As mentioned in Chapter 3, the ethylene diagnostic makes use of the strong ethy-
lene feature located near the P14 CO2 laser line (10.532 µm). However, because of
interference from other product species, a second line, P28 (10.675 µm), is utilized
in this diagnostic, as well. Low-temperature cross sections from 10.2 to 11.2 µm
for ethylene and two major interfering species, propene and 1-butene, are shown
in Fig. 5.14.
Since low-temperature spectra are much more distinct and features are easily
recognized, Fig. 5.14 shows the spectra of ethylene, propene, and 1-butene at
50"C and 1 atm as reported by Sharpe et al. [101]. On this figure are also shown
the locations of the P14 and P28 laser lines, which were selected for the two-
line interference correction method for the ethylene diagnostic. This correction is
necessary because as Fig. 5.14 shows, other product species also absorb at the
location of the main ethylene feature (P14).
120
100
80
60
40
20
0
Cro
ss S
ectio
n [m
2 /mol
]
11.211.010.810.610.410.2Wavelength [µm]
Ethylene Propene 1-Butene
PNNL50°C1 atm
P14P28
Figure 5.14: Low-temperature cross sections for ethylene and interfering speciesfrom Sharpe et al. [101]. The P14 and P28 lines of the CO2 laser have beenindicated.
Utilizing the two-wavelength interference correction method described in Chap-
ter 3 and the absorption cross sections for ethylene at these two wavelengths ac-
counts for product species that may interfere with the measurement of ethylene.
As discussed in Chapter 3, the cross sections of these interfering species should
be constant between the two lines utilized for this diagnostic in order to correctly
measure ethylene. The cross sections of the interfering species propene and 1-
butene at both lines are shown in Fig. 5.15 along with those for ethylene, which
45

are necessary for a quantitative measurement of ethylene mole fraction. All of the
cross sections in Fig. 5.15 were measured in the HPST.
12
8
4
0Cro
ss S
ectio
n [m
2 /mol
]
16001200800400Temperature [K]
1% Ethylene in argon
P28 [Current Study]
P14 [Ren et al. 2011]
1 atm 6 atm 20 atm
(a)
10
8
6
4
2
0Cro
ss S
ectio
n [m
2 /mol
]
140012001000800600400Temperature [K]
P14 P28
3.3% Propene in argon
1 atm 6 atm 20 atm
(b)
10
8
6
4
2
0Cro
ss S
ectio
n [m
2 /mol
]
140012001000800600400Temperature [K]
P14 P28
2.1% 1-Butene in argon
1 atm 6 atm 20 atm
(c)
Figure 5.15: Absorption cross sections for a) Ethylene, b) Propene, and c) 1-Buteneat 10.532 µm (CO2 laser P14 line), and 10.675 µm (CO2 laser P28 line).
As can be seen in Fig. 5.15a, the on-line (P14) ethylene cross section is much
greater than the o!-line (P28) ethylene cross section. However, the di!erence
in cross section between the P14 and P28 lines for propene and 1-butene (Fig.
5.15b and 5.15c) is negligible at the temperatures studied here. Therefore, for
the decomposition of fuels that result in predominantly n-alkanes (which do not
absorb near 10.5 µm), or small normal alkenes (which have a constant cross section
between the P14 and P28 lines as shown in Figs. 5.15b and 5.15c), the assumption
required for the two-line interference correction method is quite valid.
The absorption cross section for each of these alkenes at the mid-infrared HeNe
wavelength was also measured and is shown in Fig. 5.16.
46

15
10
5
0Cro
ss S
ectio
n [m
2 /mol
]
1200800400Temperature [K]
1-Butene Propene Ethylene
Figure 5.16: Absorption cross sections for ethylene, propene, and 1-butene at 3.39µm. Solid lines are best fits to data.
5.10 Summary
The polynomial fits from Figs. 5.1 to 5.12 are given in Table 5.1, follow the form
$(T) = a + b T + c T2 + d T3, with T in K, and result in a cross section with
units of m2/mol. It should be noted that these polynomials are only valid in the
temperature region for which data was taken, with a lower temperature limit of
300 K and an upper temperature limit of 1200 K for JP-7, 1300 K for RP-2 and
iso-cetane, 1550 K for MCH, and 1400 K for RP-1, n-dodecane, and THQ.
Table 5.1: Absorption Cross Section Fits for Fuels at 3.39 µm
a b c dDodecane 22.5 0.188 -2.27)10!4 7.24)10!8
RP-1 35.9 0.0818 -8.02)10!5 1.31)10!8
RP-2 60.5 -0.0145 4.19)10!5 -3.55)10!8
JP-7 27.7 0.131 -1.49)10!4 4.40)10!8
THQ 34.5 -0.0169 0 0MCH 41.1 0.0641 -9.41)10!5 2.96)10!8
iso-Cetane 53.3 0.0484 -4.05)10!5 0
The error in the FTIR measurements is calculated from propagated uncertain-
ties resulting in magnitudes of 1% for RP-1 and JP-7, 3.5% for RP-2, and 4%
for THQ and JP-8. These were calculated from uncertainties in the measured
quantities:
47

d$ =
*!&$
&I
"2
dI2 +
!&$
&Io
"2
dI2o +
!&$
&T
"2
dT 2 +
!&$
&P
"2
dP 2 +
!&$
&L
"2
dL2
(5.3)
Similarly calculated propagated uncertainties for the cross sections obtained in
shock experiments depend more on temperature than on fuel identity; near 1000
K, uncertainty is 5%, but at 1400 K, this has increased to approximately 20%.
This is due mainly to the increase in uncertainty in the region 5 absorbance re-
quired to solve Eq. 5.2 for the region 5 cross section. At higher temperatures,
the decomposing fuel means that the value of the region 5 absorbance must be
obtained from a backwards extrapolation to time zero, which results in a larger
uncertainty in the region 5 absorbance and thus the region 5 cross section, as well.
The uncertainties shown in figures throughout this dissertation are all propagated
uncertainties calculated similarly.
With knowledge of the cross section as a function of temperature, the trans-
mission through the test gas mixture, and the path length through the tube, quan-
titative measurements of fuel concentration in the shock tube can be made.
A comparison of all fuels measured in the FTIR (Fig. 5.17a) shows the slight
di!erence in spectra between the kerosenes, and the drastic di!erence between
all the fuels and the additive THQ, which is expected due to its much di!erent
chemical structure. Since comparing all measured data on the same plot would be
too dense to make useful observations, a comparison of the polynomial fits to the
3.39 µm cross sections for the fuels studied here is given in Fig. 5.17b.
48

120
80
40
0Cro
ss S
ectio
n [m
2 /mol
]
3.63.53.43.33.2Wavelength [µm]
JP-7 (474 K) JP-8 (474 K) RP-1 (448 K) RP-2 (450 K) THQ (472 K)
(a)
80
60
40
20
0Cro
ss S
ectio
n [m
2 /mol
]
200016001200800400Temperature [K]
n-Dodecane RP-1 RP-2 JP-7 THQ MCH iso-Cetane
(b)
Figure 5.17: Comparison of absorption cross sections for all fuels studied. a) FTIR-measured absorption spectra from 3.2 µm to 3.6 µm for all measured fuels near 450K. b) Polynomial best-fits to measured cross sections as a function of temperatureat 3.39 µm for all fuels studied.
49

Chapter 6
Shock Experiments on Six Fuels
6.1 RP-1
RP-1 is the standard U.S. rocket kerosene; its properties are defined by military
specification [89], and further details are given in the CPIA/M4 Liquid Propellant
Manual [84]. Its composition is somewhat variable as discussed by Billingsley et
al. [7] and Huber et al. [41] and therefore it is important to note that the RP-1 uti-
lized for all experiments conducted in this study was taken from lot # SH2421LS05,
which was acquired from Matthew Billingsley at the Air Force Research Labora-
tory.
6.1.1 Facilities and Diagnostics
RP-1 decomposition experiments were performed in both the AST and the HPST.
The AST experiments utilized the HeNe and near-infrared diode lasers resulting
in fuel measurements. Two sample AST RP-1 time histories are shown in Fig. 6.1.
Figure 6.1a is an example of how a shock is used to determine high-temperature fuel
cross sections. Since no decomposition occurs during the first 600 µs, the region
5 absorbance is easily extracted and the region 5 cross section can be determined
with the method explained in Chapter 5. Figure 6.1b shows a shock for which
decomposition has begun. In this case, the initial region 5 absorbance is determined
by extrapolating the region 5 absorbance back to time zero. At temperatures
such that decomposition occurs quickly, this extrapolation can lead to significant
uncertainties in the high-temperature cross section as can be seen in Fig. 5.1.
50

1.0
0.8
0.6
0.4
0.2
0.0
Abso
rban
ce
6004002000-200-400Time [µs]
Incident Shock
Reflected Shock
3.39 µm
1340 nm
(a)
1.61.41.21.00.80.60.40.20.0
Abso
rban
ce
1.51.00.50.0-0.5Time [ms]
Incident Shock
Reflected Shock
3.39 µm
1340 nm
(b)
Figure 6.1: RP-1 pyrolysis in the AST, 0.3% RP-1 in argon. a) Low-temperatureshock, 4.6 atm, 1000 K. b) High-temperature shock, 7.4 atm, 1220 K.
The HPST experiments required only the HeNe laser for fuel measurements.
However, a set of HPST experiments near 20 atm utilized the HeNe and CO2
lasers for simultaneous measurements of fuel and ethylene. Sample absorbance
time histories from the HPST data set are shown in Fig. 6.2.
0.8
0.6
0.4
0.2
0.0
Abso
rban
ce
2.01.51.00.50.0-0.5Time [ms]
3.39 µm
10.675 µm
10.532 µm
Figure 6.2: RP-1 pyrolysis in the HPST, 1262 K, 18.4 atm, 0.17% RP-1 in argon.
6.1.2 Fuel Measurements
Fuel time histories and overall fuel decomposition rates are reported here for both
the AST and HPST data sets. Low- and high-pressure fuel time histories are given
51

in Fig. 6.3. These were calculated from the measured absorbance using the method
described in Chapter 3. As expected, the higher the temperature, the faster the
fuel is removed.
1.0
0.8
0.6
0.4
0.2
0.0
X RP-
1/Xo,
RP-
1
1.61.20.80.40.0Time [ms]
1249 K1151 K
1136 K
1097 K
1089 K
(a)
1.0
0.8
0.6
0.4
0.2
0.0
X RP-
1/Xo,
RP-
1
2.01.51.00.50.0Time [s]
1252 K1218 K
1185 K
1165 K1142 K
1099 K
(b)
1.0
0.8
0.6
0.4
0.2
0.0
X RP-
1/Xo,
RP-
1
2.0x10-31.51.00.50.0Time [s]
1367 K
1251 K1222 K
1159 K
1123 K
1036 K
(c)
1.0
0.8
0.6
0.4
0.2
0.0
X RP-
1/Xo,
RP-
1
2.01.51.00.50.0Time [ms]
1154 K
1157 K
1206 K1262 K
1320 K
(d)
Figure 6.3: Measured RP-1 fuel time histories in a) the AST, 1089 to 1249 K, 4.2to 8.0 atm, 0.24 to 0.48% RP-1 in argon, b) the AST, 1099 to 1252 K, 6.8 to 7.8atm, 0.26 to 0.58% RP-1 in argon, c) the HPST, 1036 to 1367 K, 23.5 to 51.1 atm,0.1 to 0.18% RP-1 in argon, and d) the HPST, 1154 to 1320 K, 18.4 to 20.4 atm,0.14 to 0.17% RP-1 in argon.
The measured overall fuel decomposition rate from both shock tubes is shown
in Fig. 6.4, with the AST data in the 3-8 atm pressure range and the HPST
data in the 18-52 atm pressure range. These overall fuel decomposition rates were
determined from the first approximately 0.3 ms of the time histories in Fig. 6.3.
After this point, the time histories begin to deviate from what is expected for first-
52
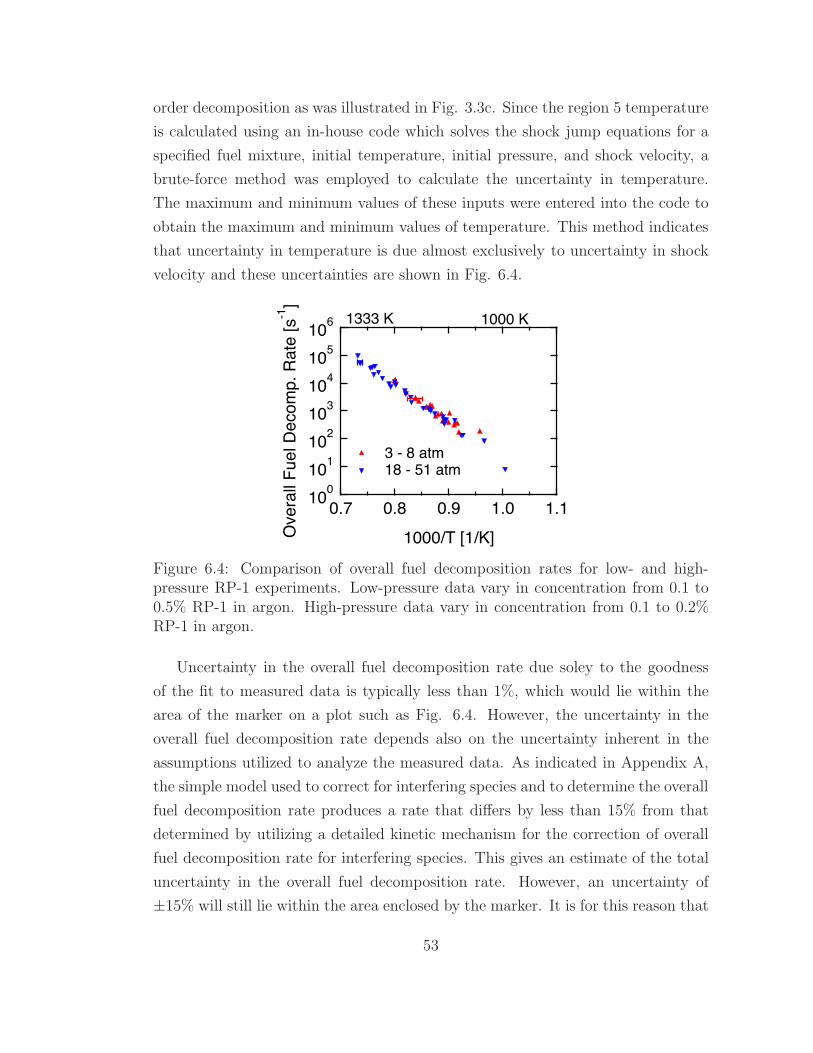
order decomposition as was illustrated in Fig. 3.3c. Since the region 5 temperature
is calculated using an in-house code which solves the shock jump equations for a
specified fuel mixture, initial temperature, initial pressure, and shock velocity, a
brute-force method was employed to calculate the uncertainty in temperature.
The maximum and minimum values of these inputs were entered into the code to
obtain the maximum and minimum values of temperature. This method indicates
that uncertainty in temperature is due almost exclusively to uncertainty in shock
velocity and these uncertainties are shown in Fig. 6.4.
100101102103104105106
Ove
rall
Fuel
Dec
omp.
Rat
e [s
-1]
1.11.00.90.80.71000/T [1/K]
3 - 8 atm 18 - 51 atm
1333 K 1000 K
Figure 6.4: Comparison of overall fuel decomposition rates for low- and high-pressure RP-1 experiments. Low-pressure data vary in concentration from 0.1 to0.5% RP-1 in argon. High-pressure data vary in concentration from 0.1 to 0.2%RP-1 in argon.
Uncertainty in the overall fuel decomposition rate due soley to the goodness
of the fit to measured data is typically less than 1%, which would lie within the
area of the marker on a plot such as Fig. 6.4. However, the uncertainty in the
overall fuel decomposition rate depends also on the uncertainty inherent in the
assumptions utilized to analyze the measured data. As indicated in Appendix A,
the simple model used to correct for interfering species and to determine the overall
fuel decomposition rate produces a rate that di!ers by less than 15% from that
determined by utilizing a detailed kinetic mechanism for the correction of overall
fuel decomposition rate for interfering species. This gives an estimate of the total
uncertainty in the overall fuel decomposition rate. However, an uncertainty of
±15% will still lie within the area enclosed by the marker. It is for this reason that
53

vertical error bars are not included in plots such as Fig. 6.4.
It is apparent here that for RP-1, this overall fuel decomposition rate has no
significant pressure dependence and no significant dependence on concentration
over the mole fraction range of 0.1 to 0.5% fuel, which is the expected behavior
for a first-order reaction.
6.1.3 Ethylene Measurements
Presented in Fig. 6.5a are the ethylene time histories that were measured during
the set of HPST RP-1 decomposition experiments performed near 20 atm. These
are given in normalized form as ethylene yield, which is defined here as the ethylene
mole fraction divided by the initial fuel mole fraction. Plotting in this manner
allows comparison between temperatures. The initial fuel mole fractions for each
shock are given in Appendix B. Figure 6.5b shows the peak ethylene yields during
RP-1 decomposition. Peak ethylene yield is defined here as the plateau value of the
ethylene mole fraction (or the peak value if the experiment is hot enough that once
formed, the ethylene starts to decompose) divided by the initial fuel mole fraction.
For the lower temperature data, if no plateau was achieved within the first two
milliseconds after the reflected shock, an exponential was fit to the ethylene mole
fraction for the first two milliseconds and the plateau of this exponential was used
to calculate a peak ethylene yield.
2.5
2.0
1.5
1.0
0.5
0.0
Ethy
lene
Yie
ld
2.01.51.00.50.0Time [ms]
1320 K 1262 K
1206 K1154 K
1157 K
(a)
2.5
2.0
1.5
1.0
0.5
0.0Peak
Eth
ylen
e Yi
eld
14001300120011001000Temperature [K]
(b)
Figure 6.5: Measured ethylene time histories during RP-1 decomposition, 18.4 -20.4 atm, 0.14 - 0.17% fuel in argon a) time histories b) peak ethylene yields.
54

Since the results shown in Fig. 6.5a are calculated from the di!erence between
two measured absorbance time histories (see Eq. (3.11)), the noise in the resulting
ethylene time histories is a convolution of that from both measurements. This will
only be the case for RP-1 and MCH since dodecane does not require interference
correction for the ethylene diagnostic and iso-cetane utilizes an alternate analysis
for the ethylene diagnostic.
6.1.4 Discussion of Findings
Of particular importance was the finding that the RP-1 first-order overall fuel
decomposition rate is independent of pressure above 3 atm over at least an order
of magnitude (3 - 52 atm). This observation can be interpreted by utilizing a simple
model for describing unimolecular decomposition, the Lindemann mechanism:
A +Mkf%'(%kb
A‡ +M
A‡ kp%' products (6.1)
where A is the molecule undergoing unimolecular decomposition, A‡ is an ac-
tivated state of A, and M is a collisional partner. This simple mechanism
describes the pressure dependence of a unimolecular reaction at low pressures
(d[A]/dt = %kf [A][M ]) and also indicates the existence of a high-pressure limit,
where the unimolecular decomposition rate is no longer pressure dependent
(d[A]/dt = %kfkp[A]/kb). Although these RP-1 measurements are sensitive to
all of the elementary reactions that remove fuel, and are therefore not a measure
of a single rate, this result indicates that all of these fuel-removal reactions are in
the high-pressure limit.
For the high-pressure experiments with measurements of both fuel and ethy-
lene, a carbon balance can be used to determine the fraction of carbon that is ac-
counted for by fuel and ethylene. Figure 6.6 shows an example experiment and its
corresponding carbon balance (assuming that RP-1 contains on average 12 carbon
atoms). For this RP-1 experiment, ethylene accounts for approximately 35% of the
total carbon in the system 2 ms after the arrival of the reflected shock. Although
the formation of an RP-1 surrogate and a mechanism to utilize this surrogate will
not be thoroughly discussed until Chapter 8, it will be mentioned here that the sur-
55
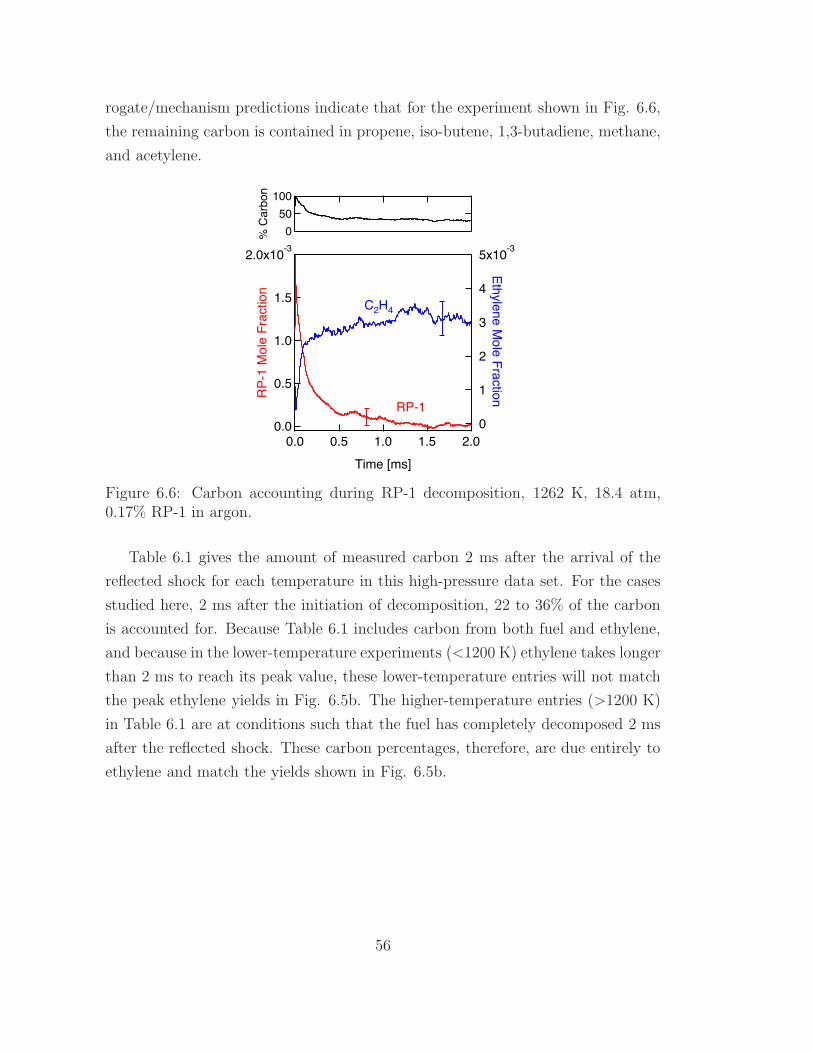
rogate/mechanism predictions indicate that for the experiment shown in Fig. 6.6,
the remaining carbon is contained in propene, iso-butene, 1,3-butadiene, methane,
and acetylene.
2.0x10⁻³
1.5
1.0
0.5
0.0
RP-
1 M
ole
Frac
tion
2.01.51.00.50.0Time [ms]
5x10⁻³
4
3
2
1
0
Ethylene Mole Fraction
10050
0% C
arbo
n
RP-1
C2H4
Figure 6.6: Carbon accounting during RP-1 decomposition, 1262 K, 18.4 atm,0.17% RP-1 in argon.
Table 6.1 gives the amount of measured carbon 2 ms after the arrival of the
reflected shock for each temperature in this high-pressure data set. For the cases
studied here, 2 ms after the initiation of decomposition, 22 to 36% of the carbon
is accounted for. Because Table 6.1 includes carbon from both fuel and ethylene,
and because in the lower-temperature experiments (<1200 K) ethylene takes longer
than 2 ms to reach its peak value, these lower-temperature entries will not match
the peak ethylene yields in Fig. 6.5b. The higher-temperature entries (>1200 K)
in Table 6.1 are at conditions such that the fuel has completely decomposed 2 ms
after the reflected shock. These carbon percentages, therefore, are due entirely to
ethylene and match the yields shown in Fig. 6.5b.
56

Table 6.1: Carbon accounting during RP-1 decomposition (2 ms)
Temperature % of Total carbon in RP-1[K] and C2H4 at 2 ms1154 281157 251206 221262 351320 36
57

6.2 RP-2
RP-2 is a newly-defined rocket kerosene [89] that meets all of the specifications
for RP-1, but has more stringent allowances on sulfur content and olefin fraction
intended to improve the thermal stability of the fuel and decrease its coking ten-
dency. It is not yet in commercial use. Lot # WC0721HW01, used in this work,
was a lab-scale batch intended for research purposes.
6.2.1 Facilities and Diagnostics
The HeNe and near-IR diode laser diagnostics were employed to measure fuel time
histories and overall fuel decomposition rates. A sample data trace is shown in
Fig. 6.7.
1.5
1.0
0.5
0.0
Abso
rban
ce
3210-1Time [ms]
3.39 µm670 nm
Figure 6.7: RP-2 pyrolysis in the AST, 0.28% RP-2 in argon, 7.1 atm, 1215 K.
Because the initial pyrolytic chemistry of RP-2 is so similar to that of RP-1,
RP-2 was not studied at high pressures.
6.2.2 Fuel Measurements
RP-2 fuel time histories were measured in the AST from 1100 to 1367 K and are
shown in Fig. 6.8a; the corresponding overall fuel decomposition rates are included
in Fig. 6.8b.
58

1.0
0.8
0.6
0.4
0.2
0.0
X RP-
2Xo,
RP-
2
2.01.51.00.50.0Time [ms]
1367 K 1254 K
1216 K1147 K
1099 K
(a)
102
103
104
105
106
Ove
rall
Fuel
Dec
omp.
Rat
e [s
-1]
1.00.90.80.7
1000/T [1/K]
1053 K1333 K
(b)
Figure 6.8: RP-2 decomposition, 0.2 - 0.4% RP-2 in argon, 6.4 - 7.6 atm, 1100 -1367 K. a) Measured RP-1 fuel time histories. b) Overall fuel decomposition rates.
6.2.3 Discussion of Findings
RP-2 decomposition shock experiments were performed in the AST over the 6.4 to
7.6 atm pressure range. RP-2 di!ers from RP-1 only in that its specification has a
lower allowable sulfur content and a lower allowable fraction of olefins; the resulting
class composition for RP-1 and RP-2 is practically the same [7]. This di!erence in
specification, although it results in a decrease in catalytic coke formation, has little
to do with the initial fuel pyrolysis. Therefore, it is logical that in terms of initial
decomposition, RP-2 behavior is quite similar to that of RP-1. This is indeed the
case, as shown in Fig. 6.9 where it is apparent that the RP-1 and RP-2 overall
fuel decomposition rates are nearly identical. This was also found to be the case
at the lower temperatures studied by Widegren and Bruno [13].
59

100101102103104105106
Ove
rall
Fuel
Dec
omp.
Rat
e [s
-1]
1.00.90.80.71000/T [1/K]
RP-1 RP-2
1333 K 1000 K
Figure 6.9: Overall fuel decomposition rates for RP-1 and RP-2. Pressure range 3to 51 atm, 0.1 to 0.5% fuel in argon.
60

6.3 JP-7
JP-7 is a kerosene with properties quite similar to those of RP-1. Its specifica-
tion [90] was created to provide a fuel with high thermal stability for use in the
supersonic SR-71 Blackbird [103]. It has since been used in the X-51 experimen-
tal supersonic vehicle [104], but is no longer in production. The work here was
completed with a sample from the last remaining batch, POSF 3327.
6.3.1 Facilities and Diagnostics
JP-7 decomposition experiments were carried out in the AST over the 4.4 to 5.2
atm pressure range. The mid-IR HeNe and near-IR diode lasers were used to
measure fuel. A sample data trace is shown in Fig. 6.10.
0.4
0.3
0.2
0.1
0.0
Abso
rban
ce
2.01.00.0Time [ms]
3.39 µm
670 nm
Figure 6.10: JP-7 pyrolysis in the AST, 1152 K, 4.5 atm, 0.16% JP-7 in argon.
6.3.2 Fuel Measurements
JP-7 time histories are shown in Fig. 6.11a for temperatures from 1083 to 1176 K.
These time histories have been corrected for interfering species using the method
described in Appendix A. As expected, as temperature increases, so does the rate
of removal of JP-7.
61

1.0
0.8
0.6
0.4
0.2
X JP-
7/Xo,
JP-7
2.01.51.00.50.0Time [ms]
1176 K1152 K
1107 K1113 K
1083 K
(a)
101
102
103
104
Ove
rall
Fuel
Dec
omp.
Rat
e [1
/s]
0.940.920.900.880.860.84
1000/T [1/K]
1086 K1163 K
(b)
Figure 6.11: JP-7 decomposition, 0.13 - 0.19% JP-7 in argon, 4.4 - 5.2 atm, 1083 -1176 K. a) Measured JP-7 fuel time histories. b) Overall fuel decomposition rates.
6.3.3 Discussion of Findings
The overall fuel decomposition rates shown in Fig. 6.11b are compared to those for
RP-1 in Fig. 6.12. As shown in the data obtained here, JP-7 decomposes slightly
slower than RP-1.
100101102103104105106
Ove
rall
Fuel
Dec
omp.
Rat
e [s
-1]
1.11.00.90.80.71000/T [1/K]
RP-1 JP-7
1333 K 1000 K
Figure 6.12: Overall fuel decomposition rates for JP-7 and RP-1. Pressure range3 to 51 atm, 0.1 to 0.5% fuel in argon.
62

6.4 n-Dodecane
Dodecane is an important species to consider in the study of kerosene fuels. Its
molecular formula very nearly matches the approximate value given for many
kerosenes and it is commonly used as a single-component surrogate for ignition
studies of kerosenes. Numerous previous studies of dodecane have reported de-
composition rates (see Chapter 2), but none at the combination of high pressures
and temperatures reported here. The wide range of pressures considered in this
study allows discussion of the pressure dependence of the decomposition of dode-
cane, and the existence of multiple kinetic mechanisms for modeling its chemistry
provides a method for predicting its product distribution.
6.4.1 Facilities and Diagnostics
Dodecane decomposition experiments were carried out in both the AST and the
HPST. The AST experiments utilized the HeNe and near IR diode lasers for fuel
measurements while the HPST experiments utilized only the HeNe for fuel mea-
surements. A set of HPST experiments completed near 20 atm also employed
the CO2 laser for measurements of ethylene. A sample data trace for dodecane
decomposition in each shock tube is shown in Fig. 6.13.
1.5
1.0
0.5
0.0
Abso
rban
ce
1.51.00.50.0-0.5Time [ms]
1.34 µm
3.39 µm
(a)
0.6
0.5
0.4
0.3
0.2
0.1
0.0
Abso
rban
ce
2.01.51.00.50.0Time [ms]
3.39 µm
10.675 µm
10.532 µm
(b)
Figure 6.13: Dodecane pyrolysis in a) the AST, 1226 K, 8.0 atm, 0.3% dodecanein argon and b) the HPST, 1306 K, 17.2 atm, 0.17% dodecane in argon.
63

6.4.2 Fuel Measurements
Dodecane fuel time histories at various pressure ranges are shown in Fig. 6.14 for
temperatures between 1110 and 1522 K. A series of experiments was performed
near 20 atm and these also included the measurement of ethylene, which will be
discussed in the next section; the fuel time histories for those experiments are
shown in Fig. 6.14d.
1.0
0.8
0.6
0.4
0.2
0.0
X C12
H26/X
o,C
12H
26
2.01.51.00.50.0Time [ms]
1292 K1252 K
1189 K
1214 K
1150 K
(a)
1.0
0.8
0.6
0.4
0.2
0.0
X C12
H26/X
o,C
12H
26
2.01.51.00.50.0Time [ms]
1110 K
1116 K
1212 K
1311 K
1387 K
1502 K
(b)
1.0
0.8
0.6
0.4
0.2
0.0
X C12
H26/X
o, C
12H
26
2.01.51.00.50.0Time [ms]
1381 K
1328 K1286 K 1233 K
1197 K
(c)
1.0
0.8
0.6
0.4
0.2
0.0
X C12
H26/X
o,C
12H
26
1.00.80.60.40.20.0Time [ms]
1306 K
1366 K
1522 K
1208 K
1138 K
(d)
Figure 6.14: Measured dodecane fuel time histories in a) the AST, 1150 to 1292 K,4.5 to 8.0 atm, 0.21 to 0.36% dodecane in argon, b) the AST, 1110 to 1502 K, 6.6to 7.9 atm, 0.19 to 0.38% dodecane in argon, c) the HPST, 1197 to 1381 K, 43.6to 46.5 atm, 0.33 to 0.37% dodecane in argon, and d) the HPST, 1138 to 1522 K,17.2 to 21.4 atm, 0.11 to 0.17% dodecane in argon.
Fuel mole fraction is determined from the HeNe absorbance data using Eq.
(3.5), while the ethylene mole fraction is determined from the CO2 laser absorbance
64

data using Eq. (3.10). The experiments shown in Fig. 6.14 all follow the expected
trend that overall fuel decomposition rate increases with temperature.
The measured overall fuel decomposition rates for dodecane for a low-pressure
data set and a high-pressure data set are shown in Fig. 6.15, with the AST data in
the 4-8 atm pressure range and the HPST data in the 43-46 atm pressure range.
1022
4
1032
4
1042
4
105
Ove
rall
Fuel
Dec
omp.
Rat
e [1
/s]
0.850.800.750.701000/T [1/K]
4 - 8 atm0.1 - 0.6% C12H26 in argon
43 - 46 atm0.3 - 0.4% C12H26 in argon
1212 K1379 K
Figure 6.15: Comparison of overall fuel decomposition rates for low- and high-pressure n-dodecane experiments. Solid lines are linear fits to data.
6.4.3 Ethylene Measurements
Measurements of ethylene during dodecane decomposition were made in the HPST
at five di!erent temperatures. These ethylene time histories are shown in Fig. 6.16.
It was observed that no interference correction is necessary during dodecane
decomposition, since the ethylene mole fractions determined using both the one-
line method (Eq. (3.10)) and two-line method (Eq. (3.11)) are equivalent. Because
no correction is necessary, there must be negligible amounts of n-alkenes such as
propene and 1-butene in the products. Therefore, only a small fraction of the
absorbance at 3.39 µm can be due to these molecules, so most of the interference
at 3.39 µmmust be due to ethylene, a small alkane (methane or ethane), or possibly
1,3-butadiene, as these are the most predominant products predicted by the LLNL
- n-alkane mechanism [105]. However, if 1,3-butadiene was present in high enough
concentrations to interfere at 3.39 µm, it would also interfere at 10.5 µm (similar to
propene and 1-butene) and it is therefore likely that 1,3-butadiene is present only in
65

6
5
4
3
2
1
0Et
hyle
ne Y
ield
1.00.80.60.40.20.0Time [ms]
1138 K
1208 K1306 K
1366 K1522 K
Figure 6.16: Ethylene time histories during dodecane decomposition. 1138 - 1522K, 17.2 - 21.4 atm, 0.11 - 0.17% dodecane in argon.
negligible amounts. Acetylene is also a major product of dodecane decomposition
at higher temperatures, but does not absorb at 3.39 µm. Thus it is likely that the
only major interfering species at 3.39 µm are methane and ethane.
6.4.4 Discussion of Findings
For n-dodecane, the overall fuel decomposition rate approximately doubles for an
order of magnitude increase in pressure (5 to 50 atm). This was not unexpected,
since Rebick [106] indicates that for alkanes, “the rate constant may double as the
pressure is increased from 1 to 50-100 atm”. Fabuss et al. report no pressure de-
pendence for measured n-hexadecane first-order rate constants in the range 14 to
68 atm [107], and in a later publication report only a slight increase in first-order
rate constant with increasing pressure for fuel mixtures containing predominately
alkanes [108]. It is expected that the predominant pathways of dodecane decom-
position are the unimolecular decomposition and H-abstraction pathways. For a
unimolecular reaction near the high-pressure limit, the decomposition rate does
not vary with pressure; H-abstraction reactions are also independent of pressure.
Recalling the discussion in section 6.1.4, the observation of only a small pressure
dependence for dodecane indicates that the decomposition rate constant is rela-
tively close to the high-pressure limit for n-dodecane.
In the case of n-dodecane from 4-8 atm, where no significant pressure depen-
66

dence was observed (see Fig. 6.15), no variation in overall fuel decomposition rate
is seen with concentration (which varies from 0.1 to 0.6% fuel).
Figure 6.17 compares the first-order decomposition rates from this study of
dodecane pyrolysis to those found in the literature. As can be seen, all previous
experiments, with the exception of the work done by Klingbeil et al. [50], were
completed at lower temperatures than the current study. The solid line in Fig.
6.17 is a fit to all of the dodecane data shown, and the resulting pre-exponential
factor and activation energy for dodecane are 2.18)1012 s!1 and 223 kJ/mol, re-
spectively. In the discussion of unimolecular reactions in the high pressure limit,
reference [109] states that transition-state theory predicts pre-exponential factors
of approximately 1013 s!1 for temperatures such as those considered in the current
study. It also states that although this is the predicted value, actual measured
pre-exponential factors can vary from 1011 to 1016 s!1. The 2.18)1012 s!1 pre-
exponential factor determined for n-dodecane is therefore quite reasonable. The
activation energy determined for n-dodecane decomposition is about 30% lower
than the average bond energy of a C-C bond (335 kJ/mol).
10-7
10-5
10-3
10-1
101
103
105
107
Ove
rall
Fuel
Dec
omp.
Rat
e [1
/s]
1.61.41.21.00.80.6
1000/T [1/K]
625 K1250 K
Figure 6.17: Summary of overall fuel decomposition rates for n-dodecane. Currentstudy: 4 - 46 atm, 0.1 - 0.6% fuel in argon. Solid line is a fit to all n-dodecanedata. ( [50], " [45], ! [43], % [48], ' [49], • [46], & Current study.
To more fully understand the chemical kinetics of dodecane decomposition,
it has been modeled with the two detailed chemical kinetic mechanisms that are
listed in Table 6.2.
67

Table 6.2: Chemical kinetic mechanisms describing dodecane chemistry
Reference Mechanism Name Intended Purpose[110] JetSurF 2.0 High-temperature pyrolysis and oxidation
of n-alkanes up to C12 and high-temperaturechemistry of cycloalkanes
[105] LLNL - n-alkane Low- and high-temperature pyrolysis andoxidation of n-alkanes from C8 to C16
Figure 6.18a shows the predictions of fuel and ethylene time histories for the
JetSurF 2.0 and LLNL - n-alkane mechanisms compared to a shock experiment.
Figure 6.18b shows the peak ethylene yields for the set of dodecane decomposi-
tion shock experiments performed near 20 atm compared with the predicted peak
ethylene yields from both mechanisms.
2.0x10⁻³
1.5
1.0
0.5
0.0
Dod
ecan
e M
ole
Frac
tion
2.01.51.00.50.0Time [ms]
10x10-3
8
6
4
2
0
Ethylene Mole Fraction
LLNL n-alkane
JetSurF 2.0
C12H26
C2H4
(a)
6
5
4
3
2
1
0
Peak
Eth
ylen
e Yi
eld
18001600140012001000Temperature [K]
Current Study
JetSurF 2.0
LLNLn-alkane
(b)
Figure 6.18: Dodecane decomposition, comparison with kinetic mechanisms. a)1306 K, 17.2 atm, 0.17% dodecane in argon, solid lines are simultaneous measure-ment of fuel and ethylene mole fractions, dashed lines are model-predicted molefractions. b) Measured and modeled ethylene yields as a function of temperature,modeled yields were calculated at 19 atm and 0.14% dodecane in argon.
Here, peak ethylene yield is defined as the final mole fraction of ethylene (the
plateau value, or peak value if the conditions are hot enough that once formed,
the ethylene decomposes), divided by the initial fuel mole fraction. Therefore, this
ethylene yield is the number of ethylene molecules formed from the decomposition
of one molecule of fuel. For dodecane, the maximum possible ethylene yield is six.
These mechanisms tend to overpredict the initial decomposition rate of dodecane
and underpredict the peak ethylene yield. The average initial fuel mole fraction
68

and pressure from the shock experiments (1400 ppm, 19 atm) was used to calculate
the modeled curves in Fig. 6.18b for both mechanisms. The error shown in Fig.
6.18b is a propagated uncertainty, calculated by the same method described in
section 5.10.
For the 20 atm experiments with measurements of both fuel and ethylene, a
carbon balance can be used to determine the fraction of carbon that is accounted
for by fuel and ethylene. Fig. 6.19 shows the carbon accounting for the experiment
from Fig. 6.18a.
2.0x10⁻³
1.5
1.0
0.5
0.0
Dod
ecan
e M
ole
Frac
tion
2.01.51.00.50.0
Time [ms]
10x10-3
8
6
4
2
0
Ethylene Mole Fraction
10050
0% C
arbo
n
C2H4
C12H26
Figure 6.19: Carbon accounting during n-dodecane decomposition, 1306 K, 17.2atm, 0.17% n-dodecane in argon.
For this dodecane experiment, ethylene accounts for approximately 77% of the
total carbon in the system. Table 6.3 gives the amount of measured carbon 2
ms after the arrival of the reflected shock for each temperature in this 20 atm
data set. For the cases studied here, ethylene composes the majority of the n-
dodecane decomposition products. Because the ethylene diagnostic showed no
interference from species with constant cross sections between the P14 and P28
lines (propene, 1-butene, and 1,3-butadiene), the mole fractions of such alkenes
and dienes must be negligible. According to the JetSurF 2.0 mechanism (see Fig.
6.20b), the only predominant products that are not alkenes or dienes are small
alkanes (and acetylene at high temperatures). It is therefore highly likely that the
unaccounted carbon from Table 6.3 is contained in methane and/or ethane, with
69
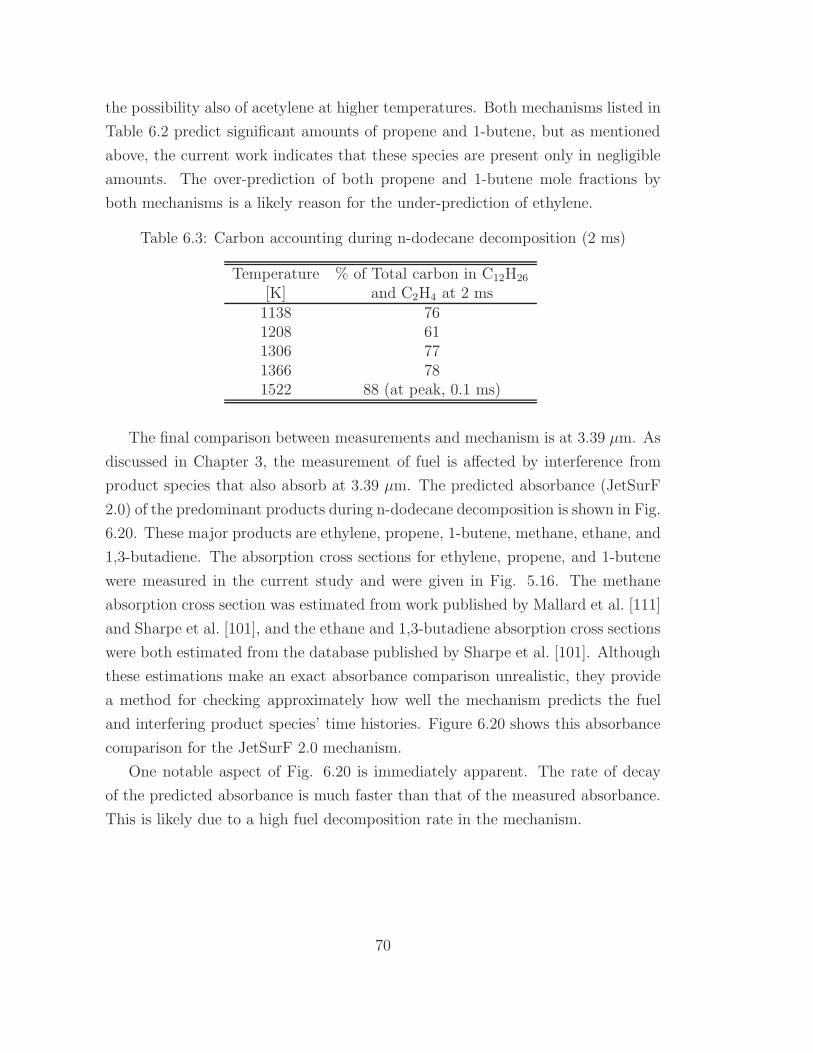
the possibility also of acetylene at higher temperatures. Both mechanisms listed in
Table 6.2 predict significant amounts of propene and 1-butene, but as mentioned
above, the current work indicates that these species are present only in negligible
amounts. The over-prediction of both propene and 1-butene mole fractions by
both mechanisms is a likely reason for the under-prediction of ethylene.
Table 6.3: Carbon accounting during n-dodecane decomposition (2 ms)
Temperature % of Total carbon in C12H26
[K] and C2H4 at 2 ms1138 761208 611306 771366 781522 88 (at peak, 0.1 ms)
The final comparison between measurements and mechanism is at 3.39 µm. As
discussed in Chapter 3, the measurement of fuel is a!ected by interference from
product species that also absorb at 3.39 µm. The predicted absorbance (JetSurF
2.0) of the predominant products during n-dodecane decomposition is shown in Fig.
6.20. These major products are ethylene, propene, 1-butene, methane, ethane, and
1,3-butadiene. The absorption cross sections for ethylene, propene, and 1-butene
were measured in the current study and were given in Fig. 5.16. The methane
absorption cross section was estimated from work published by Mallard et al. [111]
and Sharpe et al. [101], and the ethane and 1,3-butadiene absorption cross sections
were both estimated from the database published by Sharpe et al. [101]. Although
these estimations make an exact absorbance comparison unrealistic, they provide
a method for checking approximately how well the mechanism predicts the fuel
and interfering product species’ time histories. Figure 6.20 shows this absorbance
comparison for the JetSurF 2.0 mechanism.
One notable aspect of Fig. 6.20 is immediately apparent. The rate of decay
of the predicted absorbance is much faster than that of the measured absorbance.
This is likely due to a high fuel decomposition rate in the mechanism.
70

0.6
0.4
0.2
0.0
Abso
rban
ce
2.01.51.00.50.0Time [ms]
Measured Sum of Modeled C12H26
(a)
0.16
0.12
0.08
0.04
0.00
Abso
rban
ce
2.01.51.00.50.0Time [ms]
CH4 C2H6 C2H4
C3H6 C4H6 1-C4H8
(b)
Figure 6.20: Comparison of model-predicted (JetSurf 2.0) and measured ab-sorbance at 3.39 µm during n-dodecane decomposition, 1306 K, 17.2 atm, 0.17%n-dodecane in argon. a) Measured absorbance, calculated modeled absorbancetime histories for major product species. b) Detailed view of the individual con-tributions in a).
71

6.5 Methylcyclohexane (MCH)
Studying the various components that make up RP-fuels gives insight into how
the fuel itself behaves. MCH has been included in this study as a representative
cycloalkane since cycloalkanes make up approximately 55% of the hydrocarbons in
RP-fuels [7] (see Table 8.1).
6.5.1 Facilities and Diagnostics
MCH experiments were carried out in the HPST. The HeNe and CO2 lasers were
employed for measurements of fuel and ethylene, respectively. All experiments
were performed near 20 atm and a sample data trace is shown in Fig. 6.21.
0.75
0.50
0.25
0.00
Abso
rban
ce
2.01.51.00.50.0Time [ms]
3.39 µm
10.675 µm
10.532 µm
Figure 6.21: MCH pyrolysis in the HPST, 1337 K, 20.1 atm, 0.2% MCH in argon.
6.5.2 Fuel Measurements
The fuel time histories for the four MCH shock experiments performed in the
current study are shown in Fig. 6.22a and the corresponding overall fuel decom-
position rates are shown in Fig. 6.22b. Once again it is noted that the overall fuel
decomposition rate increases rapidly with increasing temperature.
72

1.0
0.8
0.6
0.4
0.2
0.0
X MC
H/X
o, M
CH
1.00.80.60.40.20.0Time [ms]
1255 K
1337 K
1523 K
1423 K
(a)
102
103
104
105
Dec
ompo
sitio
n R
ate
[1/s
]
0.90.80.70.61000/T [1/K]
1538 K 1176 K
(b)
Figure 6.22: MCH decomposition, 1255 to 1523 K, 18.7 to 21.3 atm, 0.2% MCHin argon. a) Fuel time histories b) Overall fuel decomposition rates.
At the highest temperature studied here, 1523 K, species such as methane
(predicted to be a major product by both the LLNL - MCH and JetSurF 2.0
mechanims) interfere with the fuel mole fraction measurement at times longer
than 0.5 ms. For this reason, the fuel mole fraction for the highest temperature
experiment shown in Fig. 6.22a, is shown only until 0.5 ms.
6.5.3 Ethylene Measurements
The two-line correction method was necessary for measurement of ethylene, indi-
cating the presence of species such as propene and 1-butene amongst the products.
All of the ethylene time histories shown in Fig. 6.23a have been corrected for in-
terference from such species. The corresponding peak ethylene yields are shown
in Fig. 6.23b. Once again, it is noted that for ethylene time histories that do not
plateau before 2 ms, an exponential is fit to those first 2 ms and the plateau of
this fit is taken as the peak yield. Since the results shown in Fig. 6.23a are cal-
culated from the di!erence between two measured absorbance time histories (see
Eq. (3.11)), the noise in the resulting ethylene time histories is a convolution of
that from both measurements. This is only be the case for MCH and RP-1 since
dodecane does not require interference correction for the ethylene diagnostic and
iso-cetane utilizes an alternate analysis for the ethylene diagnostic.
73

2.0
1.5
1.0
0.5
0.0
Ethy
lene
Yie
ld
0.50.40.30.20.10.0Time [ms]
1523 K
1423 K1337 K
1255 K
(a)
2.0
1.5
1.0
0.5
0.0
Peak
Eth
ylen
e Yi
eld
160014001200Temperature [K]
(b)
Figure 6.23: MCH decomposition, 1255 to 1523 K, 18.7 to 21.3 atm, 0.2% MCHin argon. a) Ethylene time histories b) Peak ethylene yields (calculated from 2 msof ethylene time history).
6.5.4 Discussion of Findings
These results have been modeled with two detailed kinetic mechanisms that are
listed in Table 6.4. The JetSurF 2.0 mechanism includes chemistry of both do-
decane and MCH and is therefore once again employed here. The LLNL - MCH
mechanism was compiled from high-temperature MCH work by Orme et al. [59]
and low-temperature chemistry described by Pitz et al. [95].
Table 6.4: Chemical kinetic mechanisms describing MCH chemistry
Reference Mechanism Name Intended Purpose[110] JetSurF 2.0 High-temperature pyrolysis and oxidation
of n-alkanes up to C12 and high-temperaturechemistry of cycloalkanes
[95] LLNL - MCH MCH oxidation
Figure 6.24a shows a comparison between experimentally-measured fuel and
ethylene time histories at 1337 K and those predicted by the JetSurF 2.0 and
LLNL - MCH mechanisms. The LLNL - MCH mechanism better captures both
time histories. JetSurF 2.0 predicts much faster fuel decomposition than that
measured. This would result in an early formation of products such as ethylene,
which is observed in the JetSurF-predicted early peak in the ethylene mole fraction.
74

Figure 6.24b reports peak ethylene yields for MCH decomposition. Once again,
peak ethylene yield is defined as the final mole fraction of ethylene divided by the
initial fuel mole fraction and is therefore the number of ethylene molecules formed
from the decomposition of one molecule of fuel. For MCH, the maximum possible
ethylene yield is 3.5. Ethylene yield is relatively well-captured by LLNL-MCH for
the range of temperatures studied here, although neither mechanism matches the
initial ethylene formation rate.
2.0x10⁻³
1.5
1.0
0.5
0.0
MC
H M
ole
Frac
tion
2.01.51.00.50.0Time [ms]
4x10⁻³
3
2
1
0
Ethylene Mole Fraction
MCH
JetSurF 2.0
C2H4
LLNLMCH
(a)
3.0
2.5
2.0
1.5
1.0
0.5
0.0
Peak
Eth
ylen
e Yi
eld
16001500140013001200
Temperature [K]
JetSurF 2.0
LLNL-MCH
Current Study
(b)
Figure 6.24: Comparison of measured and modeled MCH decomposition, a) 1337K, 20.1 atm, 0.2% MCH in argon, solid lines are simultaneous measurement offuel and ethylene mole fractions, dashed lines are model-predicted mole fractions.b) Measured and modeled ethylene yields as a function of temperature, modeledyields were calculated at 20 atm and 0.2% MCH in argon.
For the 20 atm experiments with measurements of both fuel and ethylene, a
carbon balance can be used to determine the fraction of carbon that is accounted for
by fuel and ethylene. Figure 6.25 shows the carbon accounting for the experiment
from Fig. 6.24a. For this MCH experiment, ethylene accounts for approximately
32% of the total carbon in the system at 2 ms. Table 6.5 gives the amount of
measured carbon 2 ms after the arrival of the reflected shock for each temperature
in this 20 atm data set. For the cases studied here, although ethylene is a primary
product of MCH decomposition, it is not nearly as prevalent as it is during n-
dodecane decomposition. This could be because ethylene is one of only a few major
products during n-dodecane decomposition (the others being methane, ethane,
75

and acetylene, see section 6.4.4), while the major products of MCH are more
numerous. Both the LLNL - MCH and JetSurF 2.0 mechanisms predict ethylene
as the primary product and propene as a less abundant, but still major, product.
However, these mechanisms di!er slightly in their prediction of the identities of
other major products. LLNL - MCH predicts that 1,3-butadiene and methane are
major constituents of the product mixture, while JetSurF 2.0 predicts 1-butene and
acetylene. At the highest temperature studied here, near 1500 K, both mechanisms
predict large amounts of acetylene and methane, and benzene also appears as a
significant product.
2.0x10⁻³
1.5
1.0
0.5
0.0
MC
H M
ole
Frac
tion
2.01.51.00.50.0
Time [ms]
10x10-3
8
6
4
2
0
Ethylene Mole Fraction
10050
0% C
arbo
n
C2H4
MCH
Figure 6.25: Carbon accounting during MCH decomposition, 1337 K, 20.1 atm,0.2% MCH in argon.
Table 6.5: Carbon accounting during MCH decomposition (2 ms)
Temperature % of Total carbon in MCH[K] and C2H4 at 2 ms1255 191337 321423 301523 45
76

6.6 2,2,4,4,6,8,8-Heptamethylnonane
(iso-Cetane)
Once again, the study of the components that make up RP-fuels can lead to a
better understanding of the RP-fuel itself. In addition to the cycloalkanes already
discussed, approximately 39% of the hydrocarbons in RP-fuels are iso-alkanes [7]
(see Table 8.1), and iso-cetane is included here as a representative iso-alkane.
6.6.1 Facilities and Diagnostics
Iso-cetane experiments were carried out in the HPST. The HeNe and CO2 lasers
were employed for measurements of fuel and ethylene, respectively. All experi-
ments were performed near 20 atm; a sample data trace is shown in Fig. 6.26,
which clearly shows that the absorbance time histories at P14 and P28 are nearly
equivalent for iso-cetane decomposition.
1.0
0.8
0.6
0.4
0.2
0.0
Abso
rban
ce
2.01.51.00.50.0Time [ms]
3.39 µm
10.675 µm10.532 µm
Figure 6.26: iso-Cetane pyrolysis in the HPST, 1195 K, 21.4 atm, 0.15% iso-cetanein argon.
6.6.2 Fuel Measurements
Fuel time histories for iso-cetane decomposition experiments performed at six tem-
peratures are shown in Fig. 6.27a. The corresponding overall fuel decomposition
rates are shown in Fig. 6.27b.
77

1.0
0.8
0.6
0.4
0.2
0.0
Nor
mal
ized
Iso-
ceta
ne M
ole
Frac
tion
1.00.80.60.40.20.0Time [ms]
992 K
1048 K
1072 K
1109 K1195 K
1237 K
(a)
101
102
103
104
105
106
Dec
ompo
sitio
n R
ate
[1/s
]
1.000.900.800.701000/T [1/K](b)
Figure 6.27: iso-Cetane decomposition, 992 to 1237 K, 20.3 to 22.5 atm, 0.13 to0.16% iso-cetane in argon. a) Fuel time histories b) Overall fuel decompositionrates.
6.6.3 Ethylene Measurements
The ethylene diagnostic was also employed during the decomposition of iso-cetane,
and it was determined that very little ethylene was formed for all of the conditions
studied. As this conclusion requires further discussion, the analysis of the results
from the ethylene diagnostic will be discussed in the next section.
6.6.4 Discussion of Findings
Fuel and ethylene time histories were measured and modeled with the LLNL -
iso-cetane mechanism for predicting the low- and high-temperature combustion
chemistry of iso-cetane [61].
As described in Chapter 3, it is necessary to assume that all interfering species
have constant cross sections between the two laser lines in the ethylene diagnostic
in order to utilize the two-line method for the measurement of ethylene. This is a
reasonable assumption for the decomposition of fuels such as dodecane and MCH,
which results in product mixtures dominated by n-alkenes, with constant cross
sections between the P14 and P28 lines of the CO2 laser, and small n-alkanes,
with negligible cross sections near 10.5 µm. However, the predominant product
of iso-cetane decomposition as indicated in the work of Holman et al. [60] and as
predicted by the LLNL - iso-cetane mechanism is iso-butene. Recent studies of
the iso-butene cross section [73] have shown that its cross section is not constant
78

between the two lines used in the ethylene diagnostic. For this reason, it has been
necessary to analyze the data obtained from the ethylene diagnostic in a di!erent
manner than for dodecane or MCH. Typically, the two-line ethylene diagnostic
relies on measurements of absorption at two lines to produce two equations, given
as Eq. (3.7) and Eq. (3.8). With the assumption that $P14,IS and $P28,IS are
equivalent, it is possible to solve for XC2H4 without di!erentiating between the
various interfering species. For iso-cetane, however, absorbance time histories at
the P14 and P28 wavelengths are given by Eq. (6.2) and Eq. (6.3).
!P14(t) = PtotalL/RT ($C2H4,P14XC2H4 + $IS,P14XIS + $iC4H8,P14XiC4H8) (6.2)
!P28(t) = PtotalL/RT ($C2H4,P28XC2H4 + $IS,P28XIS + $iC4H8,P28XiC4H8) (6.3)
Note that as mentioned in Chapter 5, iso-cetane has a small but non-negligible
absorption cross section at P14 and P28. For the current experiments, absorbance
at the two CO2 laser wavelengths due to fuel was calculated from the measured fuel
mole fraction and the iso-cetane cross section given in Chapter 5 and !14(t) and
!28(t) have been adjusted to account for this. Equations (6.2) and (6.3) contain
three unknowns, XC2H4, XiC4H8 , and XIS. An additional equation is necessary in
order to fully constrain this system. This equation, Eq. (6.4), is obtained from
a carbon balance by constraining the discussion to times long enough that the
fuel has entirely decomposed, and assuming that the constant interference at these
wavelengths is due to propene (as suggested by current modeling).
C = 2XC2H4 + 3XC3H6 + 4XiC4H8 (6.4)
Here, C represents the amount of carbon in the system included in C2H4, iC4H8,
and C3H6. For each experiment, it is a constant (C = 16Xinit%gi#Xnon!IS,i where
gi is the number of carbon atoms in species i and 0 < C < 16 Xinit). Equations
(6.2), (6.3), and (6.4) can now be solved for C2H4, iC4H8, and C3H6 as a function
of C. Varying the value of C between 0 and 16 Xinit gives a figure such as that
shown in Fig. 6.28.
79

8x10⁻³
4
0
-4M
ole
Frac
tion
25x10-320151050C
i-C4H8
C2H4
C3H6
possiblevalues of C
Figure 6.28: Range of possible solutions for product mole fractions during iso-cetane decomposition at 1048 K, 22.5 atm, and 0.16% iso-cetane in argon. Solu-tions involving mole fractions less than zero are not possible.
Obviously, solutions giving negative mole fractions are not physical. Figure
6.28, therefore, gives a range of possible solutions to the three-equation system,
with the maximum ethylene always observed at C = 16 Xinit and the minimum
set by the point at which any mole fraction drops below zero. For the entire
temperature range studied here, the ethylene yield obtained from the entire range
of possible solutions never exceeded 0.3. Measurements, therefore, agree with the
model predictions of ethylene as a minor product (Fig. 6.29b), iso-butene as a
major product, and another major product with a constant cross section between
P14 and P28 (which the current model predicts is propene). For the possible
solutions when C < 16 Xinit, the carbon not contained in C2H4, iC4H8, or C3H6
must be accounted for through species such as methane and/or ethane, which have
negligible absorption cross sections at P14 or P28.
Figure 6.29a shows a comparison between the LLNL - iso-cetane mechanism
and the measured iso-cetane mole fraction. This mechanism captures the initial
fuel decay quite well. The measurement of fuel during iso-cetane decomposition
was carried out in the same manner as described for n-dodecane and MCH.
Table 6.6 shows the distribution of products for these iso-cetane decomposition
experiments at 2 ms if it is assumed that all carbon contained in the initial fuel is
converted to C2H4, iC4H8, or C3H6 (so C = 16 Xinit). This means that Eqs. 6.2
to 6.4 can be solved for XC2H4 , XiC4H8 , and XC3H6 . Although this will obviously
80

2.0x10⁻³
1.5
1.0
0.5
0.0iso-
Cet
ane
Mol
e Fr
actio
n
1.00.80.60.40.20.0Time [ms]
4x10⁻³
3
2
1
0
Product Mole Fraction
LLNL i-C4H8
LLNL C2H4
LLNL C3H6 iso-Cetane
LLNLiso-Cetane
(a)
0.5
0.4
0.3
0.2
0.1
0.0
Ethy
lene
Yie
ld
1300120011001000Temperature [K]
LLNL-iso-cetane
(b)
Figure 6.29: Comparison of measured and modeled iso-cetane decomposition, a)1195 K, 21.4 atm, 0.15% iso-cetane in argon, solid line is measured fuel, dashedlines are model-predicted mole fractions. b) Measured and modeled ethylene yieldsas a function of temperature. Modeled yields were calculated at 20 atm and 0.15%iso-cetane in argon.
not be the case, as there will be some carbon-containing product species that
do not absorb near 10.5 µm (methane or ethane, for example), it is one method
of observing trends as temperature changes. Across all temperatures, conversion
to ethylene is extremely low. However, as temperature increases, conversion to
propene increases as conversion to iso-butene decreases.
Table 6.6: Product distribution during iso-cetane decomposition assuming carbonconversion to only these three products (2 ms)
Temperature % of Total carbon % of Total carbon % of Total carbon[K] in C2H4 in C3H6 in iC4H8
992 1 26 731048 3 27 701072 0.5 42.5 571109 3 43 541195 4 46 501237 3 63 34
81

6.7 Summary
Measurements of fuel time histories and the corresponding overall fuel decomposi-
tion rates were completed for six fuels and simultaneous measurements of ethylene
time histories and the corresponding ethylene yields were completed for four of
these fuels. The observation of a concentration-independent and nearly pressure-
independent overall fuel decomposition rate for both of the fuels studied over wide
pressure ranges (RP-1 and dodecane) allows comparison of data from both shock
tubes on the same Arrhenius plot. The measured overall fuel decomposition rates
for all of the fuels included in this study are plotted in Fig. 6.30. Immediately
apparent is the similarity in RP-1 and RP-2 overall fuel decomposition rates. This
was also found to be the case at the lower temperatures studied by Widgren and
Bruno [13]. Apparent, too, is that both RP-fuels decompose faster than n-dodecane
in this temperature range, while the JP-7 overall fuel decomposition rates are quite
similar to those of n-dodecane. THQ decomposes much slower than RP-1 and
slightly slower than n-dodecane. MCH decomposes slower than both RP-1 and
dodecane while iso-cetane decomposes faster than all other fuels studied.
101
102
103
104
105
106
Ove
rall
Fuel
Dec
omp.
Rat
e [1
/s]
1.00.90.80.70.6
1000/T [1/K]
RP-1 RP-2 Dodecane JP-7 iso-Cetane MCH
1000 K1538 K
Figure 6.30: Overall fuel decomposition rates for RP-1, RP-2, JP-7, n-dodecane,MCH, and iso-cetane. Pressure range 4 to 51 atm, 0.1 to 0.6% fuel in argon.
Given that n-dodecane has often been considered as a single-component sur-
rogate for kerosene oxidation, and its carbon number and molecular formula are
similar to those approximated for RP-fuels, the question arises as to why the overall
fuel decomposition rates for n-dodecane are slower than for RP-fuels. RP-fuels are
82

clearly more reactive than n-dodecane, and this higher reactivity must be related
to the influence of components other than n-alkanes that are found in RP-fuels.
Both Billingsley et al. [7] and Edwards [6] indicate that RP-1 actually contains
a large fraction of iso-alkanes, and these are known to have faster decomposition
rates than n-alkanes. This observation suggests that a multi-component RP-fuel
decomposition surrogate will also need to include a more reactive (i.e. more rapidly
decomposing) component such as a branched alkane, if it is to successfully match
the overall fuel decomposition rate of RP-fuel.
Figure 6.31 compares the first-order decomposition rates from this study for
various kerosenes (RP-1, RP-2, and JP-7) to those found in the literature.
10-6
10-4
10-2
100
102
104
106
Ove
rall
Fuel
Dec
omp.
Rat
e [1
/s]
1.61.41.21.00.80.6
1000/T [1/K]
714 K1250 K
Figure 6.31: Summary of overall fuel decomposition rates for various kerosenes.Current study: 4 - 51 atm, 0.1 - 0.6% fuel in argon. Solid line is a fit to all RP-fueldata. ! RP-1 [Current Study], & RP-2 [Current Study], • JP-7 [Current Study]," Kerosene #2 [9], ( JP-6 [108], - JP-7 [10], % RP-1 [13], # RP-2 [13], ' JetA [11], " RP-1 [12].
It should be noted that the rates reported by Van Camp et al. [9] are only for
the non-aromatic fraction of the kerosene studied. Their kerosene (Kerosene #2)
was described as “light aromatic and naphthenic,” so neglecting the influence of
aromatics on the decomposition rate could account for the low activation energy,
or slope of the fit to the data in an Arrhenius plot, as compared to the other data
in Fig. 6.31. As can be seen, all previous experiments were completed at lower
temperatures than the current study. The solid line in Fig. 6.31 is an Arrhenius
fit to all of the RP-1 and RP-2 data shown in the figure. The di!erence in the
83

fits to the RP-1 and RP-2 data sets over ten orders of magnitude was negligible.
Therefore a single fit was made to all RP-fuels, and it follows the form k = A
exp(-Ea/RT). The resulting pre-exponential factor for RP-fuels is 3.33)1013 s!1
and the activation energy obtained from this fit is 230 kJ/mol.
The activation energy has been measured for each of the fuels in Fig. 6.30,
listed in Table 6.7, and compared to values found in the literature. The activation
energies measured in the current study have already been published [98].
Table 6.7: Activation Energies for Fuel Decomposition
Temperature PressureEa Range Range
Fuel [converted [converted [converted Referenceto kJ/mol] to K] to atm]
n-Dodecane 213±15 1110 - 1500 4 - 46 Current Study268 1110 - 1300 0.3 - 6 [50]
260±8 673 - 723 9.9 - 99 [49]264 673 - 723 - [49]242 673 - 733 6.8 [48]164 673 - 893 1 [47]273 523 - 713 91 [46]234 823 - 953 1 [112]251 673 - 773 150 [43]
RP-1 263±7 1000 - 1370 4 - 51 Current Study201±39 648 - 723 340 [13]87±15a 648 - 773 340 [12]
RP-2 250±23 1050 - 1370 6.4 - 7.6 Current Study180±30 648 - 723 340 [13]
JP-7 287±19 1080 - 1180 4.5 - 5.2 Current Study157 623 - 1200 102 [10]
Jet A 220±10 648 - 723 340 [11]Kerosene #2 168 873 - 1123 1 [9]
THQ 193±26 1230 - 1380 4.3 - 4.7 Current StudyMCH 207 1250 - 1520 18.7 - 12.3 Current Study
iso-Cetane 244 990 - 1240 20.3 - 22.5 Current Study
a. The analysis of this sample of RP-1 showed that it was out of specification for
high olefin content.
84

Ethylene yields were measured for four fuels: RP-1 and the three possible
surrogate components (dodecane, iso-cetane, and MCH). Figure 6.32 shows the
ethylene yields and corresponding decomposition rates for these fuels.
101
102
103
104
105
106D
ecom
posi
tion
Rat
e [1
/s]
1.00.90.80.70.61000/T [1/K](a)
6
4
2
0
Ethy
lene
Yie
ld
1600140012001000Temperature [K]
(b)
Figure 6.32: RP-1, n-dodecane, MCH, and iso-cetane a) Overall fuel decompositionrates and b) Peak ethylene yields. Solid lines are fits to data. • RP-1, % iso-Cetane,! Dodecane, & MCH.
85

Chapter 7
Shock Experiments with Fuel
Additives
7.1 1,2,3,4-Tetrahydroquinoline (THQ)
As stated in Chapter 1, one of the objectives of this work was to determine the
e!ects of additives on RP-1 and n-dodecane decomposition chemistry. The first
additive studied was THQ; its molecular structure is shown in Fig. 7.1.
Figure 7.1: Molecular structure of THQ.
THQ has been shown to decrease the overall fuel decomposition rate of dode-
cane at lower temperatures [48]. In order to more fully understand the chemistry
of the THQ/fuel mixture, cursory studies of the decomposition behavior of neat
THQ were completed. Figure 7.2a shows the THQ time histories for three di!erent
AST shock experiments at temperatures between 1234 and 1382 K and Fig. 7.2b
shows the corresponding overall fuel decomposition rates for the entire data set.
86

1.0
0.8
0.6
0.4
0.2
0.0
X TH
Q/X
o,TH
Q
2.01.51.00.50.0Time [ms]
1382 K1279 K
1234 K
(a)
103
2
3
456
104
2
Ove
rall
Fuel
Dec
omp.
Rat
e [1
/s]
0.850.800.750.700.65
1000/T [1/K]
1250 K1429 K
(b)
Figure 7.2: Neat THQ decomposition, 1234 to 1382 K, 4.3 to 4.7 atm, 0.13 to0.25% THQ in argon. a) THQ time histories. b) Overall fuel decomposition rates.
These neat THQ overall fuel decomposition rates are compared to those for
dodecane and RP-1 in Fig. 7.3.
102
103
104
105
106
Ove
rall
Fuel
Dec
omp.
Rat
e [1
/s]
0.90.80.70.6
1000/T [1/K]
RP-1 Dodecane THQ
1176 K1538 K
Figure 7.3: Measured overall fuel decomposition rates for THQ, dodecane, and RP-1. Pressure and mole fraction ranges are as in Fig. 7.2, 6.14, and 6.3, respectively.
Upon completion of the neat THQ experiments, experiments were carried out
in the AST with 95% n-dodecane/5% THQ, 90% n-dodecane/10% THQ, and 95%
RP-1/5% THQ (% by volume). Measurements of the fuel mixture with the mid-
infrared HeNe laser provided fuel time histories and overall fuel decomposition
87

rates. An example of a shock experiment performed on a mixture including the
additive is shown in Fig. 7.4.
4
3
2
1
0Pressure [atm
]2.01.00.0-1.0
Time [ms]
0.6
0.5
0.4
0.3
0.2
0.1
0.0
Abso
rban
ce
Region 1 2 Region 5
Reflected Shock
Incident Shock
3.39 µm HeNe
670 nm
Pressure
Figure 7.4: Decomposition of a 5 vol% THQ in RP-1 mixture, 1175 K, 3.5 atm,0.3% fuel in argon.
Figure 7.5 shows the e!ect of the additive THQ on both RP-1 and dodecane
overall fuel decomposition rates. At the lower temperatures (673 to 733 K) studied
by Yoon et al. [48] (not shown), the addition of 10 mol % THQ to dodecane
lowers the decomposition rate significantly (about 95% at 673 K and 85% at 723
K). Widegren and Bruno [14, 113] also reported that THQ was quite e!ective
at increasing the thermal stability of RP-2 from 648 to 723 K. However, at the
temperatures studied here (1150-1400K), the addition of up to 10% THQ by volume
(17 mol %) has no impact on the n-dodecane overall fuel decomposition rate. This
confirms a trend observed in the low-temperature study of Yoon et al. [48]: THQ
has a decreasing e!ectiveness as temperature is increased. It is suspected that this
is due to high-temperature decomposition of THQ, which itself decomposes before
it can act as a hydrogen donor to slow decomposition of the fuel.
88

100
101
102
103
104
105
Ove
rall
Fuel
Dec
omp.
Rat
e [1
/s]
1.000.900.800.701000/T [1/K]
RP-1 RP-1/5 vol% THQ
1000 K 1333 K
(a)
1022
4
1032
4
1042
4
105
Ove
rall
Fuel
Dec
omp.
Rat
e [1
/s]
0.900.850.800.750.70
1000/T [1/K]
Dodecane Dodecane/5 vol% THQ Dodecane/10 vol% THQ
1176 K1333 K
(b)
Figure 7.5: E!ect of THQ on overall fuel decomposition rates. a) RP-1, 3 - 51atm, 0.1 - 0.6% fuel in argon. b) n-Dodecane, 4 - 46 atm, 0.1 - 0.6% fuel in argon.Solid lines are fits to data.
7.2 Benzyl Alcohol (BzOH)
Benzyl alcohol was also screened as a possible additive for RP-1 and dodecane.
Although the conditions of this study are quite di!erent from those experienced
in the cooling channels of a regeneratively-cooled rocket engine, a better under-
standing of the chemistry of such mixtures at a wide range of conditions can be
valuable to future work attempting to alter the decomposition chemistry of RP-1
through the use of additives. Once again, BzOH was selected due to its ability to
a!ect the decomposition chemistry of dodecane at lower temperatures [42].
A set of decomposition rate measurements for a mixture of RP-1 and 5% benzyl
alcohol (by volume) was taken at the same conditions as neat RP-1 decomposition
experiments. Temperatures spanned from 1137 to 1309 K with pressures of ap-
proximately 6 atm. Representative results from these tests are shown in Fig. 7.6.
For the example data shown here (where RP-1 and RP-1/benzyl alcohol experi-
ments were carried out at nearly identical temperatures) the addition of 5 vol%
benzyl alcohol to RP-1 appears to decrease the overall fuel decomposition rate at
some temperatures, as can be seen in Fig. 7.6b.
89

1.00.80.60.40.20.0
X fuel/X
o,fu
el
1.00.80.60.40.20.0Time [ms]
RP-1 RP-1/5 vol% BzOH
(a)
1.00.80.60.40.20.0
X fuel/X
o,fu
el
1.00.80.60.40.20.0Time [ms]
RP-1 RP-1/5 vol% BzOH
(b)
Figure 7.6: Comparison of RP-1 fuel time histories with and without 5 vol% BzOH.a) RP-1: 1099 K, 7.8 atm, 0.30% RP-1 in argon; RP-1/BzOH: 1097 K, 7.8 atm,0.21% fuel mixture in argon. b) RP-1: 1249 K, 8.5 atm, 0.25% RP-1 in argon;RP-1/BzOH: 1246 K, 7.4 atm, 0.16% fuel mixture in argon.
It was found that 5 vol% BzOH is immiscible in dodecane at atmospheric
pressure and room temperature.
The aerosol shock tube method can be successfully used to measure the e!ect
of additives on the decomposition rate of RP-1 at elevated temperatures. At lower
temperatures benzyl alcohol has been reported to behave as a fuel decomposition
deaccelerant. Current experiments indicate that the addition of 5 vol% benzyl
alcohol to RP-1 appears to lower the overall fuel decomposition rate near 1250 K.
This can be seen in Fig. 7.7, which shows the overall fuel decomposition rates of
RP-1 with and without benzyl alcohol.
101
102
103
104
105
Dec
ompo
sitio
n R
ate
[1/s
]
1.00.90.80.71000/T [1/K]
RP-1 RP-1/5 vol% BzOH
Figure 7.7: RP-1 overall fuel decomposition rates with and without 5 vol% benzylalcohol.
90

7.3 Summary
It is interesting to note that THQ decomposes slower than both RP-1 and n-
dodecane at high temperatures, but in the FTIR measurements, it decomposed
much faster, resulting in limited measurement time and high noise in the low-
temperature cross section measurements. This is an indication that the activation
energy for the decomposition of THQ is quite di!erent from those of RP-1 and
n-dodecane.
It appears that BzOH slightly lowers the decomposition rate of RP-1 near 1250
K. Additional studies over a broad temperature range would be necessary to de-
termine if this observation holds for all temperatures between the low-temperature
studies of Yoon et al. [42] and the current study.
91

Chapter 8
Formulation of an RP-1 Pyrolysis
Surrogate
Interest in the decomposition chemistry of kerosene fuels has increased greatly in
recent years. These fuels are often used for cooling rocket and high speed aircraft
engines, and as the desire for greater engine e"ciency and faster vehicles increases,
the study of coke formation in the cooling system demands greater attention. To
understand this coke-formation process with intentions to mitigate or eliminate
coke, one must begin with the vital initial step, fuel decomposition. It is impor-
tant to know not only how quickly a fuel breaks apart, but also what products
are formed during this process. Once these kinetic parameters have been deter-
mined for a fuel, a suitable surrogate mixture can be formulated to mimic these
parameters.
As mentioned in Chapter 2, very few RP-fuel surrogates have been proposed
to date and those that do currently exist target only compound class or thermo-
physical properties. While a much more extensive list of jet-fuel (JP-8 and Jet-A)
surrogates has been proposed [15–37], the variety of components utilized in the ex-
isting surrogates leads to the obvious conclusion that the selection of a surrogate
depends greatly on the target. As of yet, no studies have targeted decomposition in
their formulations of multi-component surrogates for RP-fuels. Three characteris-
tic traits of decomposition are targeted in this study: compound class, overall fuel
decomposition rate, and ethylene yield. As checks to ensure that this surrogate
represents RP-1 as closely as possible, the molecular weight and H/C ratio of the
surrogate mixture will also be considered in the formulation process.
92

8.1 Compound Class
For the purpose of simplicity, many studies assume a single-component surrogate
for chemical kinetic purposes, but in doing so, neglect the finite e!ects of vari-
ous hydrocarbon compound classes on the kinetics of the real fuel. For example,
while the decomposition of a normal alkane results in a product mixture containing
mostly ethylene and other small straight-chain alkenes and alkanes [50, 53], Hol-
man et al. [60] state that during the pyrolysis of the branched alkane iso-cetane,
iso-butene constituted 50% of the product species, making it by far the most pre-
dominant product. This is in accord with the LLNL - iso-cetane predictions for all
temperatures studied here, in which the most prevalent iso-cetane decomposition
product is iso-butene, followed by propene, methane, and ethane. Since the de-
composition of these di!erent compound classes results in quite di!erent product
mixtures, and since RP-fuels contain both normal and branched alkanes, along
with a large fraction of cycloalkanes, the current study seeks to improve upon the
capabilities of single-component surrogates by including components from multiple
compound classes. A recent publication by Billingsley et al. indicates the break-
down of compound classes in RP-1 and RP-2 [7] and this breakdown has been
reproduced here as Table 8.1.
Table 8.1: Average RP-1/RP-2 Class Composition (from Billingsley et al. [7])
Hydrocarbon Type Mass %Para"ns
n- 5iso- 39Total 44
Cyclopara"nsCyclopara"ns 34Dicyclopara"ns 17Tricyclopara"ns 4Total 55
AromaticsAlkylbenzenes 0.5Indans+Tetralins <0.5Naphthalene <0.5Naphthalenes 0.5Total 1
93

It is immediately apparent that a major fraction of RP-fuels are cyclopara"ns
(cycloalkanes). The hydrocarbon methylcyclohexane (MCH) has commonly been
used to represent cycloalkanes in many jet-fuel surrogates [17, 22, 25, 33–35, 37]
and previous studies of both its pyrolysis [54–57, 59, 114, 115] and oxidation [33,
58, 62, 95, 100, 115] can be found in the literature. Thus MCH was selected as
the cycloalkane for the proposed surrogate. Although it is important to capture
the chemistry of each compound class contained in RP-fuels, including a two- or
three-ringed cycloalkane would greatly increase the complexity of the surrogate.
For this reason, and because single-ringed cycloalkanes represent the majority of
the cyclocalkanes in Table 8.1, multi-ring cycloalkanes will be grouped into an
all-inclusive cycloalkane group that will be represented by MCH.
Another notable aspect of Table 8.1 is the split between normal and branched
alkanes. Many historically reported compound class breakdowns neglect to dis-
tinguish between normal and branched alkanes. This, and the di!erence in com-
position between RP-fuels and most jet fuels (which contain a larger percentage
of normal alkanes than RP-1 [34]), may explain why few jet-fuel surrogates con-
tain branched alkanes. However, even in jet fuels, branched alkanes compose a
significant fraction of the fuel, and it is apparent from Table 8.1 that in RP-1 and
RP-2 the majority of alkanes are branched. Rebick [106], Frey and Hepp [116], and
Frey [117] all indicate that normal and branched alkanes containing an equivalent
number of carbon atoms decompose at di!erent rates. Agosta et al. [62] emphasize
the importance of including both normal and branched alkanes in a JP-8 surro-
gate intended to match kinetic targets. For these reasons, it will be important to
include both a normal and a branched alkane in the proposed surrogate.
As the two readily-available branched alkanes are iso-octane and iso-cetane,
these were considered as the options in selecting a suitable branched alkane. n-
Dodecane will be utilized as the normal alkane due to the extensive decomposition
work that already exists concerning this hydrocarbon [42–53, 71, 98, 118–121], and
also because it matches the H/C ratio of RP-1 quite closely.
Aromatics will be neglected here because they constitute such a small portion
of RP-fuels.
94

8.2 Overall Fuel Decomposition Rate
By matching compound class, the RP-1 decomposition surrogate components have
been narrowed to MCH, n-dodecane, and either iso-octane or iso-cetane. Having
noted this, the second target, overall fuel decomposition rate, will be considered.
Overall fuel decomposition rates for RP-1 were calculated from the measured
RP-1 time histories with the method described in Chapter 3. Figure 8.1 shows
the recently-measured high-temperature overall fuel decomposition rates for RP-
1. Also shown are similar rates for n-dodecane, iso-octane [122], iso-cetane, and
MCH. It is apparent in Fig. 8.1 that n-dodecane decomposes slower than RP-1
101
102
103
104
105
106
Dec
ompo
sitio
n R
ate
[1/s
]
1.00.90.80.70.61000/T [1/K]
Figure 8.1: Measured overall fuel decomposition rates of RP-1 and possible sur-rogate components. Solid lines are best fits to data. • RP-1, % iso-Cetane, !Dodecane, & MCH, " iso-Octane [122].
and is thus not an ideal single-component decomposition surrogate. If the only
target were decomposition rate, iso-octane would be the ideal surrogate. However,
a single-component surrogate would not match the compound classes of RP-1 and
would therefore poorly predict the product distribution resulting from its decom-
position. Furthermore, iso-octane has a much lower molecular weight and a much
higher H/C ratio than RP-1. Thus it becomes necessary to utilize a branched
alkane that is both heavier and decomposes faster than iso-octane in order to bal-
ance out the e!ects of the slowly-decomposing n-dodecane. As seen in Fig. 8.1,
iso-cetane decomposes faster than iso-octane, and it clearly has a higher molecular
weight, making it the ideal third component in an RP-1 decomposition surrogate.
95

8.3 Ethylene Yield
The third consideration in selecting a suitable RP-1 decomposition surrogate is
ethylene yield. Ethylene is a primary product in the decomposition of dodecane,
MCH, and RP-1 which makes it an ideal species to use as a target for the pro-
posed RP-1 decomposition surrogate. Measurements of ethylene yield for dode-
cane, MCH, and iso-cetane were made in the current study [121]. Measured ethy-
lene yields for RP-1 and all three surrogate components were given in Chapter 6
and are shown again here in Fig. 8.2. A cursory look at Figs. 8.1 and 8.2 shows
that the decomposition rate of RP-1 can be matched with a combination of only
MCH and iso-cetane. However, dodecane must be included in the mixture in or-
der to match the RP-1 ethylene yield. This confirms the necessity of utilizing all
three possible surrogate components for a multi-component RP-1 decomposition
surrogate.
6
4
2
0
Ethy
lene
Yie
ld
1600140012001000Temperature [K]
Figure 8.2: Ethylene yields during decomposition of RP-1 and three possible sur-rogate components. Solid lines are best fits to the data. • RP-1, % iso-Cetane, !Dodecane, & MCH.
8.4 Determination of Surrogate Component
Mole Fractions
The compound class target has now been satisfied, and the overall fuel decompo-
sition rate and ethylene yield targets have been useful in the process of identifying
96

the necessary components. These last two targets will now be completely sat-
isfied through the selection of the mole fractions of each surrogate component.
Throughout the discussion of these two targets, it will be assumed that both de-
composition rate and ethylene yield are linearly additive when mixtures of fuels are
considered. The accuracy of this assumption has been debated in the literature,
as Rebick [106] states that “In general, if two para"ns are cracked in admixture,
they behave as if they were cracked separately. Both rates and selectivities are un-
changed.” Agosta et al. [62], however, maintain that “the autoignition properties
of the mixture cannot be simply reproduced by linear blending rules.” Although
the latter statement was directed at the oxidation process, it is a warning that
for kinetic purposes, linear blending rules may not result in a mixture with the
expected behavior. However, as no other blending strategies have been proposed,
linear blending rules will be utilized here to estimate an RP-1 pyrolysis surrogate.
With this assumption, these two remaining targets can be satisfied in a straightfor-
ward manner. Listed in Table 8.2 are the best fit polynomials for the overall fuel
decomposition rates (Fig. 8.1) and ethylene yields (Fig. 8.2) of all three surrogate
components and for RP-1 itself. The activation energies resulting from the fits in
Table 8.2 di!er from those in Table 6.7 because these fits include only the 20 atm
data for which both fuel and ethylene measurements were completed, whereas the
activation energies in Table 6.7 were obtained from fits to all decomposition rates
over the entire range of pressures studied.
Table 8.2: Best-fit polynomials to measured overall fuel decomposition rates andethylene yields (in Figs. 8.1 and 8.2)
Fuel Decomposition Rate [s!1] Ethylene Yieldn-dodecane x = 1.06)1014 exp(-30200/T) p = -8.98)10!6 T2 +
2.97)10!2 T - 19.3MCH y = 5.73)1011 exp(-24900/T) q = 2.15)10!3 T - 2.00iso-cetane z = 1.05)1015 exp(-29400/T) r = 0.15RP-1 k = 3.26)1014 exp(-30600/T) e = 5.68)10!3 T + 5.49
Letting x, y, z, and k represent the overall fuel decomposition rates of dodecane,
MCH, iso-cetane, and RP-1, respectively, the overall fuel decomposition rate target
can be satisfied with the equation ax + by + cz = k, where a, b, and c are the
mole fractions of dodecane, MCH, and iso-cetane, respectively. Similarly, letting
p, q, r, and e be the ethylene yields for dodecane, MCH, iso-cetane, and RP-1,
97

respectively, the ethylene yield target can be satisfied with the equation ap + bq
+ cr = e. Noting that this mixture must have mole fractions summing to one,
the third equation necessary to solve this linear system is clearly a + b + c = 1.
Apparent in Table 8.2 is the temperature dependence of each variable listed. This
temperature dependence of the target variables means that the ideal surrogate
composition will also vary with temperature, and this is shown in Fig. 8.3.
1.0
0.8
0.6
0.4
0.2
0.0
Mol
e Fr
actio
n
150014001300120011001000Temperature [K]
MCH
n-Dodecane
iso-Cetane
Figure 8.3: Composition of an RP-1 decomposition surrogate as a function oftemperature.
The mixture selected for comparison with measured RP-1 data was an average
composition over the 1000 - 1500 K temperature range. This mixture is 32%
dodecane, 59% MCH, and 9% iso-cetane. Its molecular weight is 133 g/mol, which
is about 22% lower than that of RP-1 (170 g/mol) [84], but its H/C ratio is 2.06,
quite close to that of RP-1, which is given as 2.1 [84]. Its comparison with the
RP-1 overall fuel decomposition rate is shown in Fig. 8.4 and with the measured
RP-1 ethylene yields is shown in Fig. 8.5.
In Fig. 8.4, the best fits to the measured dodecane, MCH, and iso-cetane
overall fuel decomposition rates are shown in order to provide a reference for how
well the surrogate mixture matches the RP-1 data shown. The maximum di!erence
between the measured RP-1 overall fuel decomposition rate data and the overall
fuel decomposition rates calculated for the surrogate mixture is 50%.
98
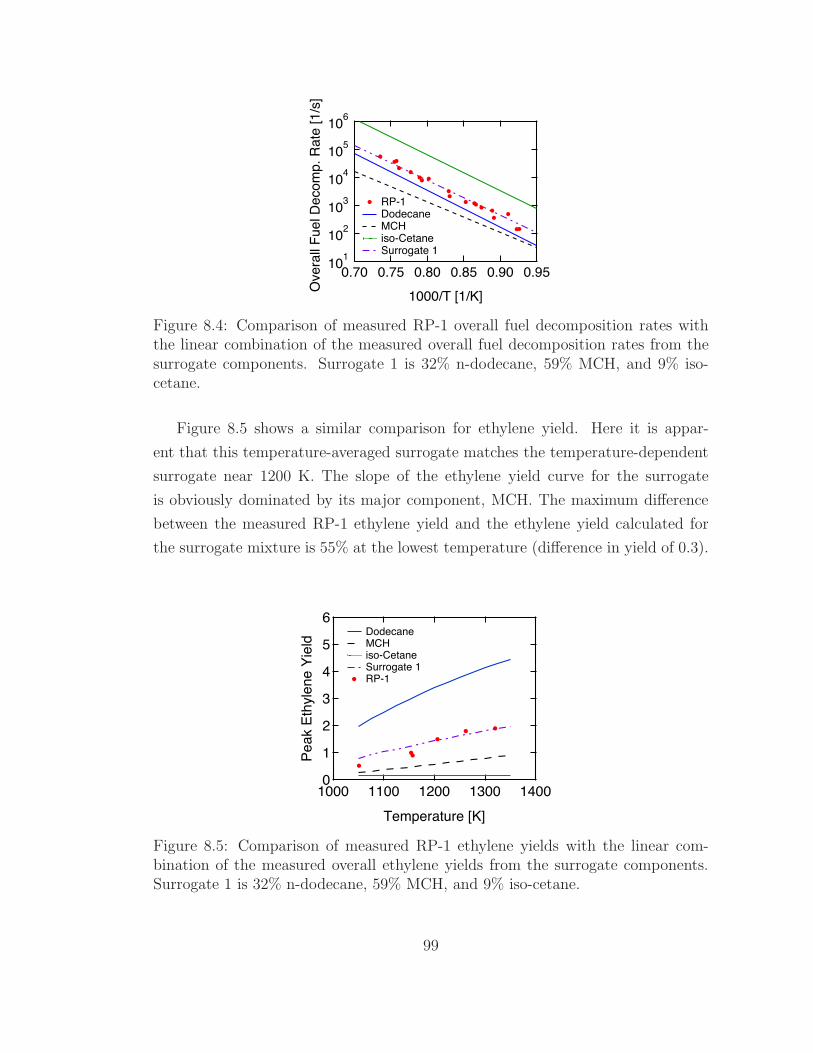
101
102
103
104
105
106
Ove
rall
Fuel
Dec
omp.
Rat
e [1
/s]
0.950.900.850.800.750.701000/T [1/K]
RP-1 Dodecane MCH iso-Cetane Surrogate 1
Figure 8.4: Comparison of measured RP-1 overall fuel decomposition rates withthe linear combination of the measured overall fuel decomposition rates from thesurrogate components. Surrogate 1 is 32% n-dodecane, 59% MCH, and 9% iso-cetane.
Figure 8.5 shows a similar comparison for ethylene yield. Here it is appar-
ent that this temperature-averaged surrogate matches the temperature-dependent
surrogate near 1200 K. The slope of the ethylene yield curve for the surrogate
is obviously dominated by its major component, MCH. The maximum di!erence
between the measured RP-1 ethylene yield and the ethylene yield calculated for
the surrogate mixture is 55% at the lowest temperature (di!erence in yield of 0.3).
6
5
4
3
2
1
0
Peak
Eth
ylen
e Yi
eld
14001300120011001000Temperature [K]
Dodecane MCH iso-Cetane Surrogate 1 RP-1
Figure 8.5: Comparison of measured RP-1 ethylene yields with the linear com-bination of the measured overall ethylene yields from the surrogate components.Surrogate 1 is 32% n-dodecane, 59% MCH, and 9% iso-cetane.
99

8.5 Mechanism Predictions
Since this new RP-1 pyrolysis surrogate utilizes three species, each from a di!erent
compound class, it was necessary to combine the existing mechanisms for each
component into a new all-inclusive mechanism. This was carried out with the
LLNL - n-alkane [105], MCH [95], and iso-cetane [61] mechanisms and the resulting
mechanism will be referred to as LLNL - mix [123]. It has been utilized here along
with the newly-proposed surrogate to simulate the decomposition behavior of RP-
1.
Figure 8.6 shows the measured absorbance time history for the 3.39 µm HeNe
laser during an RP-1 decomposition experiment. At early times, absorption at this
wavelength is dominated by the fuel, while at later times, the absorbance plateau
is due to absorption from the product species.
0.8
0.6
0.4
0.2
0.0
Abso
rban
ce
2.01.00.0Time [ms]
Measured Modeled
Figure 8.6: Measured and predicted absorbance at 3.39 µm during RP-1 decompo-sition at 1262 K, 18.4 atm, 0.17% RP-1 in argon. Modeled results utilize Surrogate1 for RP-1.
As measurement of the mole fractions of each of these product species would
require more wavelengths than were utilized in this study, a comparison is made
between the total measured absorbance at 3.39 µm and the model-predicted ab-
sorbance at 3.39 µm. This predicted absorbance time history was modeled using
the LLNL - mix mole fractions for dodecane, MCH, iso-cetane, ethylene, propene,
and iso-butene and the cross sections of each (except iso-butene) which are given
in Chapter 5. Based on the low-temperature and low-pressure cross section data
from Sharpe et al. [101] for iso-butene in the 3.4 µm region and the high-pressure
100

1-butene cross section shown in Fig. 5.16, the cross section of iso-butene at 3.39
µm and the conditions of interest was estimated to be 10 m2/mol. Figure 8.6 shows
the measured and modeled absorbance time histories for a sample shock experi-
ment. Although the absorption characteristics of the surrogate components were
not considered in the selection of this mixture, the initial predicted absorbance is
only approximately 10% lower than the initial measured absorbance. Through-
out the rest of the absorbance time history, the predicted absorbance matches the
measured absorbance to within 30%. For these RP-1 experiments, the maximum
di!erence between the predicted absorbance and the measured absorbance was on
average 35%.
A predicted ethylene time history during decomposition is shown in Fig. 8.7a
as compared to that measured during RP-1 decomposition at 1262 K and ethylene
yields for each RP-1 experiment with their corresponding modeled yields are shown
in Figure 8.7b.
5x10⁻³
4
3
2
1
0Ethy
lene
Mol
e Fr
actio
n
2.01.51.00.50.0Time [ms]
Measured C2H4
LLNL - mix C2H4
(a)
2.0
1.5
1.0
0.5
0.0Peak
Eth
ylen
e Yi
eld
14001300120011001000Temperature [K]
RP-1
LLNL - mix
(b)
Figure 8.7: Ethylene measurements during RP-1 decomposition and LLNL - mixpredictions utilizing Surrogate 1 for RP-1. a) Comparison of measured and mod-eled ethylene time histories at 1262 K, 18.4 atm, and 0.17% fuel in argon. b)Comparison of measured and model-predicted ethylene yields.
Figures 8.7a and 8.7b show that although the LLNL - mix and Surrogate 1
combination predicts the long-time behavior of the RP-1 relatively well, the early-
time dynamics are not captured. At early times, the mechanism predicts slower
fuel decay and slower ethylene formation than measured. This is at least consistent
101
with measurements in that if the predicted fuel decomposition is slower than the
measured rate, it would also be expected that the predicted ethylene forms slower
than the measured ethylene. Here it is worth noting that this mechanism and
surrogate combination are a first attempt at matching the RP-1 decomposition
characteristics. If such early-time RP-1 behavior is universal over all temperatures
studied, it is possible that the surrogate may need adjustment. However, care
should be taken in utilizing the mechanism to adjust the surrogate, as the mecha-
nism itself should first be thoroughly tested against experimental studies of actual
three-component mixtures. This will be discussed further in Chapter 9.
102

Chapter 9
Summary and Future Work
9.1 Summary
This thesis characterizes the pyrolysis behavior of six di!erent fuels (RP-1, RP-2,
JP-7, dodecane, MCH, and iso-cetane) and two possible fuel additives (THQ and
BzOH). Both the Aerosol Shock Tube (AST) and the High Pressure Shock Tube
(HPST) were utilized in this work, allowing measurements over a wide range of
pressures (4 - 51 atm) and temperatures (1000 - 1500 K).
Absorption cross sections at the mid-infrared HeNe wavelength (3.39 µm) were
measured at low temperatures using a heated cell and FTIR and at high temper-
atures using a shock tube for all fuels (plus THQ). Low-temperature FTIR cross
sections of JP-8 are also reported. Most of these fuels have negligible absorption
cross sections at the location of the ethylene diagnostic (near 10.5 µm), excepting
iso-cetane, which has a very small, but non-negligible cross section at P14 and
P28. However, absorption cross sections of ethylene itself and of two possible in-
terfering species, propene and 1-butene, were measured at both the P14 (10.532
µm) and P28 (10.675 µm) lines of the CO2 laser and at the HeNe laser wavelength
(3.39 µm). These absorption cross sections were then utilized to measure fuel and
ethylene mole fractions in the shock experiments.
Fuel time histories and overall fuel decomposition rates are reported for all
fuels (plus THQ), and ethylene time histories and yields are reported for RP-
1, dodecane, MCH, and iso-cetane. Low-pressure (4 - 8 atm) experiments were
carried out in the AST and utilized its unique fuel delivery system which makes
measurements involving distilled fuels such as RP-1 quite straightforward. High-
103
pressure (18 - 50 atm) experiments were carried out in the heated HPST and
special care was taken to ensure that the fuel was not redistilled in the process
of mixing. Overall fuel decomposition rate and ethylene yield measurements were
then used as targets in the formulation of an RP-1 decomposition surrogate which
specifically targets the pyrolysis characteristics of RP-1. The targets for this study
were composition class, overall fuel decomposition rate, and ethylene yield, and
targeting these three characteristics resulted in the following surrogate mixture:
32% dodecane, 59% MCH, 9% iso-cetane. This surrogate, along with the newly-
developled LLNL - mix mechanism, captures both the 3.39 µm absorbance time
histories and the peak ethylene yields during RP-1 decomposition quite well.
Two additives, THQ and BzOH, were mixed with n-dodecane and RP-1 at 5
vol% and 10 vol% levels. While THQ did not a!ect the decomposition chemistry
of the main fuel, BzOH appears to lower the overall fuel decomposition rate of the
main fuel near 1250 K.
The current study contributes to the understanding of coke formation by pro-
viding a surrogate that can be utilized to predict the product species formed during
RP-1 decomposition. Identifying the product species that are formed during the
initial few milliseconds of decomposition o!ers a starting point for studies of the
formation of the large hydrocarbon molecules that eventually form coke. This sur-
rogate can also be utilized to predict the identities of species that are contained
in the hydrocarbon mixture (used as a coolant) that is eventually injected into
the combustion chamber. This is of interest to those who model the chemistry
occurring in the combustor of a regeneratively-cooled engine.
9.2 Future Work
The most obvious future work would include experimental studies of the proposed
surrogate mixture. This would accomplish two goals: the confirmation (or refu-
tal) of the assumption that decomposition rates and ethylene yields are linearly
additive, and a direct comparison to the LLNL - mix mechanism, which would be
useful for improvement of the mechanism intended to predict detailed chemistry
of a fuel mixture containing components from multiple compound classes.
Also, as described in Appendix A, the analysis of the measured absorbance
from the HeNe laser (which produces fuel time histories) relies on the assump-
104

tion of a simple model in which one fuel component decomposes into one product
component. As discussed in Appendix A, this assumption is not representative of
reality; however, it is useful in order to correct for the e!ects of interfering species
in the fuel measurement. Future work should include either validation of this as-
sumption or measurements of the suspected major interfering species which would
allow a direct subtraction of their interference and make the use of the simple
model described in Appendix A unnecessary.
Finally, if the ethylene diagnostic near 10.5 µm is to be utilized in future fuel
studies for which the product mixture contains both ethylene and iso-butene, a
third line, selected such that the three lines result in three independent linear
equations describing the absorbance at each line, should be utilized. Instead of
a third equation that simply bounds the possible ethylene mole fraction (as was
utilized in the current study), this three-line method could produce simulataneous
measurements of both ethylene and iso-butene while rejecting interference from all
product species with wavelength-independent absorption cross sections in the 10.5
µm region.
105

106

Appendix A
Fuel Time History Correction
Because the fuel diagnostic relies on the mid-infrared HeNe laser (3.39 µm), which
is absorbed by the C-H stretch band of the fuel, any species containing C-H bonds
will also absorb the HeNe laser wavelength and will interfere with the fuel measure-
ment. This must be taken into account in the data analysis. A previous student
(Adam Klingbeil, [50]) studied n-dodecane decomposition and utilized a detailed
chemical kinetic mechanism to predict the mole fractions of the predominant prod-
ucts. The predicted absorbance contributions of these predominant products were
then subtracted out of the measured absorbance (using product cross sections
measured in his study). It was determined that for n-dodecane, this correction
increases the overall fuel decomposition rate by about 30% over that determined
without correcting the measured absorbance. This same analysis was carried out
for n-dodecane in the current study, utilizing the JetSurF 2.0 mechanism and it
was determined that at the conditions of this study, the interference correction on
the overall fuel decomposition rate could be as large as 50%. While this method
gives insight into the magnitude of the interference absorption, it utilizes a detailed
kinetic mechanism to correct the measured data, which has two drawbacks. The
first drawback is that it is only useful for fuels that have trusted mechanisms, and
the second is that it prevents a valid comparison with the mechanism-predicted
fuel time history and overall fuel decomposition rate since it biases the measure-
ments to the mechanism used for the correction. The current work utilizes a much
simpler model for the correction of the fuel measurement. This simple model re-
quires some major assumptions, as will be described, but as most of the fuels in
the current study have no or newly-developed mechanisms, it will be necessary to
107

employ this model. A comparison of this simple model with the correction utiliz-
ing a detailed mechanism (for the n-dodecane case) can give an indication of how
well this simple model corrects for absorption from interfering species. The simple
model utilized in the current study is described by Eq. (A.1).
fuelk%' products (A.1)
where “fuel” and “products” are each a single absorbing component and k is the
rate at which this reaction proceeds. This model is not representative of reality, as
it is known that multiple product species are produced during fuel decomposition.
It is useful, however, to assume this model, the utility of which will be discussed in
section A.3. At time t = 0, only fuel exists and at time t = *, only products exist.
Once again this model di!ers from reality, in which the products at t = * will be
di!erent than those at times between zero and *. However, in this simple model
with a single product component, it will be assumed that this product component
is consistent between time zero and time *.
We will make the assumption that this reaction proceeds according to first-
order kinetics. Therefore, the rate of removal of the fuel concentration (Nf ) is:
dNf
dt= %kNf (A.2)
Solving this di!erential results in an equation for the fuel concentration:
lnNf (t)% lnNf (0) = %kt (A.3)
ln
!Nf(t)
Nf(0)
"= %kt (A.4)
Nf(t) = Nf(0)exp(%kt) (A.5)
Inherent in the model given by Eq. (A.1) is the assumption that products form at
the same rate as the fuel decomposes, meaning that Eq. (A.6) holds.
Np(t) = Nf (0) (1% exp(%kt)) (A.6)
One check of the goodness of the simple model in Eq. (A.1) is how closely the rate
of removal of fuel matches the rate of formation of products in an actual shock
108

experiment. Figure 6.18 shows an example n-dodecane shock at 1306 K for which
it was observed that ethylene forms about 25% slower than n-dodecane is formed.
This di!erence is understandable, given the assumptions required for this simple
model, but again, although it is not an accurate representation of reality, it will
be shown in section A.3 that this simple model is still quite useful.
A.1 Overall Fuel Decomposition Rate
At any given time, the measured absorbance is composed of a contribution from
fuel plus a contribution from products:
!meas(t) = !f (t) + !p(t) (A.7)
!meas(t) = $fNf(t)L+ $pNp(t)L (A.8)
Substituting Eqs. (A.5) and (A.6) into Eq. (A.8) gives the absorbance.
!meas(t) = $fNf (0)exp(%kt)L+ $pNf (0) (1% exp(%kt))L (A.9)
!meas(t) = Nf(0)exp(%kt)L ($f % $p) + $pNf(0)L (A.10)
Solving for k:!meas(t)
Nf(0)$fL= exp(%kt)
!1% $p
$f
"+
$p
$f(A.11)
ln
!!meas(t)
Nf(0)$fL% $p
$f
"= ln
!exp(%kt)
!1% $p
$f
""(A.12)
ln
!!meas(t)
Nf (0)$fL% $p
$f
"= ln (exp(%kt)) + ln
!1% $p
$f
"(A.13)
ln
!!meas(t)
Nf (0)$fL% $p
$f
"% ln
!1% $p
$f
"= %kt (A.14)
%ln
+
,1% "p
"f#meas(t)Nf (0)"fL
% "p"f
-
. = %kt (A.15)
The final unknown in this equation is the ratio $p/$f . We have measured ab-
sorbance, so we know !(0), which we will assume is entirely due to fuel, so
!(0) = !fuel and we also know !(*), which we will assume is entirely due to
109

the single product component, so !(*) = !prod.
!(0) = !fuel =$fuelXfuel(0)PL
RT(A.16)
!(*) = !prod =$prodXprod(*)PL
RT(A.17)
If we take the ratio of these absorbances, the only variables that do not cancel are
the cross section and the mole fraction. Since we have made the assumption that
a single“fuel” component produces a single “product” component, it follows that
Xfuel(0) = Xprod(*) and the ratio of absorbances becomes:
!fuel
!prod=
$fuel
$prod(A.18)
Substituting Eq. (A.18) into Eq. (A.15) gives the equation for the overall fuel
decomposition rate.
%kt = %ln
+
,1% #p
#f
#meas(t)Nf (0)"fL
% #p
#f
-
. (A.19)
Since !f = Nf (0)$fL,
%kt = %ln
/!f % !p
!meas(t)% !p
0(A.20)
Plotting the right side of the above equation as a function of time allows the de-
termination of k from the slope of the resulting line. An example of such a plot is
given in Fig. 3.3.
A.2 Fuel Mole Fraction
We can determine mole fraction in a similar manner.
!meas(t) = !f (t) + !p(t) (A.21)
!meas(t) =$fXf(t)PL
RT+ !p(t) (A.22)
$fXf(t)PL
RT= !meas(t)% !p(t) (A.23)
110

Xf(t) = (!meas(t)% !p(t))RT
$fPL(A.24)
Here !p(t) is the only unknown. We will assume, as above, that the rate of “fuel”
depletion equals the rate of “product” formation. Therefore, the absorbance due
to products is of the form given in Eq. (A.25).
!p(t) = !p(*)(1% exp(%kt)) (A.25)
It follows from Eq. (A.5) that Xf (t) = Xf (0)exp(%kt). Solving this for exp(-kt)
and substituting into Eq. (A.25) gives:
!p(t) = !p(*)
!1% Xf (t)
Xf(0)
"(A.26)
Now we have !p(t), which with Eq. (A.24) gives Xf(t).
Xf(t) =
/!meas(t)% !p(*)
!1% Xf(t)
Xf(0)
"0RT
$fPL(A.27)
Rearranging to isolate Xf (t) gives:
Xf(t)$fPL
RT= !meas(t)% !p(*) + !p(*)
Xf(t)
Xf(0)(A.28)
Xf(t)
/$fPL
RT% !p(*)
Xf(0)
0= !meas(t)% !p(*) (A.29)
Xf(t) =!meas(t)% !p(*)1
"fPLRT % #p(#)
Xf (0)
2 (A.30)
but
!f (0) =$fXf (0)PL
RT(A.31)
so$fPL
RT=
!f (0)
Xf(0)(A.32)
and therefore
Xf(t) =
!!meas(t)% !p(*)
!f(0)% !p(*)
"Xf (0) (A.33)
111

This gives the fuel mole fraction as a function of time; an example of such a fuel
time history is given in Fig. 3.3.
A.3 Comparison of this Simple Model with the
Detailed Kinetic Mechanism Method
In order to estimate the goodness of the simple model, it will be compared here
to a method for correcting interference that utilizes a detailed chemical kinetic
mechanism. The hydrocarbon utilized for this example is n-dodecane. The mech-
anism JetSurF 2.0 was used to predict time histories for the products which are
suspected to interfere with the fuel measurement. These predicted mole fractions
were then converted to the predicted absorbance time histories shown in Fig. A.1a.
The cross sections of these interfering species are as follows. Those for ethylene,
propene, and 1-butene were measured in the current study and are shown in Fig.
5.16. That for methane was estimated from [111] and was taken to be 9 m2/mol.
Those for ethane and 1,3-butadiene were estimated from [101] and were taken to be
10 m2/mol and 0.6 m2/mol, respectively. The sum of these predicted absorbances
0.5
0.4
0.3
0.2
0.1
0.0
Abso
rban
ce
2.01.51.00.50.0Time [ms]
CH4 C2H4 C2H6 C3H6
C4H6 C4H8 Sum
(a)
0.8
0.6
0.4
0.2
0.0
Abso
rban
ce
2.01.51.00.50.0Time [ms]
Measured Corrected Sum of Predicted
Interference
(b)
Figure A.1: Summary of the detailed kinetic mechanism interference correctionmethod for a shock at 1208 K, 20.2 atm, 0.155% n-dodecane in argon, a) Ab-sorbance time histories due to six interfering species and their sum, b) Measuredand corrected absorbance time histories.
112

is also shown in Fig. A.1a and is subtracted from the measured absorbance in
Fig. A.1b. This corrected absorbance was then converted to a fuel mole fraction
(X=!RT/$PL) with the n-dodecane cross section from Table 5.1 and this detailed
kinetic mechanism-corrected fuel mole fraction is included in Fig. A.2. Shown in
Fig. A.2 are three fuel time histories. The first was calculated with no interference
correction, the second with the detailed kinetic mechanism correction method il-
lustrated in Fig. A.1, and the third with the simple model correction presented in
this appendix.
1.5x10⁻³
1.0
0.5
0.0Fuel
Mol
e Fr
actio
n
2.01.51.00.50.0Time [ms]
Uncorrected
Simple Model CorrectionDetailed Kinetic
Mechanism Correction
Figure A.2: Comparison of fuel mole fractions determined from three di!erentmethods, 1208 K, 20.2 atm, 0.155% n-dodecane in argon.
As would be expected, both correction methods increase the overall fuel de-
composition rate, as they account for the absorbance due to interfering species
and thus decrease the resulting fuel mole fraction below the uncorrected value.
The simple model method produces a fuel mole fraction that necessarily decays to
zero, as the long-term product absorbance was utilized to make the interference
correction. This method does not account for varying product mole fractions, how-
ever, as the detailed kinetic mechanism method does. Even so, for the case shown
in Fig. A.2, these two correction methods result in overall fuel decomposition rates
that only di!er by approximately 12%.
It was found here that the simple model correction method and the method
113

utilizing a detailed kinetic mechanism result in very similar overall fuel decompo-
sition rates. This gives confidence in the application of the simple model given
by Eq. (A.1) to the analysis of fuels that have no or untested detailed chemical
kinetic mechanisms.
114

Appendix B
Shock Data
Table of test conditions and overall fuel decomposition rates for shock experiments
with all fuels
115

Figure B.1: RP-1. Log of shocks from section 6.1.
116

Figure B.2: RP-2. Log of shocks from section 6.2.
117

Figure B.3: JP-7. Log of shocks from section 6.3.
118

Figure B.4: Dodecane. Log of shocks from section 6.4.
119

Figure B.5: MCH. Log of shocks from section 6.5.
120
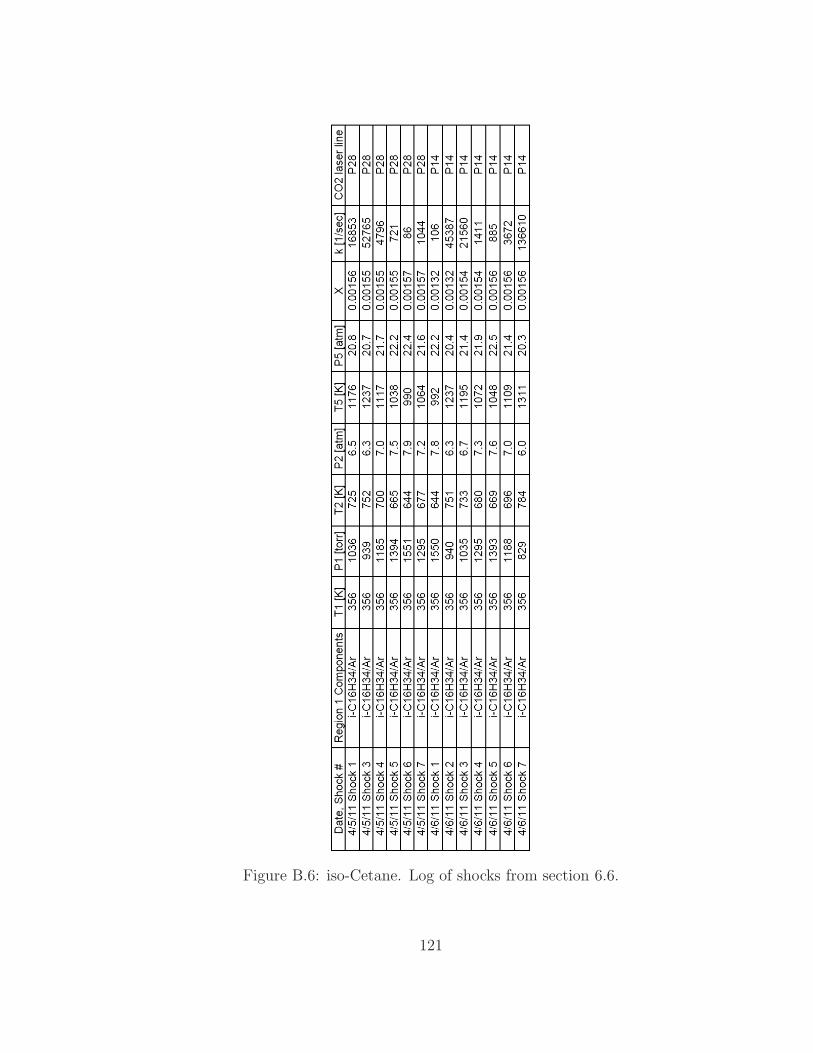
Figure B.6: iso-Cetane. Log of shocks from section 6.6.
121

Figure B.7: THQ. Log of shocks from section 7.1.
122

Figure B.8: Dodecane/THQ. Log of shocks from section 7.1.
123

Figure B.9: RP-1/THQ. Log of shocks from section 7.1.
124

Figure B.10: RP-1/BzOH. Log of shocks from section 7.2.
125
Appendix C
Literature Review of Supercritical
Fluid vs. Gas-Phase Hydrocarbon
Kinetics
Kerosene fuel used for cooling in a rocket or hypersonic aircraft is currently re-
quired to withstand pressures in excess of the critical pressure, approximately 20
atm, and research is underway with the intention of increasing the working tem-
perature of these kerosene fuels above its critical temperature of approximately
675 K prior to injection into the combustion chamber [8]. Many studies have been
completed on the gas- and liquid-phase kinetic behavior of kerosene and kerosene
surrogates. The current study deals with gas-phase pyrolysis of these fuels. The
following is a cursory literature review which explores the di!erences and similar-
ities between gas-phase and supercritical hydrocarbon pyrolysis. Many studies of
supercritical hydrocarbon decomposition behavior have indicated a di!erence in
product distribution from studies involving gas-phase decomposition. The most
predominately mentioned di!erence is the increase of the alkane/alkene ratio in
the products of supercritical decomposition.
Stewart et al. [124] studied the di!erences in supercritical and gas-phase pyroly-
sis for three hydrocarbons: decalin (decahydronaphthalene), tetralin (tetrahydron-
aphthalene), and n-decane. Decalin and tetralin appear to undergo a mechanistic
change leading to di!erent reactions and products at supercritical conditions than
gas-phase conditions. Decane seems to follow the same mechanism at supercritical
conditions as it does for gas-phase, but the resulting product yields are altered:
126

“For supercritical pyrolysis of neat decane, major products were com-
pletely in accord with traditional pathways associated with conven-
tional gas phase alkane pyrolysis... However, in striking contrast to
conventional gas phase hydrocarbon pyrolysis which is dominated by
the formation of light olefins, under supercritical conditions a much
greater yield of alkanes is found along with reduced yields of ethene
and 1-olefins.”
Ward et al. [125] specifically studied decane, and their measurements indicate
that the alkane/alkene ratio increases with increasing pressure. They suggest that
at the high pressures necessary to obtain a supercritical state, the preference for
bimolecular rather than unimolecular reactions is a possible explanation of why
fewer alkenes (ethylene, for instance) are formed at supercritical conditions.
“Pressure increases the molecular collision frequency, which enhances
bimolecular processes more than the unimolecular processes. Thus, as
pressure increases, more n-alkanes are produced relative to alkenes.”
Ledesma et al. [126] tracked the formation of 27 di!erent PAH molecules during
the pyrolysis of toluene. As pressure was increased from 20 atm to 100 atm for
a given temperature, they discovered that the yields of these PAH increased dra-
matically. Although the study deals with toluene, a molecule with a very di!erent
structure from the alkanes of the current study, it does illuminate the obvious e!ect
that pressure can have on hydrocarbon pyrolysis. An important point was made
in the comments on this paper; it was pointed out that with their experimental
apparatus an increase in pressure also indicates an increase in concentration. Ki-
netic rates and yields can depend on both pressure and concentration and if both
of these variables change from one experiment to the next, it is di"cult to conclude
that the result was due only to an increase in pressure.
Edwards [8] also mentions an increase in the alkane/alkene ratio with increasing
pressure and employs free-radical theory to make his argument.
“The major thermal cracking products at low pressures are small olefins
(such as ethylene and propylene). Free-radical theory proposes that
initiation of the cracking begins with hydrogen abstraction, followed
127

by a series of unimolecular “)-scission” reactions:
R% CH2 % CH2 % CH ·2 ' R % CH ·
2 +H2C = CH2 (C.1)
At higher pressures, the reaction of the parent radical with other fuel
molecules becomes more likely, with the resulting reaction forming a
para"n and another radical. Thus, theory and experiment show a
decrease in olefin/para"n ratio as pressure increases.”
Savage et al. [127] claim that there exist cases (high temperatures far removed
from the critical point) where gas and supercritical fluids can have the same reac-
tion rates. While this may seem to be in contrast to most other groups, it is not.
Most groups studying the behavior of fuels purposefully study only the variable
space around the critical point. Savage discusses this extremely high-temperature
region where gas-phase kinetics may match those in the supercritical state:
“improved models took advantage of recent kinetics compilations for
the elementary steps and properly handled the e!ect of pressure on the
elementary reactions. Thus, it is apparent that elementary reaction
models, when properly modified to account for pressure e!ects, may
be able to give a good description of SCWO [supercritical water oxi-
dation] kinetics for simple compounds at conditions far removed from
the critical point.”
While it appears obvious that for certain conditions pressure a!ects the product
distribution for hydrocarbon pyrolysis, there may also be conditions at which gas-
phase studies can help further the understanding of supercritical fluid kinetics.
Additional research into both gas-phase and supercritical pyrolysis is necessary to
fully understand the problem. In a review of previous literature, it appears that
kinetics of hydrocarbon decomposition di!ers greatly between the gas-phase and
the supercritical region near the critical point. At high temperatures, far from
the critical point, there may exist similarities between gas-phase and supercritical
behavior.
128

Bibliography
[1] P. Gokulakrishnan, C. C. Fuller, M. S. Klaussen, and H. Huang, “Ki-
netic modeling of thermal and catalytic cracking of para"nic surrogate fu-
els relevant to hypersonic applications,” Tech. Rep. AIAA 2011-6106, 47th
AIAA/ASME/SAE/ASEE Joint Propulsion Conference, 2011.
[2] L. F. Albright and J. C. Marek, “Mechanistic model for formation of coke in
pyrolysis units producing ethylene,” Industrial and Engineering Chemistry
Research, vol. 27, no. 5, pp. 755–759, 1988.
[3] D. Nohara and T. Sakai, “Kinetic study of model reactions in the gas phase
at the early stage of coke formation,” Industrial and Engineering Chemistry
Research, vol. 31, no. 1, pp. 14–19, 1992.
[4] D. T. Wickham, J. V. Atria, J. R. Engel, B. D. Hitch, M. E. Karpuk, and
R. Striebich, “Formation of carbonaceous deposits in a model jet fuel under
pyrolysis conditions,” in Symposium on the Structure of Jet Fuels V, 216th
National Meeting, American Chemical Society, 1998.
[5] D. K. Minus and E. Corporan, “Thermal stabilizing tendencies of hydro-
gen donor compounds in jp-8+100 fuel,” Tech. Rep. AIAA 99-2214, 35th
AIAA/ASME/SAE/ASEE Joint Propulsion Conference, 1999.
[6] T. Edwards, “Kerosene fuels for aerospace propulsion - composition and
properties,” Tech. Rep. AIAA 2002-3874, 38th AIAA/ASME/SAE/ASEE
Joint Propulsion Conference, 2002.
[7] M. Billingsley, T. Edwards, L. M. Shafer, and T. J. Bruno, “Extent and
impacts of hydrocarbon fuel compositional variability for aerospace propul-
129

sion systems,” Tech. Rep. AIAA 2010-6824, 46th AIAA/ASME/SAE/ASEE
Joint Propulsion Conference, 2010.
[8] T. Edwards, “Cracking and deposition behavior of supercritical hydrocarbon
aviation fuels,” Combustion Science and Technology, vol. 178, no. 1, pp. 307–
334, 2006.
[9] C. E. Van Camp, P. S. Van Damme, and G. F. Froment, “Thermal crack-
ing of kerosene,” Industrial and Engineering Chemistry Process Design and
Development, vol. 23, no. 1, pp. 155–162, 1984.
[10] J. P. Dworzanski, J. N. Chapman, and H. L. C. Meuzelaar, “Development of
microscale reactors directly interfaced to GC/IR/MS analytical system for
high temperature pyrolytic degradation studies of jet fuels in the gas phase or
under supercritical conditions,” in Symposium on the Structure of Jet Fuels
III, American Chemical Society, vol. 27, 1992.
[11] J. A. Widegren and T. J. Bruno, “Thermal decomposition kinetics of the
aviation turbine fuel Jet A,” Industrial and Engineering Chemistry Research,
vol. 47, no. 13, pp. 4342–4348, 2008.
[12] P. C. Andersen and T. J. Bruno, “Thermal decomposition kinetics of RP-1
rocket propellant,” Industrial and Engineering Chemistry Research, vol. 44,
no. 6, pp. 1670–1676, 2005.
[13] J. A. Widegren and T. J. Bruno, “Thermal decomposition kinetics of
kerosene-based rocket propellants. 1. Comparison of RP-1 and RP-2,” Energy
and Fuels, vol. 23, no. 11, pp. 5517–5522, 2009.
[14] J. A. Widegren and T. J. Bruno, “Thermal decomposition kinetics of
kerosene-based rocket propellants. 2. RP-2 with three additives,” Energy
and Fuels, vol. 23, no. 11, pp. 5523–5528, 2009.
[15] E. Catalanotti, K. J. Hughes, M. Pourkashanian, and C. W. Wilson, “De-
velopment and application of a surrogate distillate fuel,” Energy and Fuels,
vol. 25, no. 4, pp. 1465–1473, 2011.
[16] M. Colket, T. Edwards, S. Williams, N. P. Cernansky, D. L. Miller, F. Egol-
fopoulos, P. Lindstedt, K. Seshadri, F. L. Dryer, C. K. Law, D. Friend, D. B.
130

Lenhert, H. Pitsch, A. Sarofim, M. Smooke, and W. Tsang, “Development of
an experimental database and kinetic models for surrogate jet fuels,” Tech.
Rep. AIAA 2007-770, 45th AIAA Aerospace Sciences Meeting, 2007.
[17] J. A. Cooke, M. Bellucci, M. D. Smooke, A. Gomez, A. Violi, T. Faravelli,
and E. Ranzi, “Computational and experimental study of JP-8, a surro-
gate, and its components in counterflow di!usion flames,” Proceedings of the
Combustion Institute, vol. 30, pp. 439–446, 2005.
[18] P. Dagaut, “On the kinetics of hydrocarbons oxidation from natural gas
to kerosene and diesel fuel,” Physical Chemistry Chemical Physics, vol. 4,
no. 11, pp. 2079–2094, 2002.
[19] S. Dooley, S. H. Wona, M. Chaos, J. H., Y. Ju, F. L. Dryer, K. Kumar, C.-J.
Sung, H. Wang, M. A. Oehlschlaeger, R. J. Santoro, and T. A. Litzinger,
“A jet fuel surrogate formulated by real fuel properties,” Combustion and
Flame, vol. 157, no. 12, pp. 2333–2339, 2010.
[20] T. Edwards and L. Q. Maurice, “Surrogate mixtures to represent complex
aviation and rocket fuels,” Journal of Propulsion and Power, vol. 17, no. 2,
pp. 461–466, 2001.
[21] P. Gokulakrishnan, G. Gaines, J. Currano, M. S. Klassen, and R. J. Roby,
“Experimental and kinetic modeling of kerosene-type fuels at gas turbine
operating conditions,” Journal of Engineering for Gas Turbines and Power,
vol. 129, no. 3, pp. 655–663, 2007.
[22] S. P. Heneghan, S. L. Locklear, D. L. Geiger, S. D. Anderson, and W. D.
Schulz, “Static tests of jet fuel thermal and oxidative stability,” Journal of
Propulsion and Power, vol. 9, no. 1, pp. 5–9, 1993.
[23] S. Honnet, K. Seshadri, U. Niemann, and N. Peters, “A surrogate fuel for
kerosene,” Proceedings of the Combustion Institute, vol. 32, pp. 485–492,
2009.
[24] H. Huang, D. R. Sobel, and L. J. Spadaccini, “Endothermic heat sink of
hydrocarbon fuels for scramjet cooling,” Tech. Rep. AIAA 2002-3871, 38th
AIAA/ASME/SAE/ASEE Joint Propulsion Conference, 2002.
131

[25] S. Humer, A. Frassoldati, S. Granata, T. Faravelli, E. Ranzi, R. Seiser, and
K. Seshadri, “Experimental and kinetic modeling study of combustion of JP-
8, its surrogates and reference components in laminar nonpremixed flows,”
Proceedings of the Combustion Institute, vol. 31, pp. 393–400, 2007.
[26] D. B. Lenhert, D. L. Miller, and N. P. Cernansky, “The oxidation of JP-8,
Jet-A, and their surrogates in the low and intermediate temperature regime
at elevated pressures,” Combustion Science and Technology, vol. 179, no. 5,
pp. 845–861, 2007.
[27] R. P. Lindstedt and L. Q. Maurice, “Detailed chemical-kinetic model for
aviation fuels,” Journal of Propulsion and Power, vol. 16, no. 2, pp. 187–
195, 2000.
[28] G. Z. Liu, Y. J. Han, L. Wang, X. W. Zhang, and Z. T. Mi, “Solid deposits
from thermal stressing of n-dodecane and Chinese RP-3 jet fuel in the pres-
ence of several initiators,” Energy and Fuels, vol. 23, no. 1, pp. 356–365,
2009.
[29] M. A. Mawid, T. W. Park, B. Sekar, and C. Arana, “Importance of surro-
gate JP-8/Jet-A fuel composition in detailed chemical kinetics development,”
Tech. Rep. AIAA 2004-4207, 40th AIAA/ASME/SAE/ASEE Joint Propul-
sion Conference, 2004.
[30] A. Mensch, R. J. Santoro, T. A. Litzinger, and S.-Y. Lee, “Shock tube study
on auto-ignition characteristics of kerosene/air mixtures,” Combustion and
Flame, vol. 157, no. 6, pp. 1097–1105, 2010.
[31] R. H. Natelson, M. S. Kurman, N. P. Cernansky, and D. L. Miller, “Ex-
perimental investigation of surrogates for jet and diesel fuels,” Fuel, vol. 87,
no. 10-11, pp. 2339–2342, 2008.
[32] M. Sa!aripour, P. Zabeti, S. Dworkin, Q. Zhang, H. Guo, F. Liu, G. Small-
wood, and M. Thomson, “A numerical and experimental study of a laminar
sooting coflow Jet-A1 di!usion flame,” Proceedings of the Combustion Insti-
tute, vol. 33, pp. 601–608, 2011.
132

[33] S. S. Vasu, D. F. Davidson, and R. K. Hanson, “Jet fuel ignition delay
times: Shock tube experiments over wide conditions and surrogate model
predictions,” Combustion and Flame, vol. 152, no. 1-2, pp. 125–143, 2008.
[34] A. Violi, S. Yan, E. G. Eddings, A. F. Sarofim, S. Granata, T. Faravelli, and
E. Ranzi, “Experimental formulation and kinetic model for JP-8 surrogate
mixtures,” Combustion Science and Technology, vol. 174, no. 11, pp. 399–
417, 2002.
[35] C. P. Wood, V. G. McDonell, R. A. Smith, and G. S. Samuelsen, “Develop-
ment and application of a surrogate distillate fuel,” Journal of Propulsion,
vol. 5, no. 4, pp. 399–405, 1989.
[36] Y. Zhang, Z. H. Huang, J. H. Wang, and S. L. Xu, “Shock tube study
on auto-ignition characteristics of kerosene/air mixtures,” Chinese Science
Bulletin, vol. 56, no. 13, pp. 1399–1406, 2011.
[37] W. D. Schulz, “Analysis of jet fuel additives,” in Symposium on the Structure
of Jet Fuels III, American Chemical Society, pp. 477–483, 1992.
[38] R. C. Farmer, P. G. Anderson, and G. C. Cheng, “Propellant chemistry for
CFD applications,” Tech. Rep. NASA Document ID 19960029262, SECA
Inc., Huntsville, AL, 1996.
[39] R. C. Farmer, G. C. Cheng, and P. G. Anderson, “Development of a
tripropellant CFD design code,” Tech. Rep. NASA CR-207893, SECA Inc.,
Huntsville, AL, 1997.
[40] M. L. Huber, E. W. Lemmon, L. S. Ott, and T. J. Bruno, “Preliminary
surrogate mixture models for the thermophysical properties of rocket pro-
pellants RP-1 and RP-2,” Energy and Fuels, vol. 23, no. 6, pp. 3083–3088,
2009.
[41] M. L. Huber, E. W. Lemmon, and T. J. Bruno, “E!ects of RP-1 composi-
tional variability on thermophysical properties,” Energy and Fuels, vol. 23,
no. 11, pp. 5550–5555, 2009.
[42] E. M. Yoon, L. Selvaraj, C. Song, J. B. Stallman, and M. M. Coleman,
“High-temperature stabilizers for jet fuels and similar hydrocarbon mixtures.
133

1. Comparative studies of hydrogen donors,” Energy and Fuels, vol. 10, no. 3,
pp. 806–811, 1996.
[43] M. D. Tilicheev, “Kinetics of cracking of hydrocarbons under pressure,” For-
eign Petroleum Technology, vol. 7, no. 5/6, pp. 209–224, 1939.
[44] B. S. Greensfelder and H. H. Voge, “Catalytic cracking of pure hydrocar-
bons,” Industrial and Engineering Chemistry, vol. 37, no. 6, pp. 514–520,
1945.
[45] H. H. Voge and G. M. Good, “Thermal cracking of higher para"ns,” Journal
of the American Chemical Society, vol. 71, no. 2, pp. 593–597, 1949.
[46] P. Zhou and B. L. Crynes, “Thermolytic reactions of dodecane,” Industrial
and Engineering Chemistry Process Design and Development, vol. 25, no. 2,
pp. 508–514, 1986.
[47] P. Zhou, O. L. Hollis, and B. L. Crynes, “Thermolysis of higher molecular
weight straight-chain alkanes (C9-C22),” Industrial and Engineering Chem-
istry Research, vol. 26, no. 4, pp. 846–852, 1987.
[48] E. M. Yoon, L. Selvaraj, S. Eser, and M. M. Coleman, “High-temperature
stabilizers for jet fuels and similar hydrocarbon mixtures. 2. Kinetic studies,”
Energy and Fuels, vol. 10, no. 3, pp. 812–815, 1996.
[49] J. Yu and S. Eser, “Kinetics of supercritical-phase thermal decomposition
of (C10-C14) normal alkanes and their mixtures,” Industrial and Engineering
Chemistry Research, vol. 36, no. 3, pp. 585–591, 1997.
[50] A. E. Klingbeil, J. B. Je!ries, D. F. Davidson, and R. K. Hanson, “Two-
wavelength mid-IR diagnostic for temperature and n-dodecane concentration
in an aerosol shock tube,” Applied Physics B (Lasers and Optics), vol. 93,
no. 2-3, pp. 627–638, 2008.
[51] M. Watanabe, T. Adschiri, and K. Arai, “Overall rate constant of pyrolysis
of n-alkanes at a low conversion level,” Industrial and Engineering Chemistry
Research, vol. 40, no. 9, pp. 2027–2036, 2001.
134

[52] K. D. Dahm, P. S. Virk, R. Bounaceur, F. Battin-Leclerc, P. M. Marquaire,
R. Fournet, E. Daniau, and M. Bouchez, “Experimental and modelling inves-
tigation of the thermal decomposition of n-dodecane,” Journal of Analytical
and Applied Pyrolysis, vol. 71, no. 2, pp. 865–881, 2004.
[53] O. Herbinet, P. M. Marquaire, F. Battin-Leclerc, and R. Fournet, “Thermal
decomposition of n-dodecane: Experiments and kinetic modeling,” Journal
of Analytical and Applied Pyrolysis, vol. 78, no. 2, pp. 419–429, 2007.
[54] U. Kralikova, M. Bajus, and J. Baxa, “Pyrolysis of methylcyclohexane,” Col-
lection of Czechoslovak Chemical Communications, vol. 52, no. 6, pp. 1527–
1544, 1987.
[55] P. H. Taylor and W. A. Rubey, “Evaluation of the gas-phase thermal de-
composition behavior of future jet fuels,” Energy and Fuels, vol. 2, no. 6,
pp. 723–728, 1988.
[56] T. C. Brown and K. D. King, “Very low-pressure pyrolysis (VLPP) of
methyl- and ethynyl- cyclopentanes and cyclohexanes,” International Jour-
nal of Chemical Kinetics, vol. 21, no. 4, pp. 251–266, 1989.
[57] S. Zeppieri, K. Brezinsky, and I. Glassman, “Pyrolysis studies of methylcy-
clohexane and oxidation studies of methylcyclohexane and methylcyclohex-
ane/toluene blends,” Combustion and Flame, vol. 108, no. 3, pp. 266–286,
1997.
[58] C. S. McEnally and L. D. Pfe!erle, “Fuel decomposition and hydrocarbon
growth process for substituted cyclohexanes and for alkenes in nonpremixed
flames,” Proceedings of the Combustion Institute, vol. 30, pp. 1425–1432,
2005.
[59] J. P. Orme, H. J. Curran, and J. M. Simmie, “Experimental and modeling
study of methyl cyclohexane pyrolysis and oxidation,” Journal of Physical
Chemistry A, vol. 110, no. 1, pp. 114–131, 2006.
[60] R. T. Holman, M. Deubig, and H. Hayes, “Pyrolysis chromatography of
lipids. I. Mass spectrometric identification of pyrolysis products of hydrocar-
bons,” Lipids, vol. 1, no. 4, pp. 247–253, 1966.
135
[61] M. A. Oehlschlaeger, J. Steinberg, C. K. Westbrook, and W. J. Pitz, “The
autoignition of iso-cetane at high to moderate temperatures and elevated
pressures: Shock tube experiments and kinetic modeling,” Combustion and
Flame, vol. 156, no. 11, pp. 2165–2172, 2009.
[62] A. Agosta, N. P. Cernansky, D. L. Miller, T. Faravelli, and E. Ranzi, “Ref-
erence components of jet fuels: Kinetic modeling and experimental results,”
Experimental Thermal and Fluid Science, vol. 28, no. 7, pp. 701–708, 2004.
[63] P. Dagaut and K. Hadj-Ali, “Chemical kinetic study of the oxidation of
isocetane (2,2,4,4,6,8,8-heptamethylnonane) in a jet-stirred reactor: Exper-
imental and modeling,” Energy and Fuels, vol. 23, no. 5, pp. 2389–2395,
2009.
[64] O. Mathieu, N. Djebaili-Chaumeix, C.-E. Paillard, and F. Douce, “Experi-
mental study of soot formation from a diesel fuel surrogate in a shock tube,”
Combustion and Flame, vol. 156, no. 8, pp. 1576–1586, 2009.
[65] D. T. Wickham, G. O. Alptekin, J. R. Engel, and M. E. Karpuk, “Additives
to reduce coking in endothermic heat exchangers,” Tech. Rep. AIAA 99-2215,
35th AIAA/ASME/SAE/ASEE Joint Propulsion Conference, 1999.
[66] M. M. Coleman, L. Selvaraj, M. Sobkowiak, and E. Yoon, “Potential sta-
bilizers for jet fuels subjected to thermal stress above 400"C,” Energy and
Fuels, vol. 6, no. 5, pp. 535–539, 1992.
[67] J. V. Atria and T. Edwards, “High temperature cracking and deposition
behavior of an n-alkane mixture,” in Symposium on the Structure of Jet
Fuels IV, American Chemical Society, pp. 498–501, 1996.
[68] E. Corporan and D. K. Minus, “Assessment of radical stabilizing additives
for JP-8 fuel,” Tech. Rep. AIAA 98-3996, 34th AIAA/ASME/SAE/ASEE
Joint Propulsion Conference, 1998.
[69] L. Selvaraj, M. Sobkowiak, C. Song, J. B. Stallman, and M. M. Coleman,
“A model system for the study of additives designed to enhance the stability
of jet fuels at temperatures above 400"C,” Energy and Fuels, vol. 8, no. 4,
pp. 839–845, 1994.
136
[70] S. P. Heneghan, S. Zabarnick, D. R. Ballal, and W. E. Harrison III, “JP-
8+100: The development of high-thermal-stability jet fuel,” Journal of En-
ergy Resources Technology, vol. 118, no. 3, pp. 170–179, 1996.
[71] G. Liu, Y. Han, L. Wang, X. Zhang, and Z. Mi, “Supercritical thermal
cracking of n-dodecane in presence of several initiative additives: Products
distribution and kinetics,” Energy and Fuels, vol. 22, no. 6, pp. 3960–3969,
2008.
[72] G. L. Pilla, D. F. Davidson, and R. K. Hanson, “Shock tube/laser absorption
measurements of ethylene time-histories during ethylene and n-heptane py-
rolysis,” Proceedings of the Combustion Institute, vol. 33, no. 1, pp. 333–340,
2011.
[73] S. H. Pyun and R. K. Hanson, “iso-Butene cross section measurements at
10.532 µm and 10.675 µm,” 2011. Personal communication.
[74] M. Frenklach, S. Taki, M. B. Durgaprasad, and R. A. Matula, “Soot forma-
tion in shock-tube pyrolysis of acetylene, allene, and 1,3-butadiene,” Com-
bustion and Flame, vol. 54, no. 1-3, pp. 81–101, 1983.
[75] A. Alexiou and A. Williams, “Soot formation in shock-tube pyrolysis of
toluene-n-heptane and toluene-iso-octane mixures,” Fuel, vol. 74, no. 2,
pp. 153–158, 1995.
[76] F. Douce, N. Djebaili-Chaumeix, C.-E. Paillard, C. Clinard, and J.-N.
Rouzaud, “Soot formation from heavy hydrocarbons behind reflected shock
waves,” Proceedings of the Combustion Institute, vol. 28, no. 2, pp. 2523–
2529, 2000.
[77] D. F. Davidson and R. K. Hanson, “Recent advances in shock tube/laser
diagnostic methods for improved chemical kinetics measurements,” Shock
Waves, vol. 19, no. 4, pp. 271–283, 2009.
[78] D. F. Davidson, D. Haylett, and R. K. Hanson, “Development of an aerosol
shock tube for kinetic studies of low-vapor-pressure fuels,” Combustion and
Flame, vol. 155, no. 1-2, pp. 108–117, 2008.
137

[79] D. R. Haylett, D. F. Davdison, and R. K. Hanson, “Development of an
aerosol shock tube for kinetic studies of low-vapor-pressure fuels,” Tech. Rep.
AIAA 2007-5678, 43th AIAA/ASME/SAE/ASEE Joint Propulsion Confer-
ence, 2007.
[80] D. R. Haylett, P. P. Lappas, D. F. Davdison, and R. K. Hanson, “Application
of an aerosol shock tube to the measurement of diesel ignition delay times,”
Proceedings of the Combustion Institute, vol. 32, pp. 477–484, 2009.
[81] D. R. Haylett, R. D. Cook, D. F. Davdison, and R. K. Hanson, “OH and C2H4
species time histories during hexadecane and diesel ignition behind reflected
shock waves,” Proceedings of the Combustion Institute, vol. 33, pp. 167–173,
2011.
[82] D. R. Haylett, D. F. Davdison, and R. K. Hanson, “Second-generation aerosol
shock tube: Improved design,” Shock Waves, in press.
[83] D. Ambrose and N. B. Ghiassee, “Vapour pressure and critical temperature
and critical pressure of 2,2,4,4,6,8,8-heptamethylnonane,” Journal of Chem-
ical Thermodynamics, vol. 20, no. 10, pp. 1231–1232, 1988.
[84] “CPIA/M4 liquid propellant manual,” tech. rep., Chemical Propulsion In-
formation Agency, Columbia, MD, 1997.
[85] D. Quiggle and M. R. Fenske, “Vapor-liquid equilibria of methylcyclohexane-
toluene mixtures,” Journal of the American Chemical Society, vol. 59, no. 10,
pp. 1231–1232, 1937.
[86] C. L. Yaws, Yaws’ Handbook of Thermodynamic and Physical Prop-
erties of Chemical Compounds. Knovel, 2003. available online at
<www.knovel.com/web/portal/browse/display? EXT KNOVEL
DISPLAY bookid=667&VerticalID=0>.
[87] E. L. Petersen, D. F. Davidson, M. Rohrig, and R. K. Hanson, “High-pressure
shock-tube measurements of ignition delay times in stoichiometric H2/O2/Ar
mixtures,” Shock Waves - Proceedings of the 20th International Symposium
on Shock Waves, vol. 2, pp. 941–946, 1996.
138

[88] E. L. Petersen, D. F. Davidson, and R. K. Hanson, “Ignition delay times
of ram accelerator CH4/O2/diluent mixtures,” Journal of Propulsion and
Power, vol. 15, no. 1, pp. 82–91, 1999.
[89] “Detail specification: Propellant, rocket grade kerosene,” Tech. Rep. MIL-
DTL-25576E, U.S. Air Force, 14 April 2006.
[90] “Detail specification: Turbine fuel, low volatility, JP-7,” Tech. Rep. MIL-
DTL-38219D, U.S. Air Force, 21 August 1998.
[91] A. J. Giovanetti, L. J. Spadaccini, and E. J. Szetela, “Deposit formation and
heat transfer in hydrocarbon rocket fuels,” Tech. Rep. NASA CR-168277,
National Aeronautics and Space Administration, 1983.
[92] N. B. Vargaftik, Y. K. Vinogradov, and V. S. Yargin, Handbook of physical
properties of liquids and gases: pure substances and mixtures. Begell House,
1996.
[93] E. Goos, A. Burcat, and B. Ruscic, “Third millennium ideal gas and con-
densed phase thermochemical database for combustion,” Tech. Rep. ANL-
05/20, Argonne National Laboratory, September 2005. available online at
<garfield.chem.elte.hu/Burcat/burcat.html>.
[94] W. V. Steele, R. D. Chirico, I. A. Hossenlopp, A. Nguyen, N. K. Smith,
and B. E. Gammon, “The thermodynamic properties of 1,2,3,4- and 5,6,7,8-
tetrahydroquinolines,” Journal of Chemical Thermodynamics, vol. 21, no. 11,
pp. 1121–1149, 1989.
[95] W. J. Pitz, C. V. Naik, T. Ni Mhaolduin, C. K. Westbrook, H. J. Curran,
J. P. Orme, and J. M. Simmie, “Modeling and experimental investigation of
methylcyclohexane ignition in a rapid compression machine,” Proceedings of
the Combustion Institute, vol. 31, no. 1, pp. 267–275, 2007.
[96] A. E. Klingbeil, J. B. Je!ries, and R. K. Hanson, “Temperature-dependent
mid-IR absorption spectra of gaseous hydrocarbons,” Journal of Quantitative
Spectroscopy and Radiative Transfer, vol. 107, no. 3, pp. 407–420, 2007.
[97] A. E. Klingbeil, J. B. Je!ries, and R. K. Hanson, “Temperature- and
pressure-dependent absorption cross sections of gaseous hydrocarbons at 3.39
139

µm,” Measurement Science and Technology, vol. 17, no. 7, pp. 1950–1957,
2006.
[98] M. E. MacDonald, D. F. Davidson, and R. K. Hanson, “Decomposition
measurements of RP-1, RP-2, JP-7, n-dodecane, and tetrahydroquinoline in
shock tubes,” Journal of Propulsion and Power, vol. 27, no. 5, pp. 981–989,
2011.
[99] A. E. Klingbeil, “Mid-IR laser absorption diagnostics for hydrocarbon vapor
sensing in harsh environments,” 2007. Ph.D. Thesis, Stanford University.
[100] Z. Hong, K. Y. Lam, D. F. Davidson, and R. K. Hanson, “A comparative
study of the oxidation characteristics of cyclohexane, methylcyclohexane, and
n-butylcyclohexane at high temperatures,” Combustion and Flame, vol. 158,
no. 8, pp. 1456–1468, 2011.
[101] S. W. Sharpe, T. J. Johnson, R. L. Sams, P. M. Chu, G. C. Rhoderick, and
P. A. Johnson, “Gas-phase databases for quantitative infrared spectroscopy,”
Applied Spectroscopy, vol. 58, no. 12, pp. 1452–1461, 2004.
[102] W. Ren, D. F. Davidson, and R. K. Hanson, “IR laser absorption diagnostic
for C2H4 in shock tube kinetics studies,” International Journal of Chemical
Kinetics, 2011.
[103] L. Q. Maurice, H. Lander, T. Edwards, and W. E. Harrison III, “Advanced
aviation fuels: A look ahead via a historical perspective,” Fuel, vol. 80, no. 5,
pp. 747–756, 2001.
[104] M. Lewis, “X-51 scrams into the future,” Aerospace America, vol. 48, no. 9,
pp. 26–31, 2010.
[105] C. K. Westbrook, W. J. Pitz, O. Herbinet, H. J. Curran, and E. J. Silke, “A
comprehensive detailed chemical kinetic reaction mechanism for combustion
of n-alkane hydrocarbons from n-octane to n-hexadecane,” Combustion and
Flame, vol. 156, no. 1, pp. 181–199, 2009.
[106] C. Rebick, Pyrolysis: Theory and Industrial Practice. Academic Press, 1983.
Edited by L. F. Albright, B. L. Crynes, and W. H. Corcoran.
140
[107] B. M. Fabuss, J. O. Smith, R. I. Lait, A. S. Borsanyi, and C. N. Satterfield,
“Rapid thermal cracking of n-hexadecane at elevated pressures,” Industrial
and Engineering Chemistry Process Design and Development, vol. 1, no. 4,
pp. 293–299, 1962.
[108] B. M. Fabuss, J. O. Smith, R. I. Lait, M. A. Fabuss, and C. N. Satterfield,
“Kinetics of thermal cracking of para"nic and naphthenic fuels at elevated
pressures,” Industrial and Engineering Chemistry Process Design and Devel-
opment, vol. 3, no. 1, pp. 33–37, 1964.
[109] M. J. Pilling and P. W. Seakins, Reaction Kinetics. Oxford University Press,
2005.
[110] H. Wang, E. Dames, B. Sirjean, D. A. Sheen, R. Tangko, A. Violi, J. Y. W.
Lai, F. N. Egolfopoulos, D. F. Davidson, R. K. Hanson, C. T. Bowman,
C. K. Law, W. Tsang, N. P. Cernansky, D. L. Miller, and R. P. Lindstedt,
“Jetsurf 2.0: A high-temperature chemical kinetic model of n-alkane (up
to n-dodecane), cyclohexane, and methyl-, ethyl-, n-propyl- and n-butyl-
cyclohexane oxidation at high temperatures,” September 2010. Available
online at <melchior.usc.edu/JetSurF>.
[111] W. G. Mallard and W. C. Gardiner, Jr., “Absorption of the 3.39 µm He-Ne
laser line by methane from 300 to 2400 K,” Journal of Quantitative Spec-
troscopy and Radiative Transfer, vol. 20, no. 2, pp. 135–149, 1978.
[112] O. M. Vinnitskii, A. N. Musayev, I. A. Sanin, and K. P. Lavrovskii, “Mech-
anism of cracking of higher para"ns,” Petroleum Chemistry: USSR, vol. 13,
no. 2, pp. 124–134, 1973.
[113] J. A. Widegren and T. J. Bruno, “Thermal decomposition kinetics of
kerosene-based rocket propellants. 3. RP-2 with varying concentrations of
the stabilizing additive 1,2,3,4-tetrahydroquinoline,” Energy & Fuels, vol. 25,
no. 1, pp. 288–292, 2011.
[114] H. Lander and A. C. Nixon, “Endothermic fuels for hypersonic vehicles,”
Journal of Aircraft, vol. 8, no. 4, pp. 200–207, 1971.
141

[115] S. Granata, T. Faravelli, and E. Ranzi, “A wide range kinetic modeling study
of the pyrolysis and combustion of naphthenes,” Combustion and Flame,
vol. 132, no. 3, pp. 533–544, 2003.
[116] F. E. Frey and H. J. Hepp, “Thermal decomposition of simple para"ns,”
Industrial and Engineering Chemistry, vol. 25, no. 4, pp. 441–449, 1933.
[117] F. E. Frey, “Pyrolysis of saturated hydrocarbons,” Industrial and Engineer-
ing Chemistry, vol. 26, no. 2, pp. 198–203, 1934.
[118] Q. D. Wang, J. B. Wang, J. Q. Li, N. X. Tan, and X. Y. Li, “Reactive
molecular dynamics simulation and chemical kinetic modeling of pyrolysis
and combustion of n-dodecane,” Combustion and Flame, vol. 158, no. 2,
pp. 217–226, 2011.
[119] R. Jiang, G. Liu, Z. You, M. Luo, X. Wang, L. Wang, and X. Zhang, “On the
critical points of thermally cracked hydrocarbon fuels under high pressure,”
Industrial and Engineering Chemistry Research, vol. 50, no. 15, pp. 9456–
9465, 2011.
[120] N. Gascoin, P. Gillard, S. Bernard, and M. Bouchez, “Characterization of
coking activity during supercritical hydrocarbon pyrolysis,” Fuel Processing
Technology, vol. 89, no. 12, pp. 9456–9465, 2008.
[121] M. E. MacDonald, W. Ren, D. F. Davidson, and R. K. Hanson, “Fuel
and ethylene measurements during n-dodecane, methylcyclohexane, and iso-
cetane decomposition in shock tubes,” Fuel, 2012.
[122] D. F. Davidson, M. A. Oehlschlaeger, and R. K. Hanson, “Methyl concentra-
tion time-histories during iso-octane and n-heptane oxidation and pyrolysis,”
Proceedings of the Combustion Institute, vol. 31, no. 1, pp. 321–328, 2007.
[123] W. J. Pitz, C. K. Westbrook, and M. Mehl, “LLNL - mix: A detailed
kinetic mechanism including n-alkane, methylcyclohexane, and iso-cetane
chemistry,” 2011. Personal communication.
[124] J. Stewart, K. Brezinsky, and I. Glassman, “Supercritical pyrolysis of decalin,
tetralin, and n-decane at 700-800 K. Product distribution and reaction mech-
142
anism,” Combustion Science and Technology, vol. 136, no. 1-6, pp. 373–390,
1998.
[125] T. A. Ward, J. S. Ervin, and S. Zabarnick, “Pressure e!ects on flowing
mildy-cracked n-dodecane,” Journal of Propulsion and Power, vol. 21, no. 2,
pp. 344–355, 2005.
[126] E. B. Ledesma, M. J. Wornat, P. G. Felton, and J. A. Sivo, “The e!ects
of pressure on the yields of polycyclic aromatic hydrocarbons produced dur-
ing the supercritical pyrolysis of toluene,” Proceedings of the Combustion
Institute, vol. 30, no. 1, pp. 1370–1379, 2005.
[127] P. E. Savage, S. Gopalan, T. I. Mizan, C. J. Martino, and E. E. Brock, “Re-
actions at supercritical conditions: Applications and fundamentals,” AIChE
Journal, vol. 41, no. 7, pp. 1723–1778, 1995.
143