Embed Size (px)
Citation preview

i
The Pennsylvania State University
The Graduate School
PLANNING FOR A WIND FARM’S END-OF-LIFE: A DETAILED COST ANALYSIS OF
DECOMMISSIONING PRACTICES AND SUGGESTED PROJECT PLANNING STRATEGIES
A Thesis in
Energy and Mineral Engineering
by
Allison M. Boehm
Submitted in Partial Fulfillment of the Requirements
for the Degree of
Master of Science
May 2014

ii
The thesis of Allison M. Boehm was reviewed and approved* by the following:
Seth Blumsack Associate Professor, John and Willie Leone Family Department of Energy and Mineral Engineering Thesis Co-Advisor Susan Stewart Assistant Professor and Research Associate, Aerospace Engineering & Architectural Engineering Thesis Co-Advisor Jeffrey Brownson Associate Professor, John and Willie Leone Family Department of Energy and Mineral Engineering
Luis Ayala Department Head, John and Willie Leone Family Department of Energy and Mineral Engineering
*Signatures are on file in the Graduate School

iii
ABSTRACT
The United States’ wind industry is beginning to show signs of maturation, with some of the
earliest constructed wind turbines reaching their end of useful life and the larger mega-watt
scale turbines not trailing far behind. Experience with decommissioning utility scale wind
generators in the U.S. is virtually non-existent. Smaller (less than 500 kW) turbines have
completely different configurations that are not analogous to their massive multi mega-watt
successors. Understanding and planning for decommissioning costs is misunderstood by wind
farm developers and often a financial stymie for a project. With little known about the costs
associated with deconstructing a wind farm, it’s difficult for developers to convince landowners
and local authorities that they have properly planned for decommissioning a project in an event
the towers need to come down. In response, local authorities have put unreasonable price tags
on the decommissioning phase and, in many cases, required upfront capital investments at a
phase in development that is already impoverished by initial capital costs. Understanding the
true costs associated with decommissioning a wind farm is essential to the U.S. wind industry’s
growth. This research looks closely at crane, de-construction and land reclamation costs of
decommissioning a wind farm. It compares these costs to potential end of life decisions, such
as salvaging the turbine or reselling the turbine. The findings from this analysis will create a
framework that can be used by developers, landowners, and local officials for judicious wind
project planning.

iv
Table of Contents
Table of Figures……………………………………………………………………………………………………………….vii
Table of Tables…………………………………………………………………………………………………………………viii
Acknowledgements………………………………………………………………………………………………………….x
Introduction ................................................................................................................................. 1 Chapter 1
......................................................................................................................... 4 Chapter 2 Literature Review
History of grid scale wind energy in the U.S. ............................................................................................ 4
Experience with decommissioning in other energy industries ................................................................. 5
Available decommissioning literature ...................................................................................................... 6
Past and current decommissioning policy ................................................................................................ 7
Decommissioning Scope of Work................................................................................................. 9 Chapter 3
Expected turbine lifespan ......................................................................................................................... 9
Decommissioning procedures ................................................................................................................. 10
Financial security..................................................................................................................................... 12
Estimated decommissioning costs and turbine value ............................................................................ 12
............................................................................ 15 Chapter 4 Analysis of Available Decommissioning Plans
Review of available decommissioning plans ........................................................................................... 16
Turbine removal .................................................................................................................................. 16
Site restoration ................................................................................................................................... 20
Transportation costs ........................................................................................................................... 22
v
Additional decommissioning tasks.......................................................................................................... 24
Electrical collection system ................................................................................................................. 24
Structural removal .............................................................................................................................. 25
Overall decommissioning costs ........................................................................................................... 26
Estimated salvage values .................................................................................................................... 28
............................................................................................................ 29 Chapter 5 Analysis of Industry Data
Crane costs .............................................................................................................................................. 30
Crane cost cata collected .................................................................................................................... 35
Analysis of crane costs ........................................................................................................................ 35
Industry crane costs compared to decommissioning plan crane costs .............................................. 42
Demolition and transportation costs ...................................................................................................... 43
Salvage values ......................................................................................................................................... 45
Nacelle .................................................................................................................................................... 46
Rotor ....................................................................................................................................................... 46
Tower sections ........................................................................................................................................ 46
Foundation .............................................................................................................................................. 47
Estimated salvage values ........................................................................................................................ 47
Industry salvage values compared to decommissioning plan salvage values .................................... 49
Comparison of Available Plans and Industry Collected Data ..................................................... 50 Chapter 6
750 KW Turbine .................................................................................................................................. 50

vi
1.5 MW Turbine .................................................................................................................................. 50
Decommissioning costs and their overall effect on the LCOE of wind energy ....................................... 51
.................................................................................................................. 54 Chapter 7 Turbine Resale Value
.......................................................................................... 58 Chapter 8 Conclusion and Suggested Practices
Suggested planning strategies for decommissioning ............................................................................. 59
Bibliography…………………………………………………………………………………………………………………………………………..62
..................................................................................................................................................... 66 Appendix

vii
List of Figures
Figure 2-1: United States Wind Energy Annual and Cumulative Capacity (AWEA 2013) ............................ 5
Figure 4-1: Tower Removal Costs per MW ................................................................................................. 19
Figure 4-2: Cost of Foundation Removal and Depth of Restoration ........................................................... 20
Figure 4-3: Total Site Restoration Costs ...................................................................................................... 22
Figure 4-4: Decommissioning Costs $/MW ................................................................................................. 27
Figure 4-5: Net Decommissioning Costs ..................................................................................................... 27
Figure 4-6: Estimated Salvage Values from Individual Decommissioning Plan .......................................... 28
Figure 5-1: Wind Resource in the U.S., NREL .............................................................................................. 32
Figure 5-2: Wind Power Capacity in 2000 ................................................................................................. 33
Figure 7-1: Rising Project Costs Are Driven, in Part, By Rising Wind Turbine Prices (Wiser 2008) ............. 55
Figure 7-2: Turbine Re-sale Value Based on Year Commissioned .............................................................. 56

viii
List of Tables
Table 4-1: Prep and Disassembly Costs....................................................................................................... 17
Table 4-2: Crane Costs ................................................................................................................................ 18
Table 4-3: Overall Turbine Removal Quotes ............................................................................................... 19
Table 4-4: Total Decommissioning Costs .................................................................................................... 26
Table 5-1: Wind Speed Frequency .............................................................................................................. 34
Table 5-2: Regular Time Crane Costs for 750 kW Turbine .......................................................................... 35
Table 5-3: Regular Time Crane Costs for 1.5 MW Turbine ......................................................................... 36
Table 5-4: Standby Rates for 100T and 300T Cranes with 8 m/s Crane Operational Limit ........................ 37
Table 5-5: Standby rates for 100T and 300T Cranes with 12 m/s Crane Operational Limit ....................... 39
Table 5-6: Standby Rates for the 100T and 350T Cranes with 8 m/s Crane Operational Limit .................. 39
Table 5-7: Standby Rates for the 100T and 350T Cranes with 12 m/s Crane Operational Limit ................ 41
Table 5-8: Turbine Tower Assumptions ...................................................................................................... 44
Table 5-9, Calculated Salvage Values .......................................................................................................... 48
Table 5-10: High and Low Estimated Salvage Values .................................................................................. 48
Table 5-11: Demolition Industry Provided Salvage Value ........................................................................... 49
Table 6-1: Comparison of Plans and Industry Data for the 750 kW Scenario ............................................. 50
Table 6-2: Comparison of Plans and Industry Data for the 1.5 MW Scenario ............................................ 51
Table 6-3: NREL LCOE Baseline Parameters for a 1.5 MW Wind Turbine ................................................... 51
Table 6-4: 1.5 MW Turbine Decommissioning Costs from Industry Data .................................................. 52
Table 6-5: Recalculated LCOE Including Decommissioning Costs ............................................................... 53
Table 7-1: Resale Value as a Function of Time............................................................................................ 56
Table 9-1: Crane Survey .............................................................................................................................. 66
Table 9-2: Turbine Size ................................................................................................................................ 67

ix
Table 9-3 Decommissioning Plan Citations ................................................................................................. 68

x
Acknowledgments
I would like to first thank The Wind Energy Foundation and Ms. Darlene Snow for financially
supporting this research. My advisors and committee members, Dr. Seth Blumsack , Dr. Susan
Stewart, and Dr. Jeffrey Brownson are three of the most knowledgeable professionals in the
renewable energy industry and I am very thankful for their guidance and support through this
research process. I would like to say a special thanks to Mr. Eric Rohrs for his wind turbine
construction expertise and willingness to answer all my inquiries. I would like to thank all of the
industry participants for their time and cooperation. Lastly, I would like to thank my parents
who have been extremely supportive.

1
Introduction Chapter 1
As the United States wind industry continues to grow and evolve with technology and
innovation changes, some of the industry’s earliest wind farms are approaching the end of their
useful life cycle. Questions about the future use of the land and plans for decommissioning of
the turbines are a valid concern. Much like any large scale project, ultimate plans and decisions
weigh heavily on economics. The purpose of this study is to examine the costs associated with
decommissioning a wind generation power plant to formulate better decommissioning
planning strategies for the future development of wind farms. This is done through the
analysis of current decommissioning practices and collection of industry data. The results of
this research will deliver guidance for both the planning and decommissioning phase by
providing more accurate cost estimates for landowners, public officials, and others affected by
the long term effects of wind power.
There are many motives for this research. The first is the overall lack of experience the U.S.
wind industry has with decommissioning practices. Because the majority of farms in the U.S.
are still currently in their operational phase, very few industry professionals have had hands-on
experience decommissioning turbines. The lack of experience is evident in the variance of
decommissioning budgets provided in the decommissioning plans reviewed for this research.
Another motive for this research is the lack of decommissioning plans created or publicly
available from the original wind farms installed in the United States. In fact, a majority of the
earliest wind farms in the U.S. were not required to submit decommissioning plans prior to
construction, so sites were erected without any agreement for funds to be allocated to the

2
decommissioning phase. This research aims to provide decommissioning strategies to be used
by many of the earliest wind farms that are lacking proper end of life planning.
Lastly, the misunderstood cost component of decommissioning wind turbines can drastically
affect wind energy development. Little information on the decommissioning project costs and
end of life plans of wind turbine generation plants is available to the public. This absence of
operational experience associated with decommissioning wind turbines coupled with the lack
of publicly available data has led policy makers, landowners, and wind farm developers to make
broad assumptions when it comes to the costs associated with planning for a farm’s end of life.
On one end of the spectrum, regulating agencies are concerned about high decommissioning
costs and have cautiously assigned an exceptionally high value to the decommissioning scope
and required expensive upfront decommissioning funds prior to a project’s construction.
Construction and development, in the wind industry, constitutes the most capital intensive
portion of the project’s life-cycle. Requiring total tower decommissioning funds prior to
construction could seriously deter wind energy development. On the other side of the issue,
developers are concerned about cash flow and have a strong desire to keep costs low. They are
motivated to assign a value to the decommissioning phase as low as possible, so they may
underestimate the value of the decommissioning process. Inadequate decommissioning funds
could cause major financial burden to landowners and municipalities if projects are abandoned.
Understanding the costs associated with decommissioning is imperative to eliminate financial
risks to landowners and taxpayers without thwarting wind energy development.

3
This paper examines the available decommissioning literature from both academia and
industry. It collects and analyzes publicly available decommissioning plans and creates a
database of cost information from those plans. Business professionals from the crane,
demolition, and salvage industry were contacted and asked to provide cost information for
comparison to the available decommissioning plans. The resale value of the turbines was also
explored. From the data and information collected, the research introduces new
decommissioning policy framework to minimize financial risks associated with improperly
planned turbine end of life strategies.

4
Chapter 2
Literature Review
History of grid scale wind energy in the U.S.
In the United States, wind power as a viable source for utility scale electricity generation began
in 1982 when California achieved grid scale wind integration (Nelson 2013). As a result of
financial support instruments in California, wind energy development flourished because of
federal and state tax incentives that encouraged renewable energy power generation. These
incentives funded the first major use of wind power for utility electricity (Nelson 2013). The
turbines, concentrated largely in excellent wind resource areas east of San Francisco and north-
east of Los Angles, were small machines capable of producing up to 100 kW (Burton et. al
2001). By the end of the 1980’s, approximately 15,000 wind turbines with a capacity of 1,500
MW were installed in California (Kaldellis and Zafirakis 2011). The state of California made up
most of the United States wind farms through the 1990’s. Low natural gas prices from Canada
and lack of federal tax incentives caused stalled industry growth through the 1990’s. It wasn’t
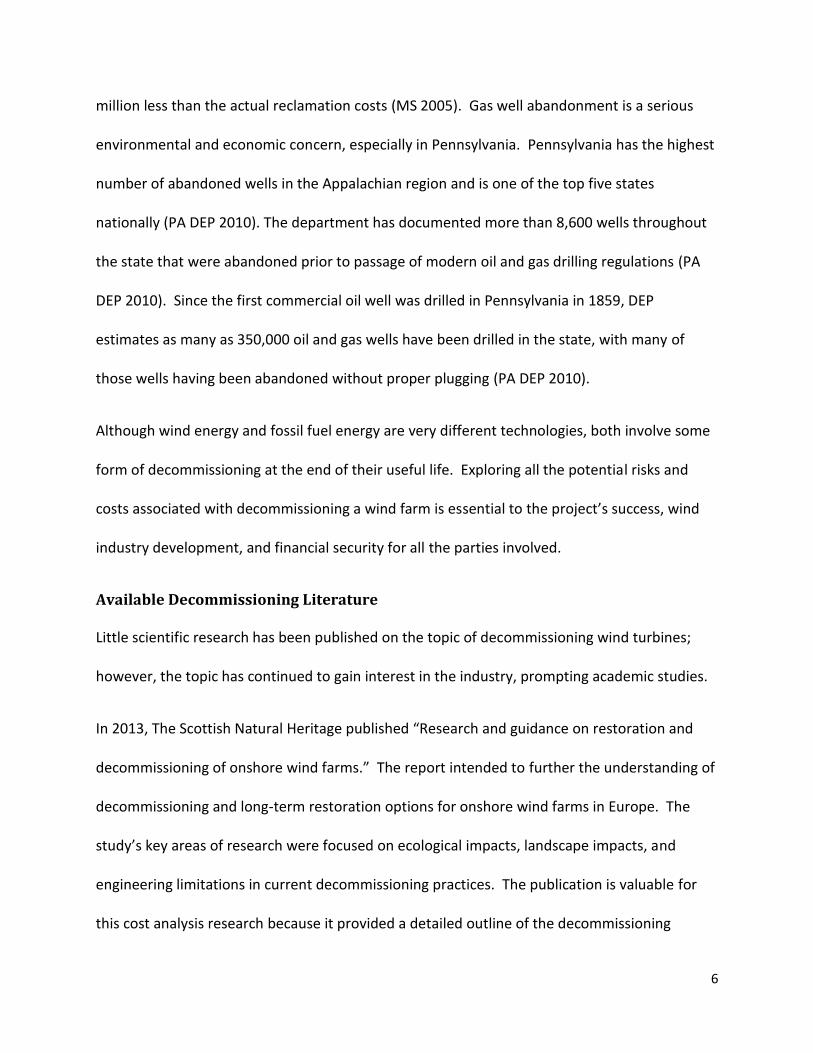
until the mid-2000s that the wind industry really ramped up turbine installations. The following
figure shows the trend of development of larger capacity wind turbines in the United States
since 1999.

5
Figure 2-1: United States Wind Energy Annual and Cumulative Capacity (AWEA 2013)
Turbine lifespan can vary by the manufacturer; however the average lifespan of a typical multi-
MW wind turbine is widely assumed to be 20 years (Tegen et al.. 2012). From 1998-1999, 98%
of the turbines installed in the United States were 501 kW to 1MW machines. From 2002-2003,
44% of turbines installed during that period were in the 500 kW to 1MW range and 43% were in
the 1.01 MW- 1.5MW (NREL 2012a). With the most notable multi-MW wind energy
development starting in the early 2000’s, end of life for these machines will be approaching
within the next seven to ten years.
Experience with decommissioning in other energy industries
The more mature energy industries, such as oil and gas, provide examples of the long term
effects of poorly planned decommissioning phases. Abandoned gas wells have led to acid mine
drainage and contaminated water ways (Hedin et al. 2005). Reclamation of abandoned wells is
accompanied by a hefty price tag that is usually passed on to local and/or state authorities. An
example of this was seen in Campbell County, Wyoming, where 120 natural gas wells were
abandoned. The $125,000 decommissioning bond posted for the 120 well sites was $3.875
6
million less than the actual reclamation costs (MS 2005). Gas well abandonment is a serious
environmental and economic concern, especially in Pennsylvania. Pennsylvania has the highest
number of abandoned wells in the Appalachian region and is one of the top five states
nationally (PA DEP 2010). The department has documented more than 8,600 wells throughout
the state that were abandoned prior to passage of modern oil and gas drilling regulations (PA
DEP 2010). Since the first commercial oil well was drilled in Pennsylvania in 1859, DEP
estimates as many as 350,000 oil and gas wells have been drilled in the state, with many of
those wells having been abandoned without proper plugging (PA DEP 2010).
Although wind energy and fossil fuel energy are very different technologies, both involve some
form of decommissioning at the end of their useful life. Exploring all the potential risks and
costs associated with decommissioning a wind farm is essential to the project’s success, wind
industry development, and financial security for all the parties involved.
Available Decommissioning Literature
Little scientific research has been published on the topic of decommissioning wind turbines;
however, the topic has continued to gain interest in the industry, prompting academic studies.
In 2013, The Scottish Natural Heritage published “Research and guidance on restoration and
decommissioning of onshore wind farms.” The report intended to further the understanding of
decommissioning and long-term restoration options for onshore wind farms in Europe. The
study’s key areas of research were focused on ecological impacts, landscape impacts, and
engineering limitations in current decommissioning practices. The publication is valuable for
this cost analysis research because it provided a detailed outline of the decommissioning

7
construction procedure. Many of the construction methods outlined in this research can be
attributed to the Scottish Natural Heritage document.
Another valuable wind turbine decommissioning document was recently published by Ferrel
and Devuyst. Their research paper, “Decommissioning Wind Energy Projects: An Economic and
Political Analysis,” provides valuable information about the decommissioning issues in
Oklahoma and chronicles the development of the decommissioning component of the
Oklahoma Wind Energy Development Act. The Oklahoma Wind Energy Development Act is
unique in that it provides rules for owners of wind energy facilities related to decommissioning,
payments, and insurance. The Oklahoma Wind Energy Act reached the conclusion that the
owners of a wind energy facility will provide evidence of financial security in the fifteenth year
of operation to cover the anticipated costs of decommissioning the facility. The Act was signed
into law and went into effect on January 1, 2011. The law, however, still lacks the
understanding of what those costs will be. The paper clearly states that “Perhaps most
importantly, more data is needed regarding the procedures for the effective decommissioning
of wind energy projects and costs thereof (Ferrell and DeVuyst 2013).”
Past and Current Decommissioning Policy
Up until the early 2000s, wind farms that came online rarely had decommissioning agreements
established (Ferrell and DeVuyst 2013). Presently, however, decommissioning is discussed in
the permitting phase of a project. Most permit issuing agencies now: 1) require wind
developers to post bonds after permitting to ensure that decommissioning costs are covered

8
or; 2) rely on the project developer to contribute to a decommissioning fund as the project
generates revenue; or 3) rely on the salvage value of any abandoned equipment (NWCC 2002).
The first option, in which the developers are required to post bonds after permitting to ensure
that the decommissioning costs are covered, raises the big question as to “what exactly are the
costs associated with decommissioning?” Because of many variables, the value of the turbine
and the costs of decommissioning when it reaches its end of useful life in 20 years, predicting
those costs have been very difficult.
The second option, allowing the developer to contribute to a decommissioning fund as the
project generates revenue, requires that the project generates revenue. In the case that a
project is not financially successful, it would likely be abandoned. Under these specific terms,
there would be no funds to decommission the turbine.
The final option, relying on the salvage value of the turbine to cover the decommissioning costs,
requires an acute understanding of both the components and the value of the turbine. This is
an incredibly broad assumption that has very little data or facts to confirm its validity.
The experience and literature available today lacks industry and cost statistics. The research in
this document will build on the research in the available literature. It collected and analyzed
costs from currently available decommissioning plans as well as independently collected cost
information from industry professionals.
9
Decommissioning Scope of Work Chapter 3
Many state and local governments now require a detailed “Decommissioning Plan,” for the
project to proceed to development. Developers are required to submit a detailed plan in the
initial permitting phase of a project. Twenty-one different publically available decommissioning
plans were collected from the internet and from local officials and analyzed. Each site and their
corresponding URL are located in the Appendix. Because there is no set uniform
decommissioning regulations mandated by the Federal government, each state, and in many
cases, each township, regulate the development and decommissioning process. Access to
public data is scarce. This is likely due to the fact that very few small, local governments have
the resources to organize and post every document to a website. In many cases, one would
need to physically visit the regulator’s office to find the decommissioning information they are
seeking.
Each plan shared similar basic elements. They all discussed the expected turbine lifespan, a
decommissioning scope of work, a decommissioning financial assurance payment schedule, and
an estimated value/cost of the decommissioning incidence.
Expected turbine lifespan
The average life of a wind turbine based on the decommissioning plans analyzed was 21 years.
The longest lifespan predicted was 30 years at the Buffalo Ridge II wind farm. The shortest
lifespan was predicted at Orangeville (formally Stony Creek) wind farm. The Orangeville Wind
farm decommissioning plan was unique. It was one of the only plans to explore the re-sale
values of the wind turbines. This decommissioning plan considered the value of the turbine
after 10 years of operation, however did not provide reasoning to the value it assigned.

10
Decommissioning procedures
The decommissioning of a wind farm entails the dismantling and removal of all of the wind
turbines’ components, as well as the disassembly of the underground and overhead electrical
transmission system. It also includes the removal of any structures, such as operations and
maintenance buildings or meteorological equipment and the removal of access roads. Because
the costs associated with structural removal is both particularly high and incredibly site specific,
this research focused primarily on the costs associated with turbine removal and site
reclamation. Typically, the foundations for the towers and other structures are removed to a
specified depth below the ground surface. Depending on the permits and terms of the lease,
the wind developer may be required to restore vegetation to the site and return the property
to its natural state or prior use (NWCC 2002). Based on the twenty-one publicly available
decommissioning plans were gathered and analyzed, the following are the general tasks and
methodologies submitted by a construction/demolition contractor:
Turbine Removal: The turbine consists of the blades, hub and nose cone, nacelle, and
tower. High capacity cranes on exiting crane pads are used to take the individual pieces
to the ground (Welstead et al.. 2013). The nacelle is disassembled and components are
placed on trailer for recycling/landfill. A detailed scope of this phase is further discussed
in chapter five of this thesis.
Turbine Base Removal: Excavators and dump trucks are used to remove the backfill
above and around the tower base. Excavator mounted hydraulic hammers are needed
to dismantle the concrete bases. Steel burning equipment is used to cut through
foundation re-bar. Anchor bolts, re-bar, conduits, and cables are all removed to a
11
specific depth. This depth ranged from two to four feet in the analyzed
decommissioning plans. If the transformer is located at the base of the tower, similar
practices are used to break and remove the concrete base. Topsoil and sub grade
material are used to fill excavated areas while unexcavated areas are compacted and
restored to a consistency compatible to the surrounding area (Welstead et al.. 2013).
Crane pad and road restoration: The pad and roads are excavated and re-graded to
original conditions. The area is reinstated with suitable soils and vegetation (Welstead
et al.. 2013).
Cable removal: An excavator is used to pull existing cabling out of the ground. All of the
plans analyzed in this research had a removal depth that ranged from two to four feet.
In some instances, the cables may not be removed because doing so would cause
significantly more environmental or agricultural damage (Welstead et al.. 2013).
Removal of overhead electrical lines: Electrical poles are removed and holes left from
where they were located are filled. In some cases, the poles are simply sawed and
made flush with surrounding area. Switches and other hardware are removed and
recycled.
Removal of site buildings: Modular buildings are disassembled. An excavator is used to
demolish buildings if the building is not modular. The building’s foundation is removed
and the ground is restored with suitable soils and vegetation (Welstead et al.. 2013).
Substation removal: In many cases, the substation is owned by the local electrical
distribution system. In the case that the substation needs to be removed, all pieces will

12
be evaluated for resale and scrap value and the foundations are restored similarly to the
tower and pad foundations.
Site restoration: The site’s ground is restored to match the immediate surrounding area.
This may involve adding topsoil and re seeding according to local conditions (Welstead
et al.. 2013).
Financial security
In the wind farm decommissioning plans evaluated for this research, the most common form of
financial security for a project was a “surety bond.” The surety bond value is based on the
estimated decommissioning costs and estimated turbine value. Other decommissioning plans
develop a fund that, over time, amounts to a set decommissioning value. URL links to each
decommissioning plan are available in the Appendix. Both of these options, however, create
circular logic, as discussed earlier. Without proper understanding of the decommissioning costs
and turbine value, it is difficult to properly place a value on the necessary surety bond or fund.
Estimated Decommissioning Costs and Turbine Value
Each of the plans evaluated assigned a numeric value to the cost of decommissioning and a
value to the turbine. Many of the plans, however, did not show how they arrived at these
values. The Miller Ranch Wind Energy Project, in Washington, has the most detailed value
analysis of the turbine itself, but did not explore the costs of dismantling the turbine. The
Bellmont and Orangeville project plans had detailed decommissioning costs but no information
on how they derived the scrap value of the turbine. Lastly, only one site, Orangeville, explored
the value of the turbine in the after-market, although it is unclear how they derived the value of

13
the turbine. The projects being developed in Maine had the most detailed cost analysis and
included quotations prepared by the engineering contracting company, “Sewall.” Sewall
prepared a cost and value estimate for each decommissioning task and logically outlined the
total project’s costs. The level of governmental monitoring and oversight of decommissioning
practices varies widely from jurisdiction to jurisdiction. For example, wind farm development in
Maine is regulated by the Maine Department of Environmental Protection (DEP). Maine DEP
requires a detailed decommissioning plan as a part of the “Site Location of Development”
permit application (ME DEP 2013). The permit application requires:
1.) Estimated costs for disassembly of project components
2.) Estimated removal costs, including removal, transportation, recycling and disposal costs
3.) Descriptions of any temporary construction measures, such as re-widening and re-
stabilization of access roads for crane access, required as part of the partial or full
decommissioning process
4.) Descriptions of any scrap, salvage or resale values included in the analysis, including
descriptions of how those values were determined
5.) Descriptions of project management and other ancillary costs associated with
decommissioning
Although the state of Maine requires a rigorous investigation of the potential decommissioning
costs, not all state departments regulate wind farm development. In many cases, development
permitting is left to county or municipalities. In Somerset County, Pennsylvania,
decommissioning plans are required a year after the project has been developed and are

14
governed by the county planning commission unless a township has a specific ordinance
(Lehman 2013). Evidently, the level of diligence for decommissioning planning varies widely
from location to location. Given the variance in the level of oversight and the lack of
information and understanding regarding the cost of decommissioning wind farms,
development of a consistent, accurate set of best practices will provide additional stability to
the development of the industry.

15
Chapter 4
Analysis of Available Decommissioning Plans
The uncertainty around the costs of decommissioning and the value of turbines has led to
incomplete and poorly planned decommissioning strategies which are evident in the plans
reviewed.
Understanding and planning for the decommissioning of wind turbines is a difficult task due to
the numerous project variables. No two wind farms are the same. Turbine size, turbine
manufacturer, wind project size, and location are all variables that will ultimately affect the
costs associated with decommissioning. This research aims to assess the costs associated with
crane work, deconstruction, and land reclamation for a specific set of site variables and
compare them to the value in salvage or resale of the wind turbine. This type of assessment
will allow developers to more accurately price the cost of their decommissioning plans.
As discussed in the literature review, publically available decommissioning plans were
reviewed, organized, and analyzed. Data available from the plans were compiled into a data-
base. Independent cost quotations from industry were obtained for comparison to the
available decommissioning plans. Salvage values of the turbines’ components were analyzed as
well as potential re-sale values and were also compared to the values presented in the available
decommissioning plans. Records and location of each of the decommissioning plans are found
in Table 9-3 of the Appendix.
16
Review of Available Decommissioning Plans
Only plans prepared by the same engineering contractor were prepared similarly. Some
contractors demonstrated costs of each decommissioning activity thoroughly (as separate line
items) in their quotation while others took a more broad approach and lumped together many
tasks. Each decommissioning plan that was reviewed and analyzed for this research was
unique. Although the tasks and methodologies were similar, the costs associated with
demolition and the values designated to the turbine varied extensively. Various data-bases
were generated to attempt to capture the assigned costs and values expressed in the plans.
Because each task was outlined differently, the most accurate approach was to categorize the
scope of work and examine the costs within those generalizations. Turbine Removal, Site
Restoration, Electrical Collection System Removal, Structural Removal, and Transportation of
Debris were the sub-categories designated to the entire decommissioning job. Each plan also
included an estimated salvage value of the turbine. Each category is presented and discussed
below.
Turbine Removal
Disassembly of the wind turbine involves man-power and high-capacity cranes. In all of the
plans analyzed, the deconstruction process was very similar to the erection process, but in the
reverse order. It was noted in many plans that the quotes provided were roughly equivalent to
labor and time involved with erecting a wind turbine. The scope of work would change slightly,
however, with the desired end use of the turbine. Deconstructing the turbine and reselling it as
a complete unit will differ from the work involved in decommissioning the unit and scrapping
the components. All but two of the decommissioning plans reviewed intended for the turbine

17
to be scrapped and recycled. The costs associated with prepping the tower for scrap were
examined; however most of the costs for dismantling the tower were also included with the
crane costs. All plans were surveyed and their crane costs and dismantling/prep for salvage
costs were noted if they were specified in a separate line item. Overall costs to dismantle the
turbine including crane costs were assessed. Only plans that indicated values for crane work
and salvage preparation were used. Those that had crane work and salvage preparation
included in the total evaluation, but lumped with another task, were discarded and only
evaluated in the total decommissioning portion of the research.
Prep
The crews’ first task is to prep the tower for disassembly. Prep involves installing rigging on the
nacelle and rotor, disconnecting wiring in the hub and nacelle, disconnecting hydraulic systems
and removing connective bolts from the tower and nacelle. The high voltage cables are cut and
the tower sections are prepared for removal. Once the tower is on the ground, manpower will
be required to prepare the materials for their final destination. The rotor hub, blades and
nacelle will be disassembled on the ground. Blades are cut into sizes shippable on tractor
trailers. Tower sections are cut into shippable pieces for transport to a landfill. Table 4-1
provides a summary of the data available regarding prepping and dismantling costs. From the
plans analyzed, nine estimates were provided for the man-hours required to prep and
disassemble the turbine as shown in the table. The average prep time per turbine was 250
hours. The average man-hours per MW of capacity was 97 hours.
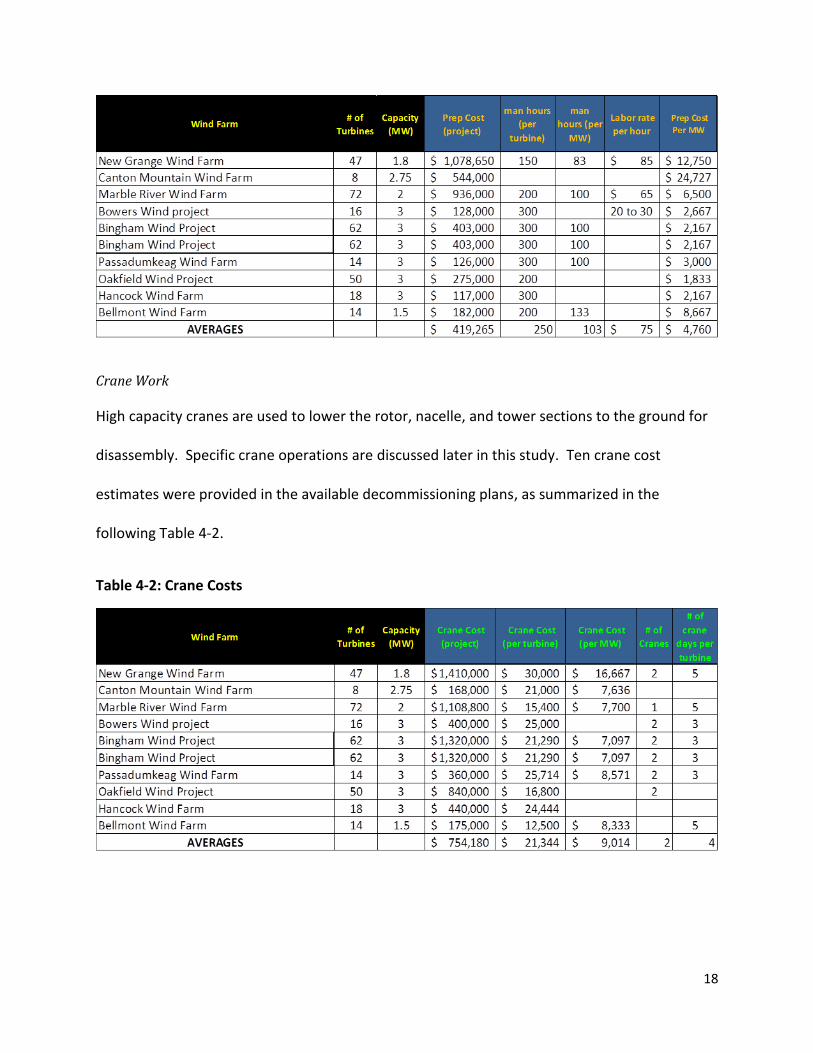
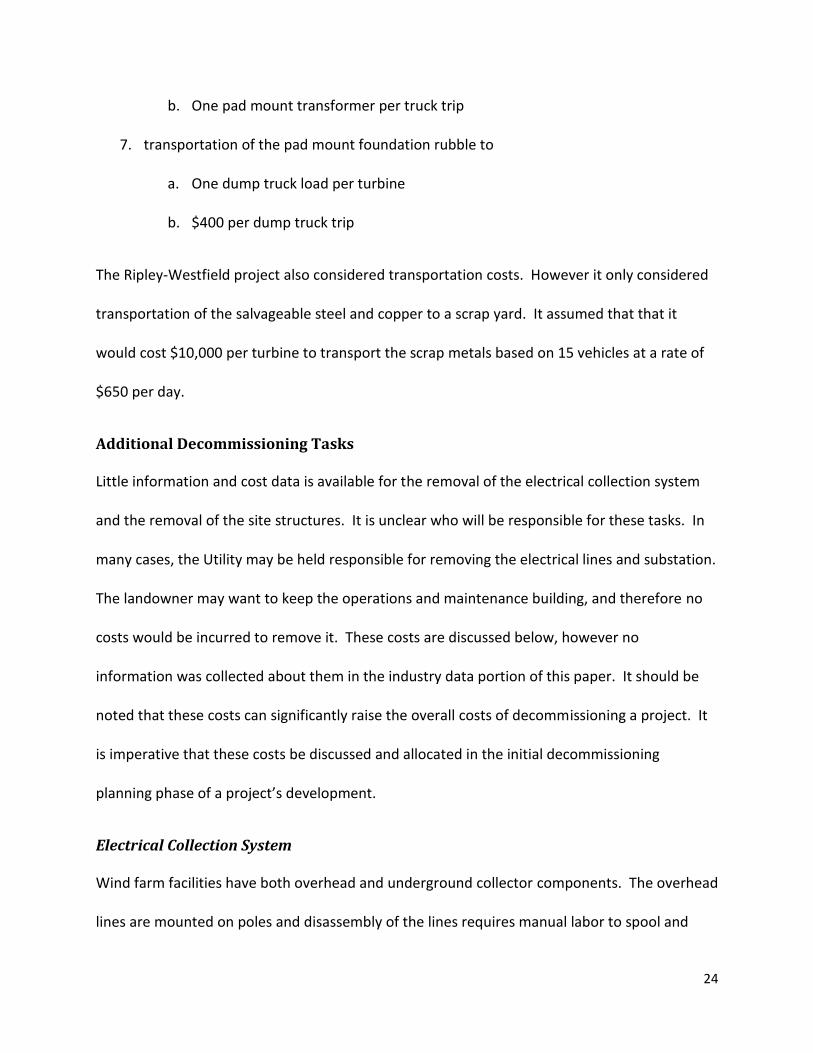
Table 4-1: Prep and Disassembly Costs
18
Crane Work
High capacity cranes are used to lower the rotor, nacelle, and tower sections to the ground for
disassembly. Specific crane operations are discussed later in this study. Ten crane cost
estimates were provided in the available decommissioning plans, as summarized in the
following Table 4-2.
Table 4-2: Crane Costs

19
Overall Turbine Removal Costs
Of the 21 plans reviewed, 17 provided an overall turbine removal quotation, summarized in
Table 4-3.
Table 4-3: Overall Turbine Removal Quotes
The frequency of the provided total turbine removal costs (per MW) are plotted in the
histogram in Figure 4-1. The average cost per MW to remove the turbine is $20,663
$ 70,000$ 60,000$ 50,000$ 40,000$ 30,000$ 20,000$ 10,000
7
6
5
4
3
2
1
0
Total Turbine Removal Per MW
Fre
qu
en
cy
Figure 4-1: Tower removal costs per MW
Wind Farm# of
Turbines
Capacity
(MW) Total (project)
Total Per
Turbine
Total Turbine
Removal Per
MW
Buffalo Ridge II 105 2 6,387,298$ 60,831$ 30,415.70$
Community Wind South 15 2 487,500$ 32,500$ 16,250$
New Grange Wind Farm 47 1.8 2,488,650$ 52,950$ 29,417$
Canton Mountain Wind Farm 8 2.75 712,000$ 89,000$ 32,364$
Marble River Wind Farm 72 3 2,044,800$ 28,400$ 9,467$
Bowers Wind project 16 3 528,000$ 33,000$ 11,000$
Ripley Wind Project 61 2 8,797,420$ 144,220$ 72,110$
Bingham Wind Project 62 3 1,723,000$ 27,790$ 9,263$
Bingham Wind Project 62 3 1,723,000$ 27,790$ 9,263$
Passadumkeag Wind Farm 14 3 486,000$ 34,714$ 11,571$
Oakfield Wind Project 50 3 1,115,000$ 22,300$ 7,433$
Hancock Wind Farm 18 3 557,000$ 30,944$ 10,315$
Stony Creek Wind Farm (PA) 35 1.5 1,148,700$ 32,820$ 21,880$
Forward Wind Farm 14 2.1 630,000$ 45,000$ 21,429$
Lookout 18 2.1 810,000$ 45,000$ 21,429$
Bellmont Wind Farm 14 1.5 357,000$ 25,500$ 17,000$
AVERAGES 1,874,711$ 45,798$ 20,663$

20
Site Restoration
As mentioned previously, each of the decommissioning plans was organized differently. To
more accurately understand the costs associated with the deconstruction portion of
decommissioning, the subcategory, ‘Site Restoration’ includes: foundation removal, site re-
grading, access road removal, crane pad restoration, and site re-vegetation.
Foundation Removal
There are many different scenarios outlined by the decommissioning plans that discuss the best
practice for removing the turbine’s foundation. Each plan has different requirements for the
depth of which the foundation needs to be removed and restored. The depths ranged between
24 and 48 inches below grade. It was thought that the variability in foundation removal cost
could be related to the depth to which the ground needed to be restored. The cost of removing
the foundation was plotted against the depth of ground restoration in the figure below.
Figure 4-2: Cost of foundation removal and depth of restoration

21
The data surprisingly showed no correlation between the depth to which the foundation was
restored and cost to remove the foundation and restore the foundation area. A possible reason
for why the data is not correlated is likely related to the complexity of turbine foundations. The
concrete is heavily reinforced with steel rebar and includes the large (usually 48 mm) steel
anchor bolts that connect the tower (Rohrs 2013). Removing a foundation that includes this
much steel will require more time and effort than removing regular concrete. It is likely that
some engineering firms providing a cost quote for this task understand the intricacy of the
turbine foundation, while others may not. This is a prime example of how the industry as a
whole lacks turbine decommissioning experience and the impact this has on consistency of
decommissioning pricing and development of best practice.
Re-grading
Site re-grading involves restoring the surfaces of the excavated areas to grade, slope, and
density of the immediate surrounding area. This process involves additional fill, topsoil, and
organic matter.
Road Work
In many situations, access roads will need to be widened to allow for crane access during
decommissioning. Also, local roads will sometimes need maintenance to accommodate the
high capacity crane mobilization. Only one of the contractors (Sewall) accounted for this.
The access road removal involves eliminating gravel and any drainage structures that were
integrated. It also involves deep tilling to remove compaction of the road and additional re-
grading to meet adjoining grades. Crane pads are similarly restored.

22
Re-Vegetation
The re-vegetation phase involves seeding the disturbed soil surfaces with a seed mix consistent
with the surrounding areas and agricultural use. As with the regrading, all areas are intended
to be restored to the condition and forage density of the immediate surrounding areas in an
effort to prevent soil erosion, control noxious weeds and pests, and establish an environment
comparable to the pre-construction setting. Figure 4-3 represents the frequency of site
restoration costs from the available decommissioning plans.
$ 25,000.00$ 20,000.00$ 15,000.00$ 10,000.00$ 5,000.00
4
3
2
1
0
Total site restorarion per MW
Fre
qu
en
cy
Figure 4-3: Total Site Restoration Costs
Transportation Costs
Transportation costs associated with moving the rubble produced from deconstruction and
salvage components offsite to a disposal or recycling facility were only estimated for plans
prepared by Sewall Engineering and the Ripley Westfield project. The Sewall estimates were

23
again the most thorough and examined potential costs of each of jobs below and outlined the
methods of how the job would be completed.
1. transportation of the rubble created by the wind turbine foundation removal
a. Assumes 60 cubic yards (based on 24 inch removal depth) of concrete demolition
rubble from foundation. Also assumes rebar is separated and therefore assumes
end use of concrete rubble to stay on-site and be used as fill
b. Assumes six dump trucks per turbine for transportation 2 hours away and a
combined equipment and labor rate of $100/hour
2. transportation of the turbine components to a disposal/reclamation site
a. Assumes 10 transport vehicles per turbine at a labor and equipment rate of
$1400/ transport trip.
3. disposal of non-scrapable items to a landfill
a. Assumes total estimated weight of blades and nacelle are 45 tons at a dispostal
rate of $71/ton.
4. transportation of met tower materials to scrap yard
a. estimated labor and equipment cost of $920/ trip, one trip per met tower
b. trucking for one met tower $1000
5. transportation of collector lines to scrap yard
a. Assumes eight spools per truck load
b. Labor and equipment cost of $1400/ truck trip
6. transportation of pad mount transformers to scrap yard
a. Assumes a $900 per truck trip labor and equipment cost
24
b. One pad mount transformer per truck trip
7. transportation of the pad mount foundation rubble to
a. One dump truck load per turbine
b. $400 per dump truck trip
The Ripley-Westfield project also considered transportation costs. However it only considered
transportation of the salvageable steel and copper to a scrap yard. It assumed that that it
would cost $10,000 per turbine to transport the scrap metals based on 15 vehicles at a rate of
$650 per day.
Additional Decommissioning Tasks
Little information and cost data is available for the removal of the electrical collection system
and the removal of the site structures. It is unclear who will be responsible for these tasks. In
many cases, the Utility may be held responsible for removing the electrical lines and substation.
The landowner may want to keep the operations and maintenance building, and therefore no
costs would be incurred to remove it. These costs are discussed below, however no
information was collected about them in the industry data portion of this paper. It should be
noted that these costs can significantly raise the overall costs of decommissioning a project. It
is imperative that these costs be discussed and allocated in the initial decommissioning
planning phase of a project’s development.
Electrical Collection System
Wind farm facilities have both overhead and underground collector components. The overhead
lines are mounted on poles and disassembly of the lines requires manual labor to spool and
25
collect the lines. Pole removal and filling of the pole’s hole is also required. In some cases, the
environmental analysis suggests that sawing the pole flush to the surrounding grade is less
detrimental than removing the pole completely. Cables buried underground that are within
the agreed upon depth of restoration are removed. Cables and conduit below that depth are
left in place and abandoned. The transformer, if located at the base of the turbine and not in
the nacelle, is removed and its foundation is restored similarly to the wind turbine’s foundation.
Only a small portion of the quotations examined for this analysis showed these costs as
separate line items, likely because these costs can be expected to be incurred by the utility
company and not necessarily by the owner of the project or the landowner. Because of this,
the research does not include the removal of electrical lines in the overall decommissioning
cost analysis.
Structural Removal
Removal of the Operations and Maintenance (O&M) building(s), substation, and meteorological
(met) tower all fall under the category “structural Removal.” Of the twenty-one
decommissioning plans reviewed, only three included quotes for substation removal and the
average cost was $76,500. Six of the plans reviewed had substation removal quotes and the
average was $157,425. Lastly, nine plans included cost estimates for met tower removal with
an average price of $7,305. It is not unlikely that the O&M building and the substation will
remain in place. These facilities are often not owned by the wind plant operator and therefore
are not considered in each decommissioning scope of work. A clear understanding of who
owns these two facilities needs to be established during the decommissioning planning phase
and should be calculated into total costs if necessary.

26
Overall Decommissioning Costs
Of the 21 decommissioning plans reviewed, 18 submitted an estimate of the total cost to
decommission that did not include the salvage value. Some plans only assigned a net total
value to the cost to decommission the wind farm that included the turbines salvage or resale
value. These values are represented in the table below.
Table 4-4: Total Decommissioning Costs
Plan
Year
Project
Term
(years)
# of
Turbines
Turbine
Capacity
(MW)
Estimated
Decommissioning
Costs (per turbine)
Projected Salvage
Value (per turbine)
Projected Salvage
Value (Per MW)
Projected Re-
Sale value (per
turbine)
Net cost to
decommission (per
turbine)
Estimated
Decommissioning
costs per MW
1 Buffalo Ridge II 2008 30 105 2 90,805$ 79,355$ 39,677.50$ 11,450$ 45,403$
2 Community Wind South 20 15 2 46,600$ 43,567$ 21,783.50$ 3,033$ 23,300$
3 Kingdom Community Wind 2010 25 21 3 290,476$ -$ 290,476$ 96,825$
4 Black Oak Wind Farm 20 7 1.8 50,000$ 45,000$ 25,000.00$ 5,000$ 27,778$
5 New Grange Wind Farm 20 47 1.8 88,955$ 35,000$ 19,444.44$ 53,955$ 49,419$
6 Marble River Wind Farm 20 72 3 54,900$ 45,000$ 15,000.00$ 9,900$ 18,300$
7 Orangeville (Stoney Creek) Wind Farm 10 59 567,224$ 44,474$
8 Bowers Wind project 2012 20 16 3 140,783$ 102,281$ 34,093.67$ 38,502$ 46,928$
9 Ripley Wind Project 2009 61 2 165,280$ 100,600$ 50,300.00$ 64,680$ 82,640$
10 Bingham Wind Project 2013 62 3 123,974$ 96,194$ 32,064.67$ 27,780$ 41,325$
11 Bingham Wind Project 2013 62 3 122,968$ 97,074$ 32,358.00$ 25,894$ 40,989$
12 Passadumkeag Wind Farm 2012 20 14 3 112,500$ 76,457$ 25,485.67$ 36,043$ 37,500$
13 Canton Mountain Wind Farm 2011 20 8 2.75 128,000$ 78,824$ 28,663.27$ 49,176$ 46,545$
14 Hancock Wind Farm 2012 18 3 124,922$ 96,778$ 32,259.33$ 28,144$ 41,641$
15 Miller Ranch Wind Energy Project 2007 30 75 106,785$ 154,836$ (154,836)$
16 Casselman Wind Power 2011 23 1.5 -$ 5,460$
17 Stony Creek Wind Farm (PA) 2012 28 1.5 90,305$ 150,887$ 100,591.33$ (60,582)$ 60,203$
18 Forward Wind Farm 2012 14 2.1 76,953$ 172,980$ 82,371.43$ (96,027)$ 36,644$
19 Lookout 2012 18 2.1 76,952$ 172,980$ 82,371.43$ (96,028)$ 36,644$
20 Oakfield Wind Project 2013 20 50 3 124,600$ 91,180$ 30,393.33$ 33,420$ 41,533$
21 Bellmont Wind Farm 20 14 1.5 56,600$ 43,000$ 28,666.67$ 13,600$ 37,733$
AVERAGES 21 38 2 109,199$ 90,775$ 35,817$ 361,030$ 15,882$ 45,075$
Wind Farm

27
Figure 4-4: Decommissioning Costs $/MW
The outlier, Kingdom Wind Farm, has the highest forecasted turbine decommissioning cost.
The Kingdom Wind farm has costs associated with removal of the substation and O&M
buildings which is conceivably why it is the most expensive.
The net decommissioning costs reflect the projected cost minus the expected salvage value of
the turbine.
Figure 4-5: Net Decommissioning Costs
Again, the Kingdom project is an outlier. The Kingdom Wind decommissioning plan did not
include any salvage value in its total estimates to decommission the project and therefore is
much more expensive than any of the other projects. The four wind farms who demonstrate
that decommissioning the turbines will generate a profit were all prepared by Somerset
Engineering and Planning. They have estimated the salvage value of the turbine to be between
$150,000 and $172,000, nearly $50,000 more than any of the other plans. Their estimates of
the construction costs to decommission are similar to the other plans submitted.

28
Estimated Salvage Values
The estimated salvage values provided in each of the plans varied widely as shown in Figure 4-
6. As mentioned previously, Somerset Planning and Engineering offered the highest value for
the turbines scrap components. The salvage value assigned to the turbine by the Sewall
Engineering company is similar to the other independent quotations.
Figure 4-6: Estimated salvage values from individual decommissioning plan

29
Chapter 5
Industry Data Collection
The current study aimed to collect as much data from the crane and demolition industry as
possible to compare to the data provided from the decommissioning plans. The compiled
information was then be used to determine typical decommissioning costs as applied to two
different project scenarios. The first scenario is to examine the decommissioning costs of
deconstructing the turbine and scrapping its components for the value of the elemental
composition. The other will examine the decommissioning costs of removing the turbine and
reselling it in an aftermarket. Both scenarios use specific turbine size assumptions, which were
obtained and adapted from the National Renewable Energy Laboratory Turbine Design Scaling
Studies document and outlined in Table 9-2 in the Appendix.
Crane companies were contacted and asked to complete a cost survey (represented in Table 9-
1 of the Appendix) that outlined the tasks to be completed or asked to verify cost information
their company had previously provided to another client. The rates provided were entered into
a database. Each company structures their costs differently and the variations were noted in
the analysis portion of the research. Four crane companies provided information for the cranes
they had available that were suitable to complete the removal of the 750 kW turbine and 1.5
MW turbine.
One demolition company provided cost information for deconstructing the turbine once it has
been lowered to the ground. The demolition company’s quote included transportation costs,
landfill dumping costs, and a salvage value of the turbine. The following sections describe the

30
context in which data was collected from industry sources and the ensuing analysis of these
data, when available, as compared to the obtainable decommissioning plan data.
Crane Costs
Given the specific hub heights and component masses, a general crane size to perform the pick
safely was chosen for each size turbine. A 300 Ton crawler crane was chosen to perform the
required crane work on the 750 kW turbine and a 350 or 400 Ton crawler crane was chosen to
perform work on the 1.5 MW machine, depending on what the crane company had available
(Rohrs 2013). A 100 Ton Crane is used to trip the rotor and lay it flat on the ground. The time a
crane spends on a particular site will govern the crane costs. The crane costs associated with
decommissioning a site have been prepared under the assumption that one crane is
deconstructing 50 turbines without being fully disassembled during tower to tower
mobilization. It should be noted that terrain and road conditions can often affect the
mobilization methods of the high capacity cranes, which can incur additional costs.
The lifting plan would involve the rotor coming down first, utilizing the smaller 90 - 110 Ton
crane to trip and guide it down. The whole nacelle would follow. The tower sections would be
the final picks. It was estimated that the crane work time for the 750 kW turbine would be 25
hours per turbine and that the 1.5 MW machine would be 30 hours (Rohrs 2013). The crane
work time associated with each different size turbine was a conservative number from an
experienced wind turbine construction project manager based on typical times to erect a wind
turbine.

31
These hours are considered “straight time” and do not include standby and overtime crane
costs. It is important to consider that high capacity cranes cannot operate in certain windy
conditions. Their non-operational shut down values are usually in the range of 8 - 12 m/s
depending on their type (Rohrs 2013). Wind farms, on the other hand, are built in locations
where average winds speeds need to be within this range. Both hydraulic and lattice boom
cranes are generally utilized in the wind industry. Hydraulic cranes have a solid boom and can
be extended upwards of 200 feet (Rohrs 2013). The length and weight of the solid boom make
it more sensitive to windy conditions. Lattice crawler cranes can operate in windier conditions.
The lattice structure creates less resistance to the wind and therefore less of an effect of the
forces onto the crane. Lattice crawlers shut down speed is typically anywhere between 8m/s
and 12 m/s depending on the crane manufacturer, working height, and wind direction. This
study obtained cost quotations for lattice crawler cranes only.
Wind farm developers spend a significant amount of time and money to ensure the site they
build will have wind speeds and conditions necessary for a profitable project. Wind farms
installed in the 1990’s and 2000’s focused on and utilized some of the country’s best wind
resources available. Sites that had a wind resource of class four or higher were deemed
suitable for utility scale generation. The map below indicates the wind resource classes in
different U.S. locations.

32
Figure 5-1: Wind resource in the U.S., NREL
Looking at the wind farm development of the United States in the past twenty years, it can be
noted that the earlier sites utilized some of the best wind resources. They were located in
areas of the country that showed class 4, 5, and 6 wind potential.
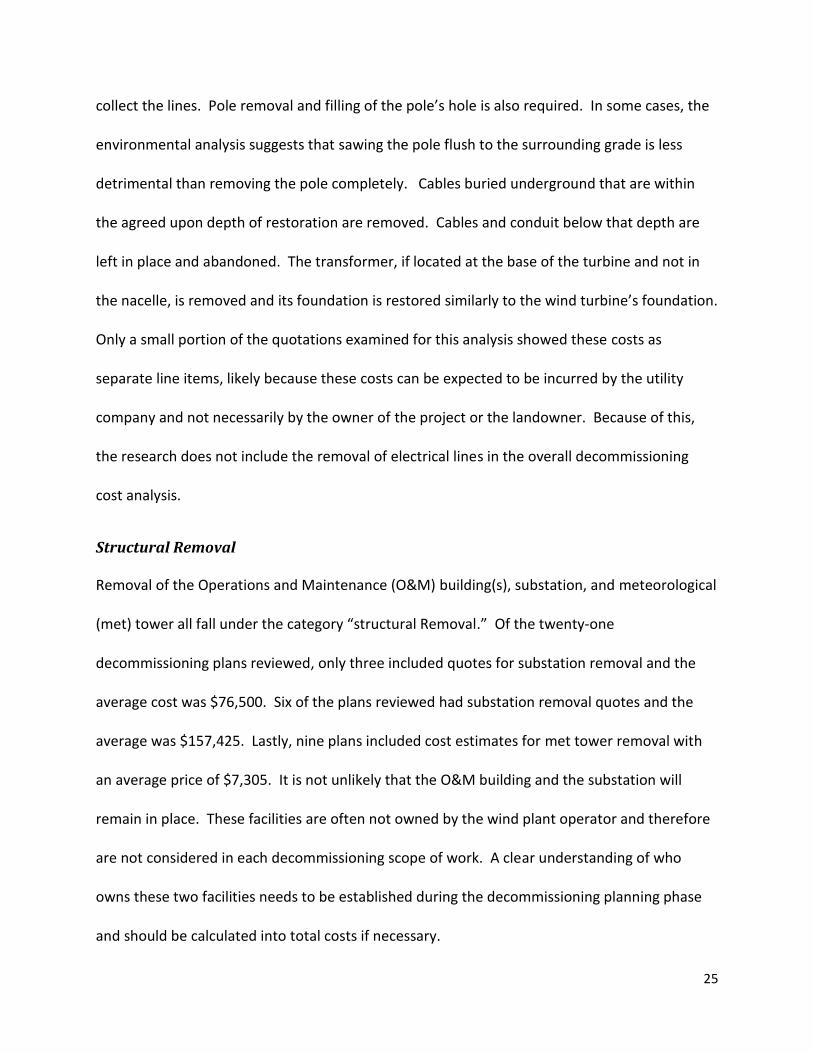
33
Figure 5-2: Wind Power Capacity in 2000
Wind farm devlopers do not rely on the average wind speeds alone to predict a farm’s power
output. Wind speeds can vary significantly on both a daily and seasonal basis. Data for a
potential site is collected over one to three years and critically analyzed. The Weibull
distribution or the Rayleigh distribution models are often used to characterize and predict the
power density of a paticular site. The Weibull wind speed distrubution is a mathematical
idealization of the distribution of wind speeds over time. This distribution is determined by two
parameters: λ, the scale factor that represents wind speed, and k, the shape factor that
describes the form of the distribution (Gipe 2004).
Weibull Distribution:
( )
(
)
(
) Equation 5-1

34
The Rayleigh Distribution is a Weibull Distribution where the shape factor value is 2. It
considers the width of the wind speed bin (dV) and the average wind speed (Vavg).
Rayleigh Distribution:
( ) (
) (
)
(
)
Equation 5-2
Applying the wind power density values of class 3, 4, 5, and 6 locations, the Weibull and
Rayleigh Distribution models are used to find the frequency when wind speeds will be above
the crane’s safe working wind speed conditions.
Table 5-1: Wind speed frequency
The frequency when wind speeds were above the crane tolerance was applied to the expected
crane operational hours to better estimate total costs. Standby crane rates can be expensive.
From the data collected, most companies reported that their standby rates are similar to their
operational rates. Applying the frequency a crane would be on standby to the total time
allotted for the job provides a more accurate estimate of crane costs.
CLASS
Power
Density
(W/m2)
Wind
Speed
(m/s)
Shape
Factor
Scale
Factor
Frequency
Wind is
Above 8 m/s
Frequency
Wind is
Above 12 m/s
300 6.4 2 7.23 29% 6%
400 7 2 7.9 36% 10%
400 7 2 7.9 36% 10%
500 7.5 2 8.45 41% 13%
500 7.5 2 8.45 41% 13%
600 8 2 9.1 46% 18%
600 8 2 9.1 46% 18%
800 8.8 2 9.93 52% 23%
Class 3
Class 4
Class 5
Class 6

35
Crane Cost Data Collected
Table 9-1 in the Appendix shows the quotation spreadsheet that was distributed to different
crane operation and rental companies. Companies anonymously provided or verified costs for
each of the required equipment and staff.
Each crane company’s rental rates are structured differently. Some companies charge a daily or
monthly operating cost while others includes those costs in the hourly rates and mobilization.
Standby rates for each company differ as well. For one company, if the cranes are held onsite
but the crew is released, they are charged a specific “idle time” fee. If idle time exceeds two
days per mobilization, they charge regular time rates for eight hours a day. Another company
charges a four hour minimum of the crane’s regular time cost plus four hour minimum for the
crew if the crane is held on standby. One company just charges regular time for standby time.
Analysis of Crane Costs
The average values for mobilization in and out of site, tower to tower mobilization, hourly
regular time, hourly crew rates, and per diem were calculated for each of the cranes. The 750
kW project assumes it will take 25 hours of crane work per turbine with a crew of two (an
operator and an oiler). It assumes a total of 125 days of per diem for each crewmember. For a
50 turbine site, this equates to 1250 hours of crane and crew work in which two turbines are
decommissioned per week. This estimate was provided by a wind turbine construction project
manager (Rohrs 2013). The total in the tables below reflect the estimated crane costs without
standby time for the 750 kW scenario.
Table 5-2: Regular time crane costs for 750 kW turbine

36
The total estimated crane costs for the 750 kW turbines on a hypothetical 50 turbine site, is
$1,846,428. This estimate does not include standby rates. This equates to roughly
$37,000/turbine.
The 1.5 MW scenario assumes the use of a 350 Ton crawler crane and a 90-110T assist crane. It
is assumed that each tower will take 30 hours and each crane has a crew of an operator and an
oiler. A hypothetical 50 turbine site would take 1500 hours, or 150 days of per diem for the
two crew members.
Table 5-3: Regular time crane costs for 1.5 MW turbine
The total estimated crane cost for the 1.5 MW 50 turbine wind farm scenario is $2,942,544 and
does not include standby costs. This equates to roughly $59,000/turbine.
300T (Fixed) Per Unit 50 Turbines
Mob In 11,824$ 11,824$
Tower to Tower 7,777$ 373,296$
Mob Out 11,824$ 11,824$
Regular Time 501$ 626,250$
Crew 79$ 197,500$
Per Diem 126$ 31,500$
TOTAL: 1,252,194$
300T (variable)
300 Ton Crane
100T (Fixed) Per Unit 50 Turbines
Mob In 4,586$ 4,586$
Tower to Tower 1,694$ 81,312$
Mob Out 4,586$ 4,586$
Regular Time 238$ 297,500$
Crew 69$ 172,500$
Per Diem 135$ 33,750$
TOTAL: 594,234$
100T (variable)
90-110 Ton Crane (750 kW Analysis)
350T (Fixed) Per Unit 50 Turbines
Mob In 30,370$ 30,370$
Tower to Tower 22,165$ 1,063,920$
Mob Out 30,370$ 30,370$
Regular Time 532$ 798,000$
Crew 92$ 276,000$
Per Diem 163$ 48,900$
TOTAL: 2,247,560$
350T (variable)
350 Ton Crane
100T (Fixed) Per Unit 50 Turbines
Mob In 4,586$ 4,586$
Tower to Tower 1,694$ 81,312$
Mob Out 4,586$ 4,586$
Regular Time 238$ 357,000$
Crew 69$ 207,000$
Per Diem 135$ 40,500$
TOTAL: 694,984$
90-110 Ton Crane (1.5 MW Analysis)
100T (variable)

37
To calculate the standby costs, the frequency at which the wind speed on site would be above
the crane’s working tolerance was applied to the estimated project time. The total estimated
project time for the 750 kW turbine site is 1250 hours. The total estimated project time for the
1.5 MW site is 1500 hours. An average of the standby rates provided for both the 300T and
350T crane was calculated and the frequency the cranes would likely be held on standby was
applied to the total project time. Table 5-4 below shows how the standby rate could affect the
total cost of the decommissioning project.
Table 5-4: Standby rates for 100T and 300T cranes with 8 m/s crane operational limit
CLASS
Power
Density
(W/m2)
Frequency
Wind is
above 8
m/s
Stby
Hours
(per
turbine)
Standby
Rate
values
($/hr)
Total Standby
Cost per
turbine
Total Standby
Cost per 50
turbine wind
park
300 29% 7.25 270 1,958$ 48,938$
400 36% 9 270 2,430$ 60,750$
400 36% 9 270 2,430$ 60,750$
500 41% 10.25 270 2,768$ 69,188$
500 41% 10.25 270 2,768$ 69,188$
600 46% 11.5 270 3,105$ 77,625$
600 46% 11.5 270 3,105$ 77,625$
800 52% 13 270 3,510$ 87,750$ Class 6
Standby Rates for the 300T Crane (8 m/s)
Class 3
Class 4
Class 5
38
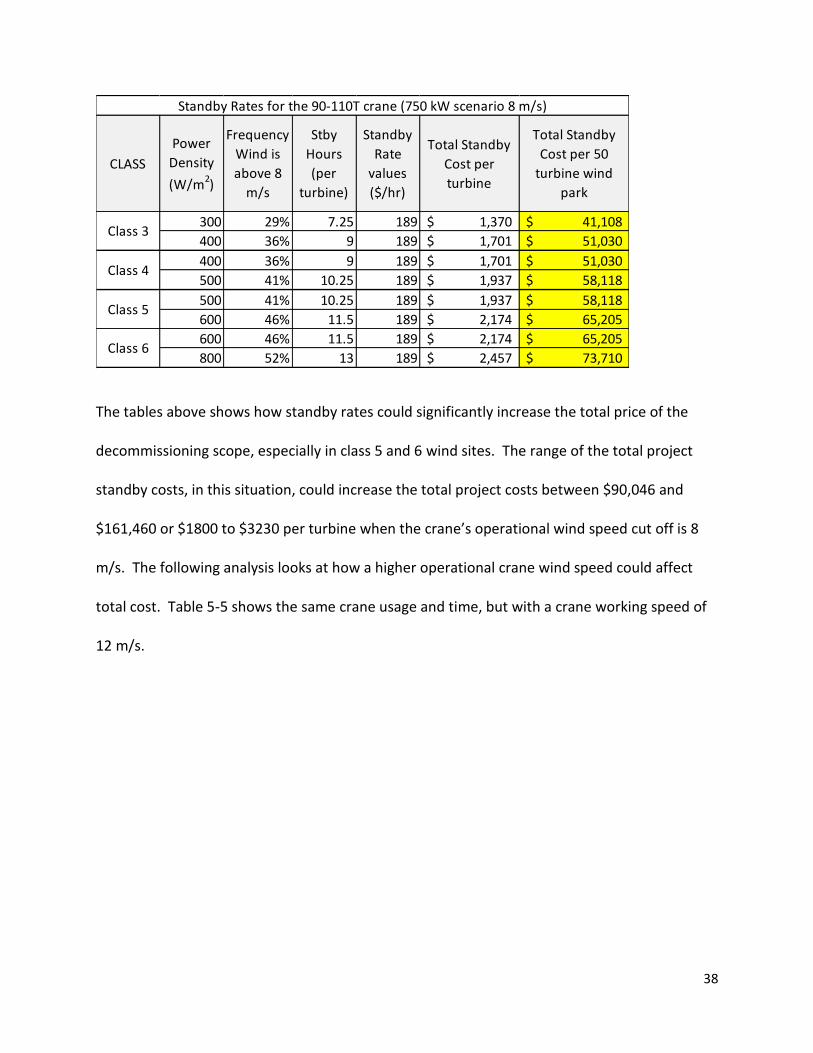
The tables above shows how standby rates could significantly increase the total price of the
decommissioning scope, especially in class 5 and 6 wind sites. The range of the total project
standby costs, in this situation, could increase the total project costs between $90,046 and
$161,460 or $1800 to $3230 per turbine when the crane’s operational wind speed cut off is 8
m/s. The following analysis looks at how a higher operational crane wind speed could affect
total cost. Table 5-5 shows the same crane usage and time, but with a crane working speed of
12 m/s.
CLASS
Power
Density
(W/m2)
Frequency
Wind is
above 8
m/s
Stby
Hours
(per
turbine)
Standby
Rate
values
($/hr)
Total Standby
Cost per
turbine
Total Standby
Cost per 50
turbine wind
park
300 29% 7.25 189 1,370$ 41,108$
400 36% 9 189 1,701$ 51,030$
400 36% 9 189 1,701$ 51,030$
500 41% 10.25 189 1,937$ 58,118$
500 41% 10.25 189 1,937$ 58,118$
600 46% 11.5 189 2,174$ 65,205$
600 46% 11.5 189 2,174$ 65,205$
800 52% 13 189 2,457$ 73,710$ Class 6
Standby Rates for the 90-110T crane (750 kW scenario 8 m/s)
Class 3
Class 4
Class 5

39
Table 5-5: Standby rates for 100T and 300T cranes with 12 m/s crane operational limit
This situation has less of an effect on total project cost, however is still important to consider.
The additional standby rates range between $18,630 and $71,416 for the total project; this
equates to $372 to $1428 potential additional standby costs per 750 kW turbine.
The same analysis was performed for the 1.5 MW scenario and represented in table 5-6 below.
Table 5-6: Standby Rates for the 100T and 350T Cranes with 8 m/s crane operational limit
CLASS
Power
Density
(W/m2)
Frequency
Wind is
above 12
m/s
Stby
Hours
(per
turbine)
Standby
Rate
values
($/hr)
Total
Standby
Cost per
turbine
Total
Standby
Cost per 50
turbine
wind park
300 6% 1.5 270 405$ 10,125$
400 10% 2.5 270 675$ 16,875$
400 10% 2.5 270 675$ 16,875$
500 13% 3.25 270 878$ 21,938$
500 13% 3.25 270 878$ 21,938$
600 18% 4.5 270 1,215$ 30,375$
600 18% 4.5 270 1,215$ 30,375$
800 23% 5.75 270 1,553$ 38,813$
Standby Rates for the 300T Crane (12 m/s)
Class 3
Class 4
Class 5
Class 6
CLASS
Power
Density
(W/m2)
Frequency
Wind is
above 12
m/s
Stby
Hours
(per
turbine)
Standby
Rate
values
($/hr)
Total
Standby
Cost per
turbine
Total
Standby
Cost per 50
turbine
wind park
300 6% 1.5 189 284$ 8,505$
400 10% 2.5 189 473$ 14,175$
400 10% 2.5 189 473$ 14,175$
500 13% 3.25 189 614$ 18,428$
500 13% 3.25 189 614$ 18,428$
600 18% 4.5 189 851$ 25,515$
600 18% 4.5 189 851$ 25,515$
800 23% 5.75 189 1,087$ 32,603$
Standby Rates for the 90-110T crane (750 kW scenario, 12 m/s)
Class 3
Class 4
Class 5
Class 6

40
The 8 m/s crane cut off speed applied to the 1.5 MW wind farm scenario shows that additional
standby rates can range between $175,914 and $315,432 in total projects which equates to
$3,518 and $6,309 per turbine.
The following Table 5-7 shows the same analysis, but with a crane working speed of up to 12
m/s.
CLASS
Power
Density
(W/m2)
Frequency
Wind is
above 8
m/s
Stby
Hours
(per
turbine)
Standby
Rate
values
($/hr)
Total Standby
Cost per
turbine
Total Standby
Cost per 50
turbine wind
park
300 29% 8.7 485 4,220$ 126,585$
400 36% 10.8 485 5,238$ 157,140$
400 36% 10.8 485 5,238$ 157,140$
500 41% 12.3 485 5,966$ 178,965$
500 41% 12.3 485 5,966$ 178,965$
600 46% 13.8 485 6,693$ 200,790$
600 46% 13.8 485 6,693$ 200,790$
800 52% 15.6 485 7,566$ 226,980$
Standby Rates for the 350T Crane (8 m/s)
Class 6
Class 3
Class 4
Class 5
CLASS
Power
Density
(W/m2)
Frequency
Wind is
above 8
m/s
Stby
Hours
(per
turbine)
Standby
Rate
values
($/hr)
Total Standby
Cost per
turbine
Total Standby
Cost per 50
turbine wind
park
300 29% 8.7 189 1,644$ 49,329$
400 36% 10.8 189 2,041$ 61,236$
400 36% 10.8 189 2,041$ 61,236$
500 41% 12.3 189 2,325$ 69,741$
500 41% 12.3 189 2,325$ 69,741$
600 46% 13.8 189 2,608$ 78,246$
600 46% 13.8 189 2,608$ 78,246$
800 52% 15.6 189 2,948$ 88,452$ Class 6
Standby Rates for the 90-110T crane (1.5 MW scenario, 8 m/s)
Class 3
Class 4
Class 5

41
Table 5-7: Standby Rates for the 100T and 350T Cranes with 12 m/s crane operational limit
Again, the higher crane operational wind speed has less of an effect on total costs. In this
situation, project standby rates range between $36,396 and $139,518; or $728 to $2790 per
turbine.
Additional standby costs are considerable and commonly overlooked. For the 750 kW turbine
scenario, standby costs could add an additional $300 to $3,000 per turbine to the overall
CLASS
Power
Density
(W/m2)
Frequency
Wind is
above 12
m/s
Stby
Hours
(per
turbine)
Standby
Rate
values
($/hr)
Total
Standby
Cost per
turbine
Total
Standby
Cost per 50
turbine
wind park
300 6% 1.8 485 873$ 26,190$
400 10% 3 485 1,455$ 43,650$
400 10% 3 485 1,455$ 43,650$
500 13% 3.9 485 1,892$ 56,745$
500 13% 3.9 485 1,892$ 56,745$
600 18% 5.4 485 2,619$ 78,570$
600 18% 5.4 485 2,619$ 78,570$
800 23% 6.9 485 3,347$ 100,395$
Class 4
Class 5
Class 6
Standby rates for the 350T Crane (12 m/s)
Class 3
CLASS
Power
Density
(W/m2)
Frequency
Wind is
above 12
m/s
Stby
Hours
(per
turbine)
Standby
Rate
values
($/hr)
Total
Standby
Cost per
turbine
Total
Standby
Cost per 50
turbine
wind park
300 6% 1.8 189 340$ 10,206$
400 10% 3 189 567$ 17,010$
400 10% 3 189 567$ 17,010$
500 13% 3.9 189 737$ 22,113$
500 13% 3.9 189 737$ 22,113$
600 18% 5.4 189 1,021$ 30,618$
600 18% 5.4 189 1,021$ 30,618$
800 23% 6.9 189 1,304$ 39,123$
Class 3
Class 4
Class 5
Class 6
Standby Rates for the 90-110T crane (1.5 MW scenario, 12 m/s)
42
project costs and for the 1.5 MW turbine, it could potentially add an additional $700 to $6300
per turbine of unexpected total project costs.
Industry crane costs compared to decommissioning plan crane costs
750 kW Turbine
From the cost data collected from the industry, the average crane costs of deconstructing a
three section wind turbine is $37,000 which represents crane and crew time regular time,
mobilization, tower to tower mobilization, and crew per diem. An additional $300 to $3000 of
standby costs could also be incurred. The data from the decommissioning plans provided an
estimate of $6,500 (calculated on a per MW basis from the data in table 3-2) for the crane costs
to remove the 65 meter, 750 kW turbine. That is roughly a $33,500 difference between the
plans and industry data.
1.5 MW Turbine
The data collected from the crane industry reflects a cost of approximately $59,000 per turbine
with an additional $700 to $6300 for standby time. The average cost from the
decommissioning plans suggests the crane costs would only be $13,000 (calculated on a per
MW basis from the data in table 3-2) per 86 meter, 1.5 MW wind turbine. The difference
between the industry data and the decommissioning plans is roughly $52,000.
There is a gross misunderstanding of the crane industry, represented by the underestimated
crane costs in the decommissioning plans. There are two likely reasons for the discontinuity.
First, as plans for the decommissioning of wind turbines starts to become a requirement for
developers to prepare and produce funds of equivalent value prior to the erection of the
43
turbines, it is in their best interest to demonstrate the absolute lowest costs to decommission
the towers. This issue leads to reason number two as to why the costs are so different- unless
you work in the crane industry, you likely have no idea how expensive they are to operate.
Even engineers who prepare the decommissioning quotes do not necessarily have any field
experience with cranes or understand how expensive each project can become. Members of
city planning boards and local authorities responsible for handling decommissioning surety
bonds are even less likely to have an understanding of the crane industry.
Demolition and Transportation Costs
Demolition companies handle the removal, transport, and recycling aspects of a wide variety of
demolition jobs. The scope of work for demolition and transport of the wind turbine requires
preparing the tower for salvage, removing the turbine’s foundation and re-grading the affected
areas, and transporting the salvageable materials to the scrap yard and the disposable
materials to a landfill. The tower sections are the largest salvageable pieces of the turbine and
need to be cut into acceptable sizes for the scrap yard. The size of the tower sections were
obtained from Table 1 of the LWST Phase 1 Project Conceptual Design Study: Evaluation of
Design and Construction Approaches for Economical Hybrid Steel/concrete Wind Turbine
Towers (LaNier 2005) and outlined in Table 5-8 below.

44
Table 5-8: Turbine Tower Assumptions
The large tubular steel tower sections need to be cut into smaller pieces to be transported and
accepted by the mill. The information from the LaNier document was submitted to a
demolition company to prepare a quote for the work.
The blades also need to be prepared for the landfill and transportation. The demolition
contractor will cut the blades into smaller pieces and haul the materials to a landfill. For the
750 kW turbine, each blade is assumed to be 23 meters long with a total surface area of 66 m2
and a total (blade and root) mass of 1688 kg (NREL 2012b). For the 1.5 MW machine, each
blade is assumed to be 34 meters long with a total surface area of 133 m2 and total mass of
4535 kg (NREL 2012b). These values were given to a demolition contractor and they provided a
cost estimate for cutting, transporting, and disposing of the blade materials.
The nacelle houses the electronic and drive train components. These components also need to
be prepared for scrap and hauled to the scrap yard or to the landfill. It is assumed in this
units 750 kW 1.5 MW
Length m 21.7 21.5
Base Diameter m 3.7 4.9
Diameter 2 m 3.1 4.3
Mass kg 28,642 51,574
Length m 21.7 21.5
Diameter 1 m 3.1 4.3
Diameter 2 m 2.5 3.7
Mass kg 19,199 38,757
Length m 21.7 21.5
Diameter 1 m 2.5 3.7
Diameter 2 m 1.9 3.1
Mass kg 11,646 27,771
Length m 21.5
Diameter 1 m 3.1
Diameter 2 m 2.5
Mass kg 18,615
Section 4
Section 3
Section 2
Section 1 (base)
Turbine Tower Assumptions

45
research that the components will be shipped as is. A quotation for shipping the nacelle,
gearbox, main shaft, generator, yaw gear, and electronics was obtained from the demolition
company.
Lastly, the demolition company will remove the foundation and restore the ground to 36”
below the ground. The foundation is composed of heavy reinforced concrete with integrated
tower bolts. The bolts can range in length from 8 - 15 feet and are used to anchor the tower to
the foundation. The thickness of the bolts can vary but a typical size is 48 mm (Rohrs 2013).
The rebar and bolts will require extra time and effort to remove the concrete structure. This
information was also provided to the demolition company.
The Pennsylvania based demolition company (Tamco Construction) estimated the cost of
demolition, transportation, and disposal to be $16,200 per turbine. This value represents the
cost for both the 750 kW and 1.5 MW machine and includes the scrap value of the salvageable
components. A quote was requested for just the demolition work, excluding the salvage value,
however, Tamco would not perform the work if they were not guaranteed salvage rights to the
components. Tamco did, however, provide the rate that they currently pay for steel, cast iron,
aluminum, and copper. A discussion of these values is provided below.
Salvage Values
To comprehend the salvage value of the turbine, it is necessary to understand the structure of
the turbine’s individual components. The breakdown of these components is representative of
a 750 kW and 1.5 MW onshore wind turbine using technology that includes a three-blade rotor
46
setup, steel tower sections, a three stage gearbox, and a wound rotor type generator (Wilburn
2013).
Nacelle
The Nacelle houses the wind turbine’s drivetrain and analytical components. The drivetrain
components are comprised of the bearings, couplings, gears, generator, and shafts. The
analytical components consist of the turbines converter, power electronics, and sensors. The
turbine’s main shaft is connected to a gearbox, where it converts the low-speed/high torque
power from the rotor to high-speed/low torque power and feeds it into the generator. The
gearbox is comprised mostly of cast iron and stainless steel, with trace amounts of copper and
aluminum (Wilburn 2013). The highspeed shaft connects the gearbox to the generator. The
generator is comprised of steel, copper, and silica. The nacelle sits on an iron bedframe and is
housed by a fiberglass cover (Welstead et al. 2013).
Rotor
The rotor consists of the hub, blades, and nose cone. Although there are different models of
wind turbines, this paper focuses on the three bladed models. Each blade is made of fiberglass
reinforced with resin. The hub holds and connects the three blades. It’s made of cast iron. The
nose cone is made similarly as the blades and consists of fiber glass and resin reinforcement
(Welstead et al. 2013)
Tower Sections
The nacelle and rotor rest on stacked and bolted tower sections. The individual tower sections
are made of steel. The most commonly used tower configuration uses a concrete base with

47
stacked steel tower sections. The wind turbine’s tower components account for anywhere from
35% to 65% of the machine’s total weight (Wilburn 2013). This research examined three and
four section turbines at 65 and 86 meter hub heights.
Foundation
The foundation of a wind turbine is typically concrete reinforced with steel rebar (Welstead et
al.). Although technology is changing and moving to a different foundation structure, the
earlier models would likely reflect the typical concrete structure reinforced with steel rebar.
Estimated Salvage Values
A life cycle assessment (LCA) of a Vestas V82 (1.65MW) turbine was published in 2006 (Vestas
2006). The assessment provides a breakdown of materials used in the turbine and the quantity
of each element analyzed below was adapted from the LCA and reflected in Table 5-9 (Vestas
2006). Using the materials and masses provided from Vestas, a similar cost analysis was
completed using the American Metal Exchange prices. The LCA is based on a 1.65 MW turbine
and the data was scaled per MW and applied to the 750 kW and 1.5 MW research scenarios.
The LCA also projected 90% recovery for recycling of the steel, cast iron, copper, and aluminum
commodities (Wilburn 2013). This percentage was applied to the total mass in the calculations.
The 27 tons of steel found in the foundation was not included in the “Total Turbine Steel”
calculation because separating steel rebar from concrete foundation is an extremely time
consuming and difficult procedure. The wind farm’s substation mass and composition was
excluded in the total turbine salvage analysis. Internal and External Cabling was also excluded
from the salvage analysis. The salvage values were obtained from the American Metal Market

48
report effective Wednesday, October 16th 2013 and reflect the estimated dealer buying prices
in Pittsburgh.
Table 5-9, Calculated Salvage Values
Steel and copper are commodities that are subject to a volatile spot market. Between 2008 and
2013, copper had a high spot market price of approximately $4.60/ lb and a low of $1.25/lb
(CME 2013). Steel also varied over the past five years with a high of $400/gross ton and low of
$250/gross ton (AMM 2013). Historical price data for Aluminum and Cast iron could not be
found. To show how the value of the turbine could vary, a high and low salvage value for the
turbine was calculated with these values and shown in the table below.
Table 5-10: High and Low Estimated Salvage Values
The values of each of the commodities were obtained from the American Metal Market and
represent Heavy #1 Melt Steel, Cupala Cast iron, Heavy #1 copper and wire, and Old Aluminum-
sheet and cast (AMM 2013). These are the types and values used in many of the
SalvagablesTower Nacelle Rotor Foundation Total Total/MW Total for 750
kW
Total for 1.5
MW
Total for
750 kW
Total for
1.5 MW
Total for
750 kW
Total for
1.5 MWAMM Value AMM Value
ton ton ton ton ton ton ton ton lbs lbs gross ton gross ton $/gross ton $/ lb
Steel 126.1 27.1 5.7 27.0 158.9 96.3 72.2 144.5 130009.1 260018.2 52.2 104.5 345
Cast Iron 18.0 11.3 29.3 17.8 13.3 26.6 23972.7 47945.5 9.6 19.3 355
Aluminum 2.6 0.5 3.1 1.9 1.4 2.8 2536.4 5072.7 0.56
Copper 1.3 1.6 2.9 1.8 1.3 2.6 2372.7 4745.5 2.9
Data from Vestas V82- 1.65 MW LCA Scaled Turbine Data AMM Value, 10-16-2013
Salvagables
Total Turbine
Value 750 kW
Total Turbine
Value 1.5 MW
Total Turbine
Value 750 kW
Total Turbine
Value 1.5 MW
Steel 20,894$ 41,789$ 13,059$ 26,118$
Cast Iron 3,419$ 6,839$ 3,419$ 6,389$
Aluminum 1,420$ 2,841$ 1,420$ 2,841$
Copper 10,915$ 21,829$ 2,966$ 5,932$
TOTAL 36,648$ 73,298$ 20,864$ 41,280$
High Value Low Value
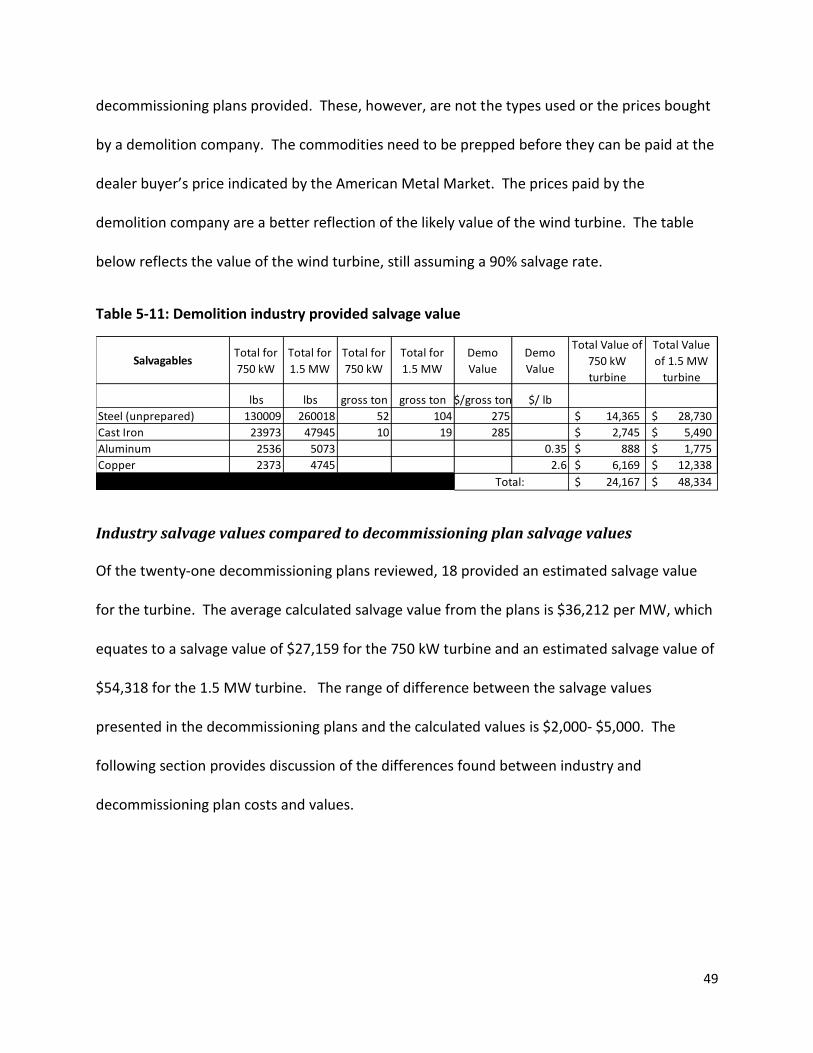
49
decommissioning plans provided. These, however, are not the types used or the prices bought
by a demolition company. The commodities need to be prepped before they can be paid at the
dealer buyer’s price indicated by the American Metal Market. The prices paid by the
demolition company are a better reflection of the likely value of the wind turbine. The table
below reflects the value of the wind turbine, still assuming a 90% salvage rate.
Table 5-11: Demolition industry provided salvage value
Industry salvage values compared to decommissioning plan salvage values
Of the twenty-one decommissioning plans reviewed, 18 provided an estimated salvage value
for the turbine. The average calculated salvage value from the plans is $36,212 per MW, which
equates to a salvage value of $27,159 for the 750 kW turbine and an estimated salvage value of
$54,318 for the 1.5 MW turbine. The range of difference between the salvage values
presented in the decommissioning plans and the calculated values is $2,000- $5,000. The
following section provides discussion of the differences found between industry and
decommissioning plan costs and values.
SalvagablesTotal for
750 kW
Total for
1.5 MW
Total for
750 kW
Total for
1.5 MW
Demo
Value
Demo
Value
Total Value of
750 kW
turbine
Total Value
of 1.5 MW
turbine
lbs lbs gross ton gross ton $/gross ton $/ lb
Steel (unprepared) 130009 260018 52 104 275 14,365$ 28,730$
Cast Iron 23973 47945 10 19 285 2,745$ 5,490$
Aluminum 2536 5073 0.35 888$ 1,775$
Copper 2373 4745 2.6 6,169$ 12,338$
24,167$ 48,334$ Total:
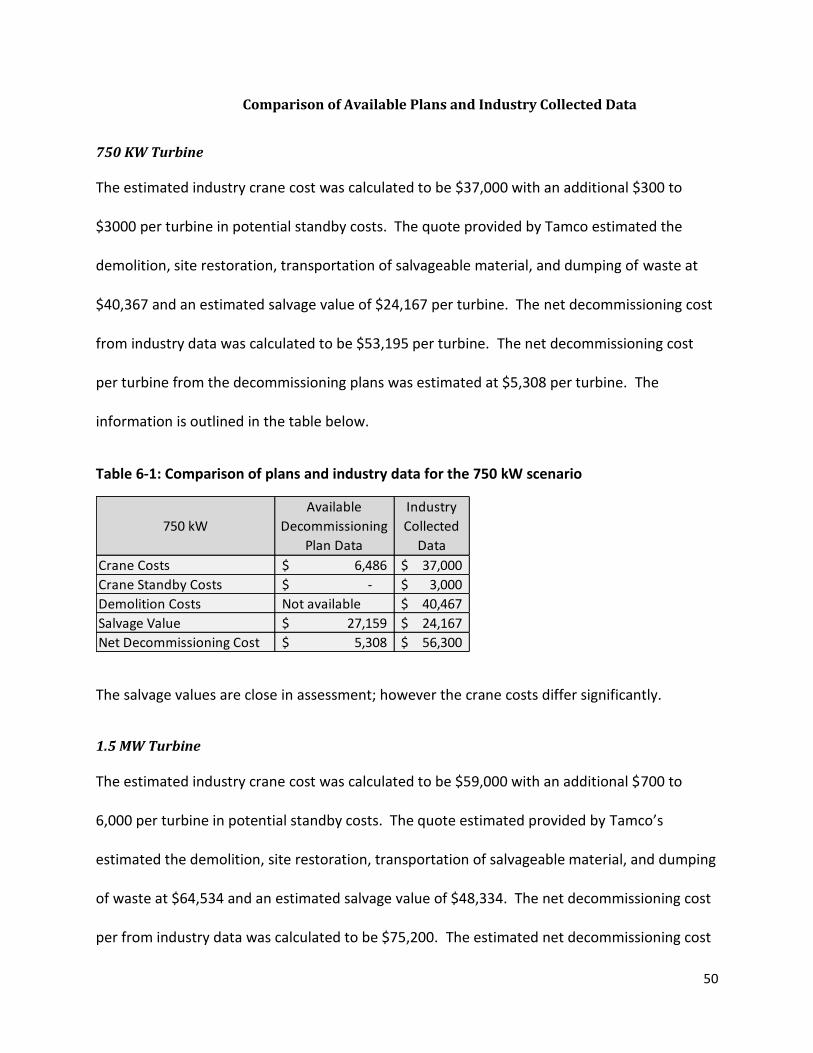
50
Comparison of Available Plans and Industry Collected Data Chapter 6
750 KW Turbine
The estimated industry crane cost was calculated to be $37,000 with an additional $300 to
$3000 per turbine in potential standby costs. The quote provided by Tamco estimated the
demolition, site restoration, transportation of salvageable material, and dumping of waste at
$40,367 and an estimated salvage value of $24,167 per turbine. The net decommissioning cost
from industry data was calculated to be $53,195 per turbine. The net decommissioning cost
per turbine from the decommissioning plans was estimated at $5,308 per turbine. The
information is outlined in the table below.
Table 6-1: Comparison of plans and industry data for the 750 kW scenario
The salvage values are close in assessment; however the crane costs differ significantly.
1.5 MW Turbine
The estimated industry crane cost was calculated to be $59,000 with an additional $700 to
6,000 per turbine in potential standby costs. The quote estimated provided by Tamco’s
estimated the demolition, site restoration, transportation of salvageable material, and dumping
of waste at $64,534 and an estimated salvage value of $48,334. The net decommissioning cost
per from industry data was calculated to be $75,200. The estimated net decommissioning cost
750 kW
Available
Decommissioning
Plan Data
Industry
Collected
Data
Crane Costs 6,486$ 37,000$
Crane Standby Costs -$ 3,000$
Demolition Costs Not available 40,467$
Salvage Value 27,159$ 24,167$
Net Decommissioning Cost 5,308$ 56,300$

51
calculated from the available decommissioning plans was $10,616. A summary of this data is
provided in the table below.
Table 6-2: Comparison of plans and industry data for the 1.5 MW scenario
Again, the salvage values were similar, but the crane costs differ drastically.
Decommissioning costs and their overall effect on the LCOE of wind energy
The levelized cost of energy (LCOE) is a metric used to evaluate the lifecycle costs of electricity
generation for various types of energy projects (Tegan et al.. 2012). There are four basic inputs
to any LCOE equation: installed capital cost (ICC), annual operating expenses (AOE), annual
energy production (AEP), and fixed charge rate (FCR), an annualized presentation of the cost of
financing a wind project (Tegan et al.. 2012).
LCOE = (( ) )
Equation 6-1
The LCOE for a 1.5 MW baseline project was calculated in the “2010 Cost of Wind Energy
Review” published by the National Renewable Energy Laboratory. The project uses the
following assumptions to calculate the LCOE:
Table 6-3: NREL LCOE Baseline Parameters for a 1.5 MW Wind Turbine
1.5 MW
Available
Decommissioning
Plan Data
Industry
Provided
Cost
Crane Costs 13,521$ 59,000$
Crane Standby Costs -$ 6,000$
Demolition Costs Not available 64,534$
Salvage Value 54,318$ 48,334$
Net Decommissioning Cost 10,616$ 75,200$

52
The total calculated LCOE for the baseline project is $71/MWh (Tegan et al.. 2012).
Decommissioning costs were omitted in the baseline calculation. Decommissioning costs
should be included in the installed capital costs (ICC) and considered when calculating the LCOE
of wind energy. The industry data collected suggests that the average total decommissioning
costs in present value (not including salvage value of the turbine) for a 1.5 MW turbine is
approximately $130,000. This equates to $87 per kW.
Table 6-4: 1.5 MW Turbine Decommissioning Costs from Industry Data
The LCOE was re-calculated to reflect an additional $87/kW of installed capital costs while
keeping the other parameters consistent with the baseline factors.
NREL Baseline (1.5 MW turbine) $/kW
ICC 2155
AOE 34
AEP 3345
FCR 9.50%
CF (capacity factor) 38%
1.5 MW
Industry
Provided
Cost
Crane Costs 59,000$
Crane Standby Costs 6,000$
Demolition Costs 64,534$
Salvage Value 48,334$
Net Decommissioning Cost 75,200$
Total Decommissioning Cost 129,534$
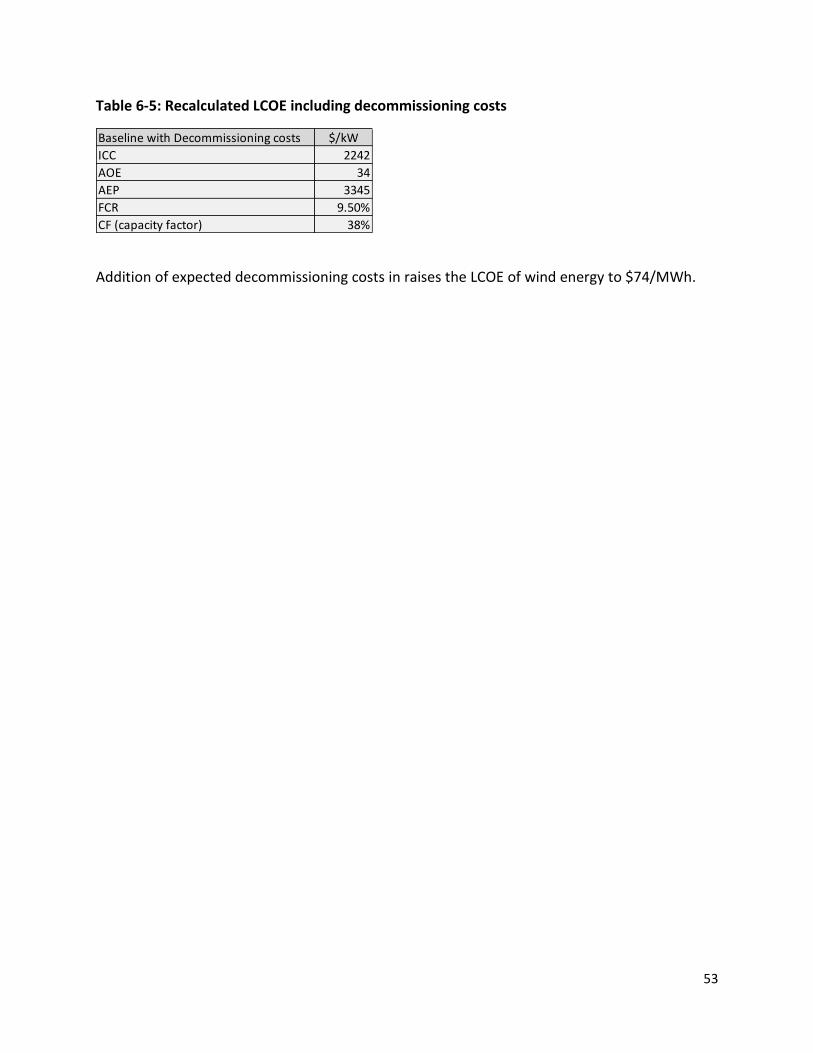
53
Table 6-5: Recalculated LCOE including decommissioning costs
Addition of expected decommissioning costs in raises the LCOE of wind energy to $74/MWh.
Baseline with Decommissioning costs $/kW
ICC 2242
AOE 34
AEP 3345
FCR 9.50%
CF (capacity factor) 38%

54
Chapter 7
Turbine Resale Value
The value of the wind turbine as a complete unit in an aftermarket was only considered in two
of the decommissioning plans reviewed. In certain economic climates, there may be a strong
market for used wind turbines. This has been the case in different European Countries, as the
European Union has set ambitious CO2 reduction targets. The waiting list for new wind turbines
(almost two years) has created a market for second hand wind turbines throughout Europe
(Welstead et al. 2013).
There are many benefits to installing used wind turbines. Used turbines cost about 40% less
than new turbines, decreasing the upfront capital investment (Welstead et al.. 2013). Older
turbines are also smaller, meaning less costs associated with transportation logistics and often
easier to get local approval for installation (Welstead et al. 2013). These qualities can be highly
lucrative to developing countries and thus create an aftermarket for used wind turbines.
Aftermarkets exist, although they are not extremely common. Companies such as Spares in
Motion, Blue Planet Wind, Wind Turbines-Market Place, and My Wind Power System offer a
marketplace for used wind turbines on the internet. Not surprisingly, a majority of the turbines
for sale are in Europe. Price data from these sites were collected.
Two hundred and forty two used wind turbines commissioned between 1994 and 2007 that
were available from the above sources were analyzed. Turbines ranged between 600 and 2000
kW. Some price quotes listed a dismantling fee. An average cost per KW was calculated from
this data and applied to quotes that did not include a dismantling fee. Prices listed in Euros

55
were equated to U.S. dollars with the exchange rate of 1.24 U.S dollars to one Euro. This is the
available data for the average exchange rate for the most recent year (2012) from the U.S.
Internal Revenue Service (US IRS 2013).
Wind turbine transaction data from the Berkley Lab database (Wiser 2008) was used to
compare the prices that the used turbines were selling for currently to their initial transaction
prices in the year they were commissioned. The initial transaction prices for the turbines were
compiled in this study and are represented in the Figure 7-1, below. Data for 1999 was not
available, so the average of 1998 and 2000 data was used to extrapolate the 1999 transaction
cost. These costs are in 2007 U.S. dollars.
Figure 7-1: Rising Project Costs Are Driven, in Part, By Rising Wind Turbine Prices (Wiser 2008)
The estimated transaction costs from the years the turbines were commissioned and the
available current resale data collected was used to estimate how the turbine depreciates over
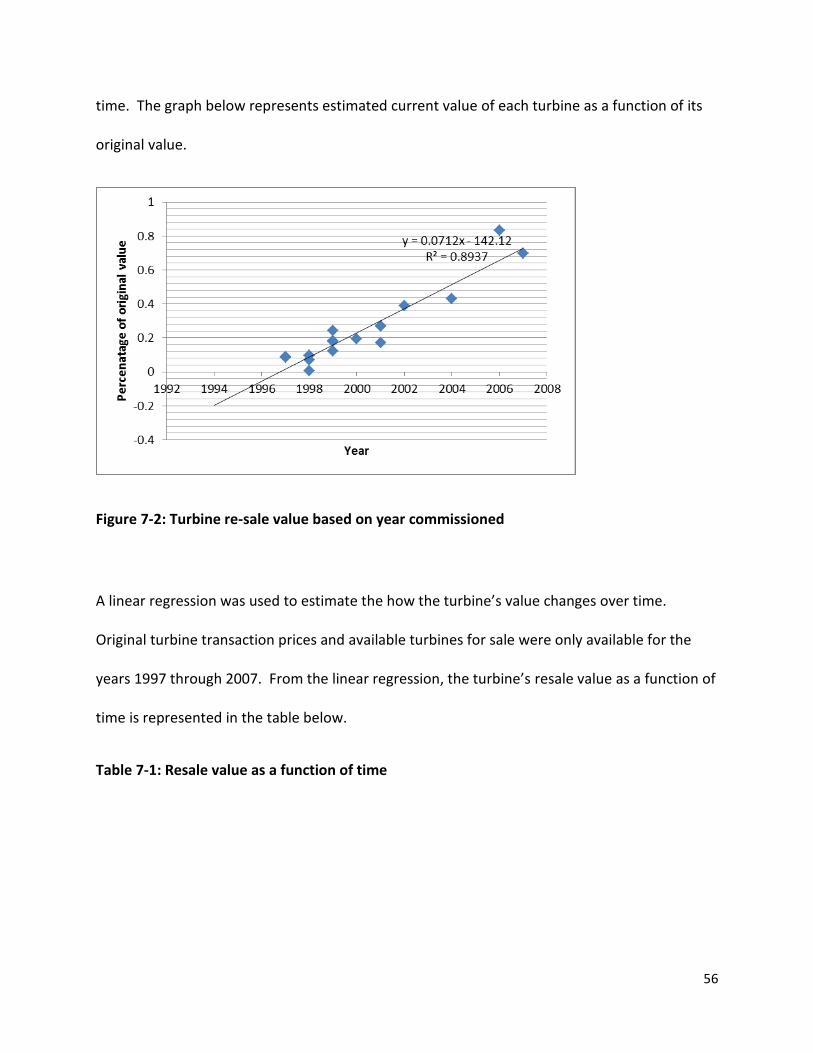
56
time. The graph below represents estimated current value of each turbine as a function of its
original value.
Figure 7-2: Turbine re-sale value based on year commissioned
A linear regression was used to estimate the how the turbine’s value changes over time.
Original turbine transaction prices and available turbines for sale were only available for the
years 1997 through 2007. From the linear regression, the turbine’s resale value as a function of
time is represented in the table below.
Table 7-1: Resale value as a function of time

57
The data suggests that the turbine holds a resale value in the first 12 years of operation. This
could be of extreme value in the overall decommissioning planning phase.
YearRe-Sale Value
1 78%
2 71%
3 64%
4 56%
5 49%
6 42%
7 35%
8 28%
9 21%
10 14%
11 7%
12 0%
58
Chapter 8
Conclusion and Suggested Practices
The research conducted represents an illustration of current decommissioning issues and
practices. Because the industry lacks experience in the field of decommissioning, limited data
and information was available and the research lacks enough data points to draw strong,
definitive conclusions. The research does, however, provide an essential framework for
designing proper decommissioning policy that can continue to promote wind energy
development while, at the same time, protects landowners and municipalities from unexpected
costs.
The analysis of the research conducted demonstrates two significant problems in current wind
turbine decommissioning practices. The first is the underestimated cost component of the
crane and deconstruction work. The value placed on the turbine at the end of its useful life and
the cost associated with the decommissioning practices varied widely among all of the analyzed
decommissioning plans. The analysis showed that while the estimated salvage value for the
decommissioning plans seems comparable in both the decommissioning plans and the data
collected, the costs of crane and turbine deconstruction differ dramatically. The radical
difference in crane costs was the principal contradictory factor between the available
decommissioning plans and the industry data collected.
The second significant problem that the analysis establishes is the lack of consideration for a
used wind turbine after-market and how it could affect decommissioning costs. If an active
resale market were to develop, the financial pressure of upfront surety bonds could be
59
alleviated as the analysis showed that the turbine could potentially hold a resale value through
the first 12 years of operation.
Instead of requiring an upfront decommissioning fund, a developer could rely on the re-sale
value of the turbine for the first five years and after five years, begin to build a fund equal to
the decommissioning costs outlined in this paper. As seen in many of the re-sale wind turbine
offerings, requiring the buyer of the turbine to pay for dismantling is not uncommon and could
also alleviate the issue of not having funds available to dismantle the turbine for re-sale.
The option of relying on the re-sale value has risks. Currently, there is not a large market for
used wind turbines in the U.S. and it is uncertain if the market in Europe is comparable to the
U.S. Also, the research has an inadequate range of data due to limited sources. The research
conducted supposes current market prices and should be used with current market prices if
replicated.
Suggested Planning Strategies for Decommissioning
The research conducted demonstrated two major issues that should be considered when
planning for the decommissioning phase of a wind farm. The first is that crane costs should be
thoroughly evaluated and realized prior to construction. The second is that the turbine holds a
significant resale value that could play a substantial role in eliminating financial risks. The
suggestions below apply the findings of this research to recommend alterations to wind farm
end of life planning.
1.) Develop a legal agreement that grants the landowner sole ownership of the wind
turbines and therefore right to sell the turbine(s) in the event that they do not generate

60
electricity for longer than an agreed upon period. If the turbines are abandoned, the
landowner has the right to sell them. This legal agreement essentially acknowledges
that there is a monetary value to the used turbine and provides security to the land-
owner in the event the wind farm does not reach its financial potential. This type of
legal arrangement will need to be developed carefully so as to expressly identify all
areas of potential liability for the parties to the agreement. For example, the agreement
may state that the parties agree to transfer turbine ownership from the wind farm
company to the land owner upon a determination of abandonment but not before, so
as not to create legal rights and responsibilities for the land owner prematurely.
Another example of clearly stating responsibilities may be to define who has legal
liability for the cost of maintenance of the turbines during the ownership of the wind
turbine company and the transfer to the land owner.
2.) During the pre-construction phase of the project and for the first five years of operation,
develop a much smaller monetary bond to cover the costs of hiring a decommissioning
project manager to assist the landowner in brokering the used wind turbines instead of
developing a decommissioning bond equal to the decommissioning costs of the turbine.
The hiring of a decommissioning manager should be decided by a third party, such as
the permit issuing agency such as the municipality or state department. This eliminates
hefty capital investments by already cash-strapped developers. It also provides
landowners, who often have very little wind industry knowledge, with the expertise to
properly manage their wind turbine assets.

61
3.) After the first five years of operation, begin to develop a decommissioning fund
equivalent to the decommissioning budget. Because of the risk and uncertainty
involved with a used wind turbine aftermarket, it would be prudent to begin planning
for such costs in the event an aftermarket did not exist. The fund would be structured
similarly to the plans reviewed, in which the developer puts a specific amount of money
into a bond equivalent to the costs of decommissioning. The developer evaluates those
costs and methodologies every three to five years throughout the turbines expected
lifetime to ensure proper funds are in place at the wind farm’s expected end of useful
life cycle. Additionally, evaluations of projected wind turbine decommissioning costs
should be performed more thoroughly and crane costs should be more accurately
assessed to include potential standby costs as addressed in this research.
This suggested decommissioning project planning is similar to current practices; however it uses
the turbines resale value to eliminate detrimental additional upfront capital costs in the first
five years of operation and brings to light the often over looked cost of crane work.
Further collection of industry costs and turbine resale values is critical to better understanding
the budgets associated with decommissioning wind turbines. The investigation provided by this
research has created a theoretical framework that introduces and describes some of the
biggest decommissioning challenges the wind industry faces today. As the industry matures,
the use of this information can be replicated and updated to ensure that both wind farm
development continues to thrive while land owners and tax payers remain protected from
expensive, poorly planned wind projects.
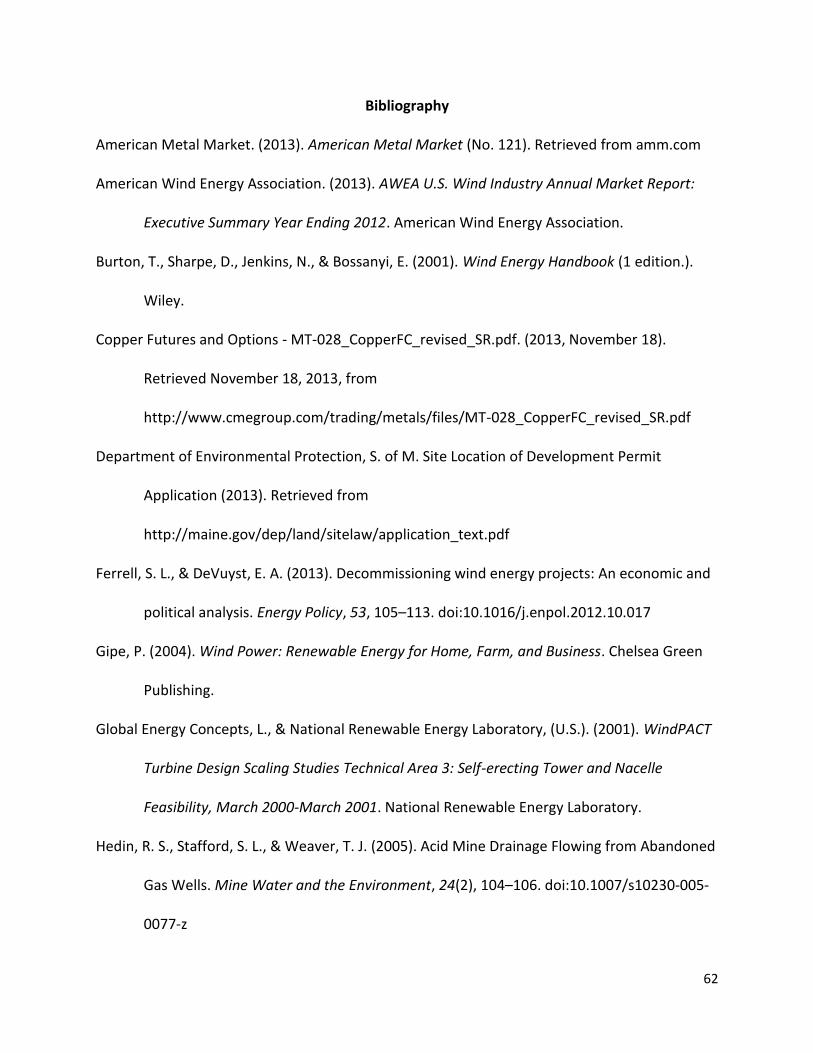
62
Bibliography
American Metal Market. (2013). American Metal Market (No. 121). Retrieved from amm.com
American Wind Energy Association. (2013). AWEA U.S. Wind Industry Annual Market Report:
Executive Summary Year Ending 2012. American Wind Energy Association.
Burton, T., Sharpe, D., Jenkins, N., & Bossanyi, E. (2001). Wind Energy Handbook (1 edition.).
Wiley.
Copper Futures and Options - MT-028_CopperFC_revised_SR.pdf. (2013, November 18).
Retrieved November 18, 2013, from
http://www.cmegroup.com/trading/metals/files/MT-028_CopperFC_revised_SR.pdf
Department of Environmental Protection, S. of M. Site Location of Development Permit
Application (2013). Retrieved from
http://maine.gov/dep/land/sitelaw/application_text.pdf
Ferrell, S. L., & DeVuyst, E. A. (2013). Decommissioning wind energy projects: An economic and
political analysis. Energy Policy, 53, 105–113. doi:10.1016/j.enpol.2012.10.017
Gipe, P. (2004). Wind Power: Renewable Energy for Home, Farm, and Business. Chelsea Green
Publishing.
Global Energy Concepts, L., & National Renewable Energy Laboratory, (U.S.). (2001). WindPACT
Turbine Design Scaling Studies Technical Area 3: Self-erecting Tower and Nacelle
Feasibility, March 2000-March 2001. National Renewable Energy Laboratory.
Hedin, R. S., Stafford, S. L., & Weaver, T. J. (2005). Acid Mine Drainage Flowing from Abandoned
Gas Wells. Mine Water and the Environment, 24(2), 104–106. doi:10.1007/s10230-005-
0077-z

63
Kaldellis, J. K., & Zafirakis, D. (2011). The wind energy (r)evolution: A short review of a long
history. Renewable Energy, 36(7), 1887–1901. doi:10.1016/j.renene.2011.01.002
LaNier, M. W., Inc, B. E., & (U.S.), N. R. E. L. (2005). LWST Phase 1 Project Conceptual Design
Study: Evaluation of Design and Construction Approaches for Economical Hybrid
Steel/concrete Wind Turbine Towers : June 28, 2002 - July 31, 2004. National Renewable
Energy Laboratory.
Lehman, B. (2013, October 15). Re: Decommissioning.
MS. (2005). Report: Bonds for abandoned wells “inadequate” to cover cleanup costs. Gas Daily,
22(159), 4.
National Renewable Energy Laboratory. (2012a). Annual Report on U.S. Wind Power
Installation, Cost, and Performance Trends: 2006. BiblioGov.
National Renewable Energy Laboratory. (2012b). WindPACT Turbine Design Scaling Studies
Technical Area 1: Composite Blades for 80- to 120-Meter Rotor. BiblioGov.
Nelson, V. (2013). Wind Energy: Renewable Energy and the Environment, Second Edition. CRC
Press.
PA DEP: 259 Abandoned Oil and Gas Wells Plugged in 2009. (2010). Energy Weekly News, 77.
Permitting of Wind Energy Facilities: A Handbook : Revised 2002. (2002). National Wind
Coordinating Committee.
Rohrs, E. (2013, October 15). Construction Experience.
Smith, K., Concepts, G. E., & (U.S.), N. R. E. L. (2001). WindPACT Turbine Design Scaling Studies
Technical Area 2: Turbine, Rotor, and Blade Logistics, March 27,2000 to December 31,
2000. National Renewable Energy Laboratory.

64
Steel in the data: A retrospective | AMM | 27/05/2013. (2013, November 18). Retrieved
November 18, 2013, from http://www.amm.com/Article/3214491/Search/results/Steel-
in-the-data.html
Tegen, S., Hand, M, Maples, B., Lanz, E., Schwabe, P., & Smith, A. (2012). 2010 cost of wind
energy review (Vol. 5000–52920). National Renewable Energy Laboratory.
Vestas Wind Systems. (2006, December 29). Life cycle assessment of electricity delivered from
an onshore power plant based on Vestas V82-1.65 MW turbines. Retrieved from
http://www.vestas.com/files/filer/en/sustainability/lca/lcav82165mwonshore.pdf
Welstead, J., Hirst, R., Keogh, D., Robb, G., & Bainsfair, R. (2013). Research and guidance on
restoration and decommissioning of onshore wind farms (No. 591) (p. 112). Scottish
National Heritage. Retrieved from
http://www.snh.org.uk/pdfs/publications/commissioned_reports/591.pdf
Wilburn, D. R. (2013). Wind Energy in the United States and Materials Required for the Land-
Based Wind Turbine Industry from 2010 Through 2030: Usgs Scientific Investigation.
BiblioBazaar.
Wiser, R. H. (2008, July 9). Tracking and Understanding Trends in the U.S. Wind Power Market:
2007 Annual Report on U.S. Wind Power Installation, Cost, and Performance Trends -
wiser_2007_annual_wind_market_report_webcast.pdf. Webinar. Retrieved November
18, 2013, from
http://www.windpoweringamerica.gov/pdfs/wpa/2008/wiser_2007_annual_wind_mar
ket_report_webcast.pdf
Yearly Average Currency Exchange Rates Translating foreign currency into U.S. Dollars. (2013,

65
September 27). United States Internal Revenue Service. Retrieved from
http://www.irs.gov/Individuals/International-Taxpayers/Yearly-Average-Currency-
Exchange-Rates

66
Chapter 9
Appendix
Table 9-1: Crane Survey
Crane Type 300T Crawler 350Ton Crawler 100 T to trip rotor
Daily Crane Rental Cost
Monthly Crane Rental Costs
Operating Rates ($/hr)
Stand by Rates ($/hr)
Overtime Rates ($/hr)
Crew costs
Crew Size (Operator and Oiler)
Hourly Crew Costs ($/hr)
Regular Time ($/hr)
Stand by Rates ($/hr)
Overtime Rates ($/hr)
Truck ($/day)
per Diem ($/day)
Mobilization Costs
Mob in/Out
Tower to Tower
TOTAL

67
Table 9-2: Turbine size
(Smith et al.. 2001)
Turbine Type 750 kW 1.5MW
hub height (m) 65 86
rotor mass (lbs) 27,797 67,802
hub mass (lbs) 8,395 27,535
total nacelle mass (lbs) 68,378 133,137
blade mass(each) 6,468 13,433
Gearbox mass (lbs) 10,256 19,972
Generator mass (lbs) 6,838 11,587
empty nacelle mass (lbs) 51,284 101,581
tower head mass (lbs) 99,942 201,843
Tower Sections 3 4
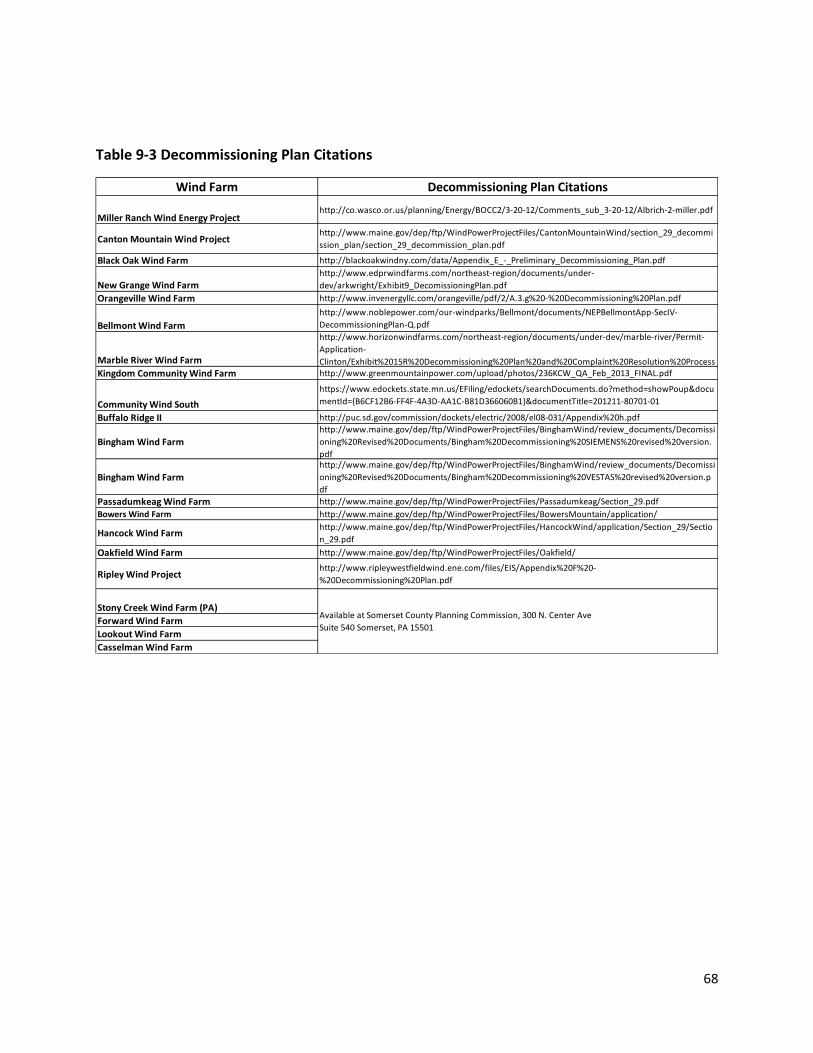
68
Table 9-3 Decommissioning Plan Citations
Wind Farm Decommissioning Plan Citations
Miller Ranch Wind Energy Projecthttp://co.wasco.or.us/planning/Energy/BOCC2/3-20-12/Comments_sub_3-20-12/Albrich-2-miller.pdf
Canton Mountain Wind Projecthttp://www.maine.gov/dep/ftp/WindPowerProjectFiles/CantonMountainWind/section_29_decommi
ssion_plan/section_29_decommission_plan.pdf
Black Oak Wind Farm http://blackoakwindny.com/data/Appendix_E_-_Preliminary_Decommissioning_Plan.pdf
New Grange Wind Farmhttp://www.edprwindfarms.com/northeast-region/documents/under-
dev/arkwright/Exhibit9_DecomissioningPlan.pdf
Orangeville Wind Farm http://www.invenergyllc.com/orangeville/pdf/2/A.3.g%20-%20Decommissioning%20Plan.pdf
Bellmont Wind Farm
http://www.noblepower.com/our-windparks/Bellmont/documents/NEPBellmontApp-SecIV-
DecommissioningPlan-Q.pdf
Marble River Wind Farm
http://www.horizonwindfarms.com/northeast-region/documents/under-dev/marble-river/Permit-
Application-
Clinton/Exhibit%2015R%20Decommissioning%20Plan%20and%20Complaint%20Resolution%20Process
Kingdom Community Wind Farm http://www.greenmountainpower.com/upload/photos/236KCW_QA_Feb_2013_FINAL.pdf
Community Wind South
https://www.edockets.state.mn.us/EFiling/edockets/searchDocuments.do?method=showPoup&docu
mentId={B6CF12B6-FF4F-4A3D-AA1C-B81D366060B1}&documentTitle=201211-80701-01
Buffalo Ridge II http://puc.sd.gov/commission/dockets/electric/2008/el08-031/Appendix%20h.pdf
Bingham Wind Farmhttp://www.maine.gov/dep/ftp/WindPowerProjectFiles/BinghamWind/review_documents/Decomissi
oning%20Revised%20Documents/Bingham%20Decommissioning%20SIEMENS%20revised%20version.
Bingham Wind Farm
http://www.maine.gov/dep/ftp/WindPowerProjectFiles/BinghamWind/review_documents/Decomissi
oning%20Revised%20Documents/Bingham%20Decommissioning%20VESTAS%20revised%20version.p
df
Passadumkeag Wind Farm http://www.maine.gov/dep/ftp/WindPowerProjectFiles/Passadumkeag/Section_29.pdf
Bowers Wind Farm http://www.maine.gov/dep/ftp/WindPowerProjectFiles/BowersMountain/application/
Hancock Wind Farmhttp://www.maine.gov/dep/ftp/WindPowerProjectFiles/HancockWind/application/Section_29/Sectio
n_29.pdf
Oakfield Wind Farm http://www.maine.gov/dep/ftp/WindPowerProjectFiles/Oakfield/
Ripley Wind Projecthttp://www.ripleywestfieldwind.ene.com/files/EIS/Appendix%20F%20-
%20Decommissioning%20Plan.pdf
Stony Creek Wind Farm (PA)
Forward Wind Farm
Lookout Wind Farm
Casselman Wind Farm
Available at Somerset County Planning Commission, 300 N. Center Ave
Suite 540 Somerset, PA 15501