Embed Size (px)
Citation preview

ORIGINAL RESEARCH ARTICLEpublished: 27 May 2014
doi: 10.3389/fneng.2014.00014
Decoding spectrotemporal features of overt and covertspeech from the human cortexStéphanie Martin1,2†, Peter Brunner3,4†, Chris Holdgraf1, Hans-Jochen Heinze5, Nathan E. Crone6,
Jochem Rieger1,7, Gerwin Schalk3,4, Robert T. Knight1,8 and Brian N. Pasley1*
1 Helen Wills Neuroscience Institute, University of California, Berkeley, CA, USA2 Department of Bioengineering, École Polytechnique Fédérale de Lausanne, Lausanne, Switzerland3 New York State Department of Health, Wadsworth Center, Albany, NY, USA4 Department of Neurology, Albany Medical College, Albany, NY, USA5 Department of Neurology, Otto-von-Guericke-Universitat, Magdeburg, Germany6 Department of Neurology, Johns Hopkins University School of Medicine, Baltimore, MD, USA7 Applied Neurocognitive Psychology, Carl-von-Ossietzky University, Oldenburg, Germany8 Department of Psychology, University of California, Berkeley, CA, USA
Edited by:
Randal A. Koene, Boston University,USA
Reviewed by:
Hun-Kuk Park, Kyung HeeUniversity, South KoreaEmanuele Olivetti, Bruno KesslerFoundation, Italy
*Correspondence:
Brian N. Pasley, CognitiveNeuroscience Research Laboratory,Helen Wills Neuroscience Institute,University of California, Berkeley,210 Barker Hall, Berkeley, CA 94720,USAe-mail: [email protected]
†These authors have contributedequally to this work.
Auditory perception and auditory imagery have been shown to activate overlapping brainregions. We hypothesized that these phenomena also share a common underlying neuralrepresentation. To assess this, we used electrocorticography intracranial recordings fromepileptic patients performing an out loud or a silent reading task. In these tasks, shortstories scrolled across a video screen in two conditions: subjects read the same storiesboth aloud (overt) and silently (covert). In a control condition the subject remainedin a resting state. We first built a high gamma (70–150 Hz) neural decoding modelto reconstruct spectrotemporal auditory features of self-generated overt speech. Wethen evaluated whether this same model could reconstruct auditory speech featuresin the covert speech condition. Two speech models were tested: a spectrogram and amodulation-based feature space. For the overt condition, reconstruction accuracy wasevaluated as the correlation between original and predicted speech features, and wassignificant in each subject (p 5< 10− ; paired two-sample t-test). For the covert speechcondition, dynamic time warping was first used to realign the covert speech reconstructionwith the corresponding original speech from the overt condition. Reconstruction accuracywas then evaluated as the correlation between original and reconstructed speechfeatures. Covert reconstruction accuracy was compared to the accuracy obtained fromreconstructions in the baseline control condition. Reconstruction accuracy for the covertcondition was significantly better than for the control condition (p < 0.005; pairedtwo-sample t-test). The superior temporal gyrus, pre- and post-central gyrus provided thehighest reconstruction information. The relationship between overt and covert speechreconstruction depended on anatomy. These results provide evidence that auditoryrepresentations of covert speech can be reconstructed from models that are built froman overt speech data set, supporting a partially shared neural substrate.
Keywords: electrocorticography, speech production, covert speech, decoding model, pattern recognition
INTRODUCTIONMental imagery produces experiences and neural activation pat-terns similar to actual perception. For instance, thinking of mov-ing a limb activates the motor cortex, internal object visualizationactivates the visual cortex, with similar effects observed for eachsensory modality (Roth et al., 1996; Kosslyn et al., 2001; Kosslyn,2005; Stevenson and Case, 2005). Auditory imagery is definedas the mental representation of sound perception in the absenceof external auditory stimulation. Behavioral and neural studieshave suggested that structural and temporal properties of audi-tory features, such as pitch (Halpern, 1989), timbre (Pitt andCrowder, 1992; Halpern et al., 2004), loudness (Intons-Peterson,1980) and rhythm (Halpern, 1988) are preserved during music
imagery (Hubbard, 2013). However, less is known about theneural substrate of speech imagery. Speech imagery (inner speech,silent speech, imagined speech, covert speech, or auditory verbalimagery) refers to our ability to “hear” speech internally with-out the intentional movement of any extremities, such as the lips,tongue, hands, or auditory stimulation (Brigham and Kumar,2010).
The neural basis of speech processing has been a topic ofintense investigation for over a century (Hickok and Poeppel,2007). The functional cortical organization of speech compre-hension includes Heschl’s gyrus (primary auditory cortex), thesuperior temporal gyrus (STG), and sulcus (STS) (e.g., Wernicke’sarea). Speech production depends on premotor, motor and
Frontiers in Neuroengineering www.frontiersin.org May 2014 | Volume 7 | Article 14 | 1
NEUROENGINEERING

Martin et al. Decoding overt and covert speech
posterior inferior frontal regions (e.g., Broca’s area) (Fiez andPetersen, 1998; Heim et al., 2002; Duffau et al., 2003; Billingsley-Marshall et al., 2007; Towle et al., 2008; Price, 2012). How thesebrain areas interact to encode higher-level components of speechsuch as phonological, semantic, or lexical features, as well astheir role in covert speech, remains unclear. Increasing evidencesuggests that speech imagery and perception activate the samecortical areas. Functional imaging studies (Yetkin et al., 1995;Rosen et al., 2000; Palmer et al., 2001). Transcranial magneticstimulation over motor sites and inferior frontal gyrus inducedspeech arrest in both overt and covert speech production (Aziz-Zadeh et al., 2005). Finally, brain lesion studies have shownhigh correlation between overt and covert speech abilities, suchas rhyme and homophones judgment (Geva et al., 2011b) forpatients with aphasia.
Imagery-related brain activation could result from top-downinduction mechanisms including memory retrieval (Kosslynet al., 2001; Kosslyn, 2005) and motor simulation (Guentheret al., 2006; Price, 2011; Tian and Poeppel, 2012). In memoryretrieval, perceptual experience may arise from stored informa-tion (objects, spatial properties, and dynamics) acquired duringactual speech perception and production experiences (Kosslyn,2005). In motor simulation, a copy of the motor cortex activity(efference copy) is forwarded to lower sensory cortices, enablinga comparison of actual with desired movement, and permit-ting online behavioral adjustments (Jeannerod, 2003; Tian andPoeppel, 2012). Despite findings of overlapping brain activationduring overt and covert speech (Hinke et al., 1993; Yetkin et al.,1995; McGuire et al., 1996; Rosen et al., 2000; Palmer et al., 2001;Aleman, 2004; Aziz-Zadeh et al., 2005; Geva et al., 2011a), itis likely that covert speech is not simply overt speech withoutmoving the articulatory apparatus. Behavioral judgment studiesshowed that aphasic patients indicated inner speech impair-ment, while maintaining relatively intact overt speech abilities,while others manifested the reverse pattern (Geva et al., 2011b).Similarly, imaging techniques showed different patterns of cor-tical activation during covert compared to overt speech, namelyin the premotor cortex, left primary motor cortex, left insula,and left superior temporal gyrus (Huang et al., 2002; Shuster andLemieux, 2005; Pei et al., 2011). This suggests that brain acti-vation maps associated with both tasks are dissociated at leastin some cases (Feinberg et al., 1986; Aleman, 2004; Shuster andLemieux, 2005; Geva et al., 2011a,b,c). The extent to which audi-tory perception and imagery engage similar underlying neuralrepresentations remains poorly understood.
To investigate similarities between the neural representationsof overt and covert speech, we employed neural decoding modelsto predict auditory features experienced during speech imagery.Decoding models predict information about stimuli or mentalstates from recorded neural activity (Bialek et al., 1991). Thistechnique has attracted increasing interest in neuroscience as aquantitative method to test hypotheses about neural representa-tion (Warland et al., 1997; Kay et al., 2008; Kay and Gallant, 2009;Naselaris et al., 2011; Pasley et al., 2012). For instance, decod-ing models have allowed predicting continuous limb trajectories(Carmena et al., 2003; Hochberg et al., 2006, 2012; Schalk et al.,2007; Pistohl et al., 2008) from the motor cortex. In the visual
domain, visual scenes can be decoded from neural activity in thevisual cortex (Warland et al., 1997; Kay et al., 2008). Similarly,this approach has been used to predict continuous spectrotem-poral features of speech (Guenther et al., 2009; Mesgarani et al.,2009). We used this approach to compare decoding accuracy dur-ing overt and covert conditions in order to evaluate the similarityof speech representations during speech perception and imagery.
We hypothesized that speech perception and imagery share apartially overlapping neural representation in auditory corticalareas. We reasoned that if speech imagery and perception shareneural substrates, the two conditions should engage similar neu-ral representations. Thus, a neural decoding model trained fromovert speech should be able to predict speech features in the covertcondition. (Pasley et al., 2012) showed that auditory spectrotem-poral features of speech could be accurately reconstructed, andused to identify individual words during various listening tasks.In this study, we used a similar neural decoding model trainedon sounds from self-generated overt speech. This model was thenused to decode spectrotemporal auditory features from brainactivity measured during a covert speech condition. Our resultsprovide evidence for a shared neural representation underlyingspeech perception and imagery.
To test these hypotheses we used electrocorticography (ECoG),which provides high spatiotemporal resolution recordings ofnon-primary auditory cortex (Leuthardt et al., 2004). In partic-ular, the high gamma band (HG, ∼70–150 Hz) reliably tracksneuronal activity in all sensory modalities (Lachaux et al., 2012)and correlates with the spike rate of the underlying neural pop-ulation (Miller et al., 2007; Boonstra et al., 2009; Lachaux et al.,2012). HG activity in auditory and motor cortex has been linkedto speech processing (Crone et al., 2001; Canolty, 2007; Towleet al., 2008; Llorens et al., 2011; Pasley et al., 2012), and servedas the input signal for all tested neural decoding models.
MATERIALS AND METHODSSUBJECTS AND DATA ACQUISITIONElectrocorticographic (ECoG) recordings were obtained usingsubdural electrode arrays implanted in 7 patients undergoingneurosurgical procedures for epilepsy (Table 1). All patients vol-unteered and gave their informed consent (approved by theAlbany Medical College Institutional Review Board) before test-ing. The implanted electrode grids (Ad-Tech Medical Corp.,Racine, WI; PMT Corporation, Chanhassen, MN) consistedof platinum–iridium electrodes (4 mm in diameter, 2.3 mmexposed) that were embedded in silicon and spaced at an inter-electrode distance of 0.6–1 cm. Grid placement and duration ofECoG monitoring were based solely on the requirements of theclinical evaluation (Figure 1).
ECoG signals were recorded at the bedside using seven 16-channel g.USBamp biosignal acquisition devices (g.tec, Graz,Austria) at a sampling rate of 9600 Hz. Electrode contacts distantfrom epileptic foci and areas of interest were used for refer-ence and ground. Data acquisition and synchronization withthe task presentation were accomplished using BCI2000 software(Schalk et al., 2004; Schalk, 2010). All channels were subse-quently downsampled to 1000 Hz, corrected for DC shifts, andband pass filtered from 0.5 to 200 Hz. Notch filters at 60, 120,
Frontiers in Neuroengineering www.frontiersin.org May 2014 | Volume 7 | Article 14 | 2

Martin et al. Decoding overt and covert speech
Table 1 | Clinical profiles of subjects.
Subject Age Sex Handed-ness FSIQ VIQ PIQ LL Seizure focus Grid/Strip locations
and contact numbers
S1 30 M Right 74 64 90 Bi-lateral Left temporal Left temporal (35)Left temporal pole (4)Left fronto-parietal (48)Left occipital pole (4)
S2 29 F Right 90 91 90 Left Left temporal Left temporal (35)Left fronto-parietal (56)Left temporal (4)Left occipital pole (4)
S3 26 F Right 112 106 117 Left Left temporal Left temporal (35)Left fronto-parietal (64)Left temporal (4)Left occipital pole (4)
S4 56 M Right 84 82 87 Left Left temporal Left temporal (35)Left fronto-parietal (56)Left occipital pole (4)
S5 26 M Right 102 103 100 Left Right temporal Right temporal (35)Right fronto-parietal (64)Right frontal pole (6)Right occipital pole (6)
S6 45 M Right 98 93 105 Left Left frontal Left front-temporal (54)Left temporal (4)
S7 29 F Right 84 111 95 Bi-lateral Left temporal Left temporal (68)Left fronto-parietal (40)Left frontal pole (4)Left parietal (4)Left temporal (4)
All of the subjects had normal cognitive capacity and were functionally independent. Full scale (FSIQ), verbal (VIQ), and performance (PIQ) intelligence has was
based on the Wechsler Adult Intelligence Scale (WAIS-III) test. Language lateralization (LL) was based on the Wada test.
FIGURE 1 | Electrode locations. Grid locations for each subject are overlaid on cortical surface reconstructions of each subject’s MRI scan.
and 180 Hz were used to remove electromagnetic noise. Thetime series were then visually inspected to remove the intervalscontaining ictal activity as well as channels that had excessivenoise (including broadband electromagnetic noise from hospitalequipment or poor contact with the cortical surface). Finally, elec-trodes were re-referenced to a common average. The high gammafrequency band (70–150 Hz) was extracted using the Hilberttransform.
In addition to the ECoG signals, we acquired the subject’svoice through a dynamic microphone (Samson R21s) that wasrated for voice recordings (bandwidth 80–12000 Hz, sensitivity2.24 mV/Pa) and placed within 10 cm of the patient’s face. Weused a dedicated 16-channel g.USBamp to amplify and digi-tize the microphone signal in sync with the ECoG data. Finally,we verified the patient’s compliance in the covert task using aneye-tracker (Tobii T60, Tobii Sweden).
Frontiers in Neuroengineering www.frontiersin.org May 2014 | Volume 7 | Article 14 | 3
Martin et al. Decoding overt and covert speech
EXPERIMENTAL PARADIGMSThe recording session included three conditions. In the firstcondition, text excerpts from historical political speeches or achildren’s story [i.e., Gettysburg Address (Roy and Basler, 1955),JFK’s Inaugural Address (Kennedy, 1961), or Humpty Dumpy(Mother Goose’s Nursery Rhymes, 1867)] were visually displayedon the screen moving from right to left at the vertical center ofthe screen. The rate of scrolling text ranged between 42 and 76words/min, and was adjusted based on the subject’s attentive-ness, cognitive/verbal ability, and comfort prior to experimentalrecordings. In the first condition, the subject was instructed toread the text aloud (overt condition). In the second condition,the same text was displayed at the same scrolling rate, but the sub-ject was instructed to read it silently (covert condition). The thirdcondition served as the control and was obtained while the sub-ject was in a resting state condition (baseline control). For eachcondition, a run lasted between 6 and 8 min, and was repeated2–3 times depending on the mental and physical condition of thesubjects.
AUDITORY SPEECH REPRESENTATIONSWe evaluated the predictive power of a neural decoding modelbased on high gamma signals (see section Decoding Model andReconstruction Procedure for details) to reconstruct two auditoryfeature representations: a spectrogram-based and a modulation-based representation. The spectrogram is a time-varying repre-sentation of the amplitude envelope at each acoustic frequency.This representation was generated by an affine wavelet transformof the sound pressure waveform using a 128 channel-auditory fil-ter bank mimicking the frequency analysis of the auditory periph-ery (Chi et al., 2005). The 128 acoustic frequencies of the initialspectrograms were subsequently downsampled to 32 acousticfrequency bins—with logarithmically spaced center frequenciesranging from 180 to 7000 Hz.
The modulation representation is based on a non-linear trans-formation of the spectrogram. Spectral and temporal fluctua-tions reflect important properties of speech intelligibility. Forinstance, comprehension is impaired when temporal modulations(<12 Hz) or spectral modulations (4 cycles/kHz) are removed(Elliott and Theunissen, 2009). In addition, low and intermedi-ate temporal modulation rates (<4 Hz) are linked with syllablerate, whereas fast modulations (>16 Hz) are related to sylla-ble onsets and offsets. Similarly, broad spectral modulations areassociated with vowel formants, whereas narrow spectral mod-ulations are associated with harmonics (Shamma, 2003). Themodulation representation was generated by a 2-D affine wavelettransform of the 128 channel auditory spectrogram. The bankof modulation-selective filters spanned a range of spectral scales(0.5–8 cycle/octave) and temporal rates (1–32 Hz), and was esti-mated from studies of the primary auditory cortex (Chi et al.,1999). The modulation representation was obtained by taking themagnitude of the complex-valued output of the filter bank, andsubsequently reduced to 60 modulation features (5 scales × 12rates) by averaging along the frequency dimension. These opera-tions were computed using the NSL Matlab toolbox (http://www.
isr.umd.edu/Labs/NSL/Software.htm). In summary, the neuraldecoding model predicted 32 spectral frequency features and 60
rate and scale features in the spectrogram-based and modulation-based speech representation, respectively.
DECODING MODEL AND RECONSTRUCTION PROCEDUREOvert speech decodingThe decoding model was a linear mapping between neural activityand the speech representation (Figure 2A). It modeled the speechrepresentation (spectrogram or modulation) as a linear weightedsum of activity at each electrode as follows:
S(t, p) =∑
τ
∑n
g(τ, p, n)R(t − τ, n), (1)
where R(t−τ, n) is the high gamma activity of electrode n at time(t − τ), where τ is the time lag ranging between −500 and 500 ms.S(t, p) is the estimated speech representation at time t and speechfeature p, where p is one of 32 acoustic frequency features inthe spectrogram-based representation (Figure 5B) and one of 60modulation features (5 scales × 12 rates) in the modulation-based representation (Figure 7B; see section Auditory SpeechRepresentations for details). Finally, g(τ, p, n) is the linear trans-formation matrix, which depends on the time lag, speech feature,and electrode channel. Both speech representations and the neu-ral high gamma response data were synchronized, downsampled
FIGURE 2 | Decoding approach. (A) The overt speech condition was usedto train and test the accuracy of a neural-based decoding model toreconstruct spectrotemporal features of speech. The reconstructedpatterns were compared to the true original (spoken out loud) speechrepresentation (spectrogram or modulation-based). (B) During covertspeech, there is no behavioral output, which prevents building a decodingmodel directly from covert speech data. Instead, the decoding modeltrained from the overt speech condition is used to decode covert speechneural activity. The covert speech reconstructed patterns were compared toidentical speech segments spoken aloud during the overt speech condition(using dynamic time warping realignment).
Frontiers in Neuroengineering www.frontiersin.org May 2014 | Volume 7 | Article 14 | 4

Martin et al. Decoding overt and covert speech
to 100 Hz, and standardized to zero mean and unit standarddeviation prior to model fitting.
Model parameters, the matrix g described above, were fit usinggradient descent with early stopping regularization—an iterativelinear regression algorithm. We used a jackknife resampling tech-nique to fit separately between 4 and 7 models (Efron, 1982), andthen averaged the parameter estimates to yield the final model.To maintain the temporal correlations within neural activity andspeech features, the data were first divided into 7 seconds blocks.From these blocks, 90% were randomly partitioned into a trainingset and 10% into a testing set. Within the training set, 10% of thedata were used to monitor out-of-sample prediction accuracy todetermine the early stopping criterion and minimize overfitting.The algorithm was terminated after a series of 30 iterations fail-ing to improve performance. Finally, model prediction accuracy(see section Evaluation for details) was evaluated on the indepen-dent testing set. Model fitting was performed using the STRFLabMATLAB toolbox (http://strflab.berkeley.edu/).
Covert speech decodingDecoding covert speech is complicated by the lack of any mea-surable behavioral or acoustic output that is synchronized tobrain activity. In other words, there is no simple ground truth bywhich to evaluate the accuracy of the model when a well-definedoutput is unavailable. To address this, we used the followingapproach. First, the decoding model was trained using data fromthe overt speaking condition. Second, the same model (Equation1) was applied to data from the covert condition to predict speechfeatures imagined by the subject (Figure 2B), as follows:
Scovert(t, p) =∑
τ
∑n
g(τ, p, n)Rcovert(t − τ, n), (2)
where Scovert(t, p) is the predicted covert speech representationat time t and speech feature p, and Rcovert(t−τ, n) is the highgamma neuronal response of electrode n at time (t−τ), where τ isthe time lag ranging between -500 and 500 ms. Finally, g(τ, p, n)is the linear model trained from the overt speech condition. Toevaluate prediction accuracy during covert speech, we made theassumption that the covert speech representation should matchthe spectrotemporal content of overt speech. In this sense, overtspeech is used as the “ground truth.” Because subjects read thesame text segments in both overt and covert conditions, we com-puted the similarity between the covert reconstructions and thecorresponding original speech sounds recorded during the overtcondition. To account for timing differences between conditions,we used dynamic time warping to realign the covert reconstruc-tion to the original overt speech sound, as described in the nextsection.
Dynamic time warpingWe used a dynamic time warping (DTW) algorithm to realignthe covert speech reconstruction with the corresponding spo-ken audio signal from the overt condition, allowing a directestimate of the covert reconstruction accuracy (Figure 3B). Forthe overt speech reconstructions, dynamic time warping was notemployed (Figure 3A), unless otherwise stated. DTW is a stan-dard algorithm used to align two sequences that may vary intime or speed (Sakoe and Chiba, 1978; Giorgino, 2009). The ideabehind DTW is to find the optimal path through a local sim-ilarity matrix d, computed between every pair of elements inthe query and template time series, X ∈ R
P x N and Y ∈ RP x M
as follows:
d (n, m) = f(xn, ym
), d ∈ R
N x M, (3)
FIGURE 3 | Speech realignment. (A) Overt speech analysis—the overallreconstruction accuracy for the overt speech condition was quantified bycomputing directly the correlation coefficient (Pearson’s r) between thereconstructed and original speech representations (B) Covert speechanalysis—the covert speech reconstruction is not necessarily aligned to thecorresponding overt speech representation due to speaking rate differencesand repetition irregularities. The reconstruction was thus realigned to the overtspeech stimuli using dynamic time warping. The overall reconstructionaccuracy was then quantified by computing the correlation coefficient(Pearson’s r) between the covert speech reconstruction and the original speech
representation. (C) Baseline control analysis—a resting state (baseline control)condition was used to assess statistical significance of covert speechreconstruction accuracy. Resting state activity was used to generate a noisereconstruction and dynamic time warping was applied to align the noisereconstruction to overt speech as in (B). Because dynamic time warping hassubstantial degrees of freedom, due to its ability to stretch and compressspeech segments, the overall reconstruction accuracy for the baseline controlcondition is significantly higher than zero. However, direct statisticalcomparisons between the covert and baseline conditions are valid as equivalentanalysis procedures are applied to both covert and resting state neural data.
Frontiers in Neuroengineering www.frontiersin.org May 2014 | Volume 7 | Article 14 | 5

Martin et al. Decoding overt and covert speech
FIGURE 4 | Brain mapping and electrode localization. (A) Post-operativeCT scans (1 mm slices) and (C) pre-operative structural MRI scans (1.5 mmslices, T1-weighted) were acquired for each subject. From these scans, gridposition (B) and the cortical surface (D) were reconstructed providing asubject-specific anatomical model (E) (see section Coregistration fordetails).
where d is the dissimilarity matrix at time n and m, f can be anydistance metric between sequence x and y at time n and m, respec-tively. In this study, we used the Euclidean distance, defined as
d (n, m) =√∑P
p (xnp − ymp)2. Given ϕ, the average accumulated
distortion between both warped signals is defined by:
dϕ(x, y) =K∑
k = 1
d(ϕx(k), ϕy(k)
)Cϕ
, (4)
where ϕx and ϕy are the warping functions of length K (thatremap the time indices of X and Y, respectively), and Cϕ is thecorresponding normalization constant (in this case N + M),ensuring that the accumulated distortions are comparable alongdifferent paths. The optimal warping path ϕ, chooses the indicesof X and Y in order to minimize the overall accumulated distance.
D (X, Y) = minϕ
dϕ (X, Y) , (5)
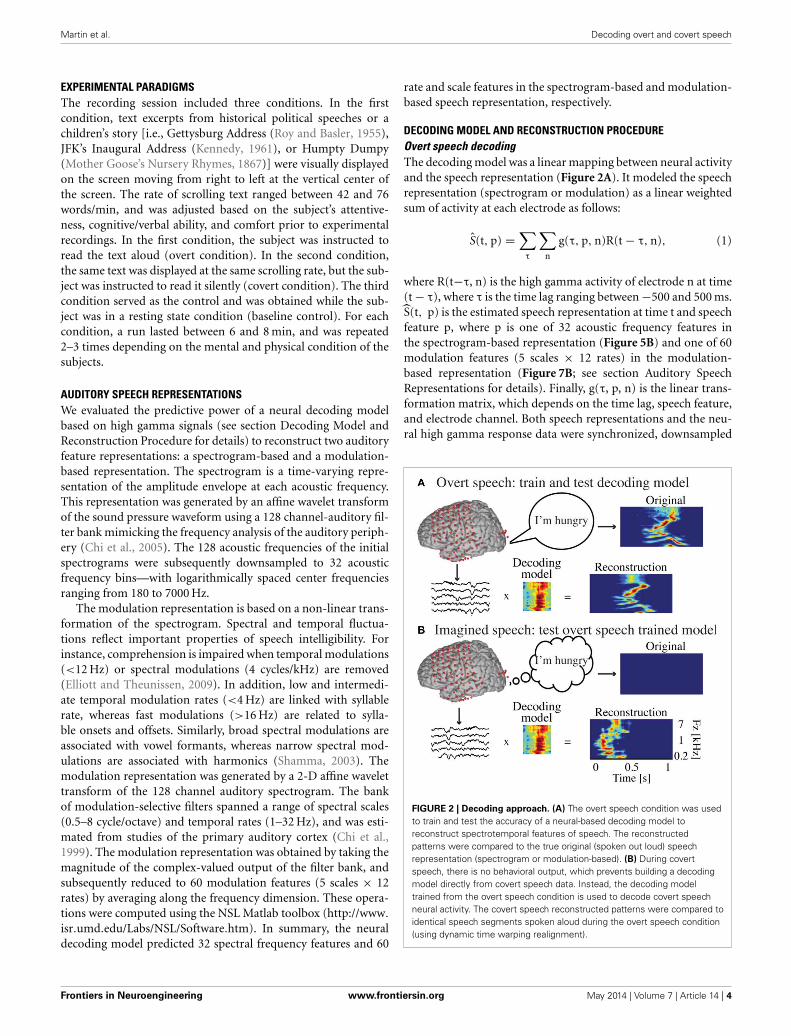
FIGURE 5 | Overt speech reconstruction accuracy for the
spectrogram-based speech representation. (A) Overallreconstruction accuracy for each subject using thespectrogram-based speech representation. Error bars denote standarderror of the mean (s.e.m.). Overall accuracy is reported as themean over all features (32 acoustic frequencies ranging from0.2–7 kHz). The overall spectrogram reconstruction accuracy for theovert speech was greater than baseline control reconstructionaccuracy in all individuals (p < 10−5; Hotelling’s t-test). Baselinecontrol reconstruction accuracy was not significantly different fromzero (p > 0.1; one-sample t-test; gray dashed line)(B) Reconstruction accuracy as a function of acoustic frequencyaveraged over all subjects (N = 7) using the spectrogram model.Shaded region denotes s.e.m. over subjects.
where D is the accumulated distance or global dissimilarity. Thealignment was computed using Rabiner-Juan step patterns (type3) (Rabiner, 1993). This step pattern constrained the sets ofallowed transitions between matched pairs to:
[ϕx (k + 1)−ϕx (k) , ϕy (k + 1) − ϕy (k)] ∈ {(1, 2), (2, 1), (1, 1)}(6)
In addition, we assumed that the temporal offsets between covertspeech and original overt speech would be less than 2 s, and thusintroduced a global constraint—the Sakoe-Chiba band window
Frontiers in Neuroengineering www.frontiersin.org May 2014 | Volume 7 | Article 14 | 6

Martin et al. Decoding overt and covert speech
FIGURE 6 | Overt speech reconstruction and identification. (A) Toppanel: segment of the original sound spectrogram (subject’s own voice),as well as the corresponding text above it. Bottom panel: same segmentreconstructed with the decoding model. (B) Identification rank. Speechsegments (5 s) were extracted from the continuous spectrogram. Foreach extracted segment (N = 123) a similarity score (correlationcoefficient) was computed between the target reconstruction and each
original spectrogram of the candidate set. The similarity scores weresorted and identification rank was quantified as the percentile rank of thecorrect segment. 1.0 indicates the target reconstruction matched thecorrect segment out of all candidate segments; 0.0 indicates the targetwas least similar to the correct segment among all other candidates;(dashed line indicates chance level = 0.5; median identification rank =0.87; p < 10−5; randomization test).
(Sakoe and Chiba, 1978), defined as follows:
∣∣ϕx (k) − ϕy(k)∣∣ ≤ T (7)
where T = 2 s was the chosen value that defines the maximum-allowable width of the window. Finally, to reduce computationalload, the entire time series was broken into 30 s segments, andwarping was applied on each individual pair of segments (overt,covert, or baseline control reconstruction warped to originalspeech representation). The warped segments were concatenatedand the reconstruction accuracy was defined on the full timeseries of warped data. The DTW package in R (Giorgino, 2009)was used for all analyses.
Baseline control condition (resting state)To assess statistical significance of the covert reconstructionaccuracy, we applied the same decoding steps (sections Covertspeech decoding—Dynamic time warping) to a baseline con-trol condition taken from data recorded during a separateresting state recording session. The overt speech decodingmodel was applied to neural data from the baseline control,as follows:
Sbaseline(t, p) =∑
τ
∑n
g(τ, p, n)Rbaseline(t − τ, n), (8)
where Sbaseline(t, p) is the predicted baseline reconstruction attime t and speech feature p, and Rbaseline(t−τ, n) is the highgamma neural response during resting state. Finally, g(τ, p, n)is the linear model trained from the overt speech condition. Wealso used DTW to realign the baseline control reconstructionwith the spoken audio signal from the overt condition, allowinga direct estimate of the control condition decoding predictions(Figure 3C).
EVALUATIONIn the overt speech condition, reconstruction accuracy wasquantified by computing the correlation coefficient (Pearson’sr) between the reconstructed and original speech representa-tion using data from the independent test set. For each cross-validation resample, we calculated one correlation coefficientfor each speech feature over time—leading to 32 correlationcoefficients (one for each acoustic frequency features) for thespectrogram-based model and 60 correlation coefficients (5scale × 12 rate features) for the modulation-based model. Overallreconstruction accuracy was reported as the mean correlationover resamples and speech components (32 and 60 for the spec-trogram and modulation representation, respectively). Standarderror of the mean (s.e.m.) was calculated by taking the standarddeviation of the overall reconstruction accuracy across resamples.To assess statistical significance (see section Statistics for details),overt speech reconstruction accuracy was compared to the accu-racy obtained from the baseline control condition (resting state).
In the covert speech condition, we first realigned thereconstructions and original overt speech representations usingdynamic time warping (Figure 3B). Then, we computed the over-all reconstruction accuracy using the same procedure as in theovert speech condition. To evaluate statistical significance (seesection Statistics for details), DTW was also applied to the base-line control condition prior to assessing the overall reconstructionaccuracy (Figure 3C).
To further assess the predictive power of the reconstructionprocess, we evaluated the ability to identify specific blocks ofspeech utterances within the continuous recording (Figure 11).First, 24–140 segments of speech utterances (5 s duration) wereextracted from the original and reconstructed spectrogram rep-resentations. Second, a confusion matrix was constructed whereeach element contained the similarity score between the targetreconstructed segment and the original reference segments from
Frontiers in Neuroengineering www.frontiersin.org May 2014 | Volume 7 | Article 14 | 7

Martin et al. Decoding overt and covert speech
the overt speech spectrogram. To compute the similarity scorebetween each target and reference segment, DTW was applied totemporally align each pair and the mean correlation coefficientwas used as the similarity score. The confusion matrix reflectshow well a given reconstructed segment matches its correspond-ing original segment vs. other candidates. The similarity scoreswere sorted, and identification accuracy was quantified as the per-centile smaller than the rank of the correct segment (Pasley et al.,2012). At chance level, the expected percentile rank is 0.5, whileperfect identification is 1.0.
To define the most informative areas for overt speech decodingaccuracy, we isolated for each electrode its corresponding decod-ing weights, and used the electrode-specific weights to generatea separate reconstruction for each electrode. This allowed calcu-lating a reconstruction accuracy correlation coefficient for eachindividual electrode. We applied the same procedure to the base-line condition. Baseline reconstruction accuracy was subtractedfrom the overt values to generate subject-specific informativearea maps (Figure 8). The same technique was used in the covertspeech condition, except that DTW was applied to realign sepa-rately each electrode-specific reconstruction to the original overtspeech. Similarly, baseline reconstruction accuracy (with DTWrealignment) was subtracted from the covert values to define theinformative areas (Figure 12).
STATISTICSTo assess statistical significance for the difference between overtspeech and baseline control reconstruction accuracy, we usedHotelling’s t statistic with a significance level of p < 10−5. Thistest accounts for the dependence of the two correlations on thesame group (i.e., both correlations are relative to the same originalovert speech representation) (Hotelling, 1940; Birk, 2013). It eval-uates whether the correlations between overt speech reconstruc-tion accuracy and baseline reconstruction accuracy differed inmagnitude taking into account their intercorrelation, as follows:
t =(rjk − rjh
)√(n − 3)(1 + rkh)√2|R| (9)
where rjk is the correlation between original overt speech andreconstruction, rjh is the correlation between original overt speechand baseline reconstruction and rkh is the correlation betweenovert speech reconstruction and baseline reconstruction; df =n − 3 is the effective sample size (Kaneoke et al., 2012) and where
|R| = 1 + 2rjk rjh rkh − r2jk − r2
jh − r2kh (10)
At the population level (Figure 5A), statistical significance wasperformed using Student’s t-tests (p < 10−5) after first applyingFisher’s Z transform to convert the correlation coefficients to anormal distribution (Fisher, 1915).
Test of significance in the covert speech condition was equiv-alent to the overt condition (Equation 9; p < 0.05; Hotelling’st-test), except that the reconstructions and original overt speechrepresentations were first realigned using dynamic time warp-ing. Since DTW induces an artificial increase in correlationby finding an optimal warping path between any two signals
FIGURE 7 | Overt speech reconstruction accuracy for the
modulation-based speech representation. (A) Overall reconstructionaccuracy for each subject using the modulation-based speechrepresentation. Error bars denote s.e.m. Overall accuracy is reported as themean over all features (5 spectral and 12 temporal modulations rangingbetween 0.5–8 cyc/oct and -32-32 Hz, respectively). The overall modulationreconstruction accuracy for the overt speech was greater than baselinecontrol reconstruction accuracy in all individuals (p < 10−5; Hotelling’st-test). Baseline control reconstruction accuracy was not significantlydifferent from zero (p > 0.1; one-sample t-test; gray dashed line).(B) Reconstruction accuracy as a function of rate and scale averaged overall subjects (N = 7).
(including potential noise signals), this procedure causes theaccuracy for baseline reconstruction to exceed zero correlation.However, because the equivalent data processing sequence wasapplied to both conditions, any statistical differences betweenthe two conditions were due to differences in the neural inputsignals.
At the population level (Figure 9), we directly compared thereconstruction accuracy in all three conditions (overt, covert andbaseline control). DTW realignment to the original overt speechwas first applied separately for each condition. Reconstructionaccuracy was computed as the correlation between the respec-tive realigned pairs. Statistical significance was performed usingFisher’s Z transform and One-Way ANOVA (p < 10−6), followed
Frontiers in Neuroengineering www.frontiersin.org May 2014 | Volume 7 | Article 14 | 8

Martin et al. Decoding overt and covert speech
FIGURE 8 | Overt speech informative areas. Reconstruction accuracycorrelation coefficients were computed separately for each individualelectrode and for both overt and baseline control conditions (see sectionOvert Speech: Informative areas for details). The plotted correlation values
are calculated by subtracting the correlation during baseline control from theovert condition. The informative area map was thresholded to p < 0.05(Bonferroni correction) (A) Spectrogram-based reconstruction accuracy(B) modulation-based reconstruction accuracy.
by post-hoc t-test (p < 10−5 for overt speech; p < 0.005 for covertspeech).
For individual subjects, significance of identification rankwas computed using a randomization test (p < 10−5 for overtspeech; p < 0.005 for covert speech; p > 0.5 for baseline con-trol). We shuffled the segment label in the candidate set 10,000times to generate a null distribution of identification ranksunder the hypothesis that there is no relationship betweentarget and reference speech segments. Time-varying speechrepresentations are auto-correlated. To maintain temporal cor-relations in the data, and preserve the exchangeability of thetrial labels, the length of the extracted segments was cho-sen sufficiently longer than the speech representation autocor-relation (5 s). The proportion of shuffled ranks greater thanthe observed rank yields the p-value that the observed accu-racy is due to chance. Identification accuracy was assessed foreach of the three experimental conditions (overt reconstruc-tion, covert reconstruction, baseline control reconstruction). Atthe population level, significant identification performance wastested using a one-sided, one-sample t-test (p < 10−5 for overtspeech; p < 0.05 for covert speech; p > 0.5 for baseline con-trol).
For the informative electrode analysis, statistical significance ofovert speech reconstruction was determined relative to the base-line condition using Hotelling’s t statistic (Equation 9; Hotelling’st-test). Electrodes were defined as “informative” if the overtspeech reconstruction accuracy was significantly greater thanbaseline (p < 0.05; Hotelling’s t-test with Bonferroni correction).The same procedure was used for covert speech informative areas(Equation 9; p < 0.05; Hotelling’s t-test with Bonferroni cor-rection), except that DTW was used in both covert speech andbaseline control condition.
To investigate possible anatomical differences between overtand covert informative areas, all significant electrodes (eitherovert, covert or both conditions; p < 0.05; Bonferroni cor-rection) were selected for an unbalanced Two-Way ANOVA,with experimental condition (overt and covert) and anatomicalregion (superior temporal gyrus, pre- and post-central gyrus) asfactors. Figure 13 shows significant electrodes in these regions
across subjects, co-registered with the Talairach brain template(Lancaster et al., 2000).
COREGISTRATIONEach subject had post-operative anterior–posterior and lateralradiographs (Figure 4), as well as computer tomography (CT)scans to verify ECoG grid locations. Three-dimensional corticalmodels of individual subjects were generated using pre-operativestructural magnetic resonance (MR) imaging. These MR imageswere co-registered with the post-operative CT images usingCurry software (Compumedics, Charlotte, NC) to identify elec-trode locations. Electrode locations were assigned to Brodmannareas using the Talairach Daemon (http://www.talairach.org,(Lancaster et al., 2000). Activation maps computed across sub-jects were projected on this 3D brain model, and were generatedusing a custom Matlab program (Gunduz et al., 2012).
RESULTSOVERT SPEECHSpectrogram-based reconstructionThe overall spectrogram reconstruction accuracy for overt speechwas significantly greater than baseline control reconstructionaccuracy in all individual subjects (p < 10−5; Hotelling’s t-test,Figure 5A). At the population level, mean overall reconstructionaccuracy averaged across all subjects (N = 7) was also signif-icantly higher than baseline control condition (r = 0.41, p <
10−5; Fisher’s Z transform followed by paired two-sample t-test).The baseline control reconstruction accuracy was not significantlydifferent from zero (r = 0.0, p > 0.1; one-sample t-test; dashedline; Figure 5A). Group averaged reconstruction accuracy forindividual acoustic frequencies ranged between r =∼ 0.25–0.5(Figure 5B). An example of a continuous segment of the origi-nal and reconstructed spectrogram is depicted for a subject withleft hemispheric coverage in Figure 6A. In this subject, the recon-struction quality permitted accurate identification of individualdecoded speech segments (Figure 6B). The median identifica-tion rank (0.87, N = 123 segments) was significantly greater thanchance level (0.5, p < 10−5; randomization test). Identificationperformance was significant in each individual subject (p < 10−5;
Frontiers in Neuroengineering www.frontiersin.org May 2014 | Volume 7 | Article 14 | 9

Martin et al. Decoding overt and covert speech
FIGURE 9 | Overall reconstruction accuracy using dynamic time
warping realignment. Overall reconstruction accuracy for each subjectduring overt speech, covert speech, and baseline control conditions afterdynamic time warping realignment. (A) Spectrogram-based representation(B) Modulation-based representation.
randomization test). Across all subjects, identification perfor-mance was significant for overt speech reconstruction (Figure 11;rankovert = 0.91 > 0.5, p < 10−6; one-sided one-sample t-test),whereas the baseline control condition was not significantlygreater than chance level (rankbaseline = 0.48 > 0.5, p > 0.5 one-sided one-sample t-test).
Modulation-based reconstructionWe next evaluated reconstruction accuracy of the modulationrepresentation. The overall reconstruction accuracy was sig-nificant in all individual subjects (p < 10−5; Hotelling’s t-testFigure 7A). At a population level, mean overall reconstructionaccuracy averaged over all patients (N = 7) was also significantlyhigher than the baseline reconstruction (r = 0.55, p < 10−5;Fisher’s Z transform followed by paired two-sample t-test). Thebaseline control reconstruction accuracy was not significantly dif-ferent from zero (r = 0.02, p > 0.1; one-sample t-test; dashedline; Figure 7A). Group averaged reconstruction accuracy forindividual rate and scale was highest for temporal modulationsabove 2 Hz (Figure 7B).
Informative areasFigure 8 shows the significant informative areas (map thresh-olded at p < 0.05; Bonferroni correction), quantified by theelectrode-specific reconstruction accuracy (see section Evaluationfor details). In both spectrogram and modulation-based repre-sentations the most accurate sites for overt speech decoding werelocalized to the superior temporal gyrus, pre and post-centralgyrus, consistent with previous spectrogram decoding studies(Pasley et al., 2012).
COVERT SPEECHSpectrogram-based reconstructionFigure 9A shows the overall reconstruction accuracy for overtspeech, covert speech, and baseline control after DTW realign-ment to the original overt speech was applied separately foreach condition. The overall reconstruction accuracy for covertspeech was significantly higher than the control condition in5 out of 7 individual subjects (p < 0.05; Hotelling’s t-test; p >
0.05 for the non-significant subjects). At the population level,there was a significant difference in the overall reconstructionaccuracy across the three conditions [overt, covert and baselinecontrol; F(2,18) = 35.3, p < 10−6; Fisher’s Z transform followedby One-Way ANOVA]. Post-hoc t-tests confirmed that covertspeech reconstruction accuracy was significantly lower thanovert speech reconstruction accuracy (rcovert = 0.34 < rovert =0.50, p < 10−5; Fisher’s Z transform followed by paired two-sample t-test), but higher than the baseline control condition(rcovert = 0.34 > rbaseline = 0.30, p < 0.005; Fisher’s Z transformfollowed by a paired two-sample t-test). Figure 10A illustrates asegment of the reconstructed covert speech spectrogram and itscorresponding overt segment (realigned with DTW). We nextevaluated identification performance (N = 123 segments) forcovert speech and baseline control conditions in this subject(Figure 10B). In the covert speech condition, the median iden-tification rank equaled 0.62, and was significantly higher thanchance level of 0.5 (p < 0.005; randomization test), whereas thebaseline control condition was not significant (median identi-fication rank = 0.47, p > 0.5; randomization test). Several ofthe remaining subjects exhibited a trend toward higher identi-fication performance, but were not significant at the p < 0.05level (Figure 11; randomization test). At the population level,mean identification performance across all subjects was signifi-cantly greater than chance for the covert condition (rankcovert =0.55 > 0.5, p < 0.05; one-sided one-sample t-test), and not sig-nificant for the baseline control (rankbaseline = 0.48 > 0.5, p >
0.5; one-sided one-sample t-test). These results provide prelimi-nary evidence that neural activity during auditory speech imagerycan be used to decode spectrotemporal features of covert speech.
Modulation-based reconstructionReconstruction accuracy for the modulation-based covert speechcondition was significant in 4 out of 7 individuals (p <
0.05; Hotelling’s t-test; p > 0.1 for non-significant subjects;Figure 9B). At the population level, the overall reconstruc-tion accuracy across the three conditions (overt, covert, andbaseline control) was significantly different [F(2,18) = 62.1, p <
10−6; One-Way ANOVA]. Post-hoc t-tests confirmed that covert
Frontiers in Neuroengineering www.frontiersin.org May 2014 | Volume 7 | Article 14 | 10

Martin et al. Decoding overt and covert speech
FIGURE 10 | Covert speech reconstruction. (A) Top panel: a segment ofthe overt (spoken out loud) spectrogram representation. Bottom panel: thesame segment reconstructed from neural activity during the covertcondition using the decoding model. (B) Identification rank. Speechsegments (5 s) were extracted from the continuous spectrogram. For eachtarget segment (N = 123) a similarity score (correlation coefficient) wascomputed between the target reconstruction and each original
spectrogram in the candidate set. The similarity scores were sorted andidentification rank was quantified as the percentile rank of the correctsegment. 1.0 indicates the target reconstruction matched the correctsegment out of all candidate segments; 0.0 indicates the target was leastsimilar to the correct segment among all other candidates. (dashed lineindicates chance level = 0.5; median identification rank = 0.62; p < 0.005;randomization test).
FIGURE 11 | Overt and covert speech identification. Medianidentification rank for each subject during overt speech, covert speech, andbaseline control conditions (see section Evaluation for more details). At thegroup level, rankovert = 0.91 and rankcovert = 0.55 are significantly higherthan chance level (0.5; randomization; gray dashed line), whereasrankbaseline = 0.48 is not significantly different.
speech reconstruction accuracy was significantly lower than overtspeech reconstruction accuracy (rcovert = 0.46 < rovert = 0.66,p < 10−5; Fisher’s Z transform followed by a paired two-samplet-test), but higher than the baseline control condition (rcovert =0.46 > rbaseline = 0.42, p < 0.005; Fisher’s Z transform followedby a paired two-sample t-test).
Informative areasSignificant informative areas (map thresholded at p < 0.05;Bonferroni correction), quantified by the electrode-specificreconstruction accuracy (see section Evaluation for details) areshown in Figure 12. As observed in the overt condition, brain
areas involved in covert spectrotemporal decoding were alsoconcentrated around STG, pre-, and post-central gyri.
Anatomical differences between overt and covert informa-tive areas were assessed for significant electrodes (either overt,covert, or both conditions; p < 0.05; Bonferroni correction),using an unbalanced Two-Way ANOVA, with experimental con-dition (overt and covert speech) and anatomical region (superiortemporal gyrus, pre- and post-central gyrus) as factors. Figure 13shows significant electrodes across subject, co-registered with theTalairach brain template (Lancaster et al., 2000). The main effectof experimental condition was significant for the spectrogram-based [F(1,116) =19.6, p < 10−6] and modulation-based recon-structions [F(1,156) = 16.9, p < 10−4], indicating that the mag-nitude of reconstruction accuracy for overt speech (spectrogram:mean difference with baseline (r) = 0.06; modulation: mean dif-ference = 0.1) was higher than for covert speech (spectrogram:mean difference = 0.006; modulation: mean difference = 0.01) atthe level of single electrodes. The main effect of anatomical regionwas also significant [spectrogram: F(2, 116) = 3.22, p < 0.05, andmodulation: F(2,156) = 3.4, p < 0.05]. However, post-hoc t-testswith Bonferroni correction indicated no differences in accuracy atthe level of p = 0.05: STG (spectrogram: mean difference = 0.05;modulation: mean difference = 0.07), pre- (spectrogram: meandifference = 0.02; modulation: mean difference = 0.05), andpost-central gyrus (spectrogram: mean difference = 0.02; mod-ulation: mean difference = 0.01). The interaction between gyrusand experimental condition was significant for the modulation-based reconstruction [F(2, 156) = 3.6, p < 0.05] and marginallysignificant for the spectrogram [F(2, 116) = 2.92, p = 0.058]. Inthe modulation representation, the overt condition resulted insignificantly higher accuracy than the covert condition for theSTG (mean difference = 0.12; p < 10−5), but not for the pre-central (mean difference = 0.06; p > 0.05) or the post-centralgyrus (mean difference = 0.02; p > 0.05). This suggests that STG
Frontiers in Neuroengineering www.frontiersin.org May 2014 | Volume 7 | Article 14 | 11

Martin et al. Decoding overt and covert speech
FIGURE 12 | Covert speech informative areas. Reconstructionaccuracy correlation coefficients were computed separately foreach individual electrode and for both covert and baseline controlconditions (see section Overt Speech: Informative areas andCovert Speech: Informative areas for details). The plotted
correlation values are calculated by subtracting the correlationduring baseline control from the covert condition. The informativearea map was thresholded to p < 0.05 (Bonferroni correction)(A) Spectrogram-based reconstruction accuracy (B) modulation-basedreconstruction accuracy.
FIGURE 13 | Region of interest analysis of significant electrodes.
Significant electrodes (either overt, covert or both; p < 0.05; Bonferronicorrection) in STG, Pre- and Post-central gyrus across subjects,co-registered with the Talairach brain template (Lancaster et al., 2000), forthe spectrogram-based (A) and the modulation-based (B) reconstruction.
is the cortical area where the spectrotemporal representationsof overt and covert speech have the largest absolute differencein reconstruction accuracy. Understanding the differences in theneural representations of overt and covert speech within STG istherefore a key question toward improving the spectrotemporaldecoding accuracy of covert speech.
DISCUSSIONWe evaluated a method to reconstruct overt and covert speechfrom direct intracranial brain recordings. Our approach wasfirst to build a neural decoding model from self-generated overtspeech, and then to evaluate whether this same model couldreconstruct speech features in the covert speech condition at alevel of accuracy higher than expected by chance. This technique
provided a quantitative comparison of the similarity betweenauditory perception and imagery in terms of neural representa-tions based on acoustic frequency and modulation content. Ourresults indicated that auditory features of covert speech could bedecoded from models trained from an overt speech condition,providing evidence of a shared neural substrate for overt andcovert speech. However, comparison of reconstruction accuracyin the two conditions also revealed important differences betweenovert and covert speech spectrotemporal representation. The pre-dictive power during overt speech was higher compared to covertspeech and this difference was largest in STG sites consistent withprevious findings of a partial overlap of the two neural repre-sentations (Huang et al., 2002; Shuster and Lemieux, 2005; Gevaet al., 2011c; Pei et al., 2011). In addition, we compared the qual-ity of the reconstructions by assessing how well they could beidentified. The quality of overt speech reconstruction allowed ahighly significant identification, while in the covert speech con-dition, the identification was only marginally significant. Theseresults provide evidence that continuous features of covert speechcan be extracted and decoded from ECoG signals, providing abasis for development of a brain-based communication methodfor patients with disabling neurological conditions.
Previous research demonstrated that continuous spectrotem-poral features of auditory stimuli could be reconstructed usinga high gamma neural-based decoder (Pasley et al., 2012). In thisstudy, we analyzed auditory stimuli from self-generated speech asopposed to external auditory stimulation. During self-producedspeech, neural activity in human auditory cortex is reported tobe suppressed (Creutzfeldt et al., 1989; Flinker et al., 2010) whichhas been attributed to the effect of efference copy or corollary dis-charge sent from the motor cortex onto sensory areas (Jeannerod,2003). Despite this effect, we observed that high gamma activityin the superior temporal gyrus, pre- and post-central gyrus dur-ing vocalization was sufficient to reliably reconstruct continuousspectrotemporal auditory features of speech.
There is accumulating evidence that imagery and percep-tion share similar neural representations in overlapping corticalregions (Yetkin et al., 1995; Kosslyn and Thompson, 2000; Rosen
Frontiers in Neuroengineering www.frontiersin.org May 2014 | Volume 7 | Article 14 | 12

Martin et al. Decoding overt and covert speech
et al., 2000; Palmer et al., 2001; Aziz-Zadeh et al., 2005; Geva et al.,2011c; Cichy et al., 2012). It has been proposed that an efferencecopy is generated from the motor cortex through motor simula-tion and sent to sensory cortices enabling a comparison of actualwith desired movement and permitting online behavioral adjust-ments (Jeannerod, 2003). Similar accounts have been proposedin speech processing (Hickok, 2001; Guenther et al., 2009; Price,2011; Tian and Poeppel, 2012). Higher order brain areas inter-nally induce lower level sensory cortices activation, even in theabsence of actual motor output (covert). The anatomical resultsreported here are in agreement with these models. The relation-ship between overt and covert speech reconstruction dependedon anatomy. High gamma activity in the superior temporal gyrus,pre- and post-central gyrus provided the highest information todecode both spectrogram and modulation features of overt andcovert speech. However, the predictive power for covert speechwas weaker than for overt speech. This is in accordance withprevious research showing that the magnitude of activation wasgreater in overt than in covert speech in some perisylvian regions(Palmer et al., 2001; Pei et al., 2011; Partovi et al., 2012) possi-bly reflecting a lower signal-to-noise ratio (SNR) for HG activityduring covert speech. Future work is needed to determine the rel-ative contributions of SNR vs. differences in the underlying neuralrepresentations to account for discrepancies between overt andcovert speech reconstruction accuracy.
A key test of reconstruction accuracy is the ability to usethe reconstruction to identify specific speech utterances. At thegroup level, using covert reconstructions, identification perfor-mance was significant, but at a weaker level (p = 0.032) thanovert speech identification (p < 10−4). At the individual level,covert speech reconstruction in one subject (out of seven) wasaccurate enough to identify speech utterances better than chancelevel. This highlights the difficulty in applying a model derivedfrom overt speech data to decode covert speech. This also indi-cates that the spectrotemporal neural mechanisms of overt andcovert speech are partly different, in agreement with previous lit-erature (Aleman, 2004; Shuster and Lemieux, 2005; Basho et al.,2007; Pei et al., 2011). Despite these difficulties, it is possiblethat decoding accuracy may be improved by several factors. First,a major difficulty in this approach is the alignment of covertspeech reconstructions to a reference speech segment. Variabilityin speaking rate, pronunciation, and speech errors can result insuboptimal alignments that may be improved by better alignmentalgorithms or by more advanced automatic speech recognitiontechniques (e.g., Hidden Markov Models). Second, a better sci-entific understanding of the differences between overt and covertspeech representations may provide insight into how the decod-ing model can be improved to better model covert speech neuraldata. For example, the current study uses a simple model thatassumes the auditory representation of covert speech imagery isequivalent to that of overt speech. If systematic differences inspectrotemporal encoding can be identified during covert speech,then the spectrotemporal tuning of the decoding model can bebiased to reflect these differences in order to optimize the modelfor covert speech data. Further investigation of the differences inovert and covert spectrotemporal neural representation offers apromising avenue for improving covert speech decoding.
ACKNOWLEDGMENTWe are very grateful to Stephanie Ries for providing us valuablefeedback on earlier versions of this manuscript. This work wassupported by NIH NS21135, NS40596, K99DC012804, US ArmyResearch Office W911NF-07-1-0415 (Gerwin Schalk), W911NF-08-1-0216 (Gerwin Schalk), NIH NIBIB [EB006356 (GerwinSchalk), EB00856 (Gerwin Schalk)], the Humboldt Foundation,and the Nielsen Corporation, and SFB-TRR31 Active Hearing.
REFERENCESAleman, A. (2004). The functional neuroanatomy of metrical stress evaluation
of perceived and imagined spoken words. Cereb. Cortex 15, 221–228. doi:10.1093/cercor/bhh124
Aziz-Zadeh, L., Cattaneo, L., Rochat, M., and Rizzolatti, G. (2005). Covertspeech arrest induced by rTMS over both motor and nonmotor left hemi-sphere frontal sites. J. Cogn. Neurosci. 17, 928–938. doi: 10.1162/0898929054021157
Basho, S., Palmer, E. D., Rubio M. A., Wulfeck, B., and Müller, R.-A. (2007).Effects of generation mode in fMRI adaptations of semantic fluency:paced production and overt speech. Neuropsychologia 45, 1697–1706. doi:10.1016/j.neuropsychologia.2007.01.007
Bialek, W., Rieke, F., de Ruyter van Steveninck, R., and Warland, D. (1991). Readinga neural code. Science 252, 1854–1857. doi: 10.1126/science.2063199
Billingsley-Marshall, R., Clear, T., Mencl, W. E., Simos, P. G., Swank, P. R., Men,D., et al. (2007). A comparison of functional MRI and magnetoencephalogra-phy for receptive language mapping. J. Neurosci. Methods 161, 306–313. doi:10.1016/j.jneumeth.2006.10.020
Birk, D. (2013). Cocor: Comparing Correlations. Available online at: http://r.birkdiedenhofen.de/pckg/cocor/
Boonstra, T. W., Houweling, S., and Muskulus, M. (2009). Does asynchronous neu-ronal activity average out on a macroscopic scale? J. Neurosci. 29, 8871–8874.doi: 10.1523/JNEUROSCI.2020-09.2009
Brigham, K., and Kumar, B. V. K. (2010). “Imagined speech classification withEEG signals for silent communication: a preliminary investigation into synthetictelepathy,” in IEEE. 1–4. Available online at: http://ieeexplore.ieee.org/lpdocs/epic03/wrapper.htm?arnumber=5515807
Canolty, R. T. (2007). Spatiotemporal dynamics of word processing in the humanbrain. Front. Neurosci. 1, 185–196. doi: 10.3389/neuro.01.1.1.014.2007
Carmena, J. M., Lebedev, M. A., Crist, R. E., O’Doherty, J. E., Santucci, D. M.,Dimitrov, D. F., et al. (2003). Learning to control a brain–machine interfacefor reaching and grasping by primates. PLoS Biol. 1:e2. doi: 10.1371/jour-nal.pbio.0000042
Chi, T., Gao, Y., Guyton, M. C., Ru, P., and Shamma, S. (1999). Spectro-temporalmodulation transfer functions and speech intelligibility. J. Acoust. Soc. Am. 106,2719–2732. doi: 10.1121/1.428100
Chi, T., Ru, P., and Shamma, S. A. (2005). Multiresolution spectrotemporal analysisof complex sounds. J. Acoust. Soc. Am. 118, 887. doi: 10.1121/1.1945807
Cichy, R. M., Heinzle, J., and Haynes, J.-D. (2012). Imagery and perception sharecortical representations of content and location. Cereb. Cortex 22, 372–380. doi:10.1093/cercor/bhr106
Creutzfeldt, O., Ojemann, G., and Lettich, E. (1989). Neuronal activity in thehuman lateral temporal lobe. II. responses to the subjects own voice. Exp. BrainRes. 77, 476–489.doi: 10.1007/BF00249601
Crone, N. E., Boatman, D., Gordon, B., and Hao, L. (2001). Induced electro-corticographic gamma activity during auditory perception. Brazier award-winning article, 2001. Clin. Neurophysiol. 112, 565–582. doi: 10.1016/S1388-2457(00)00545-9
Duffau, H., Capelle, L., Denvil, D., Gatignol, P., Sichez, N., Lopes, M., et al. (2003).The role of dominant premotor cortex in language: a study using intraoper-ative functional mapping in awake patients. Neuroimage 20, 1903–1914. doi:10.1016/S1053-8119(03)00203-9
Efron, B. (1982). The Jackknife, the Bootstrap and Other Resampling Plans. Societyfor Industrial and Applied Mathematics. Available online at: http://epubs.siam.
org/doi/book/10.1137/1.9781611970319Elliott, T. M., and Theunissen, F. E. (2009). The modulation transfer function
for speech intelligibility. PLoS Comput. Biol. 5:e1000302. doi: 10.1371/jour-nal.pcbi.1000302
Frontiers in Neuroengineering www.frontiersin.org May 2014 | Volume 7 | Article 14 | 13
Martin et al. Decoding overt and covert speech
Feinberg, T. E., Gonzalez Rothi, L. J., and Heilman, K. M. (1986). “Innerspeech” in conduction aphasia. Arch. Neurol. 43, 591–593. doi: 10.1001/arch-neur.1986.00520060053017
Fiez, J. A., and Petersen, S. E. (1998). Neuroimaging studies of word reading. Proc.Natl. Acad. Sci. 95, 914–921. doi: 10.1073/pnas.95.3.914
Fisher, R. A. (1915). Frequency distribution of the values of the correlation coeffi-cient in samples from an indefinitely large population. Biometrika 10, 507. doi:10.2307/2331838
Flinker, A., Chang, E. F., Kirsch, H. E., Barbaro, N. M., Crone, N. E., and Knight, R.T. (2010). Single-trial speech suppression of auditory cortex activity in humans.J. Neurosci. 30, 16643–16650. doi: 10.1523/JNEUROSCI.1809-10.2010
Geva, C., Correia, M., and Warburton, E. A. (2011a). Diffusion tensor imagingin the study of language and aphasia. Aphasiology 25, 543–558. doi: 10.1080/02687038.2010.534803
Geva, S., Bennett, S., Warburton, E., and Patterson, K. (2011b). Discrepancybetween inner and overt speech: implications for post-stroke apha-sia and normal language processing. Aphasiology 25, 323–243. doi:10.1080/02687038.2010.511236
Geva, S., Jones, P. S., Crinion, J. T., Baron, J. C., and Warburton, E. (2011c).The neural correlates of inner speech defined by voxel-based lesion-symptommapping. Brain 134, 3071–3082. doi: 10.1093/brain/awr232
Giorgino, T. (2009). Computing and visualizing dynamic time warping align-ments in R: the Dtw package. J. Stat. Softw. 31, 1–24. Available online at:www.jstatsoft.org/v31/i07/
Guenther, F. H., Brumberg, J. S., Wright, E. J., Nieto-Castanon, A., Tourville, J. A.,Panko, M., et al. (2009). A wireless brain-machine interface for real-time speechsynthesis. PLoS ONE 4:e8218. doi: 10.1371/journal.pone.0008218
Guenther, F. H., Ghosh, S. S., and Tourville, J. A. (2006). Neural modeling andimaging of the cortical interactions underlying syllable production. Brain Lang.96, 280–301. doi: 10.1016/j.bandl.2005.06.001
Gunduz, A., Brunner, P., Daitch, A., Leuthardt, E. C., Ritaccio, A. L.,Pesaran, B., et al. (2012). Decoding covert spatial attention using electro-corticographic (ECoG) signals in humans. Neuroimage 60, 2285–2293. doi:10.1016/j.neuroimage.2012.02.017
Halpern, A. R. (1988). Mental scanning in auditory imagery for songs. J. Exp.Psychol. Learn. Mem. Cogn. 14, 434–443. doi: 10.1037//0278-7393.14.3.434
Halpern, A. R. (1989). Memory for the absolute pitch of familiar songs. Mem. Cogn.17, 572–581. doi: 10.3758/BF03197080
Halpern, A. R., Zatorre, R. J., Bouffard, M., and Johnson, J. A. (2004).Behavioral and neural correlates of perceived and imagined musical timbre.Neuropsychologia 42, 1281–1292. doi: 10.1016/j.neuropsychologia.2003.12.017
Heim, S., Opitz, B., and Friederici, A. D. (2002). Broca’s area in the human brainis involved in the selection of grammatical gender for language production:evidence from event-related functional magnetic resonance imaging. Neurosci.Lett. 328, 101–104. doi: 10.1016/S0304-3940(02)00494-9
Hickok, G. (2001). Functional anatomy of speech perception and speech pro-duction: psycholinguistic implications. J. Psycholinguist. Res. 30, 225–235. doi:10.1023/A:1010486816667
Hickok, G., and Poeppel, D. (2007). The cortical organization of speech processing.Nat. Rev. Neurosci. 8, 393–402. doi: 10.1038/nrn2113
Hinke, R. M., Hu, X., Stillman, A. E., Kim, S. G., Merkle, H., Salmi, R., et al. (1993).Functional magnetic resonance imaging of broca’s area during internal speech.Neuroreport 4, 675–678. doi: 10.1097/00001756-199306000-00018
Hochberg, L. R., Bacher, D., Jarosiewicz, B., Masse, N. Y., Simeral, J. D., Vogel,J., et al. (2012). Reach and grasp by people with tetraplegia using a neurallycontrolled robotic arm. Nature 485, 372–375. doi: 10.1038/nature11076
Hochberg, L. R., Serruya, M. D., Friehs, G. M., Mukand, J. A., Saleh, M., Caplan, A.H., et al. (2006). Neuronal ensemble control of prosthetic devices by a humanwith tetraplegia. Nature 442, 164–171. doi: 10.1038/nature04970
Hotelling, H. (1940). The selection of variates for use in prediction with somecomments on the general problem of nuisance parameters. Ann. Math. Stat. 11,271–283. doi: 10.1214/aoms/1177731867
Huang, J., Carr, T. H., and Cao, Y. (2002). Comparing cortical activations for silentand overt speech using event-related fMRI. Hum. Brain Mapp. 15, 39–53. doi:10.1002/hbm.1060
Hubbard, T. L. (2013). “Auditory aspects of auditory imagery,” in MultisensoryImagery, eds S. Lacey and R. Lawson (New York, NY: Springer NewYork), 51–76. Available online at: http://www.springerlink.com/index/10.1007/978-1-4614-5879-1_4
Intons-Peterson, M. J. (1980). The role of loudness in auditory imagery. Mem.Cogn. 8, 385–393. doi: 10.3758/BF03211134
Jeannerod, M. (2003). “Action monitoring and forward control of movements,”in The Handbook of Brain Theory and Neural Networks, 2nd Edn, ed M. Arbib(Cambridge, MA: MIT Press), 83–85.
Kaneoke, Y., Donishi, T., Iwatani, J., Ukai, S., Shinosaki, K., and Terada, M. (2012).Variance and autocorrelation of the spontaneous slow brain activity. PLoS ONE7:e38131. doi: 10.1371/journal.pone.0038131
Kay, K. N., and Gallant, J. L. (2009). I can see what you see. Nat. Neurosci. 12:245.doi: 10.1038/nn0309-245
Kay, K. N., Naselaris, T., Prenger, R. J., and Gallant, J. L. (2008). Identifyingnatural images from human brain activity. Nature 452, 352–355. doi:10.1038/nature06713
Kennedy, J. F. (1961). Inaugural Addresses of the Presidents of the United States.(Washington, DC: U.S. G.P.O., 1989). Available online at: www.bartleby.com/124/
Kosslyn, S. M. (2005). Mental images and the brain. Cogn. Neuropsychol. 22,333–347. doi: 10.1080/02643290442000130
Kosslyn, S. M., Ganis, G., and Thompson, W. L. (2001). Neural foundations ofimagery. Nat. Rev. Neurosci. 2, 635–642. doi: 10.1038/35090055
Kosslyn, S. M., and Thompson, W. L. (2000). “Shared mechanisms in visualimagery and visual perception: insights from cognitive neuroscience,” in TheNew Cognitive Neurosciences, 2nd Edn, ed M. S. Gazzaniga (Cambridge, MA:MIT Press).
Lachaux, J. P., Axmacher, N., Mormann, F., Halgren, E., and Crone, N. E. (2012).High-frequency neural activity and human cognition: past, present and pos-sible future of intracranial EEG research. Prog. Neurobiol. 98, 279–301. doi:10.1016/j.pneurobio.2012.06.008
Lancaster, J. L., Woldorff, M. G., Parsons, L. M., Liotti, M., Freitas, C.S., Rainey, L., et al. (2000). Automated talairach atlas labels for func-tional brain mapping. Hum. Brain Mapp. 10, 120–131. doi: 10.1002/1097-0193(200007)10:3%3C120::AID-HBM30%3E3.0.CO;2-8
Leuthardt, E. C., Schalk, G., Wolpaw, J. R., Ojemann, J. G., and Moran, D.W. (2004). A brain–computer interface using electrocorticographic signals inhumans. J. Neural Eng. 1, 63–71. doi: 10.1088/1741-2560/1/2/001
Llorens, A., Trébuchon, A., Liégeois-Chauvel, C., and Alario, F.-X. (2011). Intra-cranial recordings of brain activity during language production. Front. Psychol.2:375. doi: 10.3389/fpsyg.2011.00375
McGuire, P. K., Silbersweig, D. A., Murray, R. M., David, A. S., Frackowiak, R. S.,and Frith, C. D. (1996). Functional anatomy of inner speech and auditory verbalimagery. Psychol. Med. 26, 29–38. doi: 10.1017/S0033291700033699
Mesgarani, N., David, S. V., Fritz, J. B., and Shamma, S. A. (2009). Influenceof context and behavior on stimulus reconstruction from neural activity inprimary auditory cortex. J. Neurophysiol. 102, 3329–3339. doi: 10.1152/jn.91128.2008
Miller, K. J., Leuthardt, E. C., Schalk, G., Rao, R. P. N., Anderson, N. R., Moran,D. W., et al. (2007). Spectral changes in cortical surface potentials during motormovement. J. Neurosci. 27, 2424–2432. doi: 10.1523/JNEUROSCI.3886-06.2007
Mother Goose’s Nursery Rhymes. (1867). A Collection of Alphabets, Rhymes, Talesand Jingles (1877). London: George Routledge and Sons.
Naselaris, T., Kay, K. N., Nishimoto, S., and Gallant, J. L. (2011).Encoding and decoding in fMRI. Neuroimage 56, 400–410. doi:10.1016/j.neuroimage.2010.07.073
Palmer, E. D., Rosen, H. J., Ojemann, J. G., Buckner, R. L., Kelley, W. M., andPetersen, S. E. (2001). An event-related fMRI study of overt and covert wordstem completion. Neuroimage 14, 182–193. doi: 10.1006/nimg.2001.0779
Partovi, S., Konrad, F., Karimi, S., Rengier, F., Lyo, J. K., Zipp, L., et al. (2012).Effects of covert and overt paradigms in clinical language fMRI. Acad. Radiol.19, 518–525. doi: 10.1016/j.acra.2011.12.017
Pasley, B. N., David, S. V., Mesgarani, N., Flinker, A., Shamma, S. A., Crone, N.E., et al. (2012). Reconstructing speech from human auditory cortex. PLoS Biol.10:e1001251. doi: 10.1371/journal.pbio.1001251
Pei, X., Leuthardt, E. C., Gaona, C. M., Brunner, P., Wolpaw, J. R., and Schalk, G.(2011). Spatiotemporal dynamics of electrocorticographic high gamma activ-ity during overt and covert word repetition. Neuroimage 54, 2960–2972. doi:10.1016/j.neuroimage.2010.10.029
Pistohl, T., Ball, T., Schulze-Bonhage, A., Aertsen, A., and Mehring, C. (2008).Prediction of arm movement trajectories from ECoG-recordings in humans.J. Neurosci. Methods 167, 105–114. doi: 10.1016/j.jneumeth.2007.10.001
Frontiers in Neuroengineering www.frontiersin.org May 2014 | Volume 7 | Article 14 | 14

Martin et al. Decoding overt and covert speech
Pitt, M. A., and Crowder, R. G. (1992). The role of spectral and dynamic cues inimagery for musical timbre. J. Exp. Psychol. Hum Percept. Perform. 18, 728–738.doi: 10.1037//0096-1523.18.3.728
Price, C. J. (2011). A generative model of speech production in broca’s andwernicke’s areas. Front. Psychol. 2:237. doi: 10.3389/fpsyg.2011.00237
Price, C. J. (2012). A review and synthesis of the first 20years of PET and fMRIstudies of heard speech, spoken language and reading. Neuroimage 62, 816–847.doi: 10.1016/j.neuroimage.2012.04.062
Rabiner, L. R. (1993). Fundamentals of Speech Recognition. Prentice Hall SignalProcessing Series. Englewood Cliffs, NJ: PTR Prentice Hall.
Rosen, H. J., Ojemann, J. G., Ollinger, J. M., and Petersen, S. E. (2000). Comparisonof brain activation during word retrieval done silently and aloud using fMRI.Brain Cogn. 42, 201–217. doi: 10.1006/brcg.1999.1100
Roth, M., Decety, J., Raybaudi, M., Massarelli, R., Delon-Martin, C., Segebarth, C.,et al. (1996). Possible involvement of primary motor cortex in mentally simu-lated movement: a functional magnetic resonance imaging study. Neuroreport7, 1280–1284. doi: 10.1097/00001756-199605170-00012
Roy, E., and Basler, P. (1955). “The gettysburg address,” in The Collected Works ofAbraham Lincoln, ed A. Lincoln (New Brunswick, NJ: Rutgers UP), 611–612.
Sakoe, H., and Chiba, S. (1978). Dynamic programming algorithm optimiza-tion for spoken word recognition. IEEE Trans. Acoust. 26, 43–49. doi:10.1109/TASSP.1978.1163055
Schalk, G. (2010). A Practical Guide to Brain-Computer Interfacing withBCI2000: General-Purpose Software for Brain-Computer Interface Research, DataAcquisition, Stimulus Presentation, and Brain Monitoring. London, New York:Springer. doi: 10.1007/978-1-84996-092-2
Schalk, G., Kubánek, J., Miller, K. J., Anderson, N. R., Leuthardt, E. C., Ojemann,J. G., et al. (2007). Decoding two-dimensional movement trajectories usingelectrocorticographic signals in humans. J. Neural Eng. 4, 264–275. doi:10.1088/1741-2560/4/3/012
Schalk, G., McFarland, D. J., Hinterberger, T., Birbaumer, N., and Wolpaw, J. R.(2004). BCI2000: a general-purpose brain-computer interface (BCI) system.IEEE Trans. Biomed. Eng. 51, 1034–1043. doi: 10.1109/TBME.2004.827072
Shamma, S. (2003). Physiological foundations of temporal integration in theperception of speech. J. Phon. 31, 495–501. doi: 10.1016/j.wocn.2003.09.001
Shuster, L. I., and Lemieux, S. K. (2005). An fMRI investigation of covertly andovertly produced mono- and multisyllabic words. Brain Lang. 93, 20–31. doi:10.1016/j.bandl.2004.07.007
Stevenson, R. J., and Case, T. I. (2005). Olfactory imagery: a review. Psychon. Bull.Rev. 12, 244–264. doi: 10.3758/BF03196369
Tian, X., and Poeppel, D. (2012). Mental imagery of speech: linking motor andperceptual systems through internal simulation and estimation. Front. Hum.Neurosci. 6:314. doi: 10.3389/fnhum.2012.00314
Towle, V. L., Yoon, H.-A., Castelle, M., Edgar, J. C., Biassou, N. M., Frim, D. M., et al.(2008). ECoG gamma activity during a language task: differentiating expressiveand receptive speech areas. Brain 131, 2013–2027. doi: 10.1093/brain/awn147
Warland, D. K., Reinagel, P., and Meister, M. (1997). Decoding visual informationfrom a population of retinal ganglion cells. J. Neurophysiol. 78, 2336–2350.
Yetkin, F. Z., Hammeke, T. A., Swanson, S. J., Morris, G. L., Mueller, W. M.,McAuliffe, T. L., et al. (1995). A comparison of functional mr activationpatterns during silent and audible language tasks. Am. J. Neuroradiol. 16,1087–1092.
Conflict of Interest Statement: The authors declare that the research was con-ducted in the absence of any commercial or financial relationships that could beconstrued as a potential conflict of interest.
Received: 06 March 2014; paper pending published: 28 March 2014; accepted: 29 April2014; published online: 27 May 2014.Citation: Martin S, Brunner P, Holdgraf C, Heinze H-J, Crone NE, Rieger J, Schalk G,Knight RT and Pasley BN (2014) Decoding spectrotemporal features of overt and covertspeech from the human cortex. Front. Neuroeng. 7:14. doi: 10.3389/fneng.2014.00014This article was submitted to the journal Frontiers in Neuroengineering.Copyright © 2014 Martin, Brunner, Holdgraf, Heinze, Crone, Rieger, Schalk, Knightand Pasley. This is an open-access article distributed under the terms of the CreativeCommons Attribution License (CC BY). The use, distribution or reproduction in otherforums is permitted, provided the original author(s) or licensor are credited and thatthe original publication in this journal is cited, in accordance with accepted academicpractice. No use, distribution or reproduction is permitted which does not comply withthese terms.
Frontiers in Neuroengineering www.frontiersin.org May 2014 | Volume 7 | Article 14 | 15