Embed Size (px)
Citation preview
Working Paper WP 2015-323
Project #: R-UM15-07
Declining Wealth and Work among Male Veterans in the Health and Retirement Study
Alan Gustman, Thomas Steinmeier, and Nahid Tabatabai

Declining Wealth and Work among Male Veterans in the Health and Retirement Study
Alan Gustman Dartmouth College
Thomas Steinmeier Texas Tech University
Nahid Tabatabai Dartmouth College
September 2015
Michigan Retirement Research Center University of Michigan
P.O. Box 1248 Ann Arbor, MI 48104
www.mrrc.isr.umich.edu (734) 615-0422
Acknowledgements The research reported herein was performed pursuant to a grant from the U.S. Social Security Administration (SSA) funded as part of the Retirement Research Consortium through the University of Michigan Retirement Research Center (5 RRC08098401-07). The opinions and conclusions expressed are solely those of the author(s) and do not represent the opinions or policy of SSA or any agency of the Federal Government. Neither the United States Government nor any agency thereof, nor any of their employees, makes any warranty, express or implied, or assumes any legal liability or responsibility for the accuracy, completeness, or usefulness of the contents of this report. Reference herein to any specific commercial product, process or service by trade name, trademark, manufacturer, or otherwise does not necessarily constitute or imply endorsement, recommendation or favoring by the United States Government or any agency thereof.
Regents of the University of Michigan Michael J. Behm, Grand Blanc; Mark J. Bernstein, Ann Arbor; Laurence B. Deitch, Bloomfield Hills; Shauna Ryder Diggs, Grosse Pointe; Denise Ilitch, Bingham Farms; Andrea Fischer Newman, Ann Arbor; Andrew C. Richner, Grosse Pointe Park; Katherine E. White, Ann Arbor; Mark S. Schlissel, ex officio

Declining Wealth and Work among Male Veterans in the Health and Retirement Study
Abstract
The composition, wealth and employment of male veterans and nonveterans are analyzed for four cohorts from the Health and Retirement Study, ages 51 to 56 in 1992, 1998, 2004 and 2010. Half of the two oldest cohorts served in the military. Only 16 percent of the youngest cohort, the only cohort subject to the All-Volunteer Military, served. One fifth to one third of the members of each cohort who served saw combat, mainly in Viet Nam and in the First Gulf War. Among those 51 to 56 in 1992, veterans were better educated, healthier, wealthier, and more likely to be working than nonveterans. By 2010, 51 to 56 year old veterans had lost their educational advantage, were less healthy, less wealthy and less likely to be working than nonveterans. After standardizing in multiple regressions for the influence of major observable characteristics, for the original 1992 HRS cohort the wealth of veterans is no longer higher than the wealth of nonveterans. In contrast, the wealth of veterans from the youngest cohort, those 51 to 56 in 2010, remains about 10 to 13 percent below the wealth of nonveterans from that cohort. There also is a decline from older to younger cohorts of veterans compared to nonveterans in the probability of being not retired, of working more than 35 hours per week, and in the likelihood of holding a job for more than 10 years. Comparisons are made within the group of veterans by years of service, officer rank and other covariates.
Citation
Gustman, Alan L., Thomas Steinmeier, and Nahid Tabatabai. 2015 "Declining Wealth and Work among Male Veterans in the Health and Retirement Study." Ann Arbor, MI. University of Michigan Retirement Research Center (MRRC) Working Paper, WP 2015-323. http://www.mrrc.isr.umich.edu/publications/papers/pdf/wp323.pdf
Authors’ Acknowledgements
This work was supported by a grant from the Social Security Administration through the Michigan Retirement Research Center (UM15-07) to the NBER with a subcontract to Dartmouth College. The title of the original project is “Social Security and Pensions in Veterans’ Wealth and Retirement”. The findings and conclusions expressed are solely those of the authors and do not represent the views of the Social Security Administration, any agency of the Federal government, the Michigan Retirement Research Center or the NBER. We would like to thank Beth Asch and participants at a seminar held at the Social Security Administration for helpful comments.

1
I. Introduction
There has been considerable debate and indecision about veterans’ retirement benefits. For example,
after first deciding to reduce the benefits of younger, early military retirees, Congress then reversed
itself in February, 2014. Proposals for changing military pensions remain on the table. For example, the
report of the Military Compensation Commission (2015) proposes reducing the basic defined benefit
pension for those who served twenty or more years in the military, while introducing a 401(k) type plan
with employer matching that would vest after two years.
Veterans’ benefits are shaped by conflicting concerns. On the one hand, there is enormous gratitude
for the service and sacrifice of military veterans. On the other hand, cost considerations have led to
continuing pressures to reduce veterans’ benefits. Concerns about shaping military turnover have also
played a role. Thus long serving veterans receive pensions; those who were disabled as a result of their
military service receive special benefits; those from older cohorts receive special credits toward their
Social Security for time spent in the military, and military pensions are indexed. Yet at the same time
these programs also have unusual features not normally found in private sector pensions that are
designed to reduce military pensions, such as twenty year vesting.1
A central policy concern is how well prepared veterans are for retirement. Paradoxically, however,
there is little evidence on the wealth of veterans nearing retirement, and how their preparation for
retirement compares to nonveterans. One reason is that evidence based on administrative data from the
Department of Defense paints only a partial picture of veterans’ preparation for retirement.
Administrative data typically pertains only to the individual veteran, rather than to the veteran’s
household. Yet wealth is determined at the household level. Moreover, studies of military pensions and
their adequacy often ignore many assets beside military pensions, e.g., Social Security, private pensions
1 For a description of veterans’ pensions, see Congressional Budget Office (2012, pp. 22-24.). For a description of Social Security benefits for veterans, see Social Security Administration (2013).

2
and housing. Moreover, data on veterans should be placed in perspective. Yet administrative data often
pertain only to veterans, so that resulting policy studies have difficulty in comparing outcomes to those
for nonveterans.2
2 One of the few comprehensive studies is presented by Fitzgerald (2006), who examines the relation of time spent in the military to wealth accumulated by men in the first wave of the Health and Retirement Study. Unfortunately, he does not include pensions or Social Security in his calculation of wealth.
Our aim is to help fill the gaps in information on the economic status of veterans as they approach
retirement. We examine the differences in wealth between veterans and nonveterans who are nearing
retirement, consider trends in these differences, and discuss some of the reasons for these differences.
After examining demographic, educational, health, disability and service related differences between
veterans and nonveterans, we relate these measures to the course of differences in preretirement wealth.
We also analyze differences in wealth within the veterans group, as well as work and retirement for
members of different cohorts.
Our analysis suggests there has been a decline in the relative status of veterans over time. Findings
are based on four cohorts from the Health and Retirement Study (HRS), all ages 51 to 56 in the baseline
year the cohort entered the survey. In the original HRS cohort, veterans ages 51 to 56 in 1992 were
better educated, healthier, wealthier, and more likely to be working than nonveterans. By 2010 veterans
had lost their educational advantage, were less healthy, less wealthy and less likely to be working at ages
51 to 56 than nonveterans.
There are two main reasons for the decline in the status of veterans who are nearing retirement. First,
there is a major change in the composition of the veterans group. Many fewer males in the younger
cohorts are veterans. The share of males who had served in the military has fallen from half of the older
cohorts, to 16 percent of those 51 to 56 in 2010. Along with the decline in the share of the cohort who
served, the selection of new members has changed greatly over time. Most notably, the all-volunteer
military replaced the draft. But even within the oldest three cohorts, all subject to the draft, the

3
likelihood of exemption from service increased as the share of the cohort required by the military
declined. This has been accompanied by major changes in the characteristics of veterans, characteristics
that are associated with earnings.
Second, there are many changes in retirement programs over time. These affect comparisons of
wealth and retirement between veterans and nonveterans in different cohorts. Finally, members of
different cohorts had different economic experiences over their lifetimes.
In measuring the wealth of those approaching retirement age, it is very important to include both
Social Security and pensions. Together they account for half or more of the total wealth of near retirees
(Gustman, Steinmeier and Tabatabai, 2010). The Health and Retirement Study provides a unique
opportunity to study the Social Security and pension benefits received by former members of the
military at retirement, and to determine the influence of changes in these retirement benefits on the total
wealth accumulated by veterans and nonveterans as they approach retirement. We use Social Security
earnings histories and respondent reports of expected pension benefits from the HRS to create a
comprehensive measure of the retirement wealth of near retirees. These data include credits toward
Social Security benefits earned while in the military.
The four HRS cohorts included in our study are: the original HRS cohort, born from 1936 to 1941
who entered the HRS in 1992; the War Baby cohort, born from 1942 to 1947, who entered the HRS in
1998; the Early Boomer cohort, born from 1948 to 1953, who were first interviewed by the HRS in
2004; and the Mid Boomer cohort, born from 1954 to 1959, who entered the HRS in 2010. These four
cohorts include veterans of Vietnam and the Gulf War, as well as many veterans who did not see
combat.
Section II of the paper describes changes in the characteristics and service histories of the veteran
and nonveteran populations among cohorts. Differences between veterans and nonveterans in wealth and
4
its components are described for each of the cohorts in Section III. Section IV reports regressions for
wealth that standardize for the effects of observable demographic characteristics. Section V discusses
differences in retirement and other labor market outcomes between veterans and nonveterans in each of
the HRS cohorts. Section VI concludes.
II. Characteristics and service histories of the veteran and nonveteran populations over time.
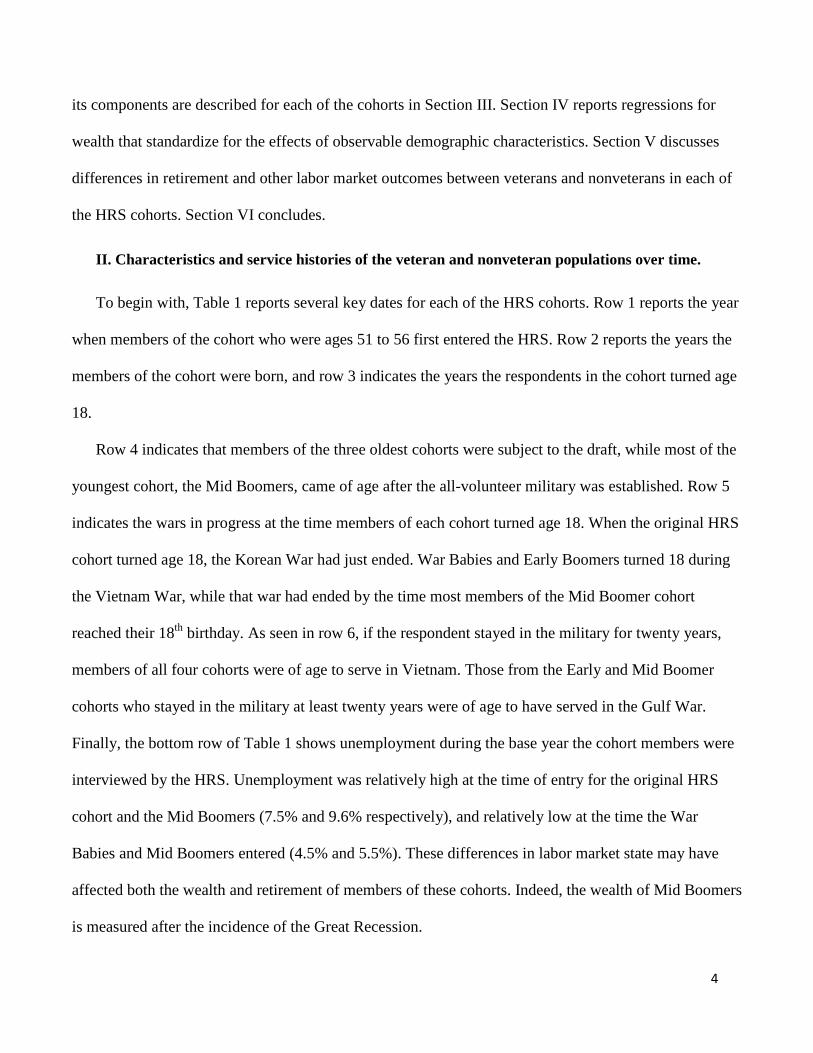
To begin with, Table 1 reports several key dates for each of the HRS cohorts. Row 1 reports the year
when members of the cohort who were ages 51 to 56 first entered the HRS. Row 2 reports the years the
members of the cohort were born, and row 3 indicates the years the respondents in the cohort turned age
18.
Row 4 indicates that members of the three oldest cohorts were subject to the draft, while most of the
youngest cohort, the Mid Boomers, came of age after the all-volunteer military was established. Row 5
indicates the wars in progress at the time members of each cohort turned age 18. When the original HRS
cohort turned age 18, the Korean War had just ended. War Babies and Early Boomers turned 18 during
the Vietnam War, while that war had ended by the time most members of the Mid Boomer cohort
reached their 18th birthday. As seen in row 6, if the respondent stayed in the military for twenty years,
members of all four cohorts were of age to serve in Vietnam. Those from the Early and Mid Boomer
cohorts who stayed in the military at least twenty years were of age to have served in the Gulf War.
Finally, the bottom row of Table 1 shows unemployment during the base year the cohort members were
interviewed by the HRS. Unemployment was relatively high at the time of entry for the original HRS
cohort and the Mid Boomers (7.5% and 9.6% respectively), and relatively low at the time the War
Babies and Mid Boomers entered (4.5% and 5.5%). These differences in labor market state may have
affected both the wealth and retirement of members of these cohorts. Indeed, the wealth of Mid Boomers
is measured after the incidence of the Great Recession.
5
Table 1: HRS Cohorts Included in the Study
Original HRS Cohort War Babies Early Boomers Mid Boomers
Year when age 51 to 56 1992 1998 2004 2010 Year Born 1936-1941 1942-1947 1948-1953 1954-1959 Year Age 18 1954-1959 1960-1965 1966-1971 1972-1977 Draft Yes Yes Yes Volunteer Army began
1973 Conflict at age 18 Just after Korea
(1950-1953) Vietnam (1960-1973) Vietnam (1960-1973) Vietnam (1960-1973)
Conflict if stayed in military 20 years
Vietnam Vietnam Vietnam Gulf War (1990-1991)
Vietnam and First Gulf War (1990-1991)
Unemployment in Base Year
7.5% 4.5% 5.5% 9.6%

6
Table 2: Military History of Males in the HRS Cohorts
Original HRS Born 1936-41
War Babies Born 1942-47
Early Boomers Born 1948-53
Mid Boomers Born 1954-1959
1. Percent Veterans Who Are Female 2% 1% 3% 12%
Males 2. Percent Ever Served 50 48 29 16
3. Percent Length of Service < 10 Years 92 93 92 87
4. Percent Length of Service 10-19 Years 2 2 3 7
5. Percent Length of Service 20 or More Years
6 5 5 6
6. Percent Combat Veterans* 18 34 33 18
7. Percent Veterans Who Were Officers** 6 7 8 10
8. Total Number of Males in Military 1145 466 363 270
* The information is provided in the 2008 and 2010 surveys and also in the ‘left behind’ questionnaire in the 2006, 2008 and 2010 survey years. Members of earlier cohorts who were not interviewed in those three survey years are missing this information. For example, in 1992, only 775 cases out of 1185 were asked the question. 141 of them reported having fired a weapon in combat. ** The rank question is asked only in the 2008 and 2010 surveys. Members of earlier cohorts who were not interviewed in the 2008 or 2010 survey years are missing this information.

7
Next we consider the service histories of the male veterans in the four HRS cohorts. Throughout this
paper, the sample is restricted to males who were 51 to 56 in the base year they were first included in the
HRS. We focus on males because there are very few female veterans in the HRS cohorts to analyze.
This can be seen in the first row of Table 2. Only 1 to 3 percent of the veterans in the three oldest
cohorts were women. Twelve percent of the members of the military from the Mid Boomer cohort were
women.
From row 2 of Table 2, roughly half the males in the Original HRS and War Baby cohorts served in
the military. The decline in the share of males with military experience began before the abolition of the
draft, with 29 percent of males from the Early Boomer cohort having served. After the draft lottery was
instituted in December of 1969, the number drafted declined sharply.3 Once the all-volunteer military
was instituted, only 16 percent of the Mid Boomers served.
3 The size of the draft for members of the Early Boomer cohort by year is as follows:
Number drafted Year 1967 228,263 1968 296,406 1969 283,586 1970 162,746 1971 94,092 1972 49,514
Source: http://www.landscaper.net/draft70-72.htm#Induction Statistics By 1973, 646 individuals were drafted.
Major shifts in the share of the population serving could generate differences in both self-selection
into the military and in screening by the military. As a result, both the observable and unobservable
characteristics of veterans and nonveterans may differ among cohorts.
Using descriptive data and adjusting for differences in observables, Angrist (1990) finds that
Vietnam era war veterans had lower earnings than nonveterans. This conclusion was not changed when
he instrumented for unobservables related to the draft lottery, which affected the selection of some of
those who served in Vietnam. Among those subject to the lottery, white Vietnam era veterans had lower

8
earnings than nonveterans. However, there were no differences between nonwhite veterans and
nonveterans. Angrist attributes his findings to the lower labor market experience of veterans.
In view of the finding of lower earnings for Vietnam veterans, Angrist and Krueger (1994) tried to
explain why World War II veterans had higher earnings than nonveterans. They found they could
explain these earnings differences by observable and unobservable differences between veterans and
nonveterans. Indeed, after adjusting for these differences, World War II veterans had lower earnings
than similar nonveterans.
In a follow up study aimed at isolating the effects of voluntary military service, Angrist (1998)
examined earnings of veterans vs. nonveterans in the 1980s. In one approach, he compared applicants
who entered the military to applicants who did not. In another approach, he instrumented on the basis of
scores on exams given to military applicants during a short period in which the test scores were
misnormed. Angrist concluded that military service led to lower civilian earnings for white veterans and
to a modest increase in the civilian earnings of nonwhite veterans.
Unfortunately, we are not in a position to instrument for unobservables associated with changes over
time in the selection criteria into the military. There are major differences among HRS cohorts in criteria
used for selection into the military. These differences mean there is no consistent set of instruments
available to adjust for unobservable dimensions of quality. The draft lottery, instituted in 1969 and used
by Angrist to construct an instrument for unobservable characteristics of veterans is relevant for
members of the Early Boomer cohort. But members of the War Baby cohort and the original HRS cohort
were subject to draft boards with criteria that varied over time and place. The Mid Boomers were, for the
most part, not subject to the draft at all.
Without a consistent set of instruments to use across these cohorts, we cannot distinguish the effects
of unobservables from the effects of military service per se. However, there is some evidence from
9
Nelson (1986) of mismanagement during the early years of the All-Volunteer Force, from about 1976 to
1980, that might account for a decline in unmeasured indicators of potential productivity of recruits.
Military pay was not at the competitive levels envisioned at the beginning of the All-Volunteer force.
Moreover, the Armed Forces Qualification Test (AFQT) was badly misnormed. As a consequence, the
fraction of recruits who were both high school graduates and had an Armed Forces Qualification Test
(AFQT) score above the fiftieth percentile fell substantially in this period. For example, Nelson (1986,
Table 5.8) finds that the percent of Army recruits in the top half of the AFQT fell from 89 percent in
1976 to 59 percent, 61 percent, 54 percent and 50 percent in 1977-1980, the prime years for Mid
Boomers to have entered the military.
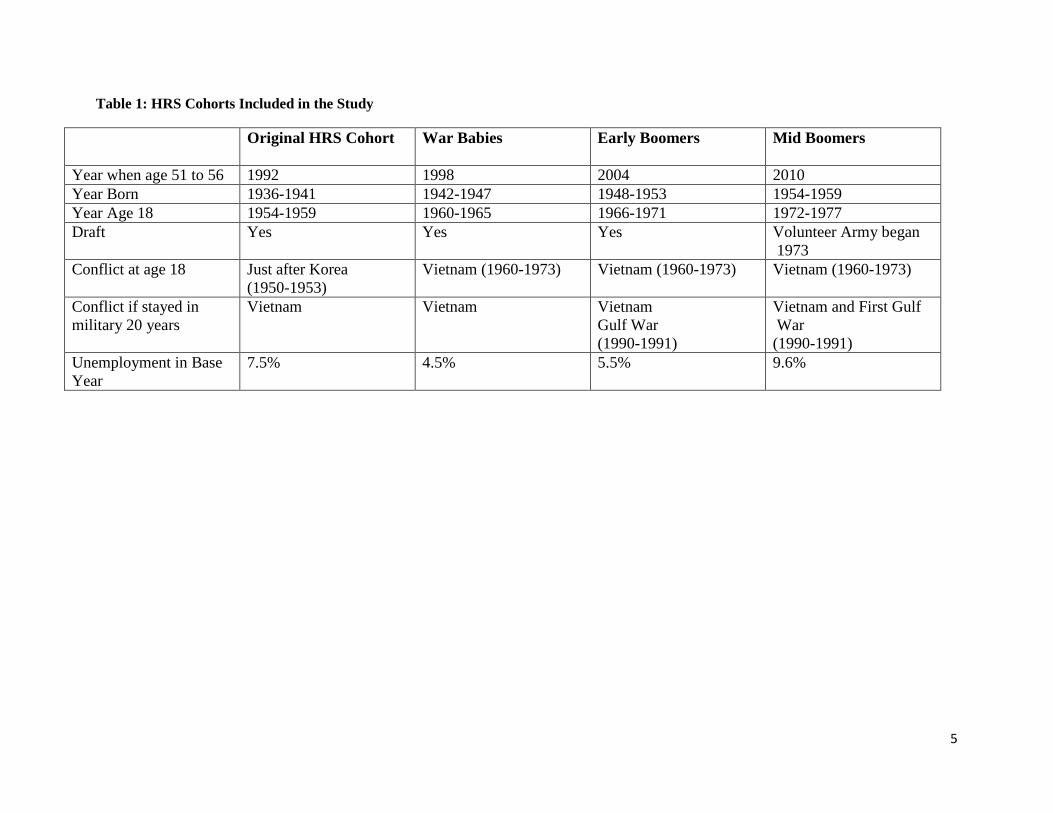
Turn again to Table 2 and consider the longest spell of military service by men in each HRS cohort.
Looking across row 3, 92 to 93 percent of the members of the three oldest cohorts served less than ten
years in the military. For the Mid Boomers, 87 percent served less than a decade. From row 5, notice
that whatever the cohort, only 5 or 6 percent of male veterans served a spell of twenty or more years, the
amount of service typically associated with eligibility for a retirement pension from the military. This
suggests that the economic position of most veterans will not be influenced by military pensions alone.
Row 6 of Table 2 suggests that just over one third of veterans from the War Baby and Early Boomer
cohorts experienced combat. Fewer than one fifth of the veterans from the Original HRS cohort, and a
similar fraction of the Mid Boomers, experienced combat. As seen in row 7, the fraction who were
officers increased from six or seven percent of the oldest cohorts to 10 percent of the Mid Boomers.

10
Table 3: Education, Demographic Characteristics, Health and Disability of Male Veterans and Nonveterans in Four HRS Cohorts
Original HRS Born 1936-41
War Babies Born 1942-47
Early Boomers Born 1948-53
Mid Boomers Born 1954-59
Education 1. Mean Years of Education Veterans
13.2 13.7 13.6 13.4
2. Mean Years of Education Nonveterans
12.2 12.9 13.8 13.5
3. Percent Some College Veterans
51 58 67 57
4. Percent Some College Nonveterans
39 49 65 58
Marital Status 5. Percent Veterans Married
79 80 74 63
6. Percent Nonveterans Married
79 77 77 72
Race 7. Percent Veterans Nonwhite
13 13 20 29
8. Percent Nonveterans Nonwhite
25 24 23 25
Health Status 9. Percent Veterans in Fair or Poor Health
13 17 25 27
10. Percent Nonveterans in Fair or Poor Health
19 21 20 21
11. Percent Veterans with Health Problem Limiting Work
17 16 20 33
12. Percent Non-veterans with Health Problem Limiting Work
17 18 17 17
13. Percent Veterans SSDI/SSI
5 9 9 18
14. Percent Nonveterans SSDI/SSI
6 7 7 8
15. Number of Males Who Served in the Military
1145 466 363 270
16. Number of Males Who Did Not Serve
1281 519 885 1394

11
Table 3 compares education, demographic characteristics, health and disability status of veterans and
nonveterans from the four cohorts. From rows 1 and 2, column 1, in the oldest cohort, veterans had one
more full-year of schooling than nonveterans, 13.2 vs. 12.2 years. Over the eighteen year period between
the entry of the original HRS cohort and the entry of the Mid Boomer cohort into the HRS, the education
of veterans grew much more slowly than that of nonveterans. The relative growth of education for
nonveterans was rapid enough to close the gap between veterans and nonveterans by the time of the Mid
Boomer cohort, with 13.4 years of schooling for veterans and 13.5 years for nonveterans. There is a
similar closing of the gap when we compare the percentages of veterans and nonveterans with at least
some college. In the original HRS cohort, the fraction of veterans with at least some college exceeded
the fraction of nonveterans by 12 percentage points. Once again, between the oldest and youngest
cohorts, the percentage of nonveterans with at least some college grew much more rapidly than the
percent of veterans with some college. The percentage of nonveterans with at least some college
increased from 39 percent in the Original HRS cohort to 58 percent for the Mid Boomers. In the case of
veterans, the comparable increase was from 51 to 57 percent. Thus in the Mid Boomer cohort, there was
virtually no difference in the fractions of veterans and nonveterans with at least some college. The
substantial gap in education in favor of veterans in the original HRS cohort disappeared entirely by the
time the Mid Boomers entered the HRS.
Consider next the differences in the probability of being married. There was no difference in the
probability of being married between veterans and nonveterans in the original HRS cohort (79 percent).
By the Mid Boomer cohort, veterans were nine percentage points less likely to be married than
nonveterans (63 vs. 72 percent), a difference that will be of importance in explaining the course of
household wealth.

12
The racial composition of veterans has also changed sharply relative to the nonveteran population.
As seen in row 7 of Table 3, in the original HRS cohort, 13 percent of veterans and 25 percent of
nonveterans were nonwhite. By the Mid Boomer cohort, 29 percent of veterans and 25 percent of
nonveterans were nonwhite.
Consider next the relative health of veterans and nonveterans in the oldest and youngest cohorts. We
begin with the oldest cohort using three different measures of health status: those reporting they were in
fair or poor health (13 percent of veterans and 19 percent of nonveterans); the percent reporting a health
problem that limited their work (17 percent of veterans and nonveterans); and the percent on or having
applied to SSDI or SSI (5 percent of veterans and 6 percent of nonveterans). While in the original HRS
cohort, veterans were healthier than nonveterans, between the oldest and youngest cohorts, the health
status of veterans age 51 to 56 deteriorated sharply relative to nonveterans. By the time the Mid Boomer
cohort was interviewed by the HRS in 2010, the share of veterans reporting fair or poor health exceeded
the share of nonveterans (27 to 21 percent)4; the share of veterans reporting health problems limiting
work exceeded the share of nonveterans (33 percent to 17 percent); and the share of veterans on (or who
applied for) SSDI or SSI exceeded the share of nonveterans (18 percent to 8 percent).5
4 Wilmoth, London and Parker (2010) report different later life health trajectories for veterans and nonveterans, and for veterans of Vietnam compared to veterans from other conflicts. 5 Coile, Duggan and Guo (2015) find a decline in the labor force participation rate of veterans that coincides with the growth of the Veteran’s Disability Compensation program. They also find that veterans have become more sensitive to economic shocks than nonveterans as the DC program has grown. Autor et al. (2015) report a 5 percent enrollment increase in the Veterans’ Disability Compensation program by veterans who had served in-theater in Vietnam and were diagnosed with diabetes. They conclude that the 2001 Agent Orange decision reduced labor force participation by 18 percent among eligible veterans who enrolled in the program.
As we have seen above, there is a large change in the racial composition of the military between the
oldest and youngest cohort. Indeed, this change is evident when comparing the members of the original
HRS cohort with members of the Early Boomer cohort, a cohort that reached military service age before

13
the advent of the all-volunteer military. The change in racial composition is even larger with the advent
of the All-Volunteer force. Given these large changes in the racial composition of the military, it is
useful to ask how changes in education and health differed within racial groups of veterans and
nonveterans.
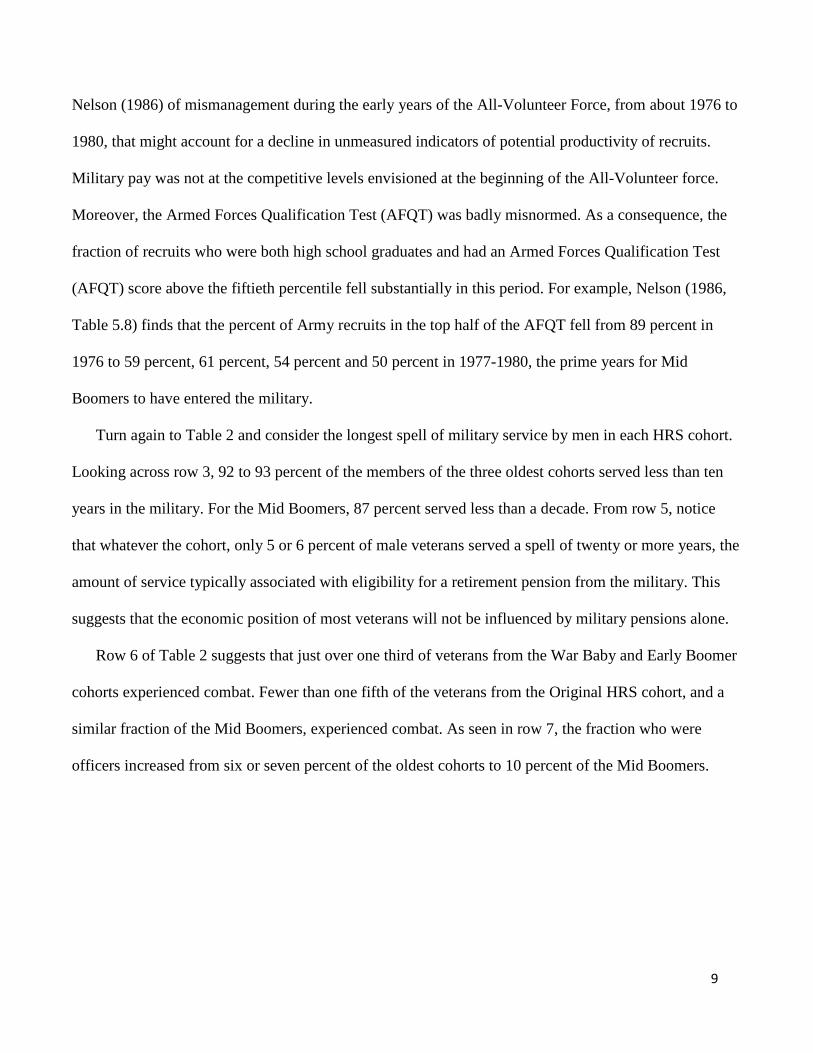
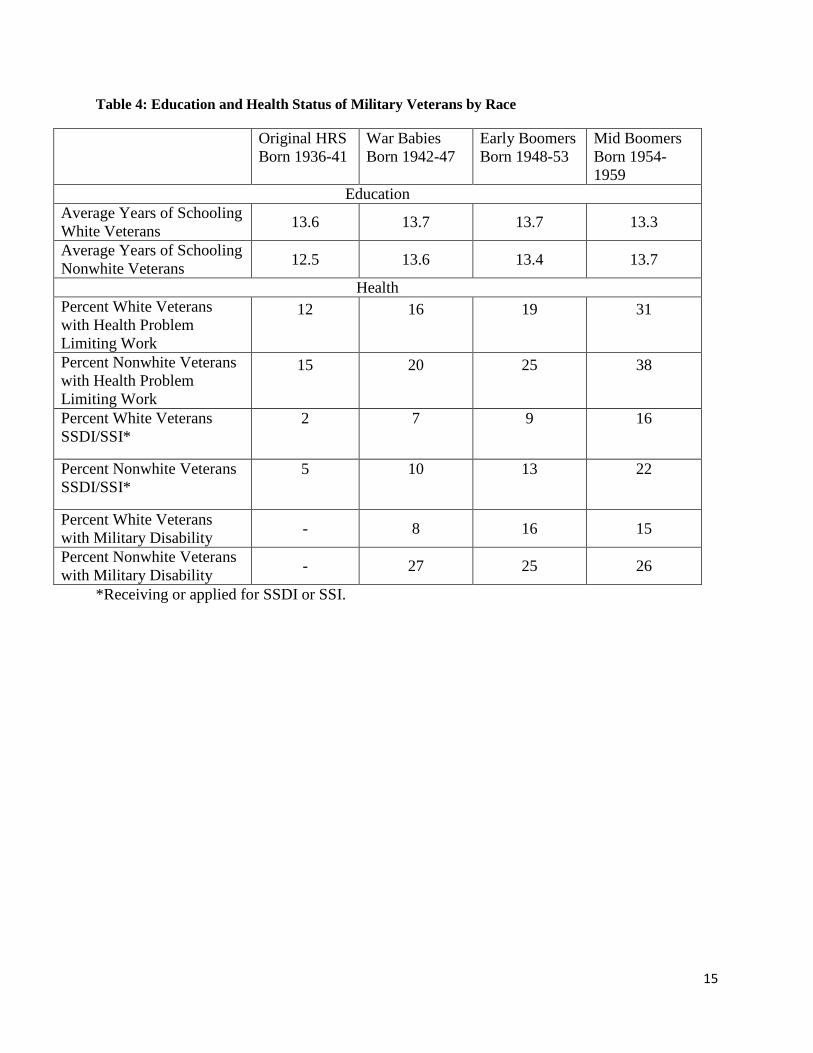
Table 4 shows the changes in education and health among cohorts, by race. As seen in the first two
rows, between the original HRS cohort and the Mid Boomers, average years of schooling decreased
modestly for white veterans, from 13.6 to 13.3 years. In contrast, for nonwhite veterans, average years of
schooling increased from 12.5 to 13.7 years.
Regarding health, in the base year of the original HRS cohort, nonwhite veterans were less healthy
than white veterans. The proportionate gap was roughly the same in the Mid Boomer cohort.
In sum, over time, compared to nonveterans, male veterans in younger cohorts have become less
likely to be married, more racially diverse, no longer better educated, and less healthy. The ratios of
each of the outcomes for veterans compared to nonveterans are summarized in Figure 1. In that figure, if
the characteristics of veterans and nonveterans were equal, the ratios would fall along the horizontal line
at 1.0. The widening dispersion over time is most noticeable for the health related measures. Notice that
the differences in health limitations on work and in participation in disability programs between veterans
and nonveterans within the Mid Boomer cohort, widen to around a 2 to 1 ratio. That is, by the Mid
Boomer cohort, adverse health is twice as likely among veterans as it is among nonveterans.
III. Wealth and its components by veteran status and major covariates.
With an increased understanding of the changing composition of veterans and nonveterans
among cohorts, we now turn to the wealth data from the HRS. Once again the sample includes only
males who were ages 51 to 56 in the year their cohort entered the HRS. The sample is then divided

14
into those who were veterans and those who were not. Observations are weighted using the
individual weights for male respondents included in the tables.
A prime area of emphasis, one that is central to our work, is on Social Security and pension
wealth. We are interested in Social Security and pension wealth at two levels. First, we identify the
total value of Social Security earned by veterans, and the total value of their pensions, and compare
those totals with the pensions and Social Security benefits earned by nonveterans. Although we
would like to also report the values of all pensions resulting from military service, we can only
identify those pensions associated with a single spell of at least twenty years of active service in the
military. This measure omits pensions resulting from noncontiguous periods of service and pensions
resulting from service in the reserves. Moreover, the sample of male veterans age 51 to 56 who
report at least twenty years of continuous service in the HRS is quite small: 66 respondents to the
1992 survey, 14 to the 1998 survey, 11 respondents to the 2004 survey, and 12 respondents to the
2010 survey.
Second, we are interested in the total wealth of households as they enter retirement. We wish to
know how households with a veteran are faring relative to households with no veteran. For that
purpose, we include the total values of Social Security earned by both spouses, and similarly the
total values of all household pensions. Here, the values of housing, liquid and other household assets
are all added to the household’s total Social Security and pension wealth. With the exception of
pension and Social Security wealth measures, which we estimate ourselves, the other components of
total wealth are taken from files created by Rand for the HRS (2015).
A veteran household is defined as a household with at least one member who is a male veteran
age 51 to 56 in the base year. Nonveteran households are defined similarly. All dollar figures are
reported in 2010 dollars.
15
Table 4: Education and Health Status of Military Veterans by Race
Original HRS Born 1936-41
War Babies Born 1942-47
Early Boomers Born 1948-53
Mid Boomers Born 1954-1959
Education Average Years of Schooling White Veterans 13.6 13.7 13.7 13.3
Average Years of Schooling Nonwhite Veterans 12.5 13.6 13.4 13.7
Health Percent White Veterans with Health Problem Limiting Work
12 16 19 31
Percent Nonwhite Veterans with Health Problem Limiting Work
15 20 25 38
Percent White Veterans SSDI/SSI*
2 7 9 16
Percent Nonwhite Veterans SSDI/SSI*
5 10 13 22
Percent White Veterans with Military Disability - 8 16 15
Percent Nonwhite Veterans with Military Disability - 27 25 26
*Receiving or applied for SSDI or SSI.

16
Figure 1: Ratios of Characteristics of Male Veterans/Non Veterans by HRS Cohort
0.0
0.5
1.0
1.5
2.0
2.5
Oringinal HRS 1992War Babies 1998Early Boomers 2004Mid Boomers 2010

17
We begin by considering Social Security and pension values resulting from the male
respondent’s own work and compare them between veterans and nonveterans. Social Security wealth
is calculated using the Social Security Administration’s ANYPIA program. Inputs into the
calculation of PIA and own benefits include the individual’s covered worker history, employment in
and pensions earned from uncovered work, and the dates of military service, the latter required for
special Social Security benefit adjustments for military. Social Security benefits resulting from the
individual’s own covered work also include any spouse and survivor benefits accruing to the male’s
spouse. Own Social Security benefits accruing to the spouse from her own work are not included
here, nor are spouse or survivor benefits accruing to the male from his wife’s work. But they are
included when we compare total wealth between veteran and nonveteran households.
Table 5 reports Social Security and pension related outcomes for members of each cohort. Note that
certain program rules have changed over time, differentially affecting veterans and nonveterans within
cohorts. For example, before 1956, the military was not included in Social Security while civilians were.
From 1957 on those on active duty were covered by Social Security. In addition, from 1957 to 2001,
those on active military service were credited with up to an additional $1,200 in covered earnings. Since
1988, inactive duty service has also been covered.6
6 Other changes affect the availability of disability benefits. There are two types of service related disability benefits for veterans, one from the Veterans Administration, the other from the Department of Defense. Recently, there have been changes in how these disability benefits are offset against military pensions. Before 2004, disability pensions were fully offset against pension payments. That offset was abolished through CRDP (Concurrent Retirement Disability Pay) in 2004 for those who had a high enough disability rating. In 2009, CRSC (Combat Related Special Compensation) abolished the offset for those wounded in combat, so that a person could receive the sum of their military pension and disability benefits. These changes, together with increasing efforts to recognize the effects of agent orange, have increased the incentive for veterans to claim disability benefits. Other changes in military compensation have been instituted over time. For example, those who stay until retirement now receive enhanced retiree health benefits that were not available to members of older cohorts.

18
Table 5: Primary Insurance Amounts (PIAs), Present Value of Social Security Benefits, and Pension Values, for Male Veterans and Nonveterans from Households with a Member Age 51 to 56 when the Cohort Entered the HRS (weighted) in thousands of 2010 dollars.
Original HRS
Born 1936-41 War Babies Born 1942-47
Early Boomers Born 1948-53
Mid Boomers Born 1954-1959
Veterans’ Social Security and Pension Benefits ($000) R’s PIA – at expected age of receiving benefits 16 19 18 19
PV of SS benefits generated by the R 176 217 239 214
Present value of all pensions due to R’s work.
182 188 145 111
Present value of pensions identified from continuous military service (values are averages for those with military pensions)
681 (66)*
763 (16)
447 (12)
373 (13)
PV of all non-military pensions for those with 20 or more years of service
54 (66)
42 (16)
23 (12)
61 (13)
PV of all nonzero non-military pensions for those with less than 20 years of service
212 (723)
237 (313)
221 (211)
181 (124)
Number of Observations
1,139 466 363 270
Nonveterans’ Social Security and Pension Benefits ($000) R’s PIA – at expected age of receiving benefits 15 18 19 23
PV of SS benefits generated by the R 165 206 249 257
Present value of all pensions due to R’s work
120
133
145
112
PV of all nonzero pensions due to R’s work
200 (735)
219 (310)
236 (524)
199 (681)
Number of Observations
1,274 519 885 1,394
*Number of observations matched with a pension job.

19
The first two rows of each section of Table 5 report Social Security values in 2010 dollars.7 These
include, respectively, the respondent’s Primary Insurance Amount (PIA) expressed on an annual basis,
and the present value of his expected benefits as of the base year, including spouse and survivor benefits
generated by the male respondent.8 The top section reports results for veterans, the bottom section for
nonveterans.
Compare the first row of each panel. From columns 1 and 2, the Primary Insurance Amounts for
veterans from the two oldest cohorts exceed the PIAs of nonveterans by about $1,000. The relationship
reverses for Early Boomers, where the PIA of nonveterans exceeds the PIA of veterans by about $1,000.
By the 2010 cohort of Mid Boomers, the PIA for veterans is $4,000 below the PIA for nonveterans, a
difference of over twenty percent.
Turning to row 2 of each panel in Table 5, for the Original HRS cohort and the War Babies, the
present value of Social Security benefits generated by veterans exceeds the present value of Social
Security benefits of nonveterans by around $11,000. Between the Original HRS and Early Boomer
cohorts, the difference in the present value of Social Security benefits rises much more sharply for
nonveterans than for veterans. As a result, the present value of Social Security benefits of nonveterans
exceeds the present value of benefits of veterans by about $10,000. For the Mid Boomers, the gap
widens further in favor of nonveterans to $43,000, a difference of twenty percent.
7 We calculate the Primary Insurance Amount as of the respondent’s full retirement age, and discount that value back to the base year the respondent entered the HRS. We calculate benefits by adjusting the PIA by the expected date of claiming. All values are then discounted to the base year the respondent entered the HRS. From there, we use the actual inflation rate between the year of entering the HRS and 2010 to express base year values in 2010 dollars. 8 We use the actual nominal interest rate minus CPI for calculating the present value of Social Security benefits as of the year of entitlement. For future years where we don't have actual interest rates we use the Social Security Administration’s intermediate future rates. These benefits are discounted back to their expected age of receiving benefits, and then back to the base year the cohort entered into the HRS.

20
The next row reports the total value of all pensions earned by the male respondent. Importantly,
pension wealth includes the present value of benefits from defined benefit pensions as well as the
value of defined contribution accounts. Pensions from the individual’s current job and all previous
jobs lasting at least five years are included in the total.
Pension values for veterans from the two oldest cohorts exceed the pension values of nonveterans.
The difference is considerable, $62,000 dollars or 52 percent in favor of veterans for the 1992 cohort,
and $55,000, or 41 percent for the 1998 cohort. This large gap in favor of veterans disappears for the
two youngest cohorts. Both veterans and nonveterans from the Mid Boomer cohort suffered significant
declines in the value of their pension vis-à-vis comparable members of the Early Boomer cohort. This
decline is presumably the result of the Great Recession.
The fourth row in the veterans panel reports the present value of pensions identified as resulting
from 20 years of continuous military service. This is a limited measure that understates the value of
veterans’ pensions earned from military service. The HRS does not ask directly about military
pensions. Our approach to identifying pensions originating from military service is to match the start
and end dates for the period of employment associated with each pension with the start and end dates
reported by the respondent for his period of military service. We have little trouble in identifying
pensions from military service for those who served twenty or more years in a single period of active
duty. The problem comes in identifying pensions from military service that are the result of two or
more periods of active duty that are not contiguous, or a period of active duty and service in the
reserves. The HRS asks only about active duty service, and then only about the longest period of
active service. Consequently we cannot identify military pensions resulting from multiple,
noncontiguous periods of service totaling at least twenty years, perhaps with some years in the active
military and some in the reserves.

21
Our estimates of the value of pensions resulting from military service are limited in another way.
They refer to the present value of benefits beginning with the year the respondent was age 51 to 56
in the base year for the cohort. They do not take into account the value of the pension payments
received before the respondent entered the HRS, or before the respondent attained ages 51 to 56.
This is important because veterans who accumulate twenty years of active duty service are eligible
to receive an annual pension payment from the time they first accumulate 20 years of service. Thus
even when we identify a pension as resulting from twenty continuous years of active duty, we may
understate the total amount of payments from the military pension. That is, we estimate the present
value of pension wealth to be paid from ages 51 to 56 forward, not the total payment under the
military pension.
One last caveat. We have very few observations of males with at least twenty years of service.
These range from 66 respondents in the original HRS to 11 and 12 respondents in the Early and Mid
Boomer cohorts respectively.
Bearing all of these issues in mind, we calculate the present values of military pensions in row 4
of the top panel of Table 5. They decline quite sharply, from $681,000 for members of the original
HRS cohort and $763,000 for War Babies, down to $447,000 for members of the Early Boomer
cohort and $373,000 for members of the Mid Boomer cohort. In the following row in the top panel
of Table 5, for those with military pensions we report the average value of additional pensions. This
includes zero values for those among veterans with a military pension who did not have another
pension. These amount to a fraction of the value of the military pension.
By way of comparison, in the next to last row of both panels, we then report the present values of
pensions for veterans and nonveterans who did not have a pension from twenty years of consecutive
service in the military, but had reported one or more other pensions. As can be seen, in the two

22
oldest cohorts, military pensions were roughly three times as valuable as pensions held by veterans
whose pension did not originate from the military. For the two younger cohorts, the gap was smaller,
but still considerably more than two to one.
Next we consider the differences in total wealth and its components between the veterans’
households and nonveterans’ households in each cohort. Figure 2 compares total wealth among HRS
cohorts by veteran status. The reversal of fortune of veterans relative to nonveterans across cohorts is
readily apparent. In the Original HRS and War Baby cohorts, the total wealth of households with an
age eligible male veteran exceeds that of nonveteran households by 7.5 percent (883/822) for the
HRS cohort and 6 percent (951/897) for the War Babies. In contrast, the wealth of veteran
households falls below the wealth of nonveteran households by 22 percent (835/1066) and 25
percent (648/865) for the Early Boomer and Mid Boomer households respectively.
Differences in wealth among cohorts reflect differences in the earnings histories of each
household member, differences in Social Security and pension opportunities, differences in the
history of growth of assets, and also differences in the state of the business cycle during the period of
observation. Most importantly, asset values reported in Table 9 for the Mid Boomer cohort were
affected by the Great Recession.

23
Figure 2: Total Wealth of Households of Male Veterans and Households with Male Nonveterans by Cohort, in Thousands of 2010 Dollars
883 951
835
648
822 897
1066
865
0
200
400
600
800
1000
1200
HRS War Babies Early Boomers Mid Boomers
VeteransNon-veterans
We now turn to information on the components of household wealth for veteran and nonveteran
households in each of the four cohorts. These are reported in Tables 6 to 9. The first row of each
table repeats the information on total wealth for each cohort from Figure 2. The next rows report the
values of the components of total wealth. The first column of each table reports the components of
total wealth for all age eligible households in the cohort. The remaining columns report values for
households with a male veteran, values for households with an age eligible nonveteran male in the
year the cohort was first interviewed, and the ratio of values for veteran households over values for
nonveteran households in each of the components of wealth. Once again, all amounts are expressed
in 2010 dollars.
The second row of Tables 6 to 9 reports household Social Security wealth. This is the present
value of the total Social Security benefits earned by both the husband and wife. It differs from the
24
Social Security wealth reported in Table 5, which was confined to the value of Social Security
benefits paid in the household due to the earnings of the 51 to 56 year old male. That is, the total
Social Security benefits of the household include own benefits of each spouse, as well as the top up
to either spouse’s monthly payment due to spouse or survivor benefits. From column 1, row 2 of
each table, comparing Social Security wealth of All Households, the present value of Social Security
benefits of households is lower in households from the Mid Boomer cohort than from households
from two of the older cohorts, the War Babies and Early Boomers. These differences among cohorts
over time reflect differences in the real earnings of members of each cohort, including major changes
in the labor force participation of wives in these households, changes in the payroll tax ceiling over
time, changing marital status among cohorts, the Great Recession, as well as changes in the Social
Security rules governing the benefits of members of different cohorts. On net, these changes have
apparently reduced the total Social Security wealth of households in the Mid Boomer cohort
compared to households from the two immediately older cohorts.
Veterans and nonveterans in each cohort are subject to the same rules. Thus it is useful to ask
about changes in the relative position of veterans’ Social Security wealth. The Social Security wealth
of veterans’ households deteriorates vis-à-vis the Social Security wealth of nonveterans. However,
the deterioration in relative Social Security wealth of veterans is not as severe as the deterioration
observed for total wealth. Thus we find in the last column, row 2, that Social Security wealth of
households is 6 percent higher for households with a veteran in 1992 and 10 percent higher for
households with a veteran in 1998. But there is a reversal within the Early Boomer cohort in 2004,
where the Social Security benefits of veterans fall below those of nonveterans by 5 percent. By 2010,
Social Security wealth of veterans is thirteen percent lower than Social Security wealth of

25
nonveteran households. In contrast, the total wealth of veteran households is 7 percent higher than
nonveteran households in 1992, while it is 25 percent lower than nonveteran households in 2010.
In row three of each table, the Social Security wealth due to the male’s own covered work is
reported. This number, which is reproduced from Table 5, does not include the wife’s own benefits.
Nor does it include any top up to the veteran’s benefits based on his spouse’s own earnings, which
arises in those cases where the spouse’s covered earnings exceed the covered earnings of the male in
the household. We find analogous changes in the relative position of the Social Security benefits
earned by the individual veteran respondents compared to nonveterans. Although there are some
differences in ratios, the bottom line is the same. The Social Security wealth of veterans at first
exceeds, but then falls below the Social Security wealth of nonveterans.
Row 4 pertains to the total wealth from all pensions. The pensions of each spouse are added.
Here we find a large difference in pension values in favor of veterans in the original cohorts. For
later cohorts this difference reverses, so that pensions of nonveterans exceeded the pensions of
veterans from the two youngest cohorts. Specifically, the pension wealth of veteran households
exceeds the pension wealth of nonveteran households by 42 percent in 1992 and by 43 percent in
1998. By the 2010 cohort, the pension wealth of veteran households is 1 percent below the pension
wealth of nonveteran households. The results in row 5 for pensions earned by the respondent are
analogous.
Row 6 repeats the pension values from Table 5 for those veterans we can identify as having
served 20 years or more in the military and for whom we were able to match the time in the military
with the pension from that job.
Looking down the remaining rows of columns 2 and 3 of Table 6, which reports the findings for
the original HRS cohort, with the exception of Real Estate and Business Assets, where veterans fall
26
short by 33 and 30 percent respectively, there are no remarkable differences in the other forms of
wealth held by veterans and nonveterans. House Values, Net Values of Vehicles, and Financial
Assets are all within 5 percentage points. IRA assets are 17 percent higher for veterans within the
original HRS cohort.
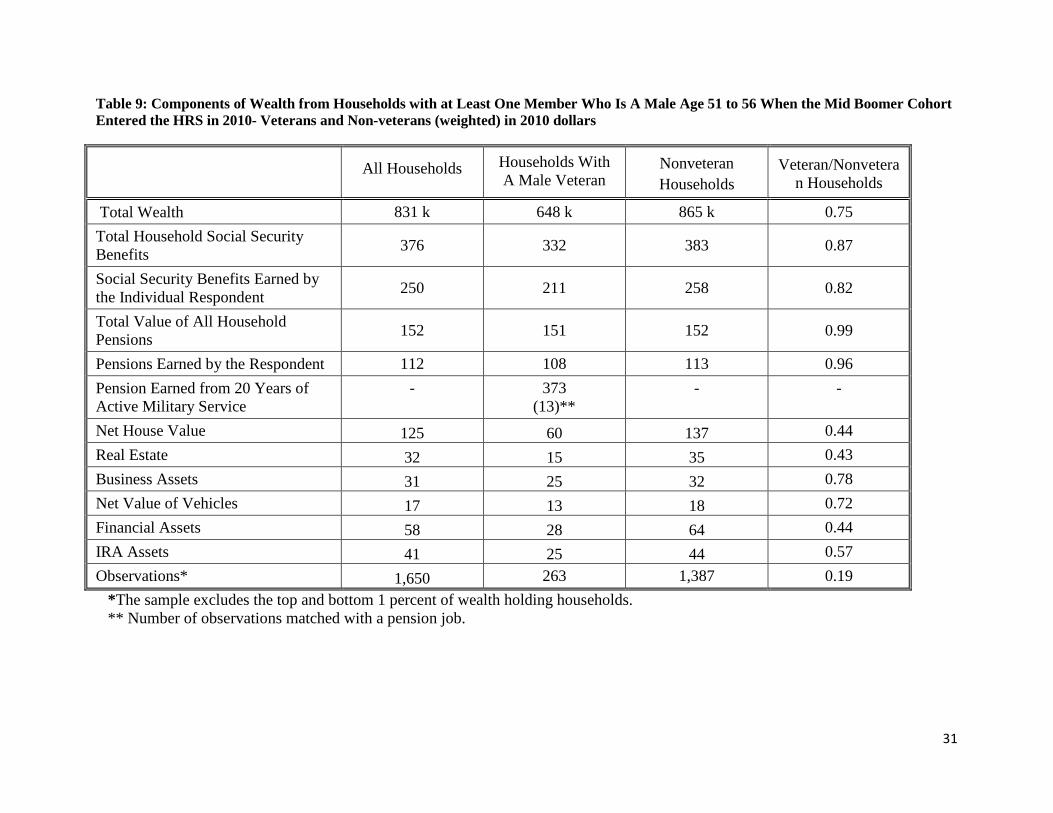
In contrast, there are enormous differences in favor of nonveterans within the 2010 cohort of Mid
Boomers. The House Values of veterans, their Real Estate, and their Financial Assets are all less
than half the values of these assets held by nonveterans. The Business Assets held by Mid Boomer
veterans are 22 percent lower than the Business Assets held by nonveterans, while IRA Assets are 43
percent lower for veterans.
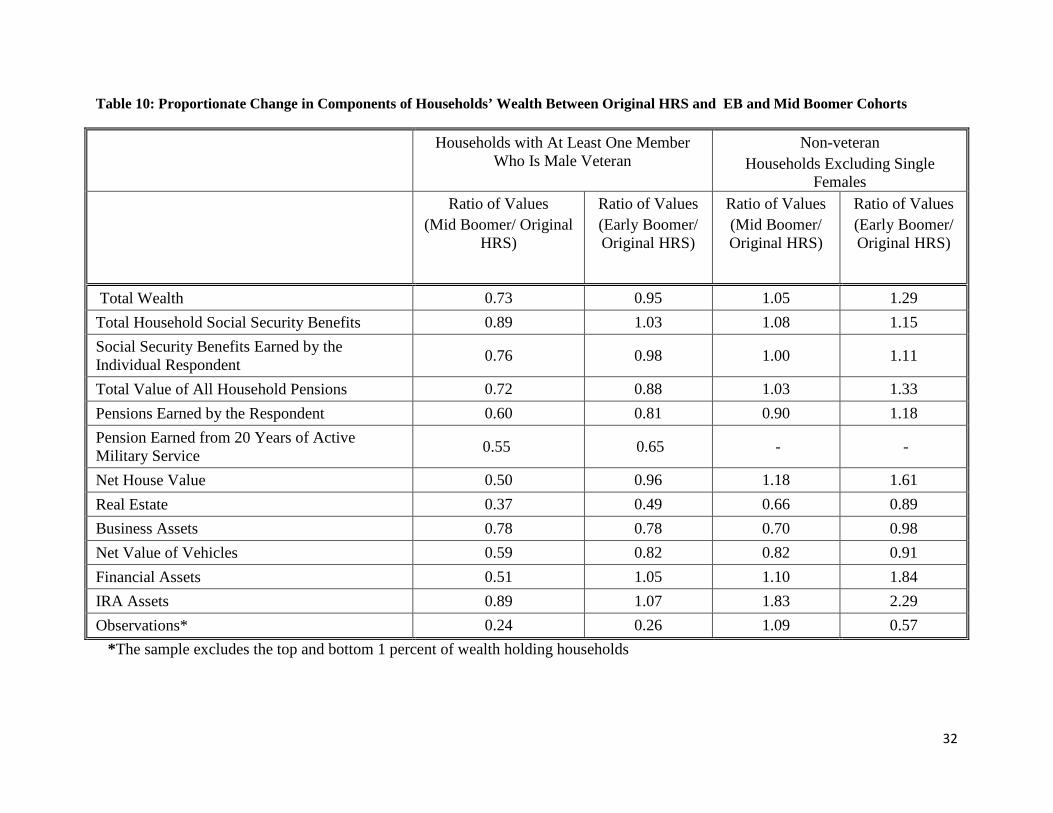
For each of the wealth categories in Tables 6 through 9, Table 10 computes the relevant ratios of
wealth held by veterans and nonveterans, ages 51 to 56, in Mid Boomer vs. Original HRS cohort,
and Early Boomer vs. original HRS cohort. Columns 1 and 3 compare the Mid Boomer cohort to the
original HRS cohort. By the Mid Boomer cohort, total wealth held by veterans declined by twenty
seven percent relative to the HRS cohort. In contrast, the total wealth of the comparable nonveteran
cohort rose by 5 percent. While there was only a five percent decline in wealth between veterans
from the Early Boomer cohort and the original HRS cohort, the wealth of non-veterans grew by 29
percent between the Early Boomer cohort and the original HRS cohort.
Comparing columns 4 and 3, Social Security and pension wealth of nonveterans grew relative to
the original HRS cohort even for the Mid Boomers, but that growth was lower than the prerecession
growth observed between the Early Boomer cohort and the original HRS cohort. In contrast, for the
veterans there was a modest decline in values of Social Security and pensions, one that became very
wide between the Mid Boomers and the original HRS cohort. Most of the decline in the relative

27
wealth of veterans and its key components occurred after the Early Boomer cohort entered the HRS.
It seems to coincide with the change to an all-volunteer military.
The declines in other components of wealth for veterans are also much larger than the decline for
nonveterans. For example, despite the Great Recession, the housing wealth of nonveterans increased
by 18 percent when comparing Mid Boomers to members of the original HRS cohort (row 7, column
3). In contrast, the value of housing wealth declined by 50 percent between veterans from the Mid
Boomer cohort and veterans from the original HRS cohort (row 7, column 1). Both veterans and
nonveterans had experienced very large declines in relative house value compared to their situation
in 2004. At that time, the house values for nonveteran Early Boomer households were worth 28
percent (148/116) more than house values for the original HRS cohort, while house values of
veterans were worth about 96 percent (114/119) of the house values of veterans from the original
HRS cohort.
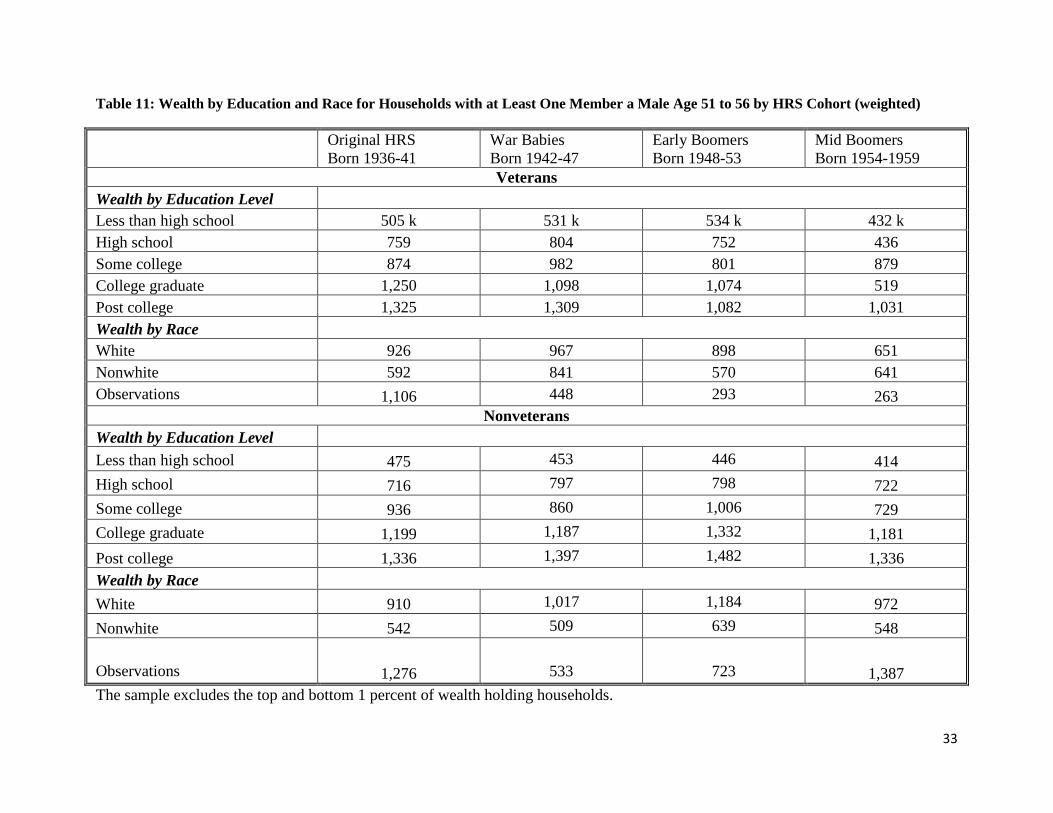
Now we wish to relate the observed differences in wealth to the most important of the
demographic characteristics. From Table 11, we see that within all educational categories but one,
the wealth of both veterans and nonveterans from the Mid Boomer cohort was lower in real terms
than in the original HRS cohort. In all of these cases, the decline in wealth is greater for veterans
than nonveterans. For example, from row 4 of each panel, between the original HRS and Mid
Boomer cohorts, the real wealth of college graduates who were veterans declined by much more
($1.250 million to $519 thousand) than did the real wealth of college graduates who were not
veterans ($1.199 million to $1.181 million).

28
Table 6: Components of Wealth from Households with at Least One Member Who Is A Male Age 51 to 56 When the Cohort Entered the HRS Cohort in 1992- Veterans and Nonveterans (weighted) in 2010 dollars
All Households Households With
A Male Veteran Nonveteran Households
Veteran/Nonveteran Households
Total Wealth 852 k 883 k 822 k 1.07 Total Household Social Security Benefits 364 375 354 1.06
Social Security Benefits Earned by the Individual Respondent 266 276 257 1.07
Total Value of All Household Pensions 178 210 148 1.42
Pensions Earned by the Respondent 152 181 125 1.45
Pension Earned from 20 Years of Active Military Service - 681
- -
Net House Value 117 119 116 1.03 Real Estate 47 41 53 0.77 Business Assets 39 32 46 0.70 Net Value of Vehicles 22 22 22 1.00 Financial Assets 57 55 58 0.95 IRA Assets 26 28 24 1.17 Observations* 2,383 1,106 1,276 0.87
*The sample excludes the top and bottom 1 percent of wealth holding households. ** Number of observations matched with a pension job.

29
Table 7: Components of Wealth from Households with at Least One Member Who Is A Male Age 51 to 56 When the War Baby Cohort Entered the HRS in 1998- Veterans and Nonveterans (weighted) in 2010 dollars
All Households Households With A Male Veteran
Nonveteran Households
Veteran/Nonveteran Households
Total Wealth 922 k 951 k 897 k 1.06 Total Household Social Security Benefits 392 413 374 1.10
Social Security Benefits Earned by the Individual Respondent 283 293 274 1.07
Total Value of All Household Pensions 199 238 166 1.43
Pensions Earned by the Respondent 160 190 133 1.43 Pension Earned from 20 Years of Active Military Service - 763
(16)** - -
Net House Value 113 105 121 0.87 Real Estate 44 38 49 0.78 Business Assets 35 30 40 0.75 Net Value of Vehicles 22 22 22 1.00 Financial Assets 75 68 80 0.85 IRA Assets 42 39 45 0.87 Observations* 985 466 519 0.90
*The sample excludes the top and bottom 1 percent of wealth holding households. ** Number of observations matched with a pension job.

30
Table 8: Components of Wealth from Households with at Least One Member Who Is A Male Age 51 to 56 When the Early Boomer Cohort Entered the HRS in 2004- Veterans and Non-veterans (weighted) in 2010 dollars
All Households Households With
A Male Veteran Nonveteran Households
Veteran/Nonveteran Households
Total Wealth 998 k 835 k 1,064 k 0.78 Total Household Social Security Benefits 402 386 408 0.95
Social Security Benefits Earned by the Individual Respondent 280 271 284 0.95
Total Value of All Household Pensions 193 184 197 0.93
Pensions Earned by the Respondent 147 146 148 0.98 Pension Earned from 20 Years of Active Military Service - 446
(12)** - -
Net House Value 165 114 187 0.61 Real Estate 40 20 47 0.43 Business Assets 39 25 45 0.56 Net Value of Vehicles 19 18 20 0.90 Financial Assets 93 58 107 0.54 IRA Assets 48 30 55 0.55 Observations* 1,018 293 723 0.41
*The sample excludes the top and bottom 1 percent of wealth holding households. ** Number of observations matched with a pension job.
31
Table 9: Components of Wealth from Households with at Least One Member Who Is A Male Age 51 to 56 When the Mid Boomer Cohort Entered the HRS in 2010- Veterans and Non-veterans (weighted) in 2010 dollars
All Households Households With A Male Veteran
Nonveteran Households
Veteran/Nonveteran Households
Total Wealth 831 k 648 k 865 k 0.75 Total Household Social Security Benefits 376 332 383 0.87
Social Security Benefits Earned by the Individual Respondent 250 211 258 0.82
Total Value of All Household Pensions 152 151 152 0.99
Pensions Earned by the Respondent 112 108 113 0.96 Pension Earned from 20 Years of Active Military Service
-
373 (13)**
-
-
Net House Value 125 60 137 0.44 Real Estate 32 15 35 0.43 Business Assets 31 25 32 0.78 Net Value of Vehicles 17 13 18 0.72 Financial Assets 58 28 64 0.44 IRA Assets 41 25 44 0.57 Observations* 1,650 263 1,387 0.19
*The sample excludes the top and bottom 1 percent of wealth holding households. ** Number of observations matched with a pension job.
32
Table 10: Proportionate Change in Components of Households’ Wealth Between Original HRS and EB and Mid Boomer Cohorts
Households with At Least One Member Who Is Male Veteran
Non-veteran Households Excluding Single
Females Ratio of Values
(Mid Boomer/ Original HRS)
Ratio of Values (Early Boomer/ Original HRS)
Ratio of Values (Mid Boomer/ Original HRS)
Ratio of Values (Early Boomer/ Original HRS)
Total Wealth 0.73 0.95 1.05 1.29 Total Household Social Security Benefits 0.89 1.03 1.08 1.15 Social Security Benefits Earned by the Individual Respondent 0.76 0.98 1.00 1.11
Total Value of All Household Pensions 0.72 0.88 1.03 1.33 Pensions Earned by the Respondent 0.60 0.81 0.90 1.18 Pension Earned from 20 Years of Active Military Service 0.55 0.65 - -
Net House Value 0.50 0.96 1.18 1.61 Real Estate 0.37 0.49 0.66 0.89 Business Assets 0.78 0.78 0.70 0.98 Net Value of Vehicles 0.59 0.82 0.82 0.91 Financial Assets 0.51 1.05 1.10 1.84 IRA Assets 0.89 1.07 1.83 2.29 Observations* 0.24 0.26 1.09 0.57
*The sample excludes the top and bottom 1 percent of wealth holding households
33
Table 11: Wealth by Education and Race for Households with at Least One Member a Male Age 51 to 56 by HRS Cohort (weighted)
Original HRS Born 1936-41
War Babies Born 1942-47
Early Boomers Born 1948-53
Mid Boomers Born 1954-1959
Veterans Wealth by Education Level Less than high school 505 k 531 k 534 k 432 k High school 759 804 752 436 Some college 874 982 801 879 College graduate 1,250 1,098 1,074 519 Post college 1,325 1,309 1,082 1,031 Wealth by Race White 926 967 898 651 Nonwhite 592 841 570 641 Observations 1,106 448 293 263
Nonveterans Wealth by Education Level Less than high school 475 453 446 414 High school 716 797 798 722 Some college 936 860 1,006 729 College graduate 1,199 1,187 1,332 1,181 Post college 1,336 1,397 1,482 1,336 Wealth by Race White 910 1,017 1,184 972 Nonwhite 542 509 639 548 Observations 1,276 533 723 1,387 The sample excludes the top and bottom 1 percent of wealth holding households.
34
The differences in wealth between the original HRS cohort and the Mid Boomers vary
considerably by race and veterans status. The wealth of white veterans fell from $926,000 for
members of the original HRS cohort to $651,000 for members of the Mid Boomer cohort. In the case
of white nonveterans, there is a slight increase in wealth from the Original HRS to the Early
Boomers, from $910,000 to $972,000. For nonwhite veterans, the difference in total wealth is
$49,000 (641 – 592). For nonwhite nonveterans the difference is $6,000 (548-542).
IV. A Multivariate Analysis of the Relation of Veteran Status to Wealth
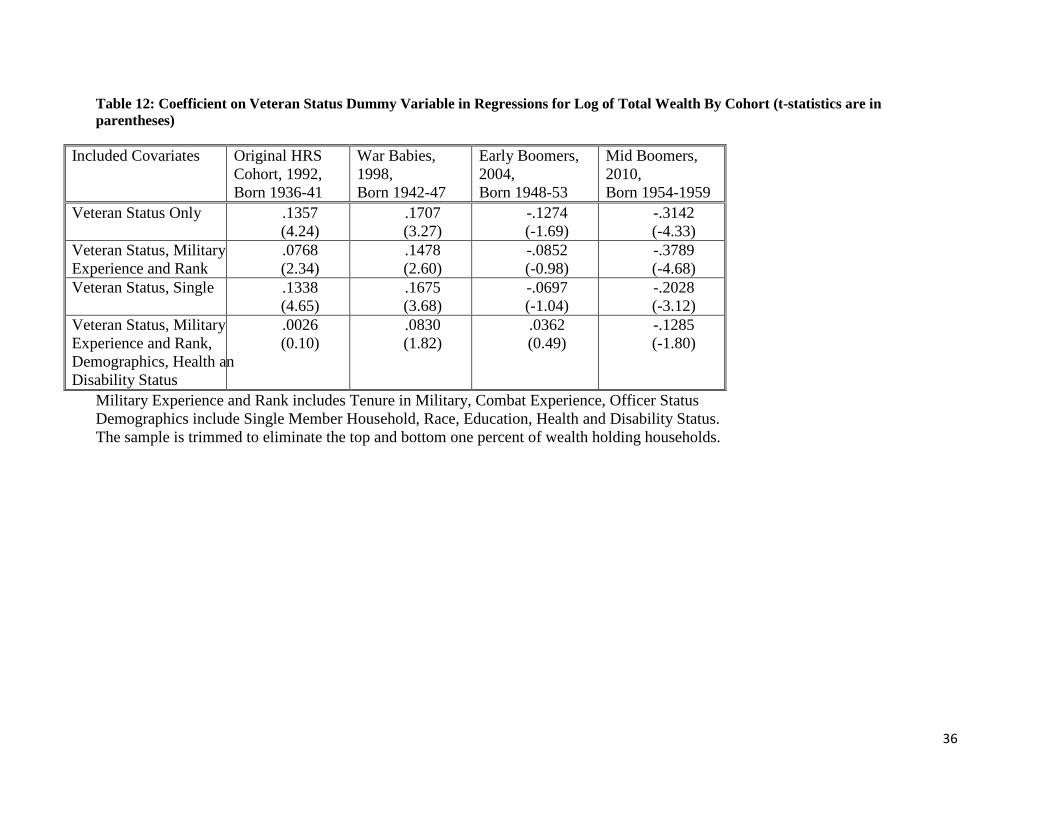
This section considers the relation of wealth to veteran status in a multivariate context. Table 12
reports results for the coefficients of a dummy variable indicating veteran status. The four columns
report results for regressions run within each of the HRS cohorts. Observations and sample weights are
for males who were within the 51 to 56 year age range at the time they joined the HRS. The dependent
variable is the ln of wealth. We again use a comprehensive measure of total wealth which includes all
pension and Social Security wealth of the household. The sample has been trimmed to eliminate
households with the highest and lowest 1 percent of wealth.
The rows report the effects of including additional covariates. In row 1, no covariates are included
beyond the variable indicating that the individual served in the military. Thus the coefficient shows the
differences in total wealth between veterans and nonveterans whatever their military history and
whatever their household and demographic status. Looking across row 1 we see the decline in the
relative standing of veterans between older and younger cohorts, a decline that is readily apparent in the
descriptive statistics. In the original 1992 HRS cohort, the wealth of veterans is 13.6 percent higher than
nonveterans. Wealth is also higher for veterans in the 1998 War Babies cohort. By the 2004 Early
Boomer cohort, veterans’ wealth is lower than that of nonveterans. In the 2010 Mid Boomers cohort, the
wealth of veterans is 31 percent below that of nonveterans.

35
Row 2 adds indicators of length of military service, rank, exposure to combat, and officer status as
covariates. For the first three cohorts, these measures of service weaken the coefficient of the dummy
variable indicating veteran status, but the thrust of the story is not changed. For the Mid Boomers, the
coefficient on veteran status suggests that veterans have 38 percent lower household wealth than
nonveterans.
Row 3 includes only two covariates, the measure of veteran status together with an indicator of
whether the individual is single. Since we are dealing with household wealth, the indicator of household
type standardizes for the difference in wealth between couple and single households. For the older two
cohorts, standardizing for household composition has little effect on the coefficient of the veteran
indicator variable. But for the Early and Mid Boomer cohorts, holding household composition constant
reduces the coefficient on the indicator of veteran status. By 2010, including single status in the
regression reduces the difference in wealth between veterans and nonveterans to 20 percent. The
comparison between column 4, rows 1 and 3 suggests one reason for lower relative wealth of veterans
under the All-Volunteer Army is that veterans are more likely to come from single households than
nonveterans. As seen in Table 3, veterans from older cohorts were just as likely to be married as were
nonveterans. By the Mid Boomer cohort, however, veterans were ten percent less likely to be married
than nonveterans.
36
Table 12: Coefficient on Veteran Status Dummy Variable in Regressions for Log of Total Wealth By Cohort (t-statistics are in parentheses)
Original HRS Cohort, 1992, Born 1936-41
War Babies, 1998, Born 1942-47
Early Boomers, 2004, Born 1948-53
Mid Boomers, 2010, Born 1954-1959
Included Covariates
Veteran Status Only .1357 (4.24)
.1707 (3.27)
-.1274 (-1.69)
-.3142 (-4.33)
Veteran Status, Military Experience and Rank
.0768 (2.34)
.1478 (2.60)
-.0852 (-0.98)
-.3789 (-4.68)
Veteran Status, Single .1338 (4.65)
.1675 (3.68)
-.0697 (-1.04)
-.2028 (-3.12)
Veteran Status, Military Experience and Rank, Demographics, Health an Disability Status
.0026 (0.10)
.0830 (1.82)
.0362 (0.49)
-.1285 (-1.80)
Military Experience and Rank includes Tenure in Military, Combat Experience, Officer Status Demographics include Single Member Household, Race, Education, Health and Disability Status. The sample is trimmed to eliminate the top and bottom one percent of wealth holding households.
37
Row 4 of Table 12 adds the measures of military service and a number of other covariates, including
indicators of education, race, and marital status, as well as various measures of health problems limiting
work, including disability status. As seen in the first three columns, for the three older HRS cohorts,
differences in wealth between veterans and nonveterans is strongly influenced by differences in
observable demographics health and disability. That is, for these older cohorts, the composition of the
military, as well as any disabilities associated with military service, account for much of the differences
in wealth between veterans and nonveterans.
While the difference in wealth between veterans and nonveterans is also reduced when we
standardize for these other covariates, the wealth of veterans remains about 13 percent below the wealth
of nonveterans even after these observable covariates are included in the regression. This suggests either
that differences in wealth between veterans in the All-Volunteer force and nonveterans result from
unobservable characteristics associated with lower earning capacity of those choosing to serve in the
military, or that there are insufficient opportunities or incentives for veterans from the All-Volunteer
force to accumulate assets to support themselves in retirement.
The regressions underlying Table 12 allow for the full interaction of the cohort indicator with the
dummy variable indicating veteran status. That is, the coefficients of all independent variables are
allowed to vary among cohorts. As evidenced by the change in value of the coefficient on the measure
of veteran status, the interaction of cohort and veteran status is crucial. In contrast to the coefficient on
the dummy variable measuring veteran status, the coefficients of other covariates in Table 12 do not
vary sharply across the cohorts.

38
Table 13: Pooled Regression of ln Total Household Wealth on Military Experience, Demographic Measures, Health and Disability Status for Males. Uses Individual Respondent Weights.
Coefficient t-statistic Intercept 13.6692 302.49
War Baby Cohort .0223 0.51 Early Boomer Cohort .0588 1.45 Mid Boomer Cohort -.0395 -1.02
HRS - Veteran .0019 0.04 War Baby - Veteran .0684 1.55
Early Boomer - Veteran -.0408 -0.89 Mid Boomer - Veteran -.0983 -1.84
Single -.9539 -39.44 Nonwhite -.3701 -14.42
Less than HS -.4071 -11.82 Some College .0463 4.98
College Graduate .0895 11.14 Postgraduate .0934 14.40
Military Tenure 10-19 .0378 0.33 Military Tenure >=20 .3345 4.09 Experienced Combat -.0975 -2.26
Officer .1090 1.48 Poor Health -.2246 -6.51 SSDI/SSI -.3936 -7.69
Military Disability -.1521 -2.51 Age 51 -.1313 -3.39 Age 52 -.0584 -1.63 Age 53 -.0082 -0.23 Age 54 -.0241 -0.67 Age 55 .0239 0.66
Adjusted R2 .3732 Number of Obs. 6272
39
Table 13 pools the observations from the four HRS cohorts. When pooling the observations in Table
13, we allow an indicator of cohort to interact with veteran status. In view of the finding that the
coefficient on other independent variables does not vary greatly among cohorts, we enter the other
independent variables without allowing full interactions.9
9 There are twenty four individual years of birth in our sample, representing members of the four cohorts, with six different ages in the base year. We tried including twenty four separate interaction variables, where these individual years of birth were interacted with an indicator of veteran status. However, the cells are too thin to allow reliable estimation of the coefficients for each of these interaction variables.
When cohort and age dummies are included along with the other covariates, we see from rows 4
through 8 that while wealth is no higher for veterans from the original HRS cohort, it is about 10 percent
lower for veterans from the Mid Boomer cohort. That is, veterans from this 2010 cohort of 51 to 56 year
old males have about ten percent lower wealth than others in full sample.
Now focus on the remaining covariates. Living in a single household, being nonwhite, having less
education, being in poor health, or reporting a disability, all lead to substantially less wealth
accumulation before retirement. Wealth is higher for those with military tenure of more than twenty
years, for officers (controlling for education), and is lower for those who experienced combat. These
findings confirm that the results from the descriptive statistics and the regressions run within cohorts
hold up when the full sample is pooled.
Note however that if health and disability status, and perhaps other covariates, are the result of
military service, relying on regressions with the full set of included covariates is likely to understate the
shortfall in wealth associated with military service. This is consistent with our finding of a much larger
shortfall in those regressions in Table 12 that included fewer covariates.
40
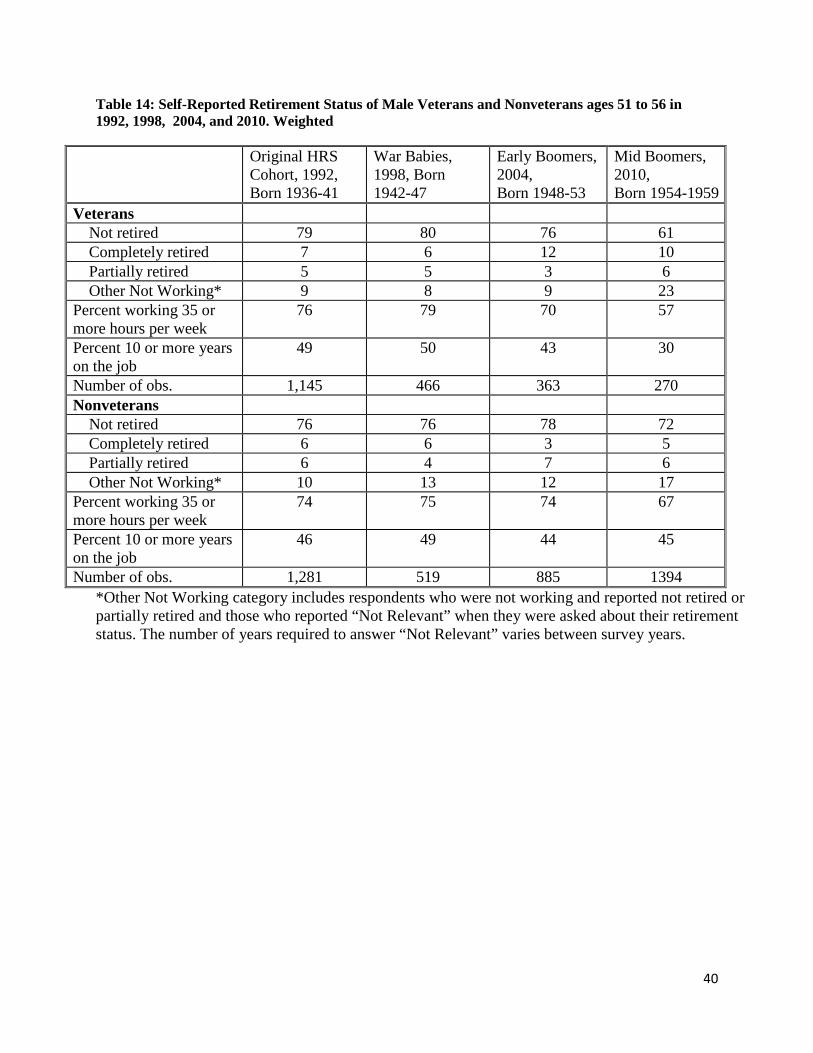
Table 14: Self-Reported Retirement Status of Male Veterans and Nonveterans ages 51 to 56 in 1992, 1998, 2004, and 2010. Weighted
Original HRS Cohort, 1992, Born 1936-41
War Babies, 1998, Born 1942-47
Early Boomers, 2004, Born 1948-53
Mid Boomers, 2010, Born 1954-1959
Veterans Not retired 79 80 76 61 Completely retired 7 6 12 10 Partially retired 5 5 3 6 Other Not Working* 9 8 9 23 Percent working 35 or more hours per week
76 79 70 57
Percent 10 or more years on the job
49 50 43 30
Number of obs. 1,145 466 363 270 Nonveterans Not retired 76 76 78 72 Completely retired 6 6 3 5 Partially retired 6 4 7 6 Other Not Working* 10 13 12 17 Percent working 35 or more hours per week
74 75 74 67
Percent 10 or more years on the job
46 49 44 45
Number of obs. 1,281 519 885 1394 *Other Not Working category includes respondents who were not working and reported not retired or partially retired and those who reported “Not Relevant” when they were asked about their retirement status. The number of years required to answer “Not Relevant” varies between survey years.

41
V. Differences in Retirement and Related Labor Market Outcomes Between Veterans and
Nonveterans.
Table 14 reports some basic statistics on retirement and related outcomes for veterans and
nonveterans. We calculate retirement status based on the number of hours and weeks worked per
year and, in ambiguous cases, by self-reported retirement status as well. Respondents working at
least 30 hours per week and 1560 hours or more per year are classified as not retired.
Respondents working less than 100 hours per year are classified as not working. Those working
at least 100 hours per year and 25 hours or less per week, or 1250 hours or less per year, are
partially retired. If the number of hours per year worked is between 1250 and 1560, but the self-
reported retirement status is either retired or not relevant, a partially retired status is assigned to
the respondent. Respondents who report between 1250 and 1560 hours worked, but report not
retired to the self-reported retirement status question, are considered to be not retired. Those who
report they are not working in response to the working for pay question, and report they are not
retired or partially retired in response to the retirement status question, are considered to be Not
Retired or Partially Retired and Not Working. If they report they are not working, and also
report themselves as retired, they are considered to be retired. If they report “not working” and in
answer to the self-reported retirement status question answer “not relevant”, they are assigned to
the "not relevant" category.10
10 The self-reported retirement status question in 1994 to 1998 is different from that question in 1992 and from 2000 forward. The difference is in the definition of the “Not relevant” response. From 1994 to 1998 “Not relevant” is defined as “Question not relevant to R, Does not work for pay or is homemaker, has not worked for 1 or more years”. In 1992, the question differs in the number of years not worked. The relevant phrase is “not worked for 10 or more years”. From 2000 forward the question is modified to “Question not relevant to R. Does not work for pay or is homemaker, etc.”.

42
Turn to the first row in each of the panels in Table 14, the upper panel for veterans, the
lower panel for nonveterans. The share of male veterans who are not retired declines from 79
percent to 62 percent over the four cohorts. The share of male nonveterans who are not retired
also declines, but by much less, from 75 percent to 71 percent. Similar pictures emerge when
examining the differences among cohorts in the fraction working 35 or more hours per week and
the fraction with ten or more years on the job. For veterans, the fraction working 35 or more
hours per week declines from 76 percent of males in the original HRS cohort to 58 percent of
males in the Mid Boomer cohort. For nonveterans, the comparable decline is from 74 percent to
67 percent. Similarly, the percentage of male veterans with 10 or more years of job tenure
declines from 49 percent to 31 percent. For nonveterans, the comparable decline is again much
shallower, from 46 percent to 44 percent.
We have seen that the wealth of veterans has deteriorated relative to the wealth of
nonveterans. We now see that this decline is exacerbated by a decline in employment for older
veterans.
VI. Conclusions.
When the economic status of veterans is compared to nonveterans in older HRS cohorts,
the veterans had higher wealth. There has been a reversal in status in the younger HRS cohorts.
Veterans whose service was primarily in the all-volunteer military have lower wealth than
nonveterans. When we standardize for differences among households in observable covariates,
including demographic, education, health, disability and service related measures, the gap in
wealth in favor of veterans is eliminated for 51 to 56 year olds in 1992. In contrast, for those 51
to 56 in 2010, the gap in wealth in favor of nonveterans is not eliminated.

43
In support of this finding, there are reasons to suspect that those from the youngest HRS
cohort, who entered the military in the first few years after the advent of the all-volunteer
military, had unobserved characteristics associated with lower earnings. The military had paid
this cohort less than planned, affecting the selection of military volunteers adversely, and the
exams for entrance into the military were misnormed, admitting individuals who normally would
not have been accepted for military service due to their low scores.
We had only limited data with which to measure military pensions paid to those who
qualify. Nevertheless, by any measure, pensions paid directly by the military represent only a
small share of the pension wealth and total wealth of all who served in the military. To be sure,
pensions paid by the military are quite substantial for those who receive them. But twenty year
vesting means that most veterans do not receive a military pension.11
The proposal from the Military Compensation Commission to introduce a 401(k) type
matching plan which would vest after two years of service would increase the military pensions
of those who serve less than twenty years. There continues to be debate about the effect of this
proposal, which is combined with a twenty percent reduction in the DB benefit from the current
military pension, on the pensions of those who serve long term.
Our findings suggest that policies meant to increase the benefits of veterans who are
already retired should be designed differently and targeted separately for members of different
11 Our findings in Table 5 indicate that the present value of pensions collected by
individuals in the Mid Boomer cohort with at least twenty consecutive years of military service are two times greater than the present value of all pensions collected by veterans who served fewer than 20 consecutive years. For older cohorts, the differences are even wider. Taken together, the total value of pensions due to all work of veterans from the Mid Boomer cohort, including work outside of the military, is $111,000. For nonveterans, the present value of all pensions is $112,000. Again considering the Mid Boomer cohort, the present value of Social Security benefits of veterans, at $214,000, falls below the present value of Social Security benefits of nonveterans, at $257,000.

44
cohorts. Veterans from the two oldest HRS cohorts are better prepared for retirement than
nonveterans from those cohorts, and there is no difference when covariates are included in the
regression. The problem arises for the youngest HRS cohort.
Whether veterans from still younger cohorts will have preretirement wealth comparable
to nonveterans from their cohort remains to be seen. Those who will be 51 to 56 in years after
2010 are no longer subject to the mistakes made in the first few years of the All-Volunteer force.
We suspect that the unmeasured differences between veterans and nonveterans will not disappear
entirely in future generations.
From a policy perspective, a fundamental question is whether any remaining gap in
wealth between veterans and nonveterans is due to unobservable factors? Alternatively, do those
in the all-volunteer military have lower wealth because they do not have the same opportunities
to save and accumulate wealth as do nonveterans? It would be of special concern if this
economic handicap somehow arises from their service, as suggested by Angrist (1990). Even if
the gap is due to differences in unobserved characteristics, would policy makers nevertheless like
to equate the wealth of veterans nearing retirement to nonveterans with comparable observed
characteristics?

45
Appendix 1: Calculation of Social Security Benefits
The sample includes all households with an observed male member from ages 51 to 56. 1. Total Household Social Security benefits:
a. Married and both in the sample.
R1’s Benefits = R1’s own benefit + top up spouse benefits from R2 + top up survivor benefits from R2. R2’s Benefits = R2’s own benefit + top up spouse benefits from R1 + top up survivor benefits from R1. Household benefits= R1’s Benefits + R2’s Benefits
b. Married and female spouse is constructed.
R1’s Benefits received = R1’s own benefit + top up spouse benefits from R2 + top up survivor benefits from R2. R2’s Benefits = R2’s own benefit + top up spouse benefits from R1 + top up survivor benefits from R1. Household benefits= R1’s Benefits received + R2’s Benefits
c. Divorced and the female spouse is constructed.
R1’s Benefits = R1’s own benefit + top up spouse benefits from R2 + top up survivor benefits from R2. Household benefits= R1’s Benefits
d. Widower and the female spouse is constructed.
R1’s Benefits = R1’s own benefit + top up from the constructed female + top up for survivor benefits from the constructed female. Household benefits= R1’s Benefits received
e. Never married if male. Household benefits = own benefit
2. Social Security benefits earned by the individual respondent: It includes benefits generated by the individual respondent’s earnings.
R’s Benefits generated = R’s own benefit + top up from own earnings to the spouse + top up for survivor benefits from own earnings to the spouse.

46
Appendix 2: Assumptions Underlying Calculations
Imputations: We use a nearest neighbor approach to impute pensions, Social Security and
other missing variables. However, we do not impute answers to questions related to veteran
status, whether for respondents or missing spouses. When imputing Social Security benefits for
respondents, we use the respondent’s veteran status when selecting donors.
• Veteran status: Used the veteran question. This question and the dates of the service are
asked at the respondents’ first interview.
• Veterans’ Tenure: Used start and end date of the military service years. A few (3 cases)
dk/rf on the dates. No imputations done. Those cases have missing tenure values.
• Military Rank: If veterans reported they were officers, we identified them as officers.
The missing, dk/rf responses are included in the enlisters’ category. This question was
asked beginning in 2008. There was a preload for respondents first interviewed in earlier
waves in that wave. Rs who were not in that survey or exited the survey are missing this
information.
• Exposure to combat: If veterans reported ever fired a weapon in combat or been fired
upon in combat, we identified them as being in combat. The missing, dk/rf responses are
included in the non-combat category. This question was asked beginning in 2006. There
was a preload for respondents first interviewed in earlier waves in that wave. Rs who
were not in that survey or exited the survey are missing this information.
• Identifying military service jobs and pension from that job: We have matched the
start and end date of military service years with current job, last job and the three
previous pension jobs. We have used a margin of plus and minus 3 years for matching.
Pension values for veterans may be understated. They include the present value of those
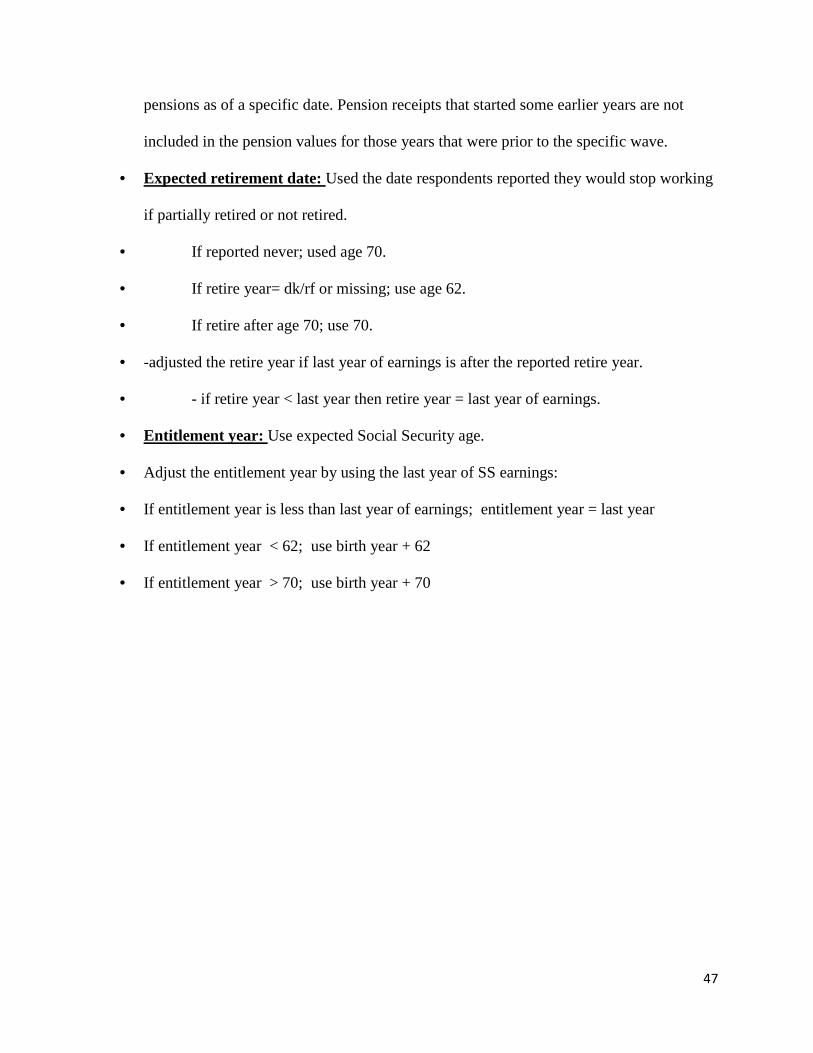
47
pensions as of a specific date. Pension receipts that started some earlier years are not
included in the pension values for those years that were prior to the specific wave.
• Expected retirement date: Used the date respondents reported they would stop working
if partially retired or not retired.
• If reported never; used age 70.
• If retire year= dk/rf or missing; use age 62.
• If retire after age 70; use 70.
• -adjusted the retire year if last year of earnings is after the reported retire year.
• - if retire year < last year then retire year = last year of earnings.
• Entitlement year: Use expected Social Security age.
• Adjust the entitlement year by using the last year of SS earnings:
• If entitlement year is less than last year of earnings; entitlement year = last year
• If entitlement year < 62; use birth year + 62
• If entitlement year > 70; use birth year + 70

48
Appendix 3
Appendix Table 1: Number of Male Veterans/non-veterans with their pension values in 1992, 1998, 2004, and 2010: weighted
1992 1998 2004 2010
Veterans with 20 or more years tenure Number of Rs with 20 or more years tenure 72 25 19 25
Number of Rs with 20 or more years tenure & a matched job
66 16 18 22
With non-zero military pension 63 16 11 12
PV of military pension in 2010 dollars
700,938 (63)
762,978 (16)
485,198 (11)
467,069 (12)
PV pension from all jobs in 2010 dollars
754,419 (63)
805,300 (16)
508,655 (11)
543,128 (12)
Veterans with less than 20 years tenure PV pension from all jobs in 2010 dollars
148,620
167,486
135,117
98,770
Number of veterans with less than 20 years of tenure
1,067
441
344
245
Total number of veterans 1,139
466
363
270
Non-veteran Males Pension value in 2010 dollars
120,135
133,302
144,797
112,180
Number of non-veterans 1,273 507 885 1,394

49
References
Angrist, Joshua D. 1990. “Lifetime Earnings and the Vietnam Era Draft Lottery: Evidence from Social Security Administrative Records”. The American Economic Review 80(3): 313-336.
______________. 1998. “Estimating the Labor Market Impact of Voluntary Military Service Using Social Security Data on Military Applicants”. Econometrica 66(2): 249-288.
Angrist, Joshua and Alan B. Krueger. 1994. “Why do World War II Veterans Earn More than Nonveterans?”
Autor, David H., Mark Duggan, Kyle Greenberg and David Lyle. 2015. “The Impact of Disability Benefits on Labor Supply: Evidence for the VA’s Disability Compensation Program”. NBER Working Paper, 21144. May.
Coile, Courtney, Mark Duggan and Audrey Guo. 2015. “Veterans’ Labor Force Participation: What Role Does the V.A.’s Disability Compensation Program Play”. NBER Working Paper 20932. February.
Congressional Budget Office. 2012. “Costs of Military Pay and Benefits in the Defense Budget”. November.
Fitzgerald, Kelly G., 2006. "The Effect of Military Service on Wealth Accumulation," Research on Aging 28(1): 56-83. Journal of Labor Economics 12(1): 74-97.
Gustman, Alan L., Thomas L. Steinmeier and Nahid Tabatabai. 2010. Pensions in the Health and Retirement Study. Harvard University Press. Military Compensation and Retirement Modernization Commission. Report and Legislative Proposals. 2015. January. Nelson, Gary R. 1986. “The Supply and Quality of First-Term Enlistees Under the All-Volunteer Force. In William Bowman, Roger Little and G. Thomas Sicilia, editors. The All-Volunteer Force After A Decade: Retrospect and Prospect. McLain Virginia: Pergamon-Brassey’s International Defense Publishers. 23-51. Rand HRS Data Files. 2015. http://www.rand.org/labor/aging/dataprod/hrs-data.html
Social Security Administration. 2013. “Military Service and Social Security”. SSA Publication No. 05-10017.
Wilmoth, Janet M., Andrew S. London and Wendy M. Parker. 2010. “Military Service and Men’s Health Trajectories in Later Life”. Journal of Gerontology: Social Sciences 65B(6): 744-755.