Embed Size (px)
Citation preview

Demographic Challenges Facing Rural Schools:
Declining Enrollment and Growing Poverty
August8,2017
New York State Association of School Business Officials | Declining Enrollment and Growing Poverty: Demographic Challenges Facing Rural Schools
1
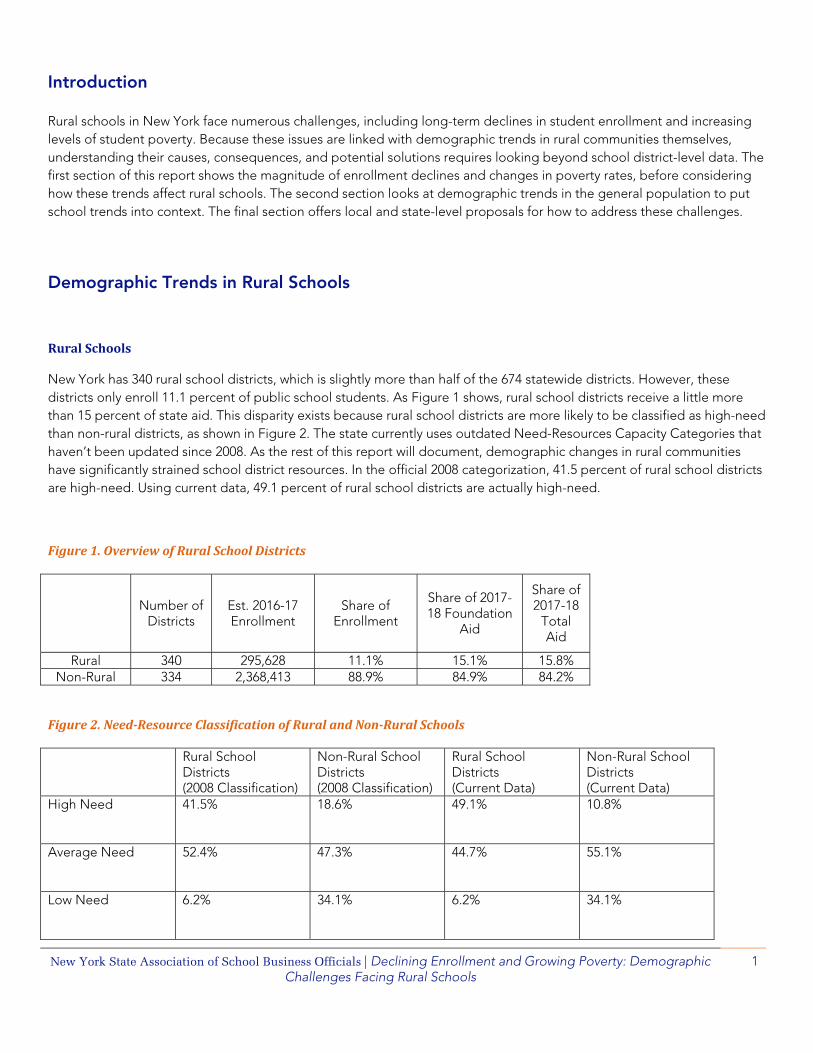
Introduction Rural schools in New York face numerous challenges, including long-term declines in student enrollment and increasing levels of student poverty. Because these issues are linked with demographic trends in rural communities themselves, understanding their causes, consequences, and potential solutions requires looking beyond school district-level data. The first section of this report shows the magnitude of enrollment declines and changes in poverty rates, before considering how these trends affect rural schools. The second section looks at demographic trends in the general population to put school trends into context. The final section offers local and state-level proposals for how to address these challenges.
Demographic Trends in Rural Schools
RuralSchools
New York has 340 rural school districts, which is slightly more than half of the 674 statewide districts. However, these districts only enroll 11.1 percent of public school students. As Figure 1 shows, rural school districts receive a little more than 15 percent of state aid. This disparity exists because rural school districts are more likely to be classified as high-need than non-rural districts, as shown in Figure 2. The state currently uses outdated Need-Resources Capacity Categories that haven’t been updated since 2008. As the rest of this report will document, demographic changes in rural communities have significantly strained school district resources. In the official 2008 categorization, 41.5 percent of rural school districts are high-need. Using current data, 49.1 percent of rural school districts are actually high-need.
Figure1.OverviewofRuralSchoolDistricts
Number of
Districts Est. 2016-17 Enrollment
Share of Enrollment
Share of 2017-18 Foundation
Aid
Share of 2017-18
Total Aid
Rural 340 295,628 11.1% 15.1% 15.8% Non-Rural 334 2,368,413 88.9% 84.9% 84.2%
Figure2.Need‐ResourceClassificationofRuralandNon‐RuralSchools
Rural School Districts (2008 Classification)
Non-Rural School Districts (2008 Classification)
Rural School Districts (Current Data)
Non-Rural School Districts (Current Data)
High Need 41.5% 18.6% 49.1% 10.8%
Average Need 52.4% 47.3% 44.7% 55.1%
Low Need 6.2% 34.1% 6.2% 34.1%

New York State Association of School Business Officials | Declining Enrollment and Growing Poverty: Demographic Challenges Facing Rural Schools
2
DecliningEnrollmentAs can be seen in Figure 3, during the past two decades, the trend for both school districts overall and rural school districts in particular, has been gradually smaller increases in student enrollment and student population losses.
Figure3.EnrollmentRateChanges,1995‐2015
Enrollment declines have affected almost all school districts in the state. The table in Figure 4 includes five-year and ten-year enrollment changes. Over the course of ten years, 89.3 percent of districts lost enrollment and 65.6 percent of districts saw enrollment declines of at least ten percent. Focusing in on districts with at least 1,000 students shows this is not an issue limited to small districts as these larger districts suffered similar rates of decline. Enrollment declines are omnipresent for rural districts. Over a decade, 96.7 percent of rural school districts had declining enrollment and 84.9 percent had drops of at least ten percent. After narrowing the focus to the five years between 2009-10 and 2014-15, rural school districts still suffered significant losses at much higher rates than other school districts.
‐4%
‐3%
‐2%
‐1%
0%
1%
2%
3%
4%
1995‐96 1997‐98 1999‐00 2001‐02 2003‐04 2005‐06 2007‐08 2009‐10 2011‐12 2013‐14
Rural Non‐Rural

New York State Association of School Business Officials | Declining Enrollment and Growing Poverty: Demographic Challenges Facing Rural Schools
3
The chart in Figure 5 shows ten-year enrollment declines in each region of the state, with the smallest declines in school districts in and around New York City. The maps in figures 6 and 7 show the five- and ten-year declines by school district.
Figure4.DistributionofFive‐YearandTen‐YearEnrollmentChange
Percent of Districts with Enrollment
Declines Between 2004-05 and 2014-15
Percent of Districts with at least 10%
Enrollment Declines Between 2004-05
and 2014-15
Percent of Districts with Enrollment
Declines Between 2009-10 and 2014-15
Percent of Districts with at least 10%
Enrollment Declines Between 2009-10
and 2014-15
All School Districts 89.3% 65.6% 86.6% 35.3%
School Districts with Enrollment of at least
1,000
86% 56.1% 85.2% 25.5%
All Rural School Districts
96.7% 84.9% 92.4% 51.8%
Figure5.Ten‐YearEnrollmentDeclinesbyRegion,2004‐05to2014‐15
‐18%
‐16%
‐14%
‐12%
‐10%
‐8%
‐6%
‐4%
‐2%
0%
CapitalDistrict
CentralRegion
FingerLakes
HudsonValley
Long Island MohawkValley
New YorkCity
NorthCountry
SouthernTier
WesternRegion

New York State Association of School Business Officials | Declining Enrollment and Growing Poverty: Demographic Challenges Facing Rural Schools
4
Figure6.MapofPopulationChangesinSchoolDistricts(10Years)

New York State Association of School Business Officials | Declining Enrollment and Growing Poverty: Demographic Challenges Facing Rural Schools
5
Figure7.MapofPopulationChangesinSchoolDistricts(5Years)
IncreasingPovertyWhile enrollment is declining across New York school districts, poverty rates are increasing. Unlike the falling enrollment where rural schools are losing students at a much faster rate than non-rural schools, poverty rates are higher in non-rural schools. Though the gap has narrowed slightly, as seen in Figure 8, there is still a significant difference in poverty levels.

New York State Association of School Business Officials | Declining Enrollment and Growing Poverty: Demographic Challenges Facing Rural Schools
6
Poverty thresholds in the United States are quite restrictive, so Free- and Reduced-Price Lunch (FRPL) data can be used as a broader way of looking at financial distress among school students. Students can be eligible for reduced-priced lunches if their family incomes are at or below 185 percent of the poverty level. The FRPL rate in New York for 2013-15 in rural school districts was 48.3 percent, while for non-rural school districts it was 53.2 percent.
The combination of poverty and FRPL data show that a little more than one in every five schoolchildren in New York lives in poverty, while a little more than half of all school children face significant economic constraints at home.
Figure8.PovertyRateAmongSchool‐AgeChildren,2003‐2015
ImpactonRuralSchools At the district level, year-to-year enrollment fluctuations present significant staffing challenges. Districts resist hiring people just to lay them off the following year, so administrators must work carefully to balance staffing. Longer time frame enrollment declines are frequently addressed through retirement and attrition, though these are not long-term solutions (and increased longevity compounds the cost of retirees which can contribute to a district’s fiscal stress). Declining enrollment may also put increasing strain on a district’s fund balances as it attempts to weather the storm of declining enrollment. Beyond the financial aspects, declining enrollments pose significant challenges to students. Some schools may have to cut back on valuable academic and enrichment opportunities, from Advanced Placement courses to music and sports programs, when they no longer have the student numbers needed for viability. Any potential reductions in college readiness preparation are incredibly serious. Decreasing enrollment can also increase students’ sense of isolation as there are literally fewer peers for them to interact with. The combination of declining enrollment and increasing poverty exacerbates these challenges. Aid formulas for poverty use an arbitrary weighting that fails to account for the challenges of concentrated poverty.
0%
5%
10%
15%
20%
25%
2003 2004 2005 2006 2007 2008 2009 2010 2011 2012 2013 2014 2015
Rural Schools Poverty Rate Non‐Rural Schools Poverty Rate

New York State Association of School Business Officials | Declining Enrollment and Growing Poverty: Demographic Challenges Facing Rural Schools
7
DemographicTrendsinNewYorkGeneralPopulation Rural schools need to be understood within the context of overall statewide demographic trends. Looking at population growth in New York state shows that for a few years prior to the onset of the Great Recession, growth rates in urban and rural counties were closely related. Beginning in 2008, rural populations entered a period of sustained declines, while urban populations continued to grow, though their pace of growth slowed after 2011. Figure 9 shows the post-recession divergence. Figure9.NewYorkPopulationGrowthRate,2003‐16
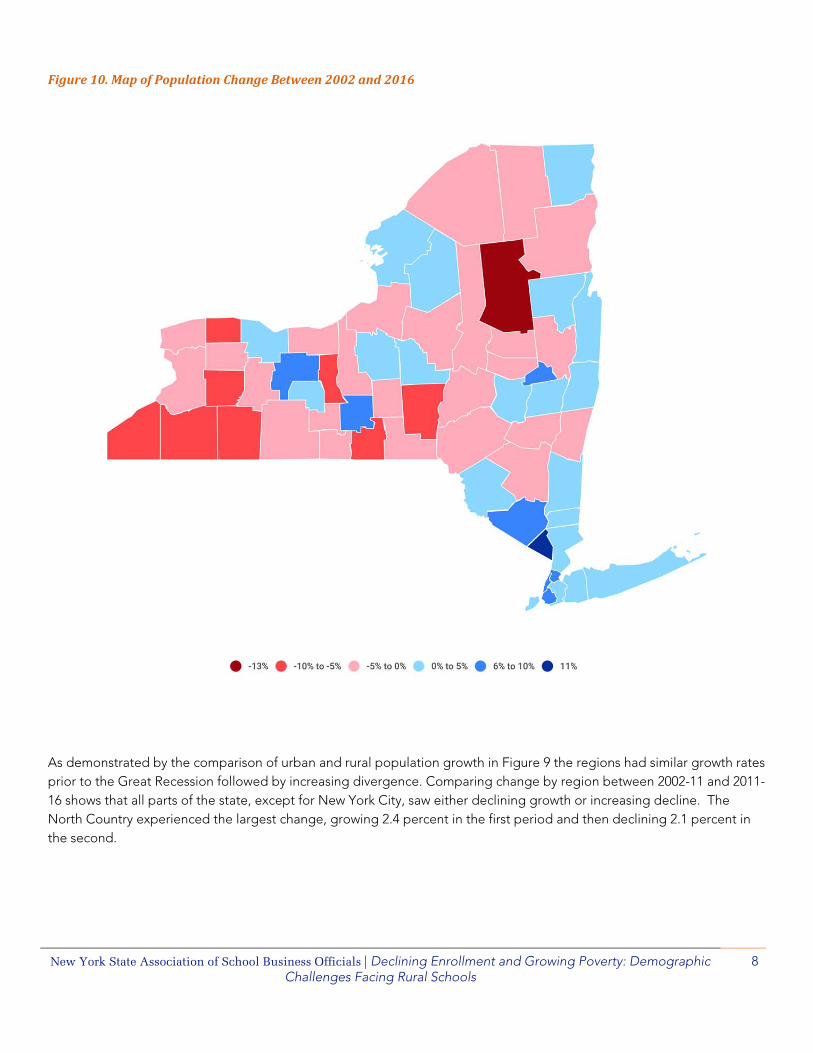
Figure 10 shows population trends at the county level between 2002 and 2016. The greater New York City metropolitan region, the Capital District, and the Rochester and Ithaca areas had the largest population increases. Large swaths of western New York, the Southern Tier, and the North Country suffered significant losses. More than half of New York counties, 54.8 percent, lost population in this time period, while 14.5 percent of counties had population declines of at least 5 percent.
‐0.8%
‐0.6%
‐0.4%
‐0.2%
0.0%
0.2%
0.4%
0.6%
0.8%
2003 2004 2005 2006 2007 2008 2009 2010 2011 2012 2013 2014 2015 2016
Rural Metro
New York State Association of School Business Officials | Declining Enrollment and Growing Poverty: Demographic Challenges Facing Rural Schools
8
Figure10.MapofPopulationChangeBetween2002and2016
As demonstrated by the comparison of urban and rural population growth in Figure 9 the regions had similar growth rates prior to the Great Recession followed by increasing divergence. Comparing change by region between 2002-11 and 2011-16 shows that all parts of the state, except for New York City, saw either declining growth or increasing decline. The North Country experienced the largest change, growing 2.4 percent in the first period and then declining 2.1 percent in the second.

New York State Association of School Business Officials | Declining Enrollment and Growing Poverty: Demographic Challenges Facing Rural Schools
9
Figure11.PopulationChangeBetween2002and2016
Population Change 2002-16
Population Change 2002-2011
Population Change 2011-2016
Capital District 4.24% 3.81% 0.41% Central Region ‐0.01% 1.23% -1.23%
Finger Lakes 0.35% 0.93% -0.57% Hudson Valley 4.75% 3.72% 0.99%
Long Island 2.07% 1.82% 0.25% Mohawk Valley ‐1.59% 0.51% -2.09% New York City 5.77% 2.63% 3.06% North Country ‐0.01% 2.44% -2.39% Southern Tier ‐2.35% ‐0.41% -1.94%
Western Region ‐3.23% ‐2.41% -0.83% While growth rates differ across New York, another trend has been nearly universal: the state’s population aged significantly between 2000 and 2016 and rural communities became, on average, even older than urban ones. In 2000, 56.8 percent of New Yorkers were under 40 and 21.8 percent were 55 and older. By 2016, the share of New Yorkers under 40 fell to 51.9 percent, while the proportion of residents 55 and older grew to 28.4 percent. Figure 12 shows the age distribution in rural and urban counties, where urban populations tended to be younger, while rural populations are disproportionately older. Figure12.AgeDistributioninRuralandUrbanCounties
Rural – 2000 Rural – 2016 Urban 2000 Urban – 2016 Under 20 27.7% 23.0% 27.4% 23.8%
20-39 26.0% 24.3% 29.6% 28.4%
40-54 21.9% 19.3% 21.4% 19.8%
Over 55 24.4% 33.4% 21.6% 28.0%
The largest exception to this split was with children between 15 and 19. In 2000, this age group made up 7.9 percent of the rural population and 6.7 percent of the urban population. By 2016, the gap remained, even as the overall share of those 15-19 years old fell; 6.8 percent of rural and 6.2 percent of urban residents were in that age range. The most likely explanation for this gap is that after finishing high school, rural residents are more likely to leave their communities, whether for military service, further education, or employment opportunities. It also means that looking at middle and high school enrollment numbers in isolation of other trends can disguise the degree of aging in rural communities. The third challenge facing rural communities is sharp increases in poverty. In 2000, poverty was more prevalent in urban counties, which had a poverty rate of 14.7 percent as compared with a poverty rate of 13.2 percent in rural counties. By 2015, while poverty grew for both areas, rural areas now suffered significantly higher levels of poverty. The rural poverty rate was 16.1 percent, while the urban poverty rate was 15.4 percent.

New York State Association of School Business Officials | Declining Enrollment and Growing Poverty: Demographic Challenges Facing Rural Schools
10
PolicySuggestions
At the district and BOCES level, addressing the challenges of declining enrollment and increasing poverty can best be met through increasing collaboration. There are examples of BOCES-wide leadership development and mentoring programs that have produced outstanding results. Partnerships between districts or with a BOCES could make college preparatory material available to more students; for example, expanding Advanced Placement opportunities or using distance learning. School districts can share sports teams or music programs, when their enrollment is not sufficient to support them on their own. Sharing services would let school districts take advantage of economies of scale and reduce fiscal stress. Finally, school districts could also gain from partnering with existing community agencies, like school-based health clinics. The governor and legislature have signaled support for expanding pre-k and full day kindergarten opportunities. In the current fiscal climate, particularly with the constraint of the Tax Cap, it is not realistic for individual districts to aggressively expand these opportunities on their own, but with state support rural schools could move in this direction. Other state level policies include improving school funding formulas, promoting mandate relief, and reducing barriers to regional collaboration. Rapid growth in poverty has severely impacted local resources in rural school districts. Because the state continues to base school funding on Need-Resource Capacity Categories from 2008, many rural school districts are improperly classified as being average-need. A better understanding of what it costs to educate students in poverty could help policymakers appropriately allocate funding. Improving the pupil weighting, along with incorporating more accurate data into the Foundation Aid formula and eliminating caps on the formulas used to calculate local resources, income, and wealth would yield a more valuable funding approach. More effective funding should be accompanied by mandate relief that frees districts from unnecessary burdens that strain their resources. NYSASBO supports legislation like the Shared Transportation Incentive, which would make regional collaboration easier. Finally, there are policies that could strengthen rural schools by strengthening their communities. For example, addressing the digital divide through aggressive expansion of rural broadband would help school students academically and socially, while simultaneously boosting the local economy.
NotesonSourcesandMethods: School enrollment data uses BEDS-Day enrollment data from the New York State Education Department, available at: http://www.p12.nysed.gov/irs/statistics/enroll-n-staff/home.html
School districts are classified as rural or non-rural based on their Sparsity Factor in the 2017-17 enacted budget. Districts with a Sparsity Factor greater than zero are treated as rural, while those with a score of zero are classified as non-rural.
Student poverty data draws on Small Area Income & Poverty Estimates produced by the census department as well as Free- and Reduced-Price Lunch Data.
County level data on population, age, and poverty comes from the decennial US Census as well as annual estimates from the American Community Survey.
New York State Association of School Business Officials | Declining Enrollment and Growing Poverty: Demographic Challenges Facing Rural Schools
11
The following staff contributed to the writing and production of this report:
DEBORAH CUNNINGHAM ANDREW VAN ALSTYNE
TOM TATUN
A publication of the New York State Association of School Business Officials.
© 2016 NYSASBO. All Rights Reserved.
For use of NYSASBO data or analyses, please use the following source citation:
SOURCE: New York State Association of School Business Officials, Albany, NY 12205, [Date of Release], www.nysasbo.org
Contact: Michael J. Borges, Executive Director
New York State Association of School Business Officials (NYSASBO) 453 New Karner Road, Albany, NY 12205 | 518-434-2281 | www.nysasbo.org