Embed Size (px)
Citation preview

1The Sentencing Project • 1705 DeSales Street NW, 8th Floor • Washington, D.C. 20036 • sentencingproject.org
POLICY BRIEF: YOUTH COMMITMENTS AND FACILITIES
Declines in Youth Commitments and Facilities in the 21st CenturyA major reduction has taken place in the number of teenagers committed to juvenile facilities in this century. At a time of increasing calls to cut the number of incarcerated adults by 50 percent over 10 years, the juvenile justice system has already attained this goal. Moreover, the decline has taken place without harming public safety.
Between 2001 and 2013, the number of juveniles committed to juvenile facilities after an adjudication of delinquency (or, as was the case for 413 juveniles, conviction in criminal court) fell from 76,262 to 35,659.1 Overall placements, which also include those juveniles held pre-adjudication, peaked in the year 2000 and have since fallen by 51 percent.
This represents a 54 percent decline since a 1999 peak and a 53 percent decline since 2001. As of
Figure 1. Juvenile Facilities and Placements, 1997-2013
0
20,000
40,000
60,000
80,000
100,000
120,000
201320112009200720052003200119991997
600
1,200
1,800
2,400
3,000
3,600
Facilities
Placements
Commitments
0
Yout
hN
umber of facilities
2012, these reductions led to a one-third reduction in the number of juvenile facilities since 2002.
Twenty-seven states, spread through every region, have attained a cut of 50 percent or more of their committed youth between 2001 and 2013, while only one state – North Dakota – and the District of Columbia have seen any increases at all. Eight states achieved reduction of at least two-thirds: Mississippi, Massachusetts, Louisiana, North
1 The Office of Juvenile Justice and Delinquency Prevention compiles data on juveniles in residential facilities using a one-day count, generally taken in late October. The nationwide count is available annually whereas some components of that overall count, including state-by-state counts, are only available on a biannual basis. Citation for most figures and tables in this paper: Sickmund, M., Sladky, T.J., Kang, W., and Puzzanchera, C. (2015) “Easy Access to the Census of Juveniles in Residential Placement.” Online. Available: http://www.ojjdp.gov/ojstatbb/ezacjrp/

2The Sentencing Project • 1705 DeSales Street NW, 8th Floor • Washington, D.C. 20036 • sentencingproject.org
POLICY BRIEF: YOUTH COMMITMENTS AND FACILITIES
Table 1. Juvenile Commitment Changes by State, 2001-2013
State 2001 2013 ChangeMississippi 546 144 -74%Massachusetts 804 234 -71%Louisiana 1,857 549 -70%North Carolina 1,029 315 -69%Tennessee 1,410 444 -69%New York 3,900 1,236 -68%Connecticut 483 156 -68%Illinois 2,697 873 -68%New Hampshire 177 60 -66%Wisconsin 1,590 558 -65%Vermont 33 12 -64%California 12,150 4,452 -63%Texas 6,801 2,577 -62%Indiana 2,346 912 -61%Florida 4,998 1,950 -61%Ohio 3,207 1,338 -58%Alabama 1,206 504 -58%Montana 201 84 -58%New Mexico 681 285 -58%Georgia 1,845 777 -58%Minnesota 1,557 675 -57%Michigan 2,739 1,224 -55%Oklahoma 630 282 -55%Washington 1,593 738 -54%Arizona 1,128 531 -53%United States 76,262 35,659 -53%New Jersey 1,029 507 -51%Alaska 237 117 -51%Rhode Island 261 132 -49%Nebraska 498 273 -45%Utah 747 411 -45%Delaware 147 81 -45%Hawaii 81 45 -44%South Carolina 981 567 -42%Maryland 810 471 -42%Wyoming 267 156 -42%Iowa 888 546 -39%Virginia 1,605 1,014 -37%Colorado 1,137 732 -36%South Dakota 399 267 -33%Maine 183 123 -33%Pennsylvania 3,285 2,337 -29%Nevada 552 396 -28%Kentucky 750 546 -27%Kansas 801 594 -26%Oregon 1,275 948 -26%Missouri 1,011 804 -20%Idaho 378 324 -14%West Virginia 354 309 -13%Arkansas 501 450 -10%North Dakota 150 156 4%District of Columbia 111 123 11%
Table 2. Juvenile Commitment Rates By State, 2013
State of Offense Committed Youth (per 100,000)Vermont 20Hawaii 34Massachusetts 36Connecticut 41North Carolina 41Mississippi 44New Hampshire 52New Jersey 54Tennessee 66Oklahoma 68Illinois 72Arizona 73Maryland 78Georgia 79Montana 84New York 87Delaware 90Texas 95Alabama 99Maine 99Washington 105Florida 106Wisconsin 107California 108Utah 108Ohio 109United States 114Minnesota 119Kentucky 120Virginia 122Indiana 126New Mexico 127Louisiana 128Rhode Island 131Michigan 133Colorado 134Nevada 134South Carolina 134Nebraska 136Arkansas 142Alaska 145Missouri 146Iowa 168Idaho 170West Virginia 178Kansas 186Pennsylvania 186North Dakota 231Oregon 245Wyoming 264District of Columbia 302South Dakota 302
Note: Approximately 2,000 juveniles are in commitments whose home states are not reported.
Note: Data may not include juveniles convicted as adults under some states’ transfer policies.

3The Sentencing Project • 1705 DeSales Street NW, 8th Floor • Washington, D.C. 20036 • sentencingproject.org
POLICY BRIEF: YOUTH COMMITMENTS AND FACILITIES
Carolina, Tennessee, New York, Connecticut, and Illinois.
While the factors contributing to these reductions vary by state, in general the decline is a function of both a drop in juvenile offending and a mix of policy and practice initiatives. Juvenile arrest rates fell 39 percent from 2000 to 2012 with roughly equivalent drops across major categories of offenses.
Many states have advanced reforms to decrease their committed populations. In Mississippi, a set of state and federal investigations that revealed deplorable conditions in state facilities prompted a reduction in the number of teenagers housed in the facilities and thus led to a sharp curtailment in the use of commitments for status offenses and technical
violations. Following passage of the Juvenile Justice Act of 2003, Louisiana currently uses a placement review process to ensure that teenagers are held in the least restrictive placement option.
Connecticut and Massachusetts raised the age of juvenile court jurisdiction to include 16- and 17-year olds and still saw a two-thirds drop in the number of committed juveniles. Advocates in Connecticut are now focused on closing the remaining large facilities in the state, citing both the treatment of the teenagers housed there and the lower effectiveness of secure placement on outcomes.
Despite the promising overall trend and some positive exceptions, there is little evidence that most states are reducing the proportion of commitments
Increase
0-33% decrease
34-66% decrease
67%+ decrease
Figure 2. Youth Commitment Changes by State, 2001-2013

4The Sentencing Project • 1705 DeSales Street NW, 8th Floor • Washington, D.C. 20036 • sentencingproject.org
POLICY BRIEF: YOUTH COMMITMENTS AND FACILITIES
for less serious offenders and reserving commitment only for their serious offenders. In 2001, 24 percent of all committed juveniles had been adjudicated on a violent offense; by 2013, that proportion had barely changed and is now 26 percent. Juvenile placement ought to be reserved for those who pose the greatest risk to public safety – but roughly three out of four committed teenagers are held for simple assault, property offenses, drug offenses, public order offenses, status offenses and technical violations.
300+
200-299
100-199
50-99
0-49
Figure 3. Youth Commitment Rate per 100,000 by State, 2013
RACIAL AND ETHNIC DISPARITIESAfrican American juveniles are nearly two-and-a-half times as likely to be arrested despite few differences in delinquent behaviors or status offenses. Researchers have found few group differences between youth of color and white youth regarding the most common categories of youth arrests.2 Still, differences exist regarding violent crimes, comprising five percent of juvenile arrests,
2 Lauritsen, J. L. (2005). Racial and ethnic difference in juvenile offending. In Hawkins, D. F. & Kempf-Leonard, K. (Eds.), Our children, their children: Confronting racial and ethnic differences in American juvenile justice (pp. 83- 104). Chicago: University of Chicago Press.
5The Sentencing Project • 1705 DeSales Street NW, 8th Floor • Washington, D.C. 20036 • sentencingproject.org
POLICY BRIEF: YOUTH COMMITMENTS AND FACILITIES
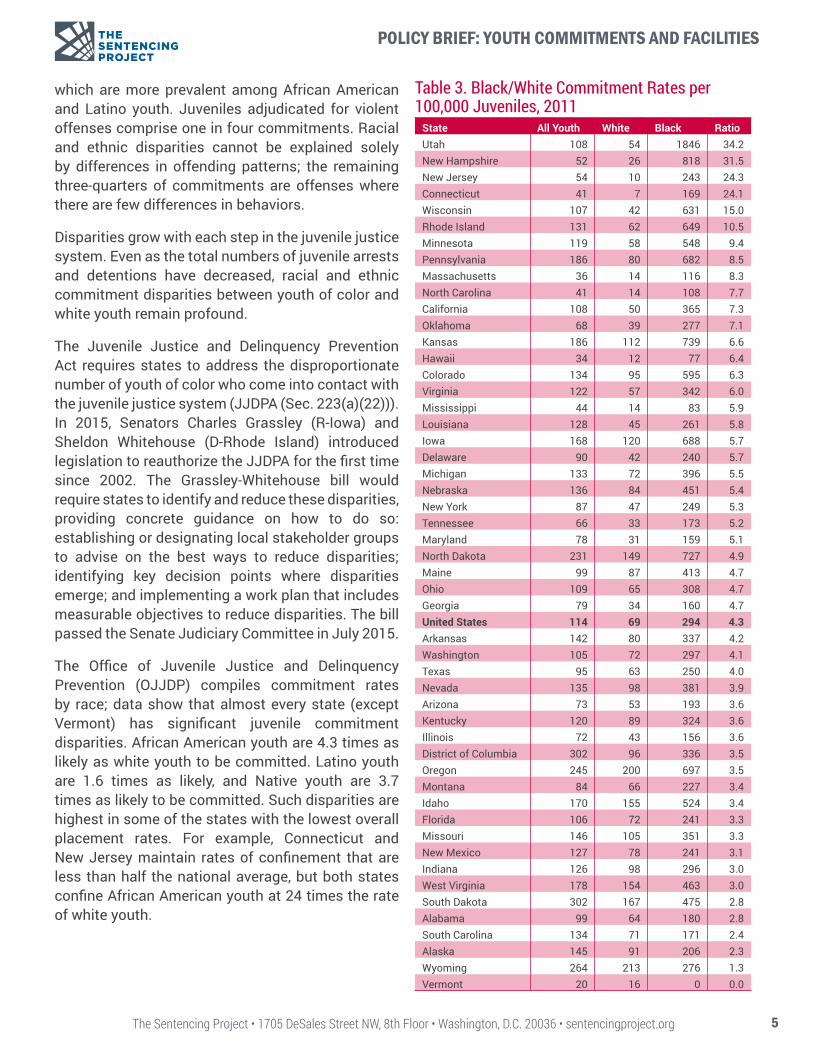
which are more prevalent among African American and Latino youth. Juveniles adjudicated for violent offenses comprise one in four commitments. Racial and ethnic disparities cannot be explained solely by differences in offending patterns; the remaining three-quarters of commitments are offenses where there are few differences in behaviors.
Disparities grow with each step in the juvenile justice system. Even as the total numbers of juvenile arrests and detentions have decreased, racial and ethnic commitment disparities between youth of color and white youth remain profound.
The Juvenile Justice and Delinquency Prevention Act requires states to address the disproportionate number of youth of color who come into contact with the juvenile justice system (JJDPA (Sec. 223(a)(22))). In 2015, Senators Charles Grassley (R-Iowa) and Sheldon Whitehouse (D-Rhode Island) introduced legislation to reauthorize the JJDPA for the first time since 2002. The Grassley-Whitehouse bill would require states to identify and reduce these disparities, providing concrete guidance on how to do so: establishing or designating local stakeholder groups to advise on the best ways to reduce disparities; identifying key decision points where disparities emerge; and implementing a work plan that includes measurable objectives to reduce disparities. The bill passed the Senate Judiciary Committee in July 2015.
The Office of Juvenile Justice and Delinquency Prevention (OJJDP) compiles commitment rates by race; data show that almost every state (except Vermont) has significant juvenile commitment disparities. African American youth are 4.3 times as likely as white youth to be committed. Latino youth are 1.6 times as likely, and Native youth are 3.7 times as likely to be committed. Such disparities are highest in some of the states with the lowest overall placement rates. For example, Connecticut and New Jersey maintain rates of confinement that are less than half the national average, but both states confine African American youth at 24 times the rate of white youth.
Table 3. Black/White Commitment Rates per 100,000 Juveniles, 2011
State All Youth White Black RatioUtah 108 54 1846 34.2New Hampshire 52 26 818 31.5New Jersey 54 10 243 24.3Connecticut 41 7 169 24.1Wisconsin 107 42 631 15.0Rhode Island 131 62 649 10.5Minnesota 119 58 548 9.4Pennsylvania 186 80 682 8.5Massachusetts 36 14 116 8.3North Carolina 41 14 108 7.7California 108 50 365 7.3Oklahoma 68 39 277 7.1Kansas 186 112 739 6.6Hawaii 34 12 77 6.4Colorado 134 95 595 6.3Virginia 122 57 342 6.0Mississippi 44 14 83 5.9Louisiana 128 45 261 5.8Iowa 168 120 688 5.7Delaware 90 42 240 5.7Michigan 133 72 396 5.5Nebraska 136 84 451 5.4New York 87 47 249 5.3Tennessee 66 33 173 5.2Maryland 78 31 159 5.1North Dakota 231 149 727 4.9Maine 99 87 413 4.7Ohio 109 65 308 4.7Georgia 79 34 160 4.7United States 114 69 294 4.3Arkansas 142 80 337 4.2Washington 105 72 297 4.1Texas 95 63 250 4.0Nevada 135 98 381 3.9Arizona 73 53 193 3.6Kentucky 120 89 324 3.6Illinois 72 43 156 3.6District of Columbia 302 96 336 3.5Oregon 245 200 697 3.5Montana 84 66 227 3.4Idaho 170 155 524 3.4Florida 106 72 241 3.3Missouri 146 105 351 3.3New Mexico 127 78 241 3.1Indiana 126 98 296 3.0West Virginia 178 154 463 3.0South Dakota 302 167 475 2.8Alabama 99 64 180 2.8South Carolina 134 71 171 2.4Alaska 145 91 206 2.3Wyoming 264 213 276 1.3Vermont 20 16 0 0.0
6The Sentencing Project • 1705 DeSales Street NW, 8th Floor • Washington, D.C. 20036 • sentencingproject.org
POLICY BRIEF: YOUTH COMMITMENTS AND FACILITIES
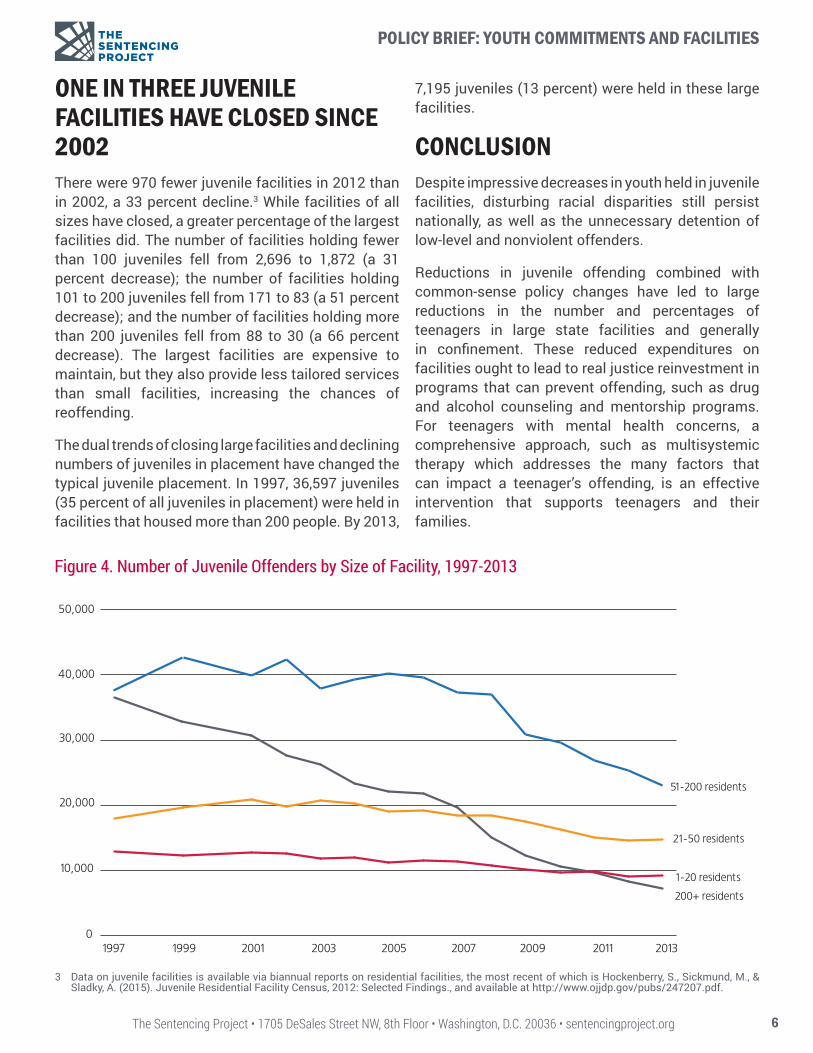
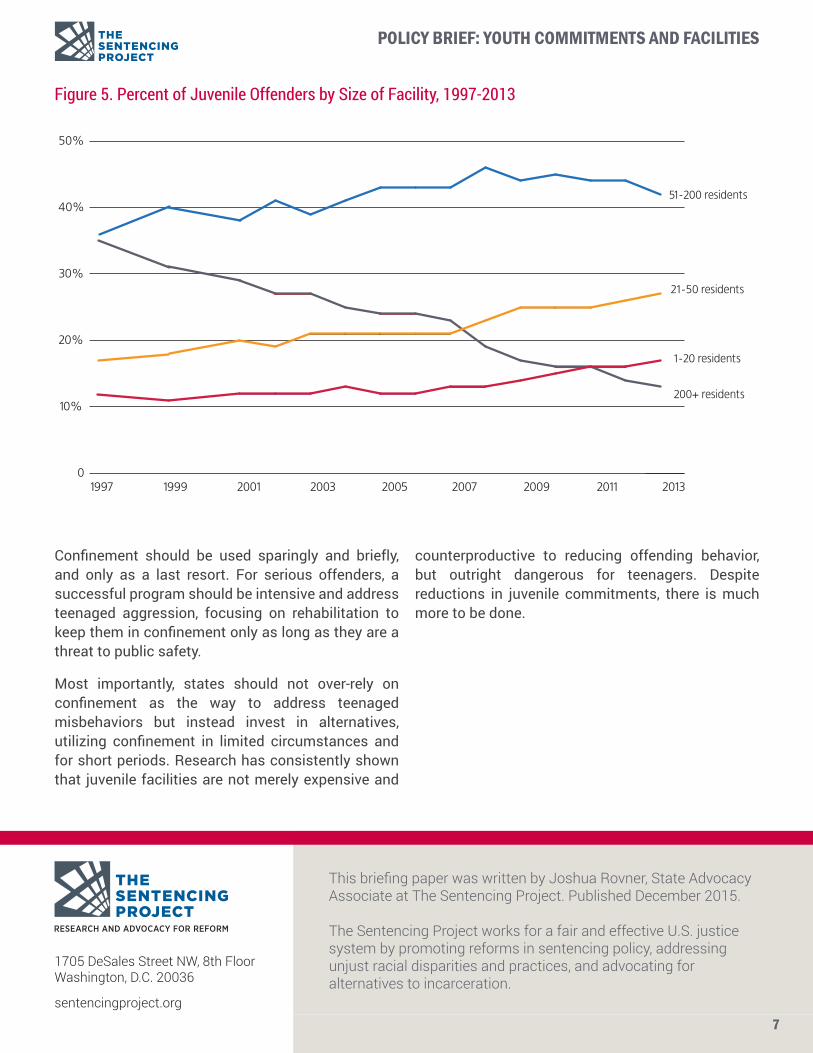
ONE IN THREE JUVENILE FACILITIES HAVE CLOSED SINCE 2002 There were 970 fewer juvenile facilities in 2012 than in 2002, a 33 percent decline.3 While facilities of all sizes have closed, a greater percentage of the largest facilities did. The number of facilities holding fewer than 100 juveniles fell from 2,696 to 1,872 (a 31 percent decrease); the number of facilities holding 101 to 200 juveniles fell from 171 to 83 (a 51 percent decrease); and the number of facilities holding more than 200 juveniles fell from 88 to 30 (a 66 percent decrease). The largest facilities are expensive to maintain, but they also provide less tailored services than small facilities, increasing the chances of reoffending.
The dual trends of closing large facilities and declining numbers of juveniles in placement have changed the typical juvenile placement. In 1997, 36,597 juveniles (35 percent of all juveniles in placement) were held in facilities that housed more than 200 people. By 2013,
7,195 juveniles (13 percent) were held in these large facilities.
CONCLUSIONDespite impressive decreases in youth held in juvenile facilities, disturbing racial disparities still persist nationally, as well as the unnecessary detention of low-level and nonviolent offenders.
Reductions in juvenile offending combined with common-sense policy changes have led to large reductions in the number and percentages of teenagers in large state facilities and generally in confinement. These reduced expenditures on facilities ought to lead to real justice reinvestment in programs that can prevent offending, such as drug and alcohol counseling and mentorship programs. For teenagers with mental health concerns, a comprehensive approach, such as multisystemic therapy which addresses the many factors that can impact a teenager’s offending, is an effective intervention that supports teenagers and their families.
Figure 4. Number of Juvenile Offenders by Size of Facility, 1997-2013
201320112009200720052003200119991997
51-200 residents
21-50 residents
1-20 residents
200+ residents
50,000
40,000
30,000
20,000
10,000
0
3 Data on juvenile facilities is available via biannual reports on residential facilities, the most recent of which is Hockenberry, S., Sickmund, M., & Sladky, A. (2015). Juvenile Residential Facility Census, 2012: Selected Findings., and available at http://www.ojjdp.gov/pubs/247207.pdf.
7The Sentencing Project • 1705 DeSales Street NW, 8th Floor • Washington, D.C. 20036 • sentencingproject.org
POLICY BRIEF: YOUTH COMMITMENTS AND FACILITIES
7
This briefing paper was written by Joshua Rovner, State Advocacy Associate at The Sentencing Project. Published December 2015.
The Sentencing Project works for a fair and effective U.S. justice system by promoting reforms in sentencing policy, addressing unjust racial disparities and practices, and advocating for alternatives to incarceration.
1705 DeSales Street NW, 8th FloorWashington, D.C. 20036
sentencingproject.org
Confinement should be used sparingly and briefly, and only as a last resort. For serious offenders, a successful program should be intensive and address teenaged aggression, focusing on rehabilitation to keep them in confinement only as long as they are a threat to public safety.
Most importantly, states should not over-rely on confinement as the way to address teenaged misbehaviors but instead invest in alternatives, utilizing confinement in limited circumstances and for short periods. Research has consistently shown that juvenile facilities are not merely expensive and
Figure 5. Percent of Juvenile Offenders by Size of Facility, 1997-2013
0
10%
20%
30%
40%
50%
201320112009200720052003200119991997
1-20 residents
21-50 residents
51-200 residents
200+ residents
counterproductive to reducing offending behavior, but outright dangerous for teenagers. Despite reductions in juvenile commitments, there is much more to be done.