Embed Size (px)
Citation preview

DECLARATION
I hereby declare that the project is based on my original work except for quotations and citations which have been duly acknowledged. I also declare that it has not been previously or concurrently submitted for any other degree at USM or any other institutions. _____________________ (Signature) NAME: YEAP GEOK PENG DATE: July 10, 2009

The Impact of Macroeconomic Volatility on Bursa Malaysia Volatility
Yeap Geok Peng
Universiti Sains Malaysia
Research report in partial fulfillment of the requirements for the degree of MBA
2009

i
ACKNOWLEDGEMENT
Foremost, I would like to express my sincere gratitude to my supervisor, Dr.
Hooy Chee Wooi for his continuous support throughout the completion of this thesis. He
has always been available to advise me. I am very grateful for his patience, motivation
and hard work. His guidance and professional knowledge have been of great value for
me all the time in writing this thesis.
My grateful thanks are also extended to all staffs at Graduate School of Business,
Universiti Sains Malaysia, for their assistance and information given to me. I would like
to convey my gratefulness to other lecturers who have been my instructors in MBA
program.
Lastly, my special gratitude is dedicated to my family members. Without their
encouragement and understanding it would have been impossible for me to finish this
work.
ii
TABLE OF CONTENTS ACKNOWLEDGEMENT........................................................................................... i TABLE OF CONTENTS ......................................................................................... vii LIST OF TABLES.................................................................................................... vii LIST OF FIGURES.................................................................................................. vii ABSTRAK ................................................................................................................ vii ABSTRACT ............................................................................................................. viii Chapter 1 INTRODUCTION......................................................................................1
1.1 Introduction........................................................................................................1 1.2 Background........................................................................................................2
1.2.1 What is stock market volatility? ..............................................................4 1.2.2 Macroeconomic Volatility ......................................................................8
1.3 Research Objectives ...........................................................................................8 1.4 Problem Statement ...........................................................................................10 1.5 Definition of Key Terms ..................................................................................12 1.6 Research Question............................................................................................14 1.7 Significance of the Study..................................................................................14 1.7 Organization of Remaining Chapters................................................................15
Chapter 2 LITERATURE REVIEW ........................................................................16
2.1 Introduction......................................................................................................16 2.2 Literature Review.............................................................................................17
2.2.1 Impact of macroeconomic fundamentals to the stock market performance 17 2.2.2 Impact of macroeconomic volatility to the stock market volatility.........19 2.2.3 Studies of the independent variables .....................................................23 2.2.4 Modeling the conditional volatility of stock market ..............................29
2.3 Theoretical Framework ....................................................................................32 2.3.1 Discounted Cash Flow Model ...............................................................32 2.3.2 Capital Asset Pricing Model and Asset Pricing Model ..........................34 2.3.3 Theoretical Model ................................................................................37
2.4 Hypotheses Development .................................................................................38 Chapter 3 METHODOLOGY...................................................................................43
3.1 Introduction......................................................................................................43 3.2 Variables and Data ...........................................................................................44 3.3 Measures..........................................................................................................45
3.3.1 Measurement of KLCI volatility............................................................45 3.3.2 Measurement for macroeconomic volatility ..........................................47

iii
3.4 Data Analyses ..................................................................................................51 3.4.1 Unit Root Test ......................................................................................51 3.4.2 Multiple Regression Analysis ...............................................................52
3.5 Population/Sample ...........................................................................................54 Chapter 4 RESULTS .................................................................................................63
4.1 Summary Statistic ............................................................................................63 4.2 Estimation Results for Volatility ......................................................................65 4.3 Summary Statistic for Volatility .......................................................................69 4.4 Unit Root Test..................................................................................................72 4.5 Multiple Regression Analysis ...........................................................................73
Chapter 5 DISCUSSIONS AND CONCLUSIONS .................................................84
5.1 Recapitulation of the Study Findings ................................................................84 5.2 Interpretation and Discussion ...........................................................................87 5.3 Policy Implications...........................................................................................90 5.4 Limitations.......................................................................................................92 5.5 Future Research ...............................................................................................92 5.6 Conclusion .......................................................................................................93
REFERENCES ..........................................................................................................95 APPENDIX A: Literature Reviewed ......................................................................101 APPENDIX B: The Components of Kuala Lumpur Composite Index .................107 APPENDIX C: Eviews Output................................................................................110
iv
LIST OF TABLES Table 1.1: The 20 Highest and Lowest KLCI Monthly Percentage Return, 1990-2008.... 5 Table 3.1: Source of Data ............................................................................................ 44 Table 4.1: Descriptive Statistics for all of the variables used, January 1990 – December 2008. ........................................................................................................................... 64 Table 4.2(a): Estimation results of KLCI volatility using International CAPM under GARCH models ........................................................................................................... 66 Table 4.2(b): Estimation results of macroeconomic volatility using GARCH models .... 67 Table 4.3: Descriptive Statistic for volatility of variables estimated using GARCH model.................................................................................................................................... 70 Table 4.4: ADF Unit root test....................................................................................... 72 Table 4.5: Parameter estimates results of KLCI volatility, January 1990 - December 2008 ............................................................................................................................ 74 Table 4.5a: Parameter estimates results of KLCI volatility, January 1990 - June 1997 (pre-crisis) ................................................................................................................... 77 Table 4.5b: Parameter estimates results of KLCI volatility, July 1997 - September 1998 (crisis I - flexible exchange rate) .................................................................................. 79 Table 4.5c: Parameter estimates results of KLCI volatility, October 1998 - June 2005(crisis II - fixed exchange rate)............................................................................. 81 Table 4.5d: Parameter estimates results of KLCI volatility, July 2005 - December 2008 (post crisis) .................................................................................................................. 83 Table A.1: Literature Reviewed on the relationship between macroeconomic fundamentals to the stock market performance........................................................... 101 Table A.2: Literature Reviewed on the relationship between macroeconomic volatility and stock market volatility ......................................................................................... 103 Table A.3: Literature Reviewed on the independent variables .................................... 105 Table B.1: Kuala Lumpur Composite Index Components (as of 2 June 2008)............. 107 Table C.1: Eviews output for regression analysis on full sample period (January 1990 to December 2008). ....................................................................................................... 110

v
Table C.2: Eviews output for regression analysis on pre-crisis (January 1990 to June 1997). ........................................................................................................................ 111 Table C.3: Eviews output for regression analysis on Crisis I (July 1997 to September 1998). ........................................................................................................................ 112 Table C.4: Eviews output for regression analysis on Crisis II (October 1998 to June 2005). ........................................................................................................................ 113 Table C.5: Eviews output for regression analysis on post crisis (July 2005 to December 2008). ........................................................................................................................ 114

vi
LIST OF FIGURES
Figure 1.1: 12-month rolling standard deviation for KLCI, January 1990 – December 2008. ............................................................................................................................. 6 Figure 1.2: 12-month rolling standard deviation and GARCH(1,1) conditional standard deviation for KLCI, January 1990 – December 2008...................................................... 7 Figure 1.3: Time series plot of the conditional volatility of all macroeconomic variables....................................................................................................................................... 9 Figure 2.1: Theoretical Model ..................................................................................... 37

vii
ABSTRAK
Kajian ini dijalankan untuk mengkaji kesan volatiliti makroekonomi terhadap volatiliti
Bursa Malaysia untuk data siri masa bulanan dari Januari 1990 ke Disember 2008.
Pembolehubah makroekonomi yang digunakan termasuk pengeluaran industri,
penawaran wang, kadar bunga, kadar pertukaran, kadar inflasi dan harga minyak. Kajian
ini dibahagikan kepada empat tempoh masa iaitu sebelum krisis, krisis I (kadar
pertukaran bebas), krisis II (kadar pertukaran tetap) dan selepas krisis. Kaedah yang
telah diaplikasikan dalam kajian ini untuk mangkaji kesan makroekonomi volatiliti
terhadap KLCI volatiliti ialah ICAPM dan GARCH untuk menjangka kadar pulangan
KLCI. Keputusan empirika menunjukkan volatiliti Bursa Malaysia dipengaruhi oleh
volatiliti makroeconomi. Volatiliti penawaran wang dibuktikan sebagai faktor yang kuat
untuk mempengaruhi volatiliti Bursa Malaysia sebelum krisis dan selepas krisis.
Volatiliti kadar bunga juga telah dibuktikan sebagai pengaruh volatiliti Bursa Malysia
sebelum krisis dan semasa krisis pada kadar pertukaran tetap.

viii
ABSTRACT
This study is undertaken with the objective to examine the behavior of Bursa Malaysia
volatility with respect to macroeconomic volatility for time series data cover period from
January 1990 to December 2008. The macroeconomic variables used include industrial
production, money supply, interest rate, exchange rate, inflation rate and oil price. The
analyses were divided into four sub-periods to include pre-crisis, crisis I (flexible
exchange rate), crisis II (fixed exchange rate), and post crisis. The approach adopted by
this study to examine the impact of macroeconomic volatility on KLCI volatility is
ICAPM with GARCH properties to estimate the KLCI return. The empirical findings
indicated that the Bursa Malaysia volatility was affected by macroeconomic volatility.
The volatility of money supply significantly influenced the Bursa Malaysia volatility
before crisis and after crisis while interest rate volatility significantly influenced Bursa
Malaysia volatility before crisis and during fixed exchange rate period.

1
Chapter 1
INTRODUCTION
1.1 Introduction
The performance of the stock market is influenced by many different factors. The
economic performance of a country is the most important factor which determines the
performance of the stock market. During an economic expansion, the stock market will
rise while during economic recession, the stock market will fall. Since the stock market
is very sensitive towards the economic growth of a country, it has become the topic of
interest for many researchers to study the relationship between macroeconomic
fundamentals and the stock market.
Generally, the stock prices do not behave constantly in its performance. It is
usually change by moving up and down. If the stock prices change rapidly over a short
period of time, it is considered to have high volatility. In contrast, if the stock prices are
almost constant or only have little changes, it is considered to have low volatility. So,
volatility has become the most important factor to consider in making investment
decision in stock market. The interesting question is that what factors have driven the
volatility in stock market?
With respect to the above question, this paper will investigate the behavior of the
Bursa Malaysian volatility which can be explained by the macroeconomic volatilities.

2
1.2 Background
Malaysia is a small trade-dependent economy with high response to global
development. Bursa Malaysia is the only stock exchange in Malaysia. It was formerly
known as Kuala Lumpur Stock Exchange (KLSE). Study about stock market is
commonly refers to the performance of stocks as a whole and most researchers use
Kuala Lumpur Composite Index (KLCI) as a measure of Bursa Malaysia performance.
This index is also an economic indicator which reflects the growth of Malaysian
economy.
The volatility of KLCI keeps changing with different cycle of economic. It is
believe that stock return volatility is related to economic condition. In Western country,
the concern about stock market volatility started after 1987 where the stock market in
the United States crashed on October 19, 1987 and stock prices dropped on October 13,
1989. While in Asia market, the study of volatility started during and after Asian
Financial Crisis 1997. In Malaysia, KLCI fell from the highest of 1216.72 at the end of
January 1997 to 594.44 at the end of December 1997, over 622 points.
Several factors may determine the changes in stock market volatility. Schwert
(1990) claims that stock market volatility reflect changes in financial leverage, operating
leverage, personal leverage and the condition of the economy. Volatility in the stock
market also associated with the arrival of new unanticipated information. Some
3
researchers also argue that stock volatility is caused by trading volume and short-term
trading activities in the domestic stock market.
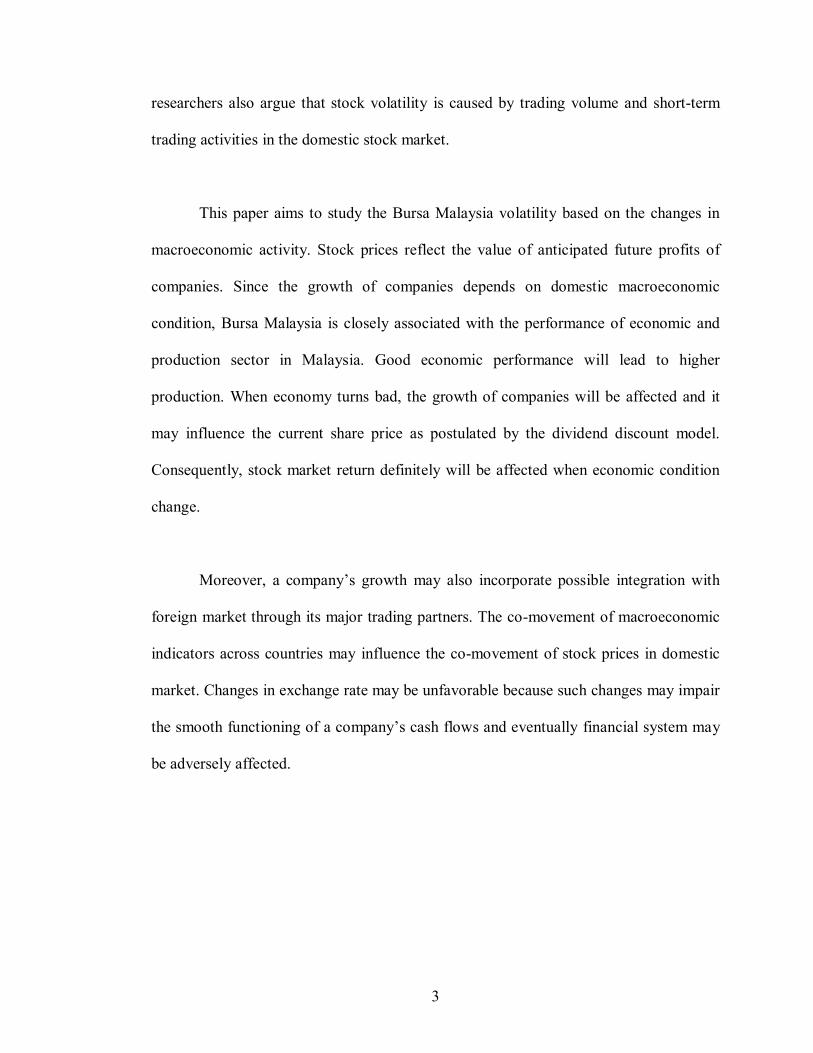
This paper aims to study the Bursa Malaysia volatility based on the changes in
macroeconomic activity. Stock prices reflect the value of anticipated future profits of
companies. Since the growth of companies depends on domestic macroeconomic
condition, Bursa Malaysia is closely associated with the performance of economic and
production sector in Malaysia. Good economic performance will lead to higher
production. When economy turns bad, the growth of companies will be affected and it
may influence the current share price as postulated by the dividend discount model.
Consequently, stock market return definitely will be affected when economic condition
change.
Moreover, a company’s growth may also incorporate possible integration with
foreign market through its major trading partners. The co-movement of macroeconomic
indicators across countries may influence the co-movement of stock prices in domestic
market. Changes in exchange rate may be unfavorable because such changes may impair
the smooth functioning of a company’s cash flows and eventually financial system may
be adversely affected.

4
1.2.1 What is stock market volatility?
A simple way to show stock market volatility is to measure the percentage
change in price or rate of return. Table 1.1 gives the 20 highest and lowest monthly
returns for KLCI from January 1990 to December 2008. As noted, April 1999 has the
largest monthly percentage increase in stock prices (29.44 percent). The next largest
change in stock prices occurred in August 1998, when stock prices dropped 28.46%
prior to the capital control on September 1, 1998. After the severe drops of stock prices
between 1997 and 1998, stock market rebounded in September 1998 with the fifth
largest gain in the sample (20.95%). This implies that the KLCI started to recover with
the introduction of capital control and fixed exchange rate imposed by the Malaysian
government.
In fact, volatility is considered as a measure of risk. As could be seen from Table
1.1, the higher the volatility of stock represent the higher the return. Basically, the
measurement of volatility is the standard deviation of return. As a measure of dispersion,
large value of standard deviation would mean large volatility and the probability of
getting high positive or negative return is large. Using standard deviation as a measure
for volatility, the volatility could be computed from the following formula:
n
iit RR
n 1
2)(1
1̂

5
Table 1.1:
The 20 Highest and Lowest KLCI Monthly Percentage Return, 1990-2008
Lowest Highest 1 Aug-98 -28.46% Apr-99 29.44% 2 Aug-97 -23.04% Feb-98 26.91% 3 Oct-97 -20.33% Dec-93 24.68% 4 Nov-97 -19.77% Nov-98 21.28% 5 Mar-94 -16.68% Sep-98 20.95% 6 Jun-98 -16.66% Dec-98 15.60% 7 Oct-08 -16.51% Oct-93 12.96% 8 Sep-90 -16.39% Jan-00 12.67% 9 Aug-90 -15.30% Feb-91 12.31% 10 May-98 -15.10% May-90 11.48% 11 Jan-94 -14.16% Apr-93 11.22% 12 Apr-98 -13.93% Oct-03 10.80% 13 Sep-99 -12.72% Jul-01 10.62% 14 Jul-98 -12.36% Feb-95 10.35% 15 Apr-90 -11.43% Apr-94 10.15% 16 Sep-01 -11.04% Dec-99 10.05% 17 Sep-00 -10.92% May-95 9.82% 18 Sep-02 -10.88% May-99 9.61% 19 Apr-97 -10.78% Oct-99 9.51% 20 Apr-01 -10.23% Aug-94 9.51%
where t̂ is the standard deviation of stock return; R is average stock return and iR is
the stock return at period i. This measure is a nonparametric measure of return volatility.
Officer (1973) apply 12-month rolling standard deviation to compute volatility of returns
over successive periods of time by rolling the window forward in time, that is drop
month 1 and add month 13. Figure 1.1 shows this simple method to compute the
volatility of KLCI from January 1990 to December 2008. One potential problem with
this approach is that the use of overlapping observations will create correlation between
standard deviation at different points in time.
6
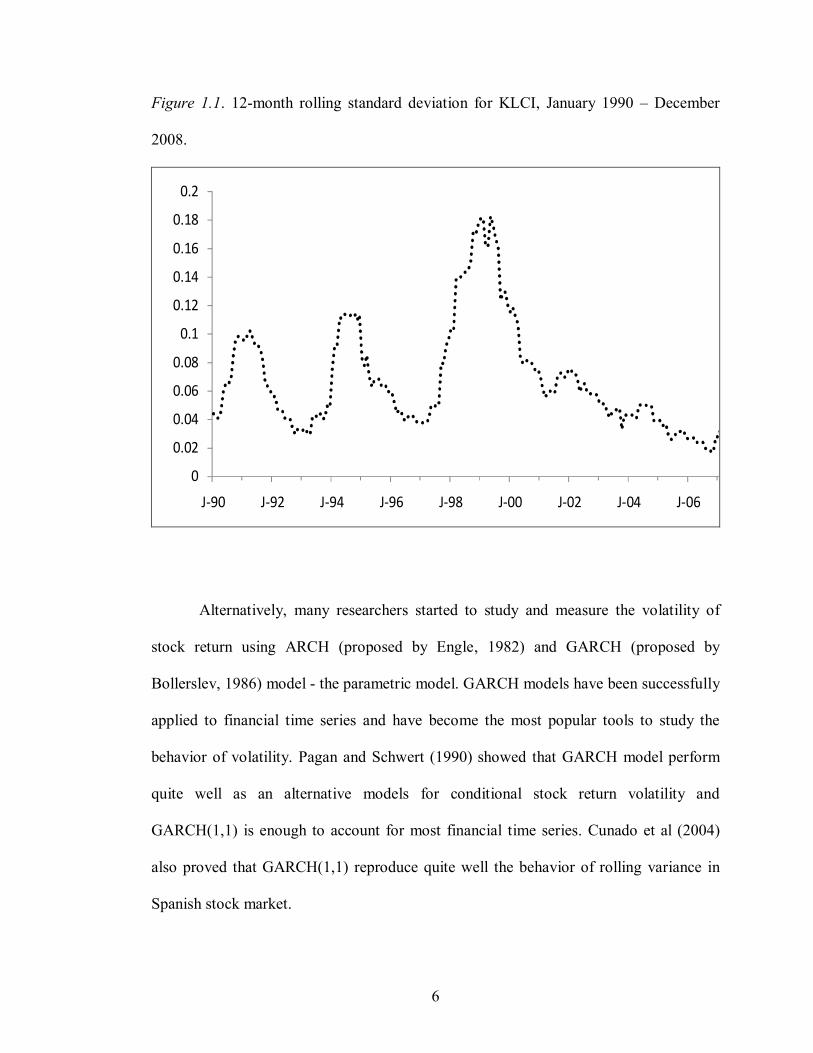
Figure 1.1. 12-month rolling standard deviation for KLCI, January 1990 – December
2008.
0
0.02
0.04
0.06
0.08
0.1
0.12
0.14
0.16
0.18
0.2
J-90 J-92 J-94 J-96 J-98 J-00 J-02 J-04 J-06
Alternatively, many researchers started to study and measure the volatility of
stock return using ARCH (proposed by Engle, 1982) and GARCH (proposed by
Bollerslev, 1986) model - the parametric model. GARCH models have been successfully
applied to financial time series and have become the most popular tools to study the
behavior of volatility. Pagan and Schwert (1990) showed that GARCH model perform
quite well as an alternative models for conditional stock return volatility and
GARCH(1,1) is enough to account for most financial time series. Cunado et al (2004)
also proved that GARCH(1,1) reproduce quite well the behavior of rolling variance in
Spanish stock market.

7
Figure 1.2 shows the 12-month rolling standard deviation of KLCI and the
standard deviation estimated by GARCH(1,1) model. Clearly, GARCH model could be
an alternative model to plot the standard deviation of KLCI. Comparing Figure 1.2 of
rolling standard deviation and GARCH standard deviation with Table 1.1, it can be seen
that months with extreme returns also have high standard deviations. In 1999, KLCI
volatility exceeded 16%. Months like April 1999 and February 1998 with highest return
also show up to have high volatility in Figure 1.1.
Figure 1.2. 12-month rolling standard deviation and GARCH(1,1) conditional standard
deviation for KLCI, January 1990 – December 2008.
0
0.02
0.04
0.06
0.08
0.1
0.12
0.14
0.16
0.18
0.2
J-90 J-92 J-94 J-96 J-98 J-00 J-02 J-04 J-06
12-month Rolling Standard Deviation

8
1.2.2 Macroeconomic Volatility
Figure 1.3 presents time series plots of conditional volatilities of all
macroeconomic variables used in the study. Most series display considerable time
variation in their volatilities. On particular, exchange rate and interest rate have high
volatility during Asian financial crisis. For instance, at first glance, KLCI volatility
appears to be related to interest rate volatility and exchange rate volatility during Asian
financial crisis since the volatility of these variables is high during the period. The
money supply volatility also coincides with KLCI volatility as it shows peaks during the
year 1994 and during financial crisis of 1998-1999. Alternatively, macroeconomic
volatility may well be related to stock return volatility and help to explain Bursa
Malaysia volatility.
1.3 Research Objectives
In view of the proposition of the relationship between macroeconomic and KLCI
volatility, this study will examine the impact of macroeconomic volatility and the Bursa
Malaysia volatility. The objectives of this study are:
1. To investigate the impact of macroeconomic volatilities to Bursa Malaysia
volatility.
2. To examine whether the relationship of macroeconomic volatilities and Bursa
Malaysia volatility varies across different sample periods.

9
Figure 1.3. Time series plot of the conditional volatility of all macroeconomic variables.
0.0
0.2
0.4
0.6
0.8
1.0
1.2
1.4
90 92 94 96 98 00 02 04 06 08
Conditional Volatility of Interest Rate
.00
.04
.08
.12
.16
.20
90 92 94 96 98 00 02 04 06 08
Conditional Volatility of Exchange Rate
.03
.04
.05
.06
.07
90 92 94 96 98 00 02 04 06 08
Conditional Volatility of Industrial Production
.010
.012
.014
.016
.018
.020
.022
.024
90 92 94 96 98 00 02 04 06 08
Conditional Volatility of Money Supply
.04
.08
.12
.16
.20
.24
.28
90 92 94 96 98 00 02 04 06 08
Conditional Volatility of Oil Price
0.0
0.4
0.8
1.2
1.6
2.0
2.4
2.8
90 92 94 96 98 00 02 04 06 08
Conditional Volatility of Inflation Rate

10
1.4 Problem Statement
The increasing globalization of the world has created economic growth in
Malaysia. Substantial development of technology allows traders and investors to react
quickly to any information. If the efficient market hypothesis holds, various sources of
news may have an impact on the stock market return. Moreover, as a result of
globalization, there are less restriction controls on asset market transaction and thus
increase capital flows between countries. New information spreads more quickly from
one financial market to another and thus accelerates the response of investors to the
information. The global investment world has caused stock prices to change quickly and
high levels of volatility in various markets including Malaysia. Stock market in Malaysia
is closely associated and integrated with international and global stock markets. Such
integration tends to provide price movement between international stock market and
could significantly reduce benefits from international portfolio diversification.
One important hypothesis raised by Schwert (1989, pp. 1115-1116), “Though
stock return volatility did not stem from innovations in dividends or discount rates, it
may be proportional to the volatility of expected future cash flows revealed in
macroeconomics factors like inflation, industrial production, money growth,
unemployment and other measures of economic activity.” In other words, any shock on
macroeconomic or macroeconomic volatility must impact the stock market volatility.
This raises the concern about the growth of a country’s economy and stability of

11
financial institutions. Extremely high volatility in economic could disorder the smooth
functioning of financial system.
As a result, the volatility of stock market is the most concern of investors,
analysts, brokers and dealers in Malaysia. Changes in the level of Bursa Malaysia
volatility which associated with higher risk could have important effects on capital
investment and consumption. It is not only important to investors and portfolio managers
but also to international economic and financial policy makers. Investors will always
check for volatility of stock prices and other variables in order to confirm whether they
could gain or loss. For example, if investors find that the exchange rate is too volatile,
there might be trouble for the trade sector, and thus the performance of the listed
companies that have substantial international trade or even international project might
get affected. This will spur selling pressures on the related companies and could
snowball into high stock market volatility. Another example is when interest rate is
changing frequently, and hence high interest rate volatility, investors in stock market
might find the cost of investing become high. They might shift to the bond market, and
hence the selling pressure will create stock market volatility as well.
High stock volatility could mean huge losses or gains and hence greater
uncertainty for the listed companies. Increase in the Bursa Malaysia volatility would
mean increase in the cost of business for the listed firms. On the other hand, it also
indicates an increase in the risk of equity investment and investors will shift their funds
to less risky asset such as property and bond. Moreover, high volatility appears to create
difficulty in decision making among policy makers since volatility will trigger higher

12
uncertainty. This is because the rising of stock prices are often expected but the falling
of stock prices are difficult to predict. Hence, structural and regulatory changes may be
necessary to increase the resiliency of Bursa Malaysia in term of greater volatility. As a
conclusion, knowledge of volatility becomes important in the measurement of risk.
This study attempts to find the linkages of macroeconomic volatility and Bursa
Malaysia volatility. Although many study in Malaysia examine the relationship between
macroeconomic variables and the stock market behavior, their study focus on
fundamentals macroeconomic causes on Bursa Malaysia. Researches in the past are also
aim to find out how to measure stock market volatility. There is less agreement on the
causes of macroeconomic volatility on Bursa Malaysia volatility. As such, this study
will fill in the gap of academic research in financial market by focusing on the issue of
volatility.
1.5 Definition of Key Terms
Volatility refers to conditional standard deviation of stock returns, percentage change in
exchange rate, growth rate of industrial production, growth rate of money supply,
percentage change in oil price, interest rate and inflation rate.
RKLCI,t is stock return at month t and it is defined as percentage change in stock price and
it is given as
1
logt
t
PP .

13
Exchange rate is defined as the price of Ringgit Malaysia in exchange for a unit of U.S.
Dollar. REXR,t is percentage change in exchange rate at month t and it is given
as
1
logt
t
EXREXR .
Industrial production is defined as output from industry sector. RIP,t is growth of
industrial production at month t and it is given as log
1t
t
IPIP
Money supply is the amount of money available in an economy. RM2 is growth of money
supply at month t and it is given as log
122
t
t
MM .
Oil price is the crude oil spot price per barrel. ROIL,t is percentage change in oil price at
month t and it is given as log
1t
t
OilOil
Interest rate is defined as rate of return promised by a borrower to a lender and BLRt is
interest rate at month t.
Inflation rate is defined as percentage change in the consumer price index from one
month to the next month and INFt is inflation rate at month t.

14
1.6 Research Question
The implication of this study is that there should be a relationship between
macroeconomic volatility and Bursa Malaysia volatility. The following research
question aim to find solution for the problem statement.
1. Does the macroeconomic volatility help to explain the Bursa Malaysia volatility
before crisis, during crisis flexible exchange rate, during crisis fixed exchange rate
period, and after crisis?
2. What are the key determinants that impact most to the Bursa Malaysia volatility
before crisis, during crisis flexible exchange rate, during crisis fixed exchange rate
period, and after crisis?
1.7 Significance of the Study
This study aims to examine the impact of macroeconomic volatility to the Bursa
Malaysia volatility. It is hoped that the findings of this study would provide some
meaningful insights to the body of knowledge, policy makers as well as practitioners.
This research findings will enhance the importance of the risk management and decision
analysis, specifically addresses the impact of macroeconomic volatility (as a component
of systematic risk) in the Bursa Malaysia.

15
By knowing which macroeconomic variables affect the Bursa Malaysia the most,
both personal and corporate investors would be able to allocate their resources to
increase profits and change their investment strategies according to the change of
monetary policy. For academic field, the result from this study would contribute to the
theoretical framework of the determinants of stock market volatility for emerging market
like Malaysia. For the policy implication, it is hoped that the findings would help the
regulatory bodies to better understand Bursa Malaysia volatility towards achieving the
desired goals.
1.7 Organization of Remaining Chapters
The structure of this paper is as follows. In Chapter 2, literature reviews of
previous studies, theoretical framework and hypotheses development. This paper begins
with a thorough literature review and establishes the theoretical and empirical
justification for modeling the stock market volatility and the macroeconomic volatility.
Chapter 3 describes the methodology used in this study by firstly discussing the
data set. Then, it is followed by the discussion on the measures of the volatility of KLCI
and the fundamental variables. Lastly, this chapter will discuss the data analysis which
include unit root test and multiple regression analysis for each sub-period.
Chapter 4 will report all the analysis result and the Chapter 5 will provide
discussions and concluding remarks based on the findings from Chapter 4. The
limitations and suggestions for future research are also provided in Chapter 5.

16
Chapter 2
LITERATURE REVIEW
2.1 Introduction
This chapter offers three major topics. Section 2.2 provides current and relevant
literature review. Section 2.3 and 2.4 are theoretical framework and hypothesis
development.
Section 2.2 offers a summary of the literature review on the research issue. There
are two categories of studies on macroeconomic influences on stock return. The first
category focuses on the impact of macroeconomic fundamentals to the stock market
return whereas the second category studies the causes of stock market volatility. This
chapter will also cover the literature on each of the variables and their relationship with
stock market.
Theoretical framework is discussed in Section 2.3. The underlying theory that
supports the relationship between macroeconomic volatility and stock return volatility is
provided in this section. Section 2.3 also provides further justification for the variables
chosen. One empirical model is developed for the purpose to study the relationship
between macroeconomic volatility and Bursa Malaysia volatility. Section 2.4 offers
hypothesis development. The directional relationship between macroeconomic volatility
and KLCI volatility is specified.

17
2.2 Literature Review
2.2.1 Impact of macroeconomic fundamentals to the stock market performance
Macroeconomic variables play a key role in determining stock market return in
Capital Asset Pricing Model (CAPM). A number of studies have investigated the stock
returns using macroeconomic variables and they show that there is a linkage between
macroeconomic condition and stock market return.
Rapach et al. (2005) examined a large set of macro variables and provided
evidence to show that stock can be predicted using macro variables. The macro variables
that they considered include inflation rate, money stocks, interest rates, terms spread,
industrial production and employment rate. They showed that interest rate was the most
consistent and reliable predictors of stock return across 12 industrialized countries
namely Belgium, Canada, Denmark, France, Germany, Italy, Japan, Netherlands,
Norway, Sweden, UK and US.
Chen (2009) further investigated the Standard & Poor’s S&P 500 price index and
suggested that interest rates and inflation rates were the most useful predictors of
recessions in the US stock market, according to both in-sample and out-of-sample
forecasting performance. The series of macroeconomic variables which have been
evaluated are interest rate spreads, inflation rates, money stocks, aggregate output,
unemployment rates, federal funds rates, federal government debts and nominal
exchange rates.

18
On the other hand, the relation between stock return and macroeconomic
variables for the ASEAN-5 countries (namely Indonesia, Malaysia, Philippines,
Singapore and Thailand) has been reported by Wongbangpo and Sharma (2002). They
explored both long-run and short-run relationships between the respective country’s
stock price indexes and macroeconomic variables of gross national product (GNP), the
consumer price index (CPI), the money supply, the interest rate, and exchange rate. They
found that all five stock price indexes are positively related to growth in output and
negatively to the aggregate price level for long-term and short-term. But a negative long-
run relationship between stock prices and interest rates was noted for the Philippines,
Singapore, and Thailand, and was found to be positive for Indonesia and Malaysia.
In Malaysia, the relation between stock returns and macroeconomic variables has
been broadly investigated by Ibrahim et al. (2001; 2003). Ibrahim and Wan Yusoff
(2001), attempted to evaluate the dynamic interactions among stock price (KLCI), the
exchange rate and three macroeconomic variables namely real output, price level and
money supply. By applying time-series techniques of cointegration and vector
autoregression (VAR), they found that macroeconomic variables and exchange rate
could improve the predictability of the Malaysian equity prices. Pyeman and Ahmad
(2007) also found that share price in Malaysian Stock Market is sensitive to
macroeconomic fundamental.
Moreover, Ibrahim and Aziz (2003) again investigated the relationship between
stock prices and industrial production, money supply, consumer price index, and
exchange rate. They had applied cointegration and Vector Autoregressive (VAR) on

19
monthly data from January 1977 to August 1998. Different with the study of Ibrahim
and Wan Yusoff (2001), this study implements rolling regressions of the VAR model to
gain further insights on the dynamics linkages among the stock prices and
macroeconomics variables. They found the presence of a long-run relationship between
these macroeconomic variables and the stock prices and substantial short-run
interactions among them.
Study by Abdul Rahman et al. (2009) recently highlighted clearer direction for
the relationship between macroeconomic and stock market. They showed that the
Malaysian stock market is sensitive to changes in the macroeconomic variables. They
claimed that money supply, exchange rate, reserves, interest rate and industrial
production have significant long run effects on Malaysia stock market under VECM
framework. They highlighted that the relation of KLCI with reserve and industrial
production is stronger compared to money supply, interest rate and exchange rate.
One obvious conclusion could be made based on the literature review in this
section. Macroeconomic could determine and predict stock market return but a standard
set of macroeconomic variables is not documented.
2.2.2 Impact of macroeconomic volatility to the stock market volatility
Following Schwert (1989), the relationship between macroeconomic volatility
and stock return volatility has been widely examined in many countries. The earliest

20
literature review was based on Chiang and Chiang (1996). Chiang and Chiang (1996)
examined the impact of predicted money growth volatility, predicted real output
volatility, predicted exchange rate volatility and predicted U.S. stock return volatility on
four countries stock return volatility (namely Canada, Japan, United Kingdom and
Germany). The findings from Chiang and Chiang (1996) showed that the correlation
between macroeconomic volatility and stock return volatility is weak but the U.S. stock
return volatility has a significant positive impact on those four countries’ stock return
volatility. Volatility of money supply growth and real income growth were found to
have some impact on stock return volatility.
Kearney and Daly (1998) examined the determinants of Australian stock market
volatility from July 1972 to January 1994. They presented evidence that conditional
volatility of interest rate and inflation rate are directly related to Australian stock market
volatility whereas money supply, industrial production and current account deficit are
indirectly related to Australian stock market volatility. Among these variables, money
supply was found to be the most significant variable but exchange rate had no significant
relationship with Australian stock market volatility.
Sardosky (2003) studied the macroeconomic determinants of technology stock
price volatility in U.S. technology stock price volatility. The empirical results shown by
Sardosky (2003) proved that the conditional volatilities of oil price movements, the term
premium and the consumer price index each have significant impact on conditional
volatility of technology stock prices. Sardosky (2003) concluded that macroeconomic
volatility can help to predict conditional stock market volatility.
21
In the United States, Beltratti and Monara (2006) documented S&P 500 returns
volatility and found strong existence of causality linkages from macroeconomic
volatility to stock market volatility but stock market volatility exercises only a limited
influence on macroeconomic volatility. The macroeconomic variables that they studied
are money growth, inflation, Federal funds rate and output growth. Particularly, the
prolonged period of high stock market volatility during the phase of economic expansion
is associated with an increase in money growth volatility.
The latest study includes Abugri (2008), investigates empirical relationship
between macroeconomic volatility and stock return four emerging market of Latin
America countries (Argentina, Brazil, Chile and Mexico). Using six-variable vector
autogressive (VAR) model, Abugri (2008) investigated a set of macroeconomic
indicators like exchange rates, interest rates, industrial production and money supply to
the stock returns. Besides the macroeconomic indicators, Abugri (2008) also considered
global factors and thus he included Morgan Stanley Capital International (MSCI) and
U.S. 3-month T-bill yield as a proxy for global factors. The results showed that volatility
of the stock market returns are generally high and that shocks from the country
macroeconomic variables are transmitted to the markets at varying magnitudes and
significance level. Also, the global factors appear to have the most consistent effects on
all the four markets. The global factors are more important than the domestic variables
in explaining return across markets.
The literature in Malaysia is still less compared to developed market. In Malaysia,
the relation between selected macroeconomic variables and stock market volatility has

22
been studied by Cheong and Tan (2000) and Tan and Law (2003). Cheong and Tan
(2000) examine the exchange rate, industrial production, inflation rate, interest rate and
money supply covering the monthly data from January 1991 to December 2001 and
found that these macroeconomic risks were significantly affected the stock excess return
in the post-crisis period. They also showed that the degree of persistence in shock was
lowered in the market during the post-crisis period. This paper typically studies the
linkage between stock excess return and macroeconomic volatility. Hence the links
between macroeconomic volatility and stock market volatility remain largely unstudied.
Other than that, Tan and Law (2003) employed the weekly data set from 2 May
1996 to 15 September 1999; only examined exchange rate risk and interest rate risk
impact on stock prices before and during the Asian financial crisis. The stock prices
were proxy by the three indices, namely Composite index, the EMAS index and the
Second Board Index. They applied Exponential-Generalized Autoregressive Conditional
Heteroskedasticity (EGARCH) model to estimate the volatilities of exchange rates and
interest rates. Using the VAR model to analyze the dynamic impact of the variables,
they found that the volatility of exchange rate and interest rate were not leading the stock
prices (CI, EMAS and Second Board) before the crisis. Also, the impact of exchange
rate volatility on KLSE stock prices was more significant than the interest rate volatility
during the Asian crisis. Again, this paper only examines the impact of exchange and
interest rates volatility on stock prices and hence ignores to document the relation of
macroeconomic volatility and stock return volatility.

23
However, there are studies reveal that macroeconomic volatility cannot explain
stock return volatility. Schwert (1989) identified and showed empirically that there is no
strong evidence of a relation between stock market volatility and other measure of
economic volatility such as inflation and money growth volatility for the U.S. stock
market. In United Kingdom, the relationship between conditional stock market volatility
and conditional macroeconomic volatility was examined by Morelli (2002). Using
Autoregressive Conditional Heteroscedastic (ARCH) models, Morelli (2002) examined
U.K. data covering the period January 1967 to December 1995 and concluded that the
volatility in the macroeconomic variables (namely industrial production, real retail sales,
money supply, inflation and exchange rates) do not explain the volatility in the stock
market in the UK.
As a summary on this section, studies in developed countries found mixed result
on the relationship between macroeconomic volatilities and stock return volatility.
However, the studies in Malaysia were limited to macroeconomic volatilities impact on
stock return or excess return. Study on the impact of macroeconomic volatilities to stock
return volatility in Malaysia is still subject to further research.
2.2.3 Studies of the independent variables
Exchange rate
The study of the impact of exchange rates to the stock market has been examined
by many researchers. Lee and Solt (2001) showed that German, Japanese, and U.S.
excess stock returns vary directly with changes in the real terms of trade as well as with

24
exchange rate changes induced by the macroeconomic factors. In German and US and to
some extent Japanese, real excess stock returns vary directly with the exchange rate
factors indicating that currency depreciation (appreciation) leads to higher (lower) stock
returns (Lee & Solt, 2001). They studied a data of 288 observations from December
1972 to December 1996 and stock return indices namely Frankfurt Exchange, Tokyo
Stock Exchange and S&P400 Industrial Stock Price Index have been examined.
Pan et al. (2007) examined seven East Asian countries including Hong Kong,
Japan, Korea, Malaysia, Singapore, Taiwan and Thailand, for the period from January
1988 to October 1998. They found significant causal relation from exchange rates to
stock prices for Hong Kong, Japan, Malaysia and Thailand before the 1997 Asian crisis.
They also found that, during the Asian crisis, all countries except Malaysia show a
causal relation from exchange rates to stock prices while no country shows a significant
causality from stock prices to exchanges rates. These findings show that there is causal
relation from exchange rates to stock prices before crisis but there is no causal relation
during crisis in Malaysia.
Moreover, Ghazali et al. (2008) also examined the relationship between stock
prices and exchange rates in Malaysia for the period before Asian crisis (December 3,
1993 – July 1, 1997), during Asian crisis (July 2, 1997 – September 1, 1998) and after
Asian crisis (July 22, 2005 – June 8, 2007) or when Malaysia ringgit was unpegged. The
Toda-Yamamoto causality test found that there is no causality during the pre-crisis and
crisis periods but there is a uni-directional causality running from stock prices to
exchange rates after the 1997 crisis. Ghazali et al. (2008) and Pan et al. (2007)