Embed Size (px)
Citation preview


PARTNERSHIP
Present for
• kickoff call
• milestone (sprint)
delivery
Time Commitment:
30 mins. - 1 hr. kickoff
30 mins. - 1 hr. sprint reviews
Executive
Sponsor
Engaged stakeholder
Provides
• Clarification when needed
• Feedback loop mid sprint
• Internal coordination
• Data preparation (if DD is not
engaged in this phase)
Time Commitment:
5-10 hours per week
Project
Champion
Provides credentials/access to
necessary systems and databases before
project start date. SLA expectations.
IT
Resource
Business data subject matter expert.
Provides data dictionary if available.
Time Commitment: 1-2 hours per week
DatabaseAdministrator
You may play one or
many of these roles

DATA
INTEGRITY
REPORTING &
INSIGHT
One denormalized flat data source• Join or Union tables before bringing into Power BI
• Speed of data retrieval dramatically improves
• Allows maximum flexibility for development and user experience
DD has the expertise to address
business challenges below the surface

DD ITERATIVE APPROACH

DESIGN &DEVELOPMinimum Viable Product (MVP)
2 White Board Wireframe
Power BI Draft Iteration
Power BI Final Iteration
3
4
“Each iteration has a purpose and an
outcome. These steps will save
time and increase
value.”
1 Planning Session

STEP 1
PLANNING SESSION
Time Committed: 1-2 hours
1 Identify the path to success.
• What is our objective? What is our primary business challenge?
• Analyze our audience to understand their behaviors and actions
• What kind of value will this dashboard drive within the organization?

During this session, you will Identify the following:
1. Objective2. Audience and Behavior3. Priority Questions4. Other Requirements
STEP 1
PLANNING SESSION

STEP 2
WHITE BOARDWIREFRAMETime Committed: 2-3 hours
2 Optimize time and create vision.
• Understand the dashboard layout, visual hierarchy and flow
• Identify data necessary and advise on optimal data model
• More of what you want/need and less of “that’s not what I was expecting (the negative kind)”

STEP 3
FUNCTIONALDRAFT ITERATIONTime Committed: 10-16 hrs.
3 Align wireframe with a functional outcome.
• Ensure the integrity of the data
• Align functionality with desired user experience
• Build a backlog

STEP 4
FUNCTIONALFINAL ITERATIONTime Committed: 8-12 hours
4 Implement feedback, polish and introduce.
• Implement change requests from draft iteration
• Complete a design audit for final polish
• Provide direction and UAT guidance

Increased Value
Publish Content to
Power BI Server/Online• Review key capabilities
for user adoption
User Training and
Content Promotion• Review key capabilities
for user adoption
• User onboarding
Enablement &
Mentoring• Review key capabilities
for user adoption
• Data source best
practices
• How-to documentation
and videos
• Learn DD’s iterative
approach and design tips
Center for Excellence• Implement a reporting environment
that will scale
• Learn optimal data models and
options for security
• Optimize data sources to make life
easy for users and developers alike
• Analyze and monitor user adoption
through custom dashboards
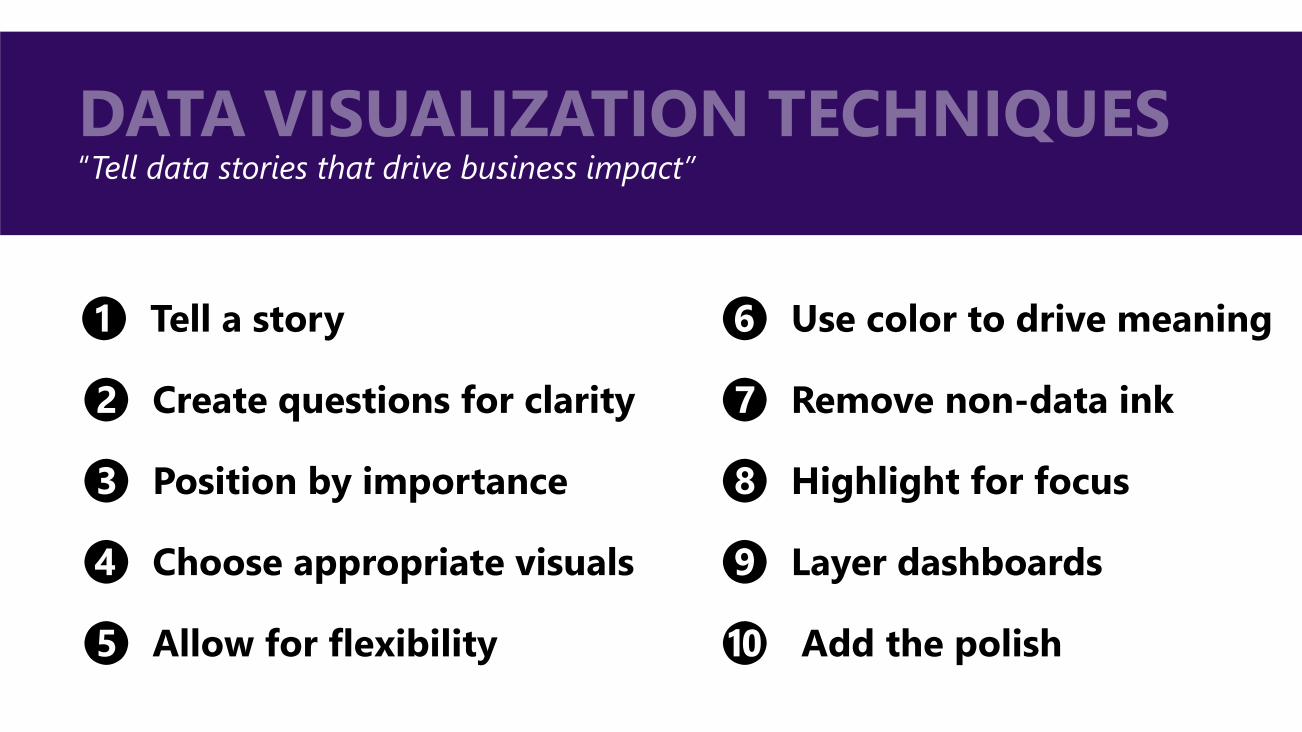
“Tell data stories that drive business impact”
❻ Use color to drive meaning
❼ Remove non-data ink
❽ Highlight for focus
❾ Layer dashboards
❿ Add the polish
❶ Tell a story
❷ Create questions for clarity
❸ Position by importance
❹ Choose appropriate visuals
❺ Allow for flexibility