Embed Size (px)
Citation preview
1
1 2 3
Decisions in motion: Vestibular 4
contributions to saccadic target selection 5
6
Running head: Decisions in Motion 7
8
Liliana Rincon-Gonzalez1, Luc P.J. Selen1, Koen Halfwerk1, Mathieu 9
Koppen1, Brian D. Corneil2, W. Pieter Medendorp1 10
11
1 Radboud University, Donders Institute for Brain, Cognition and Behaviour, 12 Nijmegen, The Netherlands 13 2 Departments of Physiology & Pharmacology, and Psychology, Brain and 14 Mind Institute, Robarts Research Institute, Western University, London, ON, 15 Canada 16 17
18 19 20
Corresponding author: 21 Pieter Medendorp 22
Donders Institute for Brain, Cognition and Behaviour 23 P.O. Box 9104, NL-6500 HE, Nijmegen 24
The Netherlands 25 Phone: +31 24 361 6041 26 FAX: +31 24 361 6066 27
Email: [email protected] 28 29 30 Number of pages: 32 31 Number of figures: 6 32 Number of tables: 0 33 34 35 36 37
Articles in PresS. J Neurophysiol (June 8, 2016). doi:10.1152/jn.01071.2015
Copyright © 2016 by the American Physiological Society.

2
Abstract 38 39
The natural world continuously presents us with many opportunities for action, 40
thus a process of target selection must precede action execution. While there has 41
been considerable progress in understanding target selection in stationary 42
environments, little is known about target selection when we are in motion. Here we 43
investigated the effect of self-motion signals on saccadic target selection in a 44
dynamic environment. Human subjects were sinusoidally translated (f=0.6 Hz, 30 cm 45
peak-to-peak displacement) along an inter-aural axis using a vestibular sled. During 46
the motion two visual targets were presented asynchronously but equidistantly on 47
either side of fixation. Subjects had to look at one of these targets as quickly as 48
possible. Using an adaptive approach, the time delay between these targets was 49
adjusted until the subject selected both targets equally often. We determined this 50
balanced time delay for different phases of the motion in order to distinguish the 51
effects of body acceleration and velocity on saccadic target selection. Results show 52
that acceleration (or position, as these are indistinguishable during sinusoidal 53
motion), but not velocity, affect target selection for saccades. Subjects preferred to 54
look at targets in the direction of the acceleration – the leftward target was preferred 55
when the sled accelerated to the left, and vice versa. Saccadic reaction times 56
mimicked this selection bias by being reliably shorter to targets in the direction of 57
acceleration. Our results provide evidence that saccade target selection mechanisms 58
are modulated by self-motion signals, which could be derived directly from the otolith 59
system. 60
61
New & Noteworthy 62
The neural mechanisms of decision-making for actions have been studied 63
extensively, but mostly when the subject is stationary. Our results directly examine 64
decision-making in a dynamic environment, i.e. when the subject is in motion. 65
Findings emphasize the impact of vestibular information on decision-making, 66

3
extending the importance of this sensory modality beyond its known role in reflexive 67
responses and spatial orientation, and opening up new avenues for 68
neurophysiological investigations. 69
70
71
72

4
Introduction 73 74 The natural world continuously presents us with many potential targets for action, 75
necessitating a decision process that selects one target for execution. This selection 76
can be influenced by both bottom-up factors, such as sensory information and 77
saliency, and top-down influences, such as internal goals or expectations based on 78
rewards and costs (Glimcher, 2003; Bisley and Goldberg, 2010; Padoa-Schioppa, 79
2011; Schall et al., 2011; Sumner, 2011 for reviews). Signatures of these influences 80
are often seen in behavioral performance. For example, in the saccadic system, 81
stimulus intensity and contrast influence reaction time (Boch et al., 1984; Carpenter, 82
1988; Burr and Corsale, 2001; Bell et al., 2006; Marino et al., 2012), likely reflecting a 83
bottom-up effect. Conversely, reaction times are reduced when targets are 84
anticipated or more rewarding, which may reflect a top-down effect (Basso and 85
Wurtz, 1998; Dorris and Munoz, 1998; Rezvani and Corneil, 2008; Bray and 86
Carpenter, 2015). 87
While these selection mechanisms have mostly been studied in stationary 88
subjects, many of our saccadic decisions are made while we are in motion, for 89
example during walking or in a moving vehicle. The study of saccadic decisions in 90
such a dynamic (from a self-motion perspective) environment has received little 91
study, although such dynamic situations could introduce a host of new bottom-up and 92
top-down influences. 93
One likely source of influence in dynamic situations could be the vestibular 94
system, the sensor in the inner ear that detects linear and angular acceleration of the 95
head (Angelaki and Cullen, 2008). It is known that the vestibular system interacts 96
with eye movements to stabilize gaze (Galiana and Guitton, 1992; Paige et al., 1998; 97
Angelaki et al., 1999), and the brainstem circuits for saccades and quick-phase 98
responses converge in the brainstem burst generator (Scudder et al., 2002). Such 99
low-level overlap between vestibular and saccadic circuits within the brainstem may 100
impose strong bottom-up, reflexive, influences on saccadic decisions. 101
5
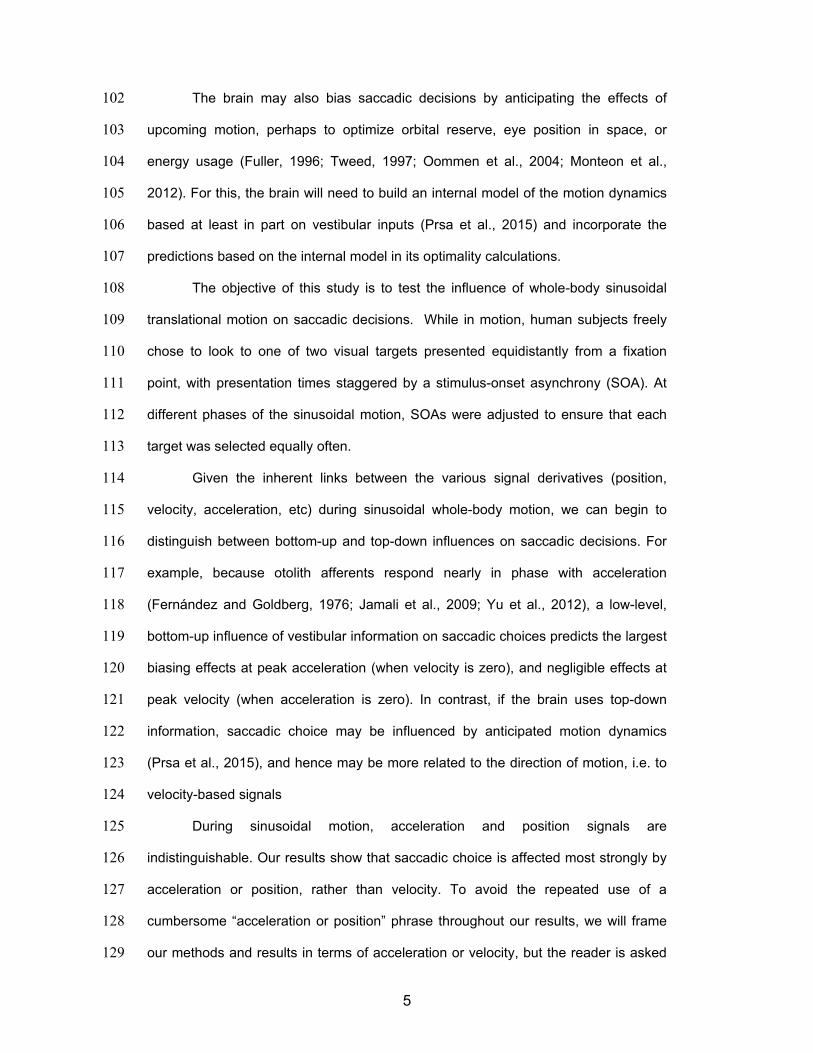
The brain may also bias saccadic decisions by anticipating the effects of 102
upcoming motion, perhaps to optimize orbital reserve, eye position in space, or 103
energy usage (Fuller, 1996; Tweed, 1997; Oommen et al., 2004; Monteon et al., 104
2012). For this, the brain will need to build an internal model of the motion dynamics 105
based at least in part on vestibular inputs (Prsa et al., 2015) and incorporate the 106
predictions based on the internal model in its optimality calculations. 107
The objective of this study is to test the influence of whole-body sinusoidal 108
translational motion on saccadic decisions. While in motion, human subjects freely 109
chose to look to one of two visual targets presented equidistantly from a fixation 110
point, with presentation times staggered by a stimulus-onset asynchrony (SOA). At 111
different phases of the sinusoidal motion, SOAs were adjusted to ensure that each 112
target was selected equally often. 113
Given the inherent links between the various signal derivatives (position, 114
velocity, acceleration, etc) during sinusoidal whole-body motion, we can begin to 115
distinguish between bottom-up and top-down influences on saccadic decisions. For 116
example, because otolith afferents respond nearly in phase with acceleration 117
(Fernández and Goldberg, 1976; Jamali et al., 2009; Yu et al., 2012), a low-level, 118
bottom-up influence of vestibular information on saccadic choices predicts the largest 119
biasing effects at peak acceleration (when velocity is zero), and negligible effects at 120
peak velocity (when acceleration is zero). In contrast, if the brain uses top-down 121
information, saccadic choice may be influenced by anticipated motion dynamics 122
(Prsa et al., 2015), and hence may be more related to the direction of motion, i.e. to 123
velocity-based signals 124
During sinusoidal motion, acceleration and position signals are 125
indistinguishable. Our results show that saccadic choice is affected most strongly by 126
acceleration or position, rather than velocity. To avoid the repeated use of a 127
cumbersome “acceleration or position” phrase throughout our results, we will frame 128
our methods and results in terms of acceleration or velocity, but the reader is asked 129

6
to keep in mind that an alternative phrasing in terms of position is conceivable. In the 130
Discussion, we will forward arguments for while we prefer to interpret our results in 131
terms of acceleration rather than position. 132
133
134
Methods 135
136
Twenty healthy subjects (7 males, 13 females, aged 19-32 yrs.) with normal or 137
corrected-to-normal vision and free of any known sensory, perceptual, or motor 138
disorders participated in this study. Seventeen of them were naïve as to the purpose 139
of the experiment. All participants gave their written informed consent in accordance 140
with the institutional guidelines of the ethics committee of the Social Sciences Faculty 141
of Radboud University. Participants were given both a written and oral description of 142
the task as well as practice trials. Each subject participated in two sessions of 143
approximately 60 minutes each, which were completed on different days. 144
145
Experimental setup 146
Participants performed a saccadic target selection task in a completely dark room 147
(except for the target lights) while sitting on a custom-built vestibular sled that moved 148
side-to-side along a magnetic track, aligned to the subjects’ inter-aural axis. The sled 149
chair was mounted on a linear motor (TB15N; Technotion, Almelo, The Netherlands) 150
that was controlled by a Kollmorgen S700 drive (Danaher, Washington, DC). 151
Participants were restrained using a five-point seat belt and their head was firmly 152
fixated to the sled using an over-ear headphone, which also provided feedback 153
during the experiment. Emergency buttons on either side of the chair allowed 154
participants to stop the motion at any time if needed. The vestibular sled moved 155
sinusoidally with an amplitude of 0.15 m and a period of 1.6 s, which resulted in peak 156
velocity and peak acceleration of 0.6 m/s and 2.3 m/s2, respectively. 157
7
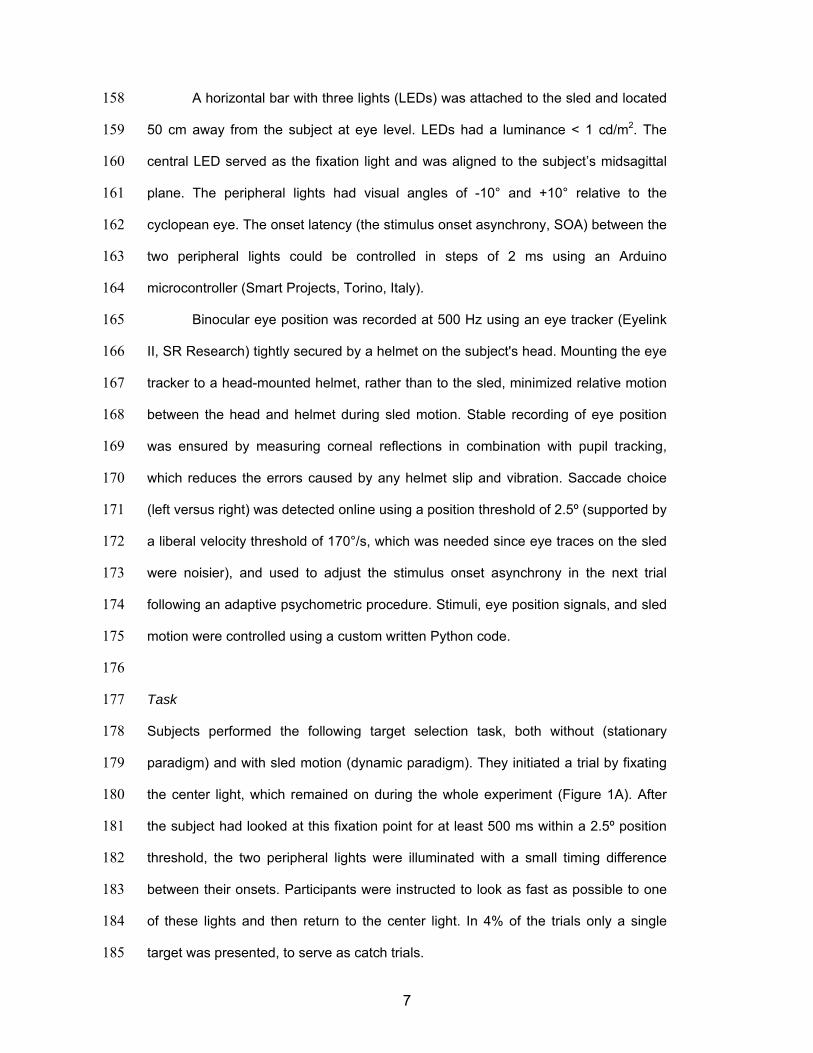
A horizontal bar with three lights (LEDs) was attached to the sled and located 158
50 cm away from the subject at eye level. LEDs had a luminance < 1 cd/m2. The 159
central LED served as the fixation light and was aligned to the subject’s midsagittal 160
plane. The peripheral lights had visual angles of -10° and +10° relative to the 161
cyclopean eye. The onset latency (the stimulus onset asynchrony, SOA) between the 162
two peripheral lights could be controlled in steps of 2 ms using an Arduino 163
microcontroller (Smart Projects, Torino, Italy). 164
Binocular eye position was recorded at 500 Hz using an eye tracker (Eyelink 165
II, SR Research) tightly secured by a helmet on the subject's head. Mounting the eye 166
tracker to a head-mounted helmet, rather than to the sled, minimized relative motion 167
between the head and helmet during sled motion. Stable recording of eye position 168
was ensured by measuring corneal reflections in combination with pupil tracking, 169
which reduces the errors caused by any helmet slip and vibration. Saccade choice 170
(left versus right) was detected online using a position threshold of 2.5º (supported by 171
a liberal velocity threshold of 170°/s, which was needed since eye traces on the sled 172
were noisier), and used to adjust the stimulus onset asynchrony in the next trial 173
following an adaptive psychometric procedure. Stimuli, eye position signals, and sled 174
motion were controlled using a custom written Python code. 175
176
Task 177
Subjects performed the following target selection task, both without (stationary 178
paradigm) and with sled motion (dynamic paradigm). They initiated a trial by fixating 179
the center light, which remained on during the whole experiment (Figure 1A). After 180
the subject had looked at this fixation point for at least 500 ms within a 2.5º position 181
threshold, the two peripheral lights were illuminated with a small timing difference 182
between their onsets. Participants were instructed to look as fast as possible to one 183
of these lights and then return to the center light. In 4% of the trials only a single 184
target was presented, to serve as catch trials. 185

8
The SOA was adjusted across trials based on the directional responses in the 186
preceding trials using an adaptive approach (Psi procedure, Kontsevich and Tyler, 187
1999). This method updates posterior probabilities after every trial in the two-188
dimensional (mean, slope) parameter space of psychometric functions in order to 189
compute for each possible SOA the expected information to be gained by completion 190
of a trial with this SOA. On each trial the method selects the SOA that maximizes this 191
expected information. While the number of trials for a particular SOA is not constant 192
in this procedure, it converges quickly and determines the mean and slope in fewer 193
trials than a fixed interval approach. The mean indicates the stimulus onset 194
asynchrony for which a given subject selected both targets equally often. We refer to 195
this value as the balanced time delay (BTD). In the dynamic paradigm (see below), 196
SOAs for different phases of motion were adjusted independently. SOAs could vary 197
between -250 to 250 ms in steps of 2 ms. In practice, we found that the choice 198
preference plateaued at choices for |SOA|>150 ms, with subjects always looking to 199
the first stimulus. These large SOA trials in combination with the single target ‘catch’ 200
trials ensured that subjects were paying attention to visual stimuli and making 201
choices based on each trial’s visual input instead of a predefined directional choice. 202
Accordingly, trials with |SOA|>150 ms were combined with single target ‘catch’ trials. 203
A self-paced pause of about 1 min was provided every 100 trials 204
(approximately every 5 minutes), during which the sled was stationary and the room 205
lights were turned on in order to avoid dark adaptation. After every pause, the Eyelink 206
system underwent drift correction. In all trials, auditory feedback was given to inform 207
participants if they responded too fast (reaction time < 100ms relative to the 208
presentation of the first target), too slow (saccade reaction time > 450ms), or looked 209
in the non-target direction during catch trials. If a trial was not performed according to 210
these criteria, it was repeated at the next instance of the corresponding motion 211
phase. 212
213
9
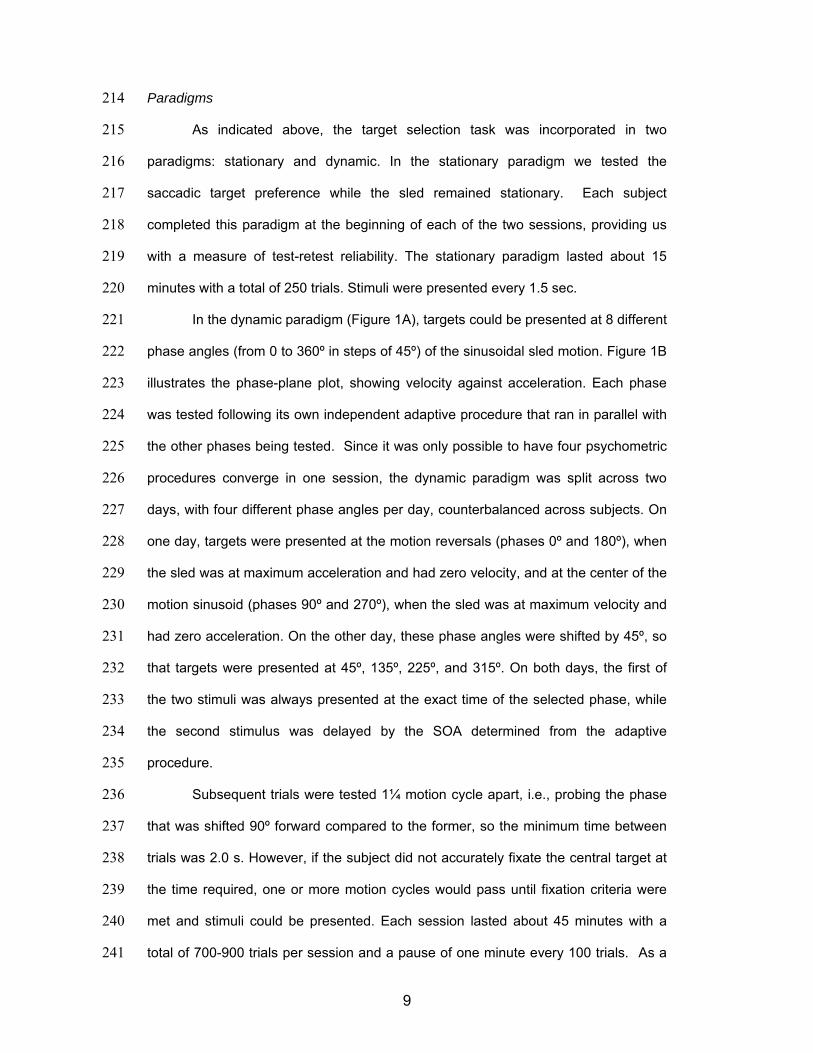
Paradigms 214
As indicated above, the target selection task was incorporated in two 215
paradigms: stationary and dynamic. In the stationary paradigm we tested the 216
saccadic target preference while the sled remained stationary. Each subject 217
completed this paradigm at the beginning of each of the two sessions, providing us 218
with a measure of test-retest reliability. The stationary paradigm lasted about 15 219
minutes with a total of 250 trials. Stimuli were presented every 1.5 sec. 220
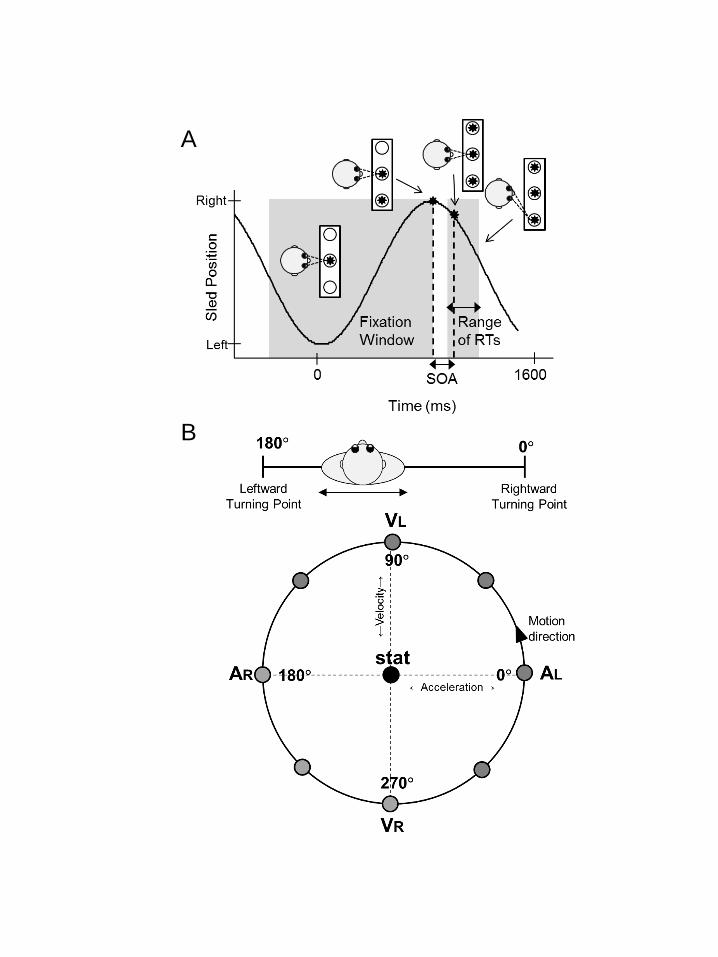
In the dynamic paradigm (Figure 1A), targets could be presented at 8 different 221
phase angles (from 0 to 360º in steps of 45º) of the sinusoidal sled motion. Figure 1B 222
illustrates the phase-plane plot, showing velocity against acceleration. Each phase 223
was tested following its own independent adaptive procedure that ran in parallel with 224
the other phases being tested. Since it was only possible to have four psychometric 225
procedures converge in one session, the dynamic paradigm was split across two 226
days, with four different phase angles per day, counterbalanced across subjects. On 227
one day, targets were presented at the motion reversals (phases 0º and 180º), when 228
the sled was at maximum acceleration and had zero velocity, and at the center of the 229
motion sinusoid (phases 90º and 270º), when the sled was at maximum velocity and 230
had zero acceleration. On the other day, these phase angles were shifted by 45º, so 231
that targets were presented at 45º, 135º, 225º, and 315º. On both days, the first of 232
the two stimuli was always presented at the exact time of the selected phase, while 233
the second stimulus was delayed by the SOA determined from the adaptive 234
procedure. 235
Subsequent trials were tested 1¼ motion cycle apart, i.e., probing the phase 236
that was shifted 90º forward compared to the former, so the minimum time between 237
trials was 2.0 s. However, if the subject did not accurately fixate the central target at 238
the time required, one or more motion cycles would pass until fixation criteria were 239
met and stimuli could be presented. Each session lasted about 45 minutes with a 240
total of 700-900 trials per session and a pause of one minute every 100 trials. As a 241
10
result, with this design, targets were presented ~175-225 times at a given phase of 242
motion. 243
244
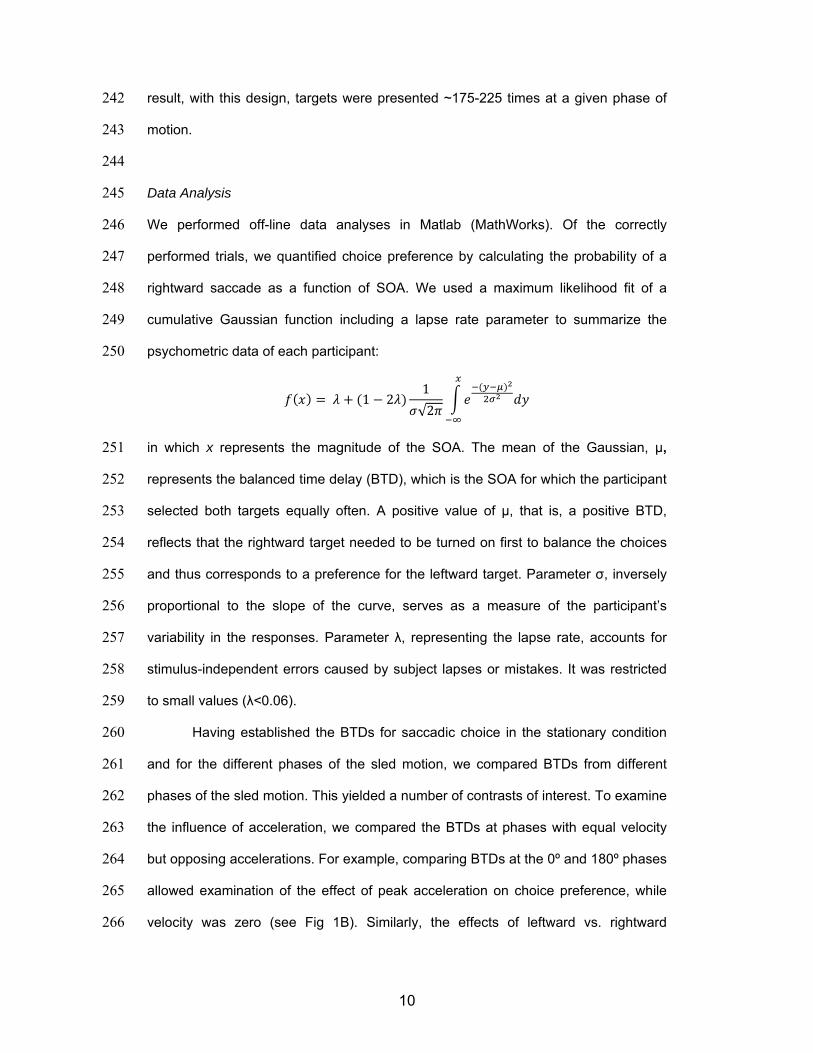
Data Analysis 245
We performed off-line data analyses in Matlab (MathWorks). Of the correctly 246
performed trials, we quantified choice preference by calculating the probability of a 247
rightward saccade as a function of SOA. We used a maximum likelihood fit of a 248
cumulative Gaussian function including a lapse rate parameter to summarize the 249
psychometric data of each participant: 250
( ) = + (1 − 2 ) 1√2 ( ) in which x represents the magnitude of the SOA. The mean of the Gaussian, μ, 251
represents the balanced time delay (BTD), which is the SOA for which the participant 252
selected both targets equally often. A positive value of μ, that is, a positive BTD, 253
reflects that the rightward target needed to be turned on first to balance the choices 254
and thus corresponds to a preference for the leftward target. Parameter σ, inversely 255
proportional to the slope of the curve, serves as a measure of the participant’s 256
variability in the responses. Parameter λ, representing the lapse rate, accounts for 257
stimulus-independent errors caused by subject lapses or mistakes. It was restricted 258
to small values (λ<0.06). 259
Having established the BTDs for saccadic choice in the stationary condition 260
and for the different phases of the sled motion, we compared BTDs from different 261
phases of the sled motion. This yielded a number of contrasts of interest. To examine 262
the influence of acceleration, we compared the BTDs at phases with equal velocity 263
but opposing accelerations. For example, comparing BTDs at the 0º and 180º phases 264
allowed examination of the effect of peak acceleration on choice preference, while 265
velocity was zero (see Fig 1B). Similarly, the effects of leftward vs. rightward 266

11
acceleration were also investigated by comparing the BTDs of 45° vs. 135° (same 267
leftward velocity) and 315° vs. 225° (same rightward velocity). 268
We used a similar approach to examine the influence of velocity, comparing 269
BTDs with equal accelerations but opposing velocities. For example, comparing 270
BTDs of 90º vs. 270º phases tested for an influence at peak velocity, when 271
acceleration was zero, while the 45° vs. 315° and 135° vs. 225° comparisons tested 272
other leftward vs. rightward velocities at equal, non-zero, accelerations (see Figure 273
1B). In addition we analyzed the stationary and dynamic data in combination using a 274
2-way ANOVA containing three levels of acceleration (leftward, zero, rightward) and 275
three levels of velocity (leftward, zero, rightward) (see Figure 1B). 276
After documenting these results, we computed, separately for each subject, 277
as an overall dependency measure the correlation between his/her BTDs and the 278
acceleration and velocity amplitudes at each of the probed phases. We tested 279
whether mean correlations differed significantly from zero using a t-test on the Fisher 280
z-transformed correlation coefficients from the 20 individual subjects. 281
If the BTD results indicate a choice bias, one could also expect the reaction 282
time to differ between saccades to preferred and non-preferred targets. Targets at 283
preferred locations would be processed faster than targets at non-preferred locations. 284
To test this, we defined saccadic reaction time (SRT) as the time interval between 285
the onset of the saccade target and the initiation of the saccade. We further 286
computed, per subject, for all phases of the motion, the difference between the 287
average SRT for the leftward and rightward target, denoted by ΔSRT. We used a 288
correlation analysis, similar to that described as above, to examine the relationship 289
between ΔSRT and acceleration, and ΔSRT and velocity, at each of the probed 290
phases. This analysis was performed separately for each subject. 291
To further test whether the saccades are the outcome of a decision process, 292
we examined whether a linear race model could account for the observed SRTs 293
(Carpenter and Williams, 1995). To this end, we measured the SRTs in catch trials 294

12
and in trials with │SOA│>150 ms (which we considered as single-target trials, see 295
Task section above). The SRT distributions of these trials were assumed to be 296
directly related to the rate and variance of rise of an internal decision signal from a 297
single target. Using this information, we then modeled a race with two decision 298
processes arising from two targets, staggering the second process by the SOA. From 299
these races, we selected trials in which the process for the second stimulus won the 300
race, calculated predicted SRT distributions of saccades to the second target as a 301
function of SOA, and then compared the predicted and observed SRTs using a 302
correlation analysis. 303
304
Results 305
We investigated the effect of passively-induced sinusoidal body translations on 306
saccadic target selection by measuring subjects’ selection bias in a two-alternative 307
forced choice task. Using an adaptive approach, the stimulus onset asynchrony 308
(SOA) of these targets for the different phases of motion was adjusted until the 309
participant selected both targets equally often, which corresponds to the Balanced 310
Time Delay (BTD). 311
At the beginning of each of two sessions we performed a stationary paradigm 312
to quantify the test-retest reliability of the BTD across the two days of the experiment. 313
Figure 2 illustrates the probability of a rightward saccade as a function of SOA in a 314
single subject, and the fitted psychometric curve, separately for sessions tested in 315
the first and second day. Circle size represents the number of trials for in a given bin 316
of SOA. The psychometric fits provide an estimate of the balanced time delay (BTD) 317
for each session, which is the SOA at which the subject equally often chooses to 318
make a rightward or leftward saccade. In this subject, the respective BTDs did not 319
change much across sessions (3 vs 6 ms). The same was found across all subjects. 320
The mean BTD was -1 ms on day 1 and 6 ms on day 2. A paired samples t-test 321

13
revealed no significant differences between the BTDs in the two sessions (t(19)=-1.3, 322
p=0.2). This result confirms the consistency of the BTD across days. 323
We next investigated the effects of whole body motion on saccadic choice 324
preference at 8 different phase angles of sled motion, which probed different 325
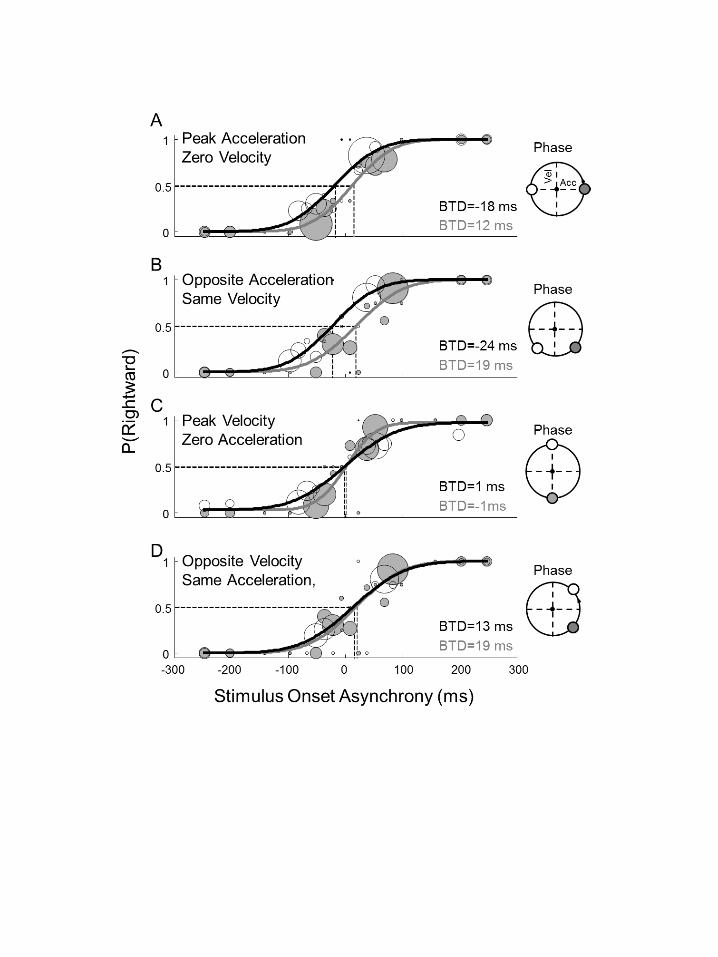
combinations of whole body acceleration and velocity. Figure 3 presents data from a 326
representative subject. Figure 3A shows that at peak acceleration, when the subject 327
crossed the right turning point and accelerated to the left (gray circles and fitted 328
curve), the right target needed to be turned on earlier (BTD = 12 ms) than the left to 329
balance left- and rightward saccadic choices. Thus, the subject’s choice bias was 330
toward the left target. In contrast, the left target needed to be turned on earlier when 331
the subject crossed the left turning point (open circles, black fit curve), accelerating to 332
the right (BTD = -18 ms). Thus, the subject’s choice bias was toward the right target. 333
Since velocity is the same (zero) in both these conditions, this finding suggests that 334
this subject’s preference for saccadic targets depends on the direction of acceleration 335
and not velocity. 336
Figure 3B shows the choice biases at the 225° and 315° phases, which also 337
have different directions of acceleration while sharing the same velocity (here, 338
rightward). Qualitatively we see the same pattern as above: when accelerating to the 339
left (phase 315º), the right target needed to be turned on earlier than the left (BTD = 340
19 ms) to obtain equally balanced choices. When accelerating to the right, the left 341
target needed to be turned on earlier than the right (BTD = -24 ms). 342
Such choice biases were virtually absent at peak velocity, i.e. at zero 343
acceleration (phase 90º and 270º). As shown in Figure 3C, leftward and rightward 344
targets needed to be switched on about simultaneously to balance saccadic choices, 345
irrespective of whether the subject’s velocity was to the right (filled circle, BTD = 1 346
ms) or to the left (open circle, BTD = -1 ms). This result suggests that velocity alone 347
does not affect the subject’s preferences. BTDs were also very similar in two other 348
phases featuring opposite directions of velocity but the same acceleration. Figure 3D 349
14
illustrates this for the 45° and 315° phases, showing BTDs of 13 and 19 ms, 350
respectively. 351
Together, this subject’s data suggest that the selection bias reverses with the 352
direction of the acceleration, rather than with the direction of motion. Leftward 353
accelerations, i.e. the motion toward and away from the right turning point (see 354
Figure 1B) biases selection to the leftward targets; rightward accelerations, i.e. 355
motion toward and away from the left turning point, biases the preference to 356
rightward targets. 357
358
Acceleration affects choice bias 359
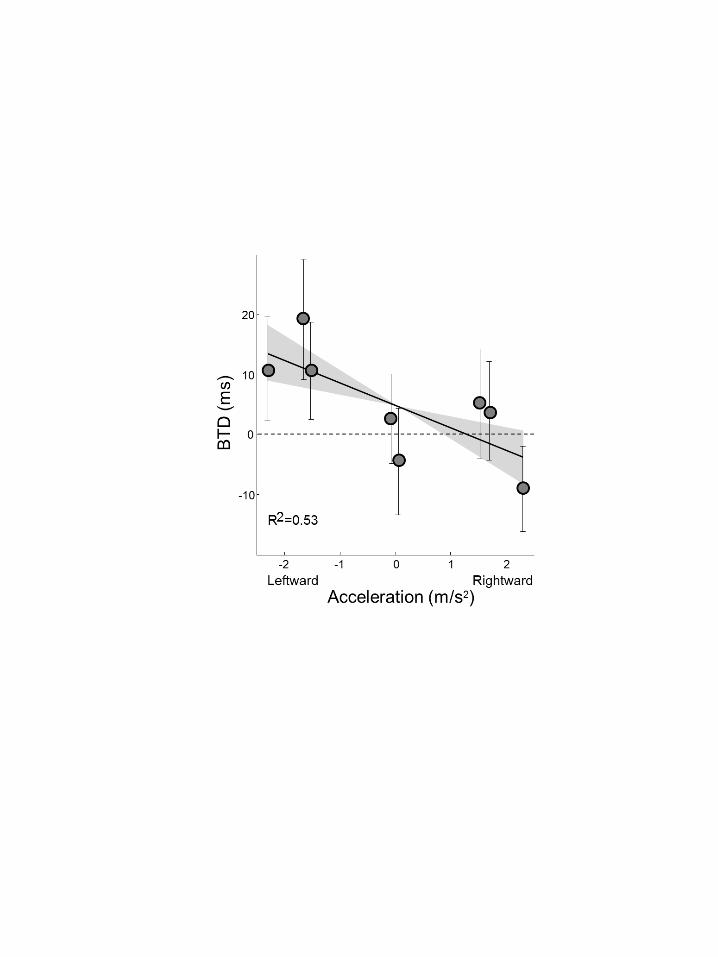
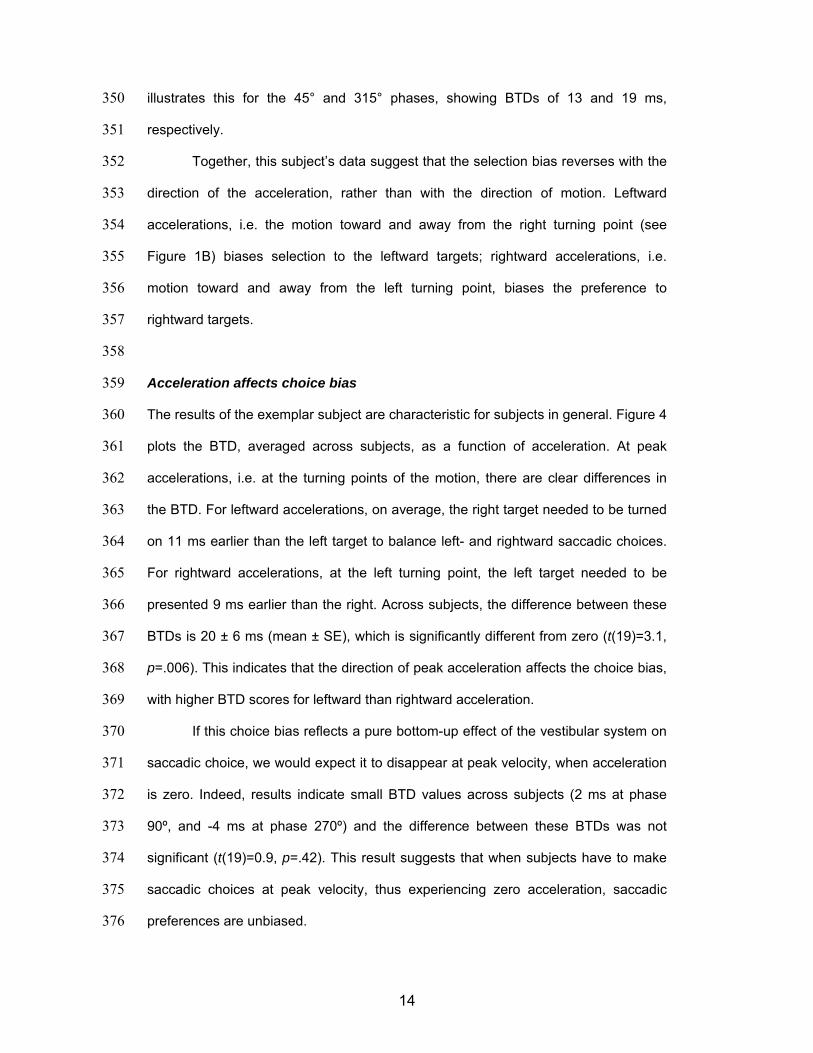
The results of the exemplar subject are characteristic for subjects in general. Figure 4 360
plots the BTD, averaged across subjects, as a function of acceleration. At peak 361
accelerations, i.e. at the turning points of the motion, there are clear differences in 362
the BTD. For leftward accelerations, on average, the right target needed to be turned 363
on 11 ms earlier than the left target to balance left- and rightward saccadic choices. 364
For rightward accelerations, at the left turning point, the left target needed to be 365
presented 9 ms earlier than the right. Across subjects, the difference between these 366
BTDs is 20 ± 6 ms (mean ± SE), which is significantly different from zero (t(19)=3.1, 367
p=.006). This indicates that the direction of peak acceleration affects the choice bias, 368
with higher BTD scores for leftward than rightward acceleration. 369
If this choice bias reflects a pure bottom-up effect of the vestibular system on 370
saccadic choice, we would expect it to disappear at peak velocity, when acceleration 371
is zero. Indeed, results indicate small BTD values across subjects (2 ms at phase 372
90º, and -4 ms at phase 270º) and the difference between these BTDs was not 373
significant (t(19)=0.9, p=.42). This result suggests that when subjects have to make 374
saccadic choices at peak velocity, thus experiencing zero acceleration, saccadic 375
preferences are unbiased. 376

15
If the hypothesis that acceleration, not velocity, biases choice is accepted we 377
can make two predictions when comparing other phases of motion (45°, 135°, 225°, 378
and 315°). The first prediction is that choice bias should be the same for comparisons 379
featuring the same (non-zero) acceleration, even if velocity is different. This was 380
confirmed. Comparing the BTDs between leftward (45°, 135°) and rightward (225°, 381
315°) velocity, pooled across acceleration directions revealed no significant 382
differences (F(1,19)=0.87, p=0.36). The second prediction is that choice biases 383
should be different for comparisons featuring different accelerations but the same 384
(non-zero) velocities. This was also confirmed by comparing the BTDs between 385
leftward (45°, 315°) and rightward (135°, 225°) acceleration, pooled across velocity 386
directions (F(1,19)=10.05, p=0.005), with the overall mean BTD for leftward 387
acceleration (14.9 ms) higher than the BTD for rightward acceleration (4.5 ms). 388
We also analyzed stationary and dynamic data together by employing a 3x3 389
design, i.e. a 2-way ANOVA with factors acceleration and velocity. Because of the 390
reliability of the day 1 and day 2 stationary data, we collapsed these two data sets 391
into one averaged stationary BTD score for each subject. In combination with the 392
eight dynamic conditions, this yields three conditions for each direction of 393
acceleration, leftward (0º, 45°, 315°), zero (90°, 270°, stationary), and rightward 394
(135º, 180º, 225º). Similarly, there are three conditions for each direction of velocity, 395
leftward (45°, 90°, 135°), zero (0°, 180°, stationary), and rightward (225°, 270°, 396
315°). The BTD data were analyzed in a corresponding 3x3 acceleration by velocity 397
Repeated Measures Anova, using Greenhouse-Geisser corrected p values. This 398
analysis resulted in a significant main effect of acceleration (F(2,37.1)=8.5 p=.001), 399
with leftward accelerations having significantly higher BTD scores than rightward 400
accelerations; BTDs for zero acceleration fell in between. There was no indication of 401
a main effect of velocity (p=0.28) or an interaction effect between velocity and 402
acceleration (p=.21). All of this confirms the previous results on the individual 403
contrasts of different phases. 404
16
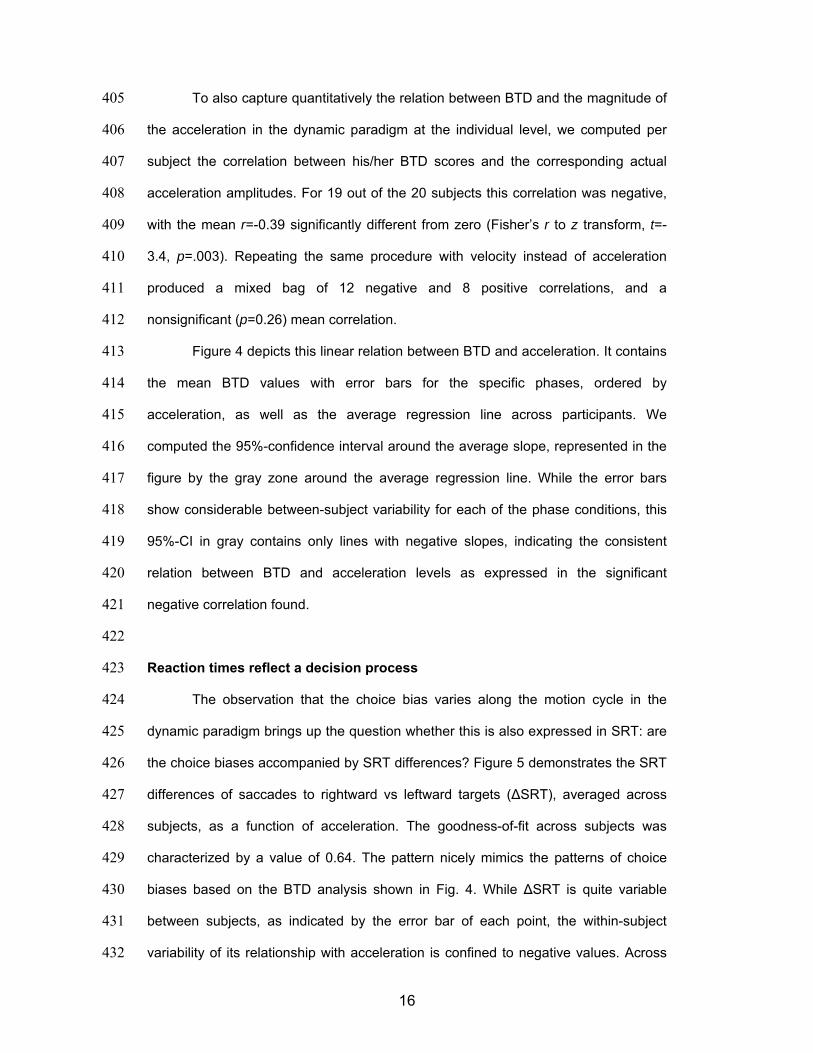
To also capture quantitatively the relation between BTD and the magnitude of 405
the acceleration in the dynamic paradigm at the individual level, we computed per 406
subject the correlation between his/her BTD scores and the corresponding actual 407
acceleration amplitudes. For 19 out of the 20 subjects this correlation was negative, 408
with the mean r=-0.39 significantly different from zero (Fisher’s r to z transform, t=-409
3.4, p=.003). Repeating the same procedure with velocity instead of acceleration 410
produced a mixed bag of 12 negative and 8 positive correlations, and a 411
nonsignificant (p=0.26) mean correlation. 412
Figure 4 depicts this linear relation between BTD and acceleration. It contains 413
the mean BTD values with error bars for the specific phases, ordered by 414
acceleration, as well as the average regression line across participants. We 415
computed the 95%-confidence interval around the average slope, represented in the 416
figure by the gray zone around the average regression line. While the error bars 417
show considerable between-subject variability for each of the phase conditions, this 418
95%-CI in gray contains only lines with negative slopes, indicating the consistent 419
relation between BTD and acceleration levels as expressed in the significant 420
negative correlation found. 421
422
Reaction times reflect a decision process 423
The observation that the choice bias varies along the motion cycle in the 424
dynamic paradigm brings up the question whether this is also expressed in SRT: are 425
the choice biases accompanied by SRT differences? Figure 5 demonstrates the SRT 426
differences of saccades to rightward vs leftward targets (ΔSRT), averaged across 427
subjects, as a function of acceleration. The goodness-of-fit across subjects was 428
characterized by a value of 0.64. The pattern nicely mimics the patterns of choice 429
biases based on the BTD analysis shown in Fig. 4. While ΔSRT is quite variable 430
between subjects, as indicated by the error bar of each point, the within-subject 431
variability of its relationship with acceleration is confined to negative values. Across 432

17
individual subjects, the mean correlation of SRT with acceleration amplitude was -433
0.23 (p=0.02). For leftward accelerations, for which the BTD results show a 434
preference to leftward targets, the SRT to rightward targets is larger than to leftward 435
targets. The opposite pattern is seen for rightward accelerations, i.e., shorter SRTs 436
for rightward targets. In contrast, SRT did not correlate with velocity (r =0.005; p 437
=0.95). 438
To further examine whether SRTs are indicative of a neural decision process 439
we used a straightforward linear rise-to-threshold modeling approach (Carpenter and 440
Williams, 1995). In this analysis, the release of the saccade is assumed to reflect the 441
final outcome of two independent linear rise-to-threshold processes, related to the 442
two targets, which race to the same threshold (race model). To account for the 443
stimulus onset asynchrony, the process for target 2 starts later than that for target 1. 444
It is further assumed that in isolation target 1 and 2 yield the same reaction time 445
distribution. Hence, to win the race, the process for target 2 must proceed 446
progressively faster to compensate for progressively longer SOAs. Using this simple 447
framework, we can predict SRTs for target 2. Figure 6 shows that the predicted 448
pattern of how BTD affects the SRT (black line) for the second target, expressed 449
relative to the onset of the second target, nicely fits the observed SRT-BTD pattern 450
(R2>0.85, p<0.001), for each of the eight phase angles. Together with the results of 451
the previous section, these results are indicative of a neural decision process in 452
which the selection process is biased by a self-motion (acceleration) signal. 453
454
Discussion 455
The main purpose of this study was to understand how whole body motion 456
influences saccadic target selection. In particular, we focused on how the velocity 457
and acceleration of body motion affect the choice between two targets, presented 458
asynchronously but equiluminantly and equidistantly from the fixation point. Using an 459
adaptive psychometric procedure, we adjusted the temporal difference between the 460

18
two target onsets until the subject selected both targets equally often as the goal of 461
the saccade. We determined this balanced time delay (BTD) for different phases of 462
the motion so we could distinguish the effects of whole body velocity and 463
acceleration on saccadic target selection. Of these two, our results show that 464
acceleration but not velocity correlates significantly with target selection. The 465
observed BTDs may represent a bottom-up effect of acceleration, presumably 466
derived from the otolith system, on saccadic target selection. In support of this notion, 467
saccadic reaction times were reliably shorter to targets in the acceleration direction, 468
which is a further reflection of the selection bias. A simple race model could capture 469
the pattern of saccadic reaction times quite well, which suggests that the saccade 470
reflects the final outcome of a stochastic decision processes, modulated by a low-471
level acceleration signal. 472
As mentioned in the Introduction, we have framed our results in terms of 473
acceleration rather than position, even though these are indistinguishable during 474
sinusoidal motion. Every relationship showing an influence of leftward or rightward 475
acceleration can be alternatively interpreted as showing a biasing influence of 476
position to the right or left toward the center of sinusoidal motion. Our preference of 477
an interpretation based on acceleration rather than position, while speculative, is 478
more parsimonious since the otoliths sense linear acceleration rather than position; 479
accordingly derivation of position from acceleration requires double integration. 480
Previous work has suggested that such integration is leaky, and thus the neural 481
representation of integrated position should lag behind that of acceleration 482
(Mittelstaedt and Mittelstaedt, 2001; Merfeld et al., 2005; Vingerhoets et al., 2006). 483
Given that a phase lag should be inherent to an acceleration-to-position 484
transformation, we find it difficult to explain why BTD values are similar at matched 485
phases of acceleration, even though the integrated position signals would be 486
different. In the same way, we find it difficult to explain why we observed a negligible 487
influence of velocity on BTD, since integration position signals after maximum 488

19
velocity are non-zero. Instead, our results show that the largest dynamic influence 489
comes from the “snapshot” of motion when the first target is presented, regardless of 490
whether acceleration (or position) is increasing or decreasing. 491
An alternative line of reasoning favoring an interpretation based on 492
acceleration rather than position stems from a top-down perspective. Anecdotally, 493
subjects indicated that they did not recognize the phases at which they were tested 494
throughout the ongoing motion, illustrating an inability to predict fine details of 495
upcoming motion. Moreover, if subjects opted to simply select the target that is in the 496
direction of the center, then we would have expected response bias to depend simply 497
on whether the subject is left or right from this center at the time of target 498
presentation, irrespective of velocity or acceleration. This is not what the data 499
showed: we observed instead a systematic modulation of motion phase on response 500
bias that appeared most consistent with a phase-dependent bottom-up modulation. 501
For future work, it would be interesting to address the dissociation of acceleration 502
and position effects further, e.g., by using more complicated motion profiles, possibly 503
including abrupt onsets of acceleration. 504
The vast majority of studies in the literature have examined the mechanisms 505
of target selection in body-stationary environments. This work has broadly 506
differentiated between top-down and bottom-up influences on target selection, with 507
the former driven by the internal goals of the subject and the latter related to the 508
physical characteristics of the environment. Clearly, target selection mechanisms 509
have evolved during more complex situations when the body is in motion, which is a 510
common but largely unstudied situation. Our results point to the incorporation of 511
acceleration signals, presumably transmitted by the vestibular system, in saccadic 512
target selection. Of course, we cannot rule out that other potential signals convey 513
acceleration information, such as pressure receptors in the skin. It would also be 514
interesting to test to what extent the present findings with passive motion generalize 515
to target selection in more natural environments and with active self-generated body 516

20
motion which, in contrast to the present study, would involve motor planning and 517
predictions about the course and the outcome of the action (Carriot et al., 2013; 518
Foulsham et al., 2014; Hayhoe and Ballard, 2014). 519
We consider it unlikely that inertial factors or anticipated biomechanical costs 520
serve as an explanation for the selection bias in the dynamic condition. Anticipated 521
biomechanical costs have been shown to influence the outcome of action decisions 522
for upper limb movement in a static situation (Cos et al., 2011, 2014). Such 523
biomechanical costs would change when the arm is undergoing acceleration, and 524
numerous experiments show that the brain anticipates Coriolis torques on the limb 525
generated during torso rotation (e.g. Sainburg et al., 1999; Pigeon et al., 2013) and 526
learns to adapt during reaches made in rotating environments (Lackner and Dizio, 527
1994). This suggests that for the upper limb, top-down prediction of biomechanics 528
influence target selection. But compared to the limb, the eyes have a negligible 529
inertial component, rendering biomechanical cost a rather insignificant factor in the 530
selection of saccadic targets. Interesting questions to address in future work are 531
whether and how bottom-up and/or top-down influences of acceleration influence 532
saccadic decisions when the head is free to move, bias target selection of reaching 533
movements, or affect the choice of which hand to use. 534
Using the dynamic paradigm, we showed that the preference for saccadic 535
targets was biased by the direction (i.e. the sign) of acceleration. SRTs were also 536
shorter for targets in the direction of acceleration, comparable to the shorter SRTs 537
observed during saccade-smooth pursuit interactions (Tanaka et al., 1998). Because 538
sinusoidal motion is predictable (Barnes, 1993; Han et al., 2005; Prsa et al., 2015), 539
subjects could potentially also rely on velocity or position signals in the selection 540
process. However, selection in our task appears not to be biased by velocity 541
information, rendering such top-down effects on target selection less likely. 542
Alternatively, the dependent measure in our study may not have been sensitive 543
enough to uncover such an effect. 544
21
In fact, our results show the same selection bias for the same magnitude of 545
acceleration (see Figures 3 and 4), irrespective of whether the subject’s velocity is 546
leftward or rightward, and thus moving in opposite directions in space. This is also 547
inconsistent with an explanation of the selection bias based on anticipated motion 548
dynamics, such as a strategy where subjects look in the direction that they are about 549
to go. 550
It is known that intervening eye, head, and body motion is taken into account 551
when programming saccades to world-fixed targets (Snyder and King, 1992; Telford 552
et al., 1997; Crane and Demer, 1998; Medendorp, 2011). In the present study, 553
targets were presented at head-fixed locations, meaning that such compensatory 554
mechanisms should be switched off, or suppressed, in the generation of the saccade. 555
Nonetheless, the question remains: does the choice bias relate to the magnitude of 556
the instantaneous acceleration signal at the onset of the stimuli or at the onset of the 557
saccade? After the onset of the stimuli, the phase of the acceleration signal changes 558
by about 45º during the ~200 ms saccadic reaction time. Because of the periodicity of 559
the motion, we cannot completely exclude the possibility that the selection bias in a 560
single condition depends on the acceleration signal slightly before saccade onset, i.e. 561
about 45º further than stimulus onset. However, here again, it is difficult to explain 562
why BTD values would be similar at phases where neither the acceleration nor the 563
related velocity information is the same (e.g. 45º and 315º phase onsets, where the 564
saccade starts around peak velocity and peak acceleration, respectively). Based on 565
this reasoning, we think that the present results are best interpreted as a bottom-up 566
effect of the instantaneous acceleration signal at the moment of stimulus 567
presentation on the mechanisms of target selection for saccades. 568
To our knowledge there are no other studies in the literature that have 569
examined target selection during either whole-body rotational or translational motion. 570
In fact, only a few studies have investigated saccade-vestibular interactions during 571
whole-body rotations. Van Beuzekom and Van Gisbergen (2002a) asked human 572
22
subjects to make pro- or anti-saccades in oblique directions while being rotated 573
sinusoidally in yaw. They tested how the saccadic system would cope with the 574
interfering effects of ongoing horizontal nystagmus, in particular with the quick-phase 575
eye movements. While the vertical component of the voluntary saccade was typically 576
correct, the horizontal component was compromised, and biased in the direction of 577
the quick phase. The same authors also tested how oblique saccades induced by 578
electrical microstimulation in the monkey superior colliculus (SC) are modified by 579
concurrent sinusoidal yaw rotation (Van Beuzekom and Van Gisbergen, 2002b). 580
Again, results showed a kinematic effect only on the horizontal component of the 581
induced saccade, not the vertical component. Together, these results suggest an 582
interaction between the vestibularly-induced quick phase eye movement and a 583
voluntary or induced saccade. The differential effect on horizontal versus vertical 584
components indicates that such an interaction takes place downstream from the SC 585
(where saccades are encoded in a vectorial fashion), consistent with other studies 586
(Kitama et al., 1995; Anastasio, 1997), as well as lesion experiments (Schiller et al., 587
1980; Hepp et al., 1993). 588
The SC has been implicated in target selection (Glimcher and Sparks, 1992; 589
Basso and Wurtz, 1998; Krauzlis and Dill, 2002; McPeek and Keller, 2002; White and 590
Munoz, 2011). Would the quick-phase results from Van Beuzekom and Van 591
Gisbergen, as described above, suggest that no vestibular information arrives in the 592
SC? To our knowledge, there is only little experimental data that would allow us to 593
infer an answer. The few studies that have looked at the influence of vestibular 594
information on SC activity have employed rotation (Maeda et al., 1979), not 595
translation. Although quick phase eye movements during rotation persist after the SC 596
is either ablated (Schiller et al., 1980) or temporarily inactivated (Hepp et al., 1993), 597
such quick phase eye movements are associated with bursts of activity on SC 598
saccade-related neurons (Schiller and Stryker, 1972; Hepp et al., 1993). Vestibular 599
rotation does not modulate the activity of another class of SC neurons related to 600
23
head-only movements (Walton et al., 2007). Together, these observations indicate 601
that vestibular information arising from rotation can access the SC, impacting the 602
activity on saccade-related neurons. Whether vestibular information arising from 603
translation also influences saccade-related activity in the SC remains unknown, but 604
this seems possible, given that signals related to eye-in-head position (Van Opstal et 605
al., 1995; Campos et al., 2006) and head-on-body position (Nagy and Corneil, 2010) 606
also impact activity on saccade-related SC neurons. 607
It is known that periodic linear acceleration induces a horizontal nystagmus, 608
with quick phases in the direction of the acceleration (thus, against the inertial force) 609
(Niven et al., 1966; Katayama and Mori, 2001). Although quick phase saccades were 610
suppressed in the present study (due to the head-fixed fixation point), our results 611
suggest a selection bias to targets in that direction. Therefore, a plausible 612
explanation of our results is that vestibular information from the otolith organs 613
modulates SC activity during our target selection paradigm, favoring development of 614
a saccade-related burst in one SC versus the other. This mechanism is consistent 615
both with our saccadic choice biases and with the shortened saccadic reaction times. 616
Future neurophysiological work using dynamic motion should be performed to test 617
this proposal. 618
An alternative scenario is that the vestibular signals modulate activity in 619
cortical areas that have been implicated in target selection, such as the lateral 620
intraparietal area (Bisley and Goldberg, 2010) or the frontal eye fields (Schall and 621
Hanes, 1993). Indeed, there are pathways that transmit vestibular signals to parietal 622
cortex (Kaufman and Rosenquist, 1985; Meng et al., 2007; Shinder and Taube, 623
2010) and frontal cortex (Fukushima, 1997), which could potentially bias processing 624
in the SC, but this has not been tested. Ascertaining whether the influence of 625
vestibular information from translation on the oculomotor system arises from trans-626
cortical pathways or those confined solely to the brainstem would represent another 627
fruitful avenue for future neurophysiological investigations of this phenomenon. 628

24
629

25
630
Acknowledgements 631
This work was supported by the European Research Council (EU-ERC-283567), EU-632
FP7-FET grant (SpaceCog 600785), and the Netherlands Organization for Scientific 633
Research (NWO-VICI: 453-11-001) to WPM. 634
635
636
637
638

26
References 639
Anastasio TJ. A burst-feedback model of fast-phase burst generation during 640 nystagmus. Biol Cybern 76: 139–152, 1997. 641
Angelaki DE, Cullen KE. Vestibular System: The Many Facets of a Multimodal 642 Sense. Annu Rev Neurosci 31: 125–150, 2008. 643
Angelaki DE, McHenry MQ, Dickman JD, Newlands SD, Hess BJ. Computation of 644 inertial motion: neural strategies to resolve ambiguous otolith information. J Neurosci 645 19: 316–327, 1999. 646
Barnes GR. Visual-vestibular interaction in the control of head and eye movement: 647 the role of visual feedback and predictive mechanisms. Prog Neurobiol 41: 435–72, 648 1993. 649
Basso MA, Wurtz RH. Modulation of neuronal activity in superior colliculus by 650 changes in target probability. J Neurosci 18: 7519–34, 1998. 651
Bell AH, Meredith MA, Van Opstal AJ, Munoz DP. Stimulus intensity modifies 652 saccadic reaction time and visual response latency in the superior colliculus. Exp 653 brain Res 174: 53–9, 2006. 654
Van Beuzekom AD, Van Gisbergen JAM. Interaction between visual and vestibular 655 signals for the control of rapid eye movements. J Neurophysiol 88: 306–22, 2002a. 656
Van Beuzekom AD, Van Gisbergen JAM. Collicular microstimulation during passive 657 rotation does not generate fixed gaze shifts. J Neurophysiol 87: 2946–63, 2002b. 658
Bisley JW, Goldberg ME. Attention, Intention, and Priority in the Parietal Lobe. 659 Annu Rev Neurosci 33: 1–21, 2010. 660
Boch R, Fischer B, Ramsperger E. Express-saccades of the monkey: reaction 661 times versus intensity, size, duration, and eccentricity of their targets. Exp brain Res 662 55: 223–31, 1984. 663
Bray TJP, Carpenter RHS. Saccadic foraging: reduced reaction time to informative 664 targets. Eur J Neurosci 41: 908–13, 2015. 665
Burr DC, Corsale B. Dependency of reaction times to motion onset on luminance 666 and chromatic contrast. Vision Res 41: 1039–48, 2001. 667
Campos M, Cherian A, Segraves MA. Effects of eye position upon activity of 668 neurons in macaque superior colliculus. J Neurophysiol 95: 505–26, 2006. 669
Carpenter RH, Williams ML. Neural computation of log likelihood in control of 670 saccadic eye movements. Nature 377: 59–62, 1995. 671
Carpenter RHS. Movements of the eyes. Pion, 1988. 672
Carriot J, Brooks JX, Cullen KE. Multimodal integration of self-motion cues in the 673 vestibular system: active versus passive translations. J Neurosci 33: 19555–66, 674 2013. 675

27
Cos I, Bélanger N, Cisek P. The influence of predicted arm biomechanics on 676 decision making. J Neurophysiol 105: 3022–3033, 2011. 677
Cos I, Duque J, Cisek P. Rapid prediction of biomechanical costs during action 678 decisions. J Neurophysiol 112: 1256–66, 2014. 679
Crane BT, Demer JL. Human horizontal vestibulo-ocular reflex initiation: effects of 680 acceleration, target distance, and unilateral deafferentation. J Neurophysiol 80: 681 1151–66, 1998. 682
Dorris MC, Munoz DP. Saccadic probability influences motor preparation signals 683 and time to saccadic initiation. J Neurosci 18: 7015–26, 1998. 684
Foulsham T, Chapman C, Nasiopoulos E, Kingstone A. Top-down and bottom-up 685 aspects of active search in a real-world environment. Can J Exp Psychol = Rev Can 686 Psychol expérimentale 68: 8–19, 2014. 687
Fernández C, Goldberg JM. Physiology of peripheral neurons innervating otolith 688 organs of the squirrel monkey. III. Response dynamics. J Neurophysiol 39: 996–689 1008, 1976. 690
Fukushima K. Corticovestibular interactions: anatomy, electrophysiology, and 691 functional considerations. Exp brain Res 117: 1–16, 1997. 692
Fuller JH. Eye position and target amplitude effects on human visual saccadic 693 latencies. Exp brain Res 109: 457–66, 1996. 694
Galiana HL, Guitton D. Central organization and modeling of eye-head coordination 695 during orienting gaze shifts. Ann N Y Acad Sci 656: 452–71, 1992. 696
Glimcher PW, Sparks DL. Movement selection in advance of action in the superior 697 colliculus. Nature 355: 542–5, 1992. 698
Glimcher PW. The neurobiology of saccadic decision making. Annu Rev Neurosci 699 26: 133–179, 2003. 700
Han YH, Kumar AN, Reschke MF, Somers JT, Dell’Osso LF, Leigh RJ. Vestibular 701 and non-vestibular contributions to eye movements that compensate for head 702 rotations during viewing of near targets. Exp brain Res 165: 294–304, 2005. 703
Hayhoe M, Ballard D. Modeling task control of eye movements. Curr Biol 24: R622–704 8, 2014. 705
Hepp K, Van Opstal AJ, Straumann D, Hess BJ, Henn V. Monkey superior 706 colliculus represents rapid eye movements in a two-dimensional motor map. J 707 Neurophysiol 69: 965–79, 1993. 708
Jamali M, Sadeghi SG, Cullen KE. Response of vestibular nerve afferents 709 innervating utricle and saccule during passive and active translations. J Neurophysiol 710 101: 141–9, 2009. 711
Katayama N, Mori S. Directional asymmetry of nystagmus elicitation in humans 712 during step and sinusoidal modes of lateral linear acceleration. Neurosci Res 41: 97–713 105, 2001. 714

28
Kaufman EF, Rosenquist AC. Efferent projections of the thalamic intralaminar 715 nuclei in the cat. Brain Res 335: 257–79, 1985. 716
Kitama T, Ohki Y, Shimazu H, Tanaka M, Yoshida K. Site of interaction between 717 saccade signals and vestibular signals induced by head rotation in the alert cat: 718 functional properties and afferent organization of burster-driving neurons. J 719 Neurophysiol 74: 273–87, 1995. 720
Kontsevich LL, Tyler CW. Bayesian adaptive estimation of psychometric slope and 721 threshold. Vision Res 39: 2729–2737, 1999. 722
Krauzlis R, Dill N. Neural correlates of target choice for pursuit and saccades in the 723 primate superior colliculus. Neuron 35: 355–63, 2002. 724
Lackner JR, Dizio P. Rapid adaptation to Coriolis force perturbations of arm 725 trajectory. J Neurophysiol 72: 299–313, 1994. 726
Maeda M, Shibazaki T, Yoshida K. Labyrinthine and visual inputs to the superior 727 colliculus neurons. Prog Brain Res 50: 735–43, 1979. 728
Marino RA, Levy R, Boehnke S, White BJ, Itti L, Munoz DP. Linking visual 729 response properties in the superior colliculus to saccade behavior. Eur J Neurosci 730 35: 1738–52, 2012. 731
McPeek RM, Keller EL. Saccade target selection in the superior colliculus during a 732 visual search task. J Neurophysiol 88: 2019–34, 2002. 733
Medendorp WP. Spatial constancy mechanisms in motor control. Philos Trans R 734 Soc Lond B Biol Sci 366: 476–91, 2011. 735
Meng H, May PJ, Dickman JD, Angelaki DE. Vestibular signals in primate 736 thalamus: properties and origins. J Neurosci 27: 13590–602, 2007. 737
Merfeld DM, Park S, Gianna-Poulin C, Black FO, Wood S. Vestibular perception 738 and action employ qualitatively different mechanisms. I. Frequency response of VOR 739 and perceptual responses during Translation and Tilt. J Neurophysiol 94: 186–98, 740 2005. 741
Mittelstaedt ML, Mittelstaedt H. Idiothetic navigation in humans: estimation of path 742 length. Exp brain Res 139: 318–32, 2001. 743
Monteon JA, Avillac M, Yan X, Wang H, Crawford JD. Neural mechanisms for 744 predictive head movement strategies during sequential gaze shifts. J Neurophysiol 745 108: 2689–707, 2012. 746
Nagy B, Corneil BD. Representation of Horizontal head-on-body position in the 747 primate superior colliculus. J Neurophysiol 103: 858–74, 2010. 748
Niven JI, Hixson WC, Correia MJ. Elicitation of horizontal nystagmus by periodic 749 linear acceleration. Acta Otolaryngol 62: 429–41, 1966. 750
Oommen BS, Smith RM, Stahl JS. The influence of future gaze orientation upon 751 eye-head coupling during saccades. Exp brain Res 155: 9–18, 2004. 752

29
Van Opstal AJ, Hepp K, Suzuki Y, Henn V. Influence of eye position on activity in 753 monkey superior colliculus. J Neurophysiol 74: 1593–610, 1995. 754
Padoa-Schioppa C. Neurobiology of economic choice: a good-based model. Annu 755 Rev Neurosci 34: 333–59, 2011. 756
Paige GD, Telford L, Seidman SH, Barnes GR. Human vestibuloocular reflex and 757 its interactions with vision and fixation distance during linear and angular head 758 movement. J Neurophysiol 80: 2391–2404, 1998. 759
Pigeon P, Dizio P, Lackner JR. Immediate compensation for variations in self-760 generated Coriolis torques related to body dynamics and carried objects. J 761 Neurophysiol 110: 1370–84, 2013. 762
Prsa M, Jimenez-Rezende D, Blanke O. Inference of perceptual priors from path 763 dynamics of passive self-motion. J Neurophysiol 113: 1400–13, 2015. 764
Rezvani S, Corneil BD. Recruitment of a head-turning synergy by low-frequency 765 activity in the primate superior colliculus. J Neurophysiol 100: 397–411, 2008. 766
Sainburg RL, Ghez C, Kalakanis D. Intersegmental dynamics are controlled by 767 sequential anticipatory, error correction, and postural mechanisms. J Neurophysiol 768 81: 1045–56, 1999. 769
Schall JD, Hanes DP. Neural basis of saccade target selection in frontal eye field 770 during visual search. Nature 366: 467–9, 1993. 771
Schall JD, Purcell BA, Heitz RP, Logan GD, Palmeri TJ. Neural mechanisms of 772 saccade target selection: gated accumulator model of the visual-motor cascade. Eur 773 J Neurosci 33: 1991–2002, 2011. 774
Schiller PH, Stryker M. Single-unit recording and stimulation in superior colliculus of 775 the alert rhesus monkey. J Neurophysiol 35: 915–24, 1972. 776
Schiller PH, True SD, Conway JL. Deficits in eye movements following frontal eye-777 field and superior colliculus ablations. J Neurophysiol 44: 1175–1189, 1980. 778
Scudder CA, Kaneko CS, Fuchs AF. The brainstem burst generator for saccadic 779 eye movements: a modern synthesis. Exp brain Res 142: 439–62, 2002. 780
Shinder ME, Taube JS. Differentiating ascending vestibular pathways to the cortex 781 involved in spatial cognition. J Vestib Res 20: 3–23, 2010. 782
Snyder LH, King WM. Effect of viewing distance and location of the axis of head 783 rotation on the monkey’s vestibuloocular reflex. I. Eye movement responses. J 784 Neurophysiol 67: 861–874, 1992. 785
Sumner P. Determinants of saccadic latency. In: The Oxford Handbook of Eye 786 Movements, Oxford, edited by Liversedge S, Gilchrist I, Everling S. Oxford University 787 Press, 2011. 788
Tanaka M, Yoshida T, Fukushima K. Latency of saccades during smooth-pursuit 789 eye movement in man. Directional asymmetries. Exp brain Res 121: 92–8, 1998. 790

30
Telford L, Seidman SH, Paige GD. Dynamics of squirrel monkey linear 791 vestibuloocular reflex and interactions with fixation distance. J Neurophysiol 78: 792 1775–1790, 1997. 793
Tweed D. Three-dimensional model of the human eye-head saccadic system. J 794 Neurophysiol 77: 654–666, 1997. 795
Vingerhoets RAA, Medendorp WP, Van Gisbergen JAM. Time course and 796 magnitude of illusory translation perception during off-vertical axis rotation. J 797 Neurophysiol 95: 1571–87, 2006. 798
Walton MMG, Bechara B, Gandhi NJ. Role of the primate superior colliculus in the 799 control of head movements. J Neurophysiol 98: 2022–37, 2007. 800
White BJ, Munoz DP. Separate visual signals for saccade initiation during target 801 selection in the primate superior colliculus. J Neurosci 31: 1570–8, 2011. 802
Yu X-J, Dickman JD, Angelaki DE. Detection thresholds of macaque otolith 803 afferents. J Neurosci 32: 8306–16, 2012. 804
805
806
31
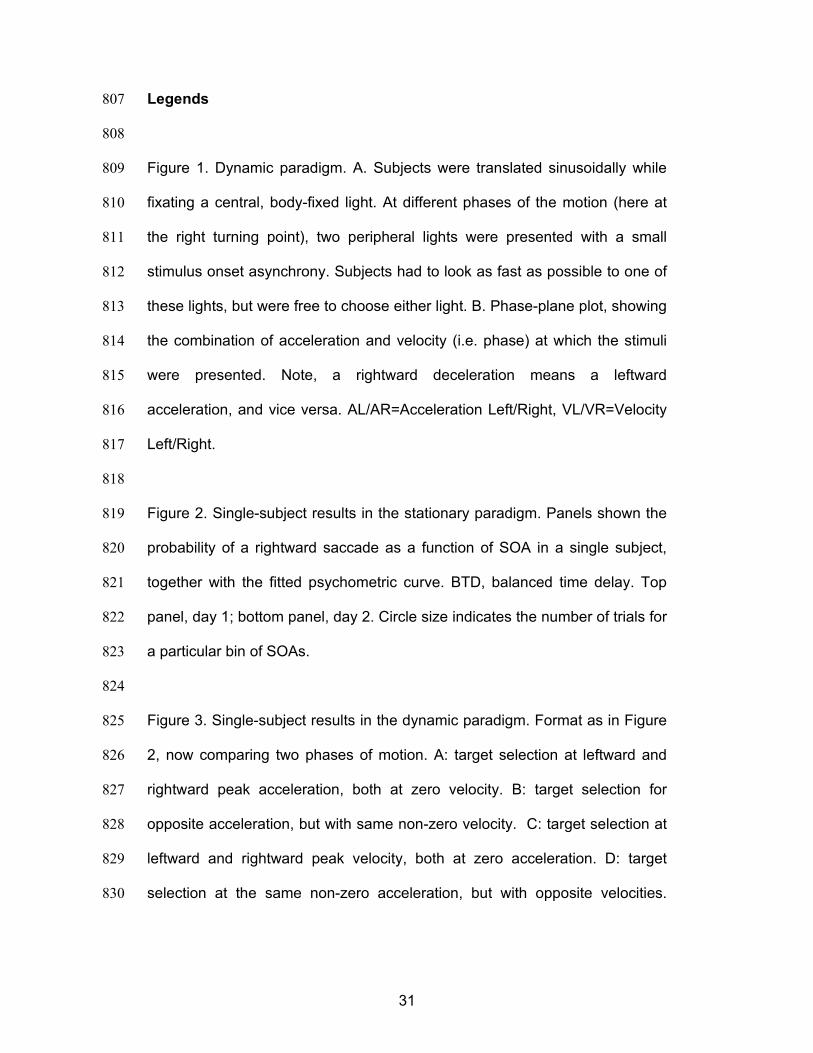
Legends 807
808
Figure 1. Dynamic paradigm. A. Subjects were translated sinusoidally while 809
fixating a central, body-fixed light. At different phases of the motion (here at 810
the right turning point), two peripheral lights were presented with a small 811
stimulus onset asynchrony. Subjects had to look as fast as possible to one of 812
these lights, but were free to choose either light. B. Phase-plane plot, showing 813
the combination of acceleration and velocity (i.e. phase) at which the stimuli 814
were presented. Note, a rightward deceleration means a leftward 815
acceleration, and vice versa. AL/AR=Acceleration Left/Right, VL/VR=Velocity 816
Left/Right. 817
818
Figure 2. Single-subject results in the stationary paradigm. Panels shown the 819
probability of a rightward saccade as a function of SOA in a single subject, 820
together with the fitted psychometric curve. BTD, balanced time delay. Top 821
panel, day 1; bottom panel, day 2. Circle size indicates the number of trials for 822
a particular bin of SOAs. 823
824
Figure 3. Single-subject results in the dynamic paradigm. Format as in Figure 825
2, now comparing two phases of motion. A: target selection at leftward and 826
rightward peak acceleration, both at zero velocity. B: target selection for 827
opposite acceleration, but with same non-zero velocity. C: target selection at 828
leftward and rightward peak velocity, both at zero acceleration. D: target 829
selection at the same non-zero acceleration, but with opposite velocities. 830

32
Insets on the right show phase-plane plots of the compared phases 831
(corresponding colors). 832
833
Figure 4. BTD results shown as a function of acceleration. Error bars on each 834
point represents between-subject variability (SE). Black line represents the 835
best fit through these data points, with R2 the goodness-of-fit across subjects. 836
The between-subject variability of the best-fit slope is depicted by the gray 837
zone around the average slope, representing the 95%-confidence interval. 838
839
Figure 5. SRT results. Difference in SRTs between rightward and leftward 840
saccades, shown as a function of acceleration. Same format as Fig. 4. 841
842
Figure 6. SRTs, averaged across subjects, to the first (black circles) and 843
second stimulus (gray circles) as a function of stimulus onset asynchrony. 844
Each panel represents one of the eight phase angles. Lines show expected 845
SRT according to a linear rise-to-threshold modeling approach. 846
847
A
B