Embed Size (px)
Citation preview


AERC - Report/2018
Decision-Oriented Information Systems for Farmers:
A Study of Kisan Call Centres (KCC), Kisan Knowledge
Management System (KKMS), Farmers Portal,
and M-Kisan Portal in Maharashtra
Sangeeta Shroff
Agro-Economic Research Centre
Gokhale Institute of Politics and Economics (Deemed to be University)
Pune – 411 004
March 2018
Tel: 020-25650287; Fax: 020-25652579


i
Foreword
There is an urgent need to increase the extension services available to farmers.
ICT is one way to bridge the gap and meet location specific information needs of the
farmers as well as bring farmers in the interiors to access technological improvements.
In view of the above, the effectiveness of e services in providing advisory
services to farmers was examined, to observe the extent to which it enabled them to make
appropriate decisions and thus solve the problems they face in farming. The study
examined the structure, design, implementation and performance of the government
systems of Kisan Call Centres (KCC), Kisan Knowledge Management System, Farmers’
Portal and M-Kisan Portal in the state of Maharashtra.
The study revealed that the hardware and software installed in the KCC
improved the efficiency but the office space was inadequate and caused disturbance. The
Farmer Tele Advisers (FTAs) most often depended upon self knowledge and internet
search to respond to the queries of farmers and rarely resorted to any material from
Government sources. The farmers did make use of KCCs and found the toll free number
easy to access. They, however, mainly resorted to fellow farmers for information on
agricultural practices. Mobile phones were also used by farmers to get information. The
farmers seldom visited Farmers Portal or Kisan Knowledge Management System and
information from websites was not popular for obtaining any information.
The main policy implication of the study was to improve the work conditions of
FTAs and also provide them with training and updated information on extension services.
The websites should be regularly updated so that the FTAs are in a position to give good
advisory services to farmers which is the very purpose of the scheme. Also, escalation of
calls, to higher levels, if necessary, should be improved.
I thank Prof Sangeeta Shroff for undertaking the study which will certainly be
useful to policy makers as they will be in a position to address the important issue on
extension services which is lacking in the agricultural sector.
Gokhale Institute of Politics and Economics,
(Deemed to be University Under Section 3
of the UGC Act, 1956)
Pune 411001
Rajas Parchure,
Professor and Officiating
Director
March, 2018


ii
Acknowledgements
The project “Decision –Oriented Information System for Farmers : A Study of
Kisan Call Centres (KCC), Kisan Knowledge Management System (KKMS), Farmers
Portal, and M-Kisan Portal in Maharashtra” was conducted by the Agro-Economic
Research Centre of Gokhale Institute of Politics and Economics, Pune at the initiative
of the Ministry of Agriculture, Cooperation and Farmers Welfare, Government of
India, New Delhi. Our sincere thanks to Shri P.C. Bodh and Shri Rakesh Kumar for
whole hearted support in all matters related to the study. The report was coordinated
by Centre for Management in Agriculture (CMA) at IIM (Ahmedabad) who conducted
a workshop in which the stud design was thoroughly discussed. I therefore thank the
CMA Unit of IIM, Ahmedabad, especially Prof Vasant P. Gandhi and Nicky Johnson
for holding a brainstorming workshop which greatly facilitated in undertaking this
project. The discussions with all participating centres provided immense insights to the
study.
I would like to thank our Officiating Director, Prof Rajas Parchure for full
support and motivation to conduct this study. I am also grateful to all other staff,
Registrar, and Librarian for help whenever required.
The study could not have been completed without the overwhelming support of
the staff of the Kisan Call Centre located in Pune for Maharashtra. The two supervisors
Shri Santosh Tambe and Shri Samadhan Madane very patiently answered the
questionnaire addressed to them. Further almost all Farmer-Tele Advisers in the Kisan
Call centre provided the necessary information which was very useful for analysing
the functioning of the centre. Besides, farmers who avail the services of Kisan Call
Centres, as well as some non-users were questioned, on the impact of these centres on
their farming decisions. Their responses were very useful for further strengthening of
these centres. I also thank IFFCO officials for help and insights for this study.
Last but not the least, I would like to thank my field investigators Shri S. Dete,
Shri Ravindra Gaikwad and Shri Anil Memane for data collection and computer
assistance.
Gokhale Institute of Politics and
Economics,
(Deemed to be University Under section 3
of the UGC Act, 1956),
Pune -411004
Sangeeta Shroff
March 2018


iii
Content
Chapter
No
Chapter Page
No.
Foreword i
Acknowledgements ii
Contents iii-iv
List of Tables v-vi
List of Box vii
List of Graph vii
Executive Summary viii-xiii
1 Introduction 1-16
1.1 Backdrop 1
1.2 Kisan Call Centres 2
1.3 M- Kisan Portal – Mobile based services for Farmers 7
1.4 Review of Literature 9
1.5 The need for a strong Information system 10
1.6 Objectives of the study 11
1.7 Methodology 12
2 Sample Profile of Kisan Call Centre (Maharashtra) 17-22
2.1 Backdrop 17
2.2 Profile of FTAs and Farmers (Users and Non-Users of KCC sevices) 17
3 Profile of Kisan Call Centre and Functioning 23-42
3.1 Backdrop 23
3.2 Profile of Kisan Call Centre 23
3.3 Improvements in KCCs Post Restructuring 24
3.4 Infrastructure of KCC 29
3.5 Efficiency of FTAs 31
3.6 Assessment of Knowledge sources 32
4 Results : Farmer Tele Adviser (FTA) Survey 43-67
4.1 Backdrop 43
4.2 Status of Hardware, Software and Internet Connectivity 43
4.3 Information and Knowledge sources used by FTAs 47
4.4 Overall assessment of Information from Various Source 51
4.5 Assessing Call Efficiency 58
4.6 Infrastructure Rating 60
4.7 Usefulness of training programmes 61
4.8 Self-Assessment of FTAs 63
4.9 Overall assessment of Information provided and overall assessment
of Kisan Call Centre
65


iv
Chapter
No
Chapter Page
No.
5 Results: Farmers’ Survey 68-89
5.1 Backdrop 68
5.2 Sources of Information/advise on farming 68
5.3 Communication media and devices used to source information and
quality of information
70
5.4 Overall Call Response Efficiency and Quality 75
5.5 Response on questions related to various aspects of farming
operations
79
5.6 Focus on objectives while undertaking farming operations 83
5.7 Importance of Kisan Call centres on important decisions 84
5.8 Impact of KCC on important decisions 86
5.9 Overall assessment of KCCs by farmers 88
6 Summary and Conclusions 90-97
6.1 Introduction 90
6.2 Objectives of the study and Methodology 91
6.3 Main Findings 92
6.4 Policy Implications 96
References 98
Review of the Report 99-101


v
List of Tables
Table
No
Table Page
No.
1.1 District-wise Number of Calls attended 13
1.2 District-wise Percentage of Number of Calls attended 14
1.3 Address of Questionnaire 15
1.4 District wise selection of sample size of user and non-user farmers of KCC 15
2.1 Gender Profile of FTA’s Surveyed 17
2.2 Education profile of FTAs surveyed 18
2.3 Subjects of specialization of FTAs surveyed 18
2.4 FTAs with Work Experience 19
2.5 Education profile of farmers (KCC user) sample 19
2.6 Caste profile of farmer (KCC users) sample 20
2.7 Age Profile Sample Farmers (KCC Users) 20
2.8 Education profile – Non-users 21
2.9 Caste Profile-Non-Users 21
2.10 Age Profile Farmers (Non-Users) 22
3.1 Profile of Kisan Call Centre 23
3.2 History of Development of Kisan Call Centre 24
3.3 Comparison of present and past KCC 25
3.4 Present Hardware Profile 25
3.5 Present Software Profile 25
3.6 Hardware Overall Ratings (Frequency) 26
3.7 Software Overall Ratings(Frequency) 27
3.8 Internet Connectivity (Frequency) 28
3.9 Infrastructure/ Office Equipment’s 29
3.10 Infrastructure Rating (Frequency) 30
3.11 Assessment of FTA Efficiency (Frequency) 31-32
3.12 Assessment of information & knowledge sources and databases uses (Frequency) 33
3.13 Assessment of information & knowledge sources and databases uses (Frequency) 35
3.14 Websites used for information source (%) usage in percentage of time 36
3.15 Assessment of KKMS Portal (Frequency) 36
3.16 Assessment of Farmer Portal Website (Frequency) 37
3.17 Call Escalation System Frequency 38
3.18 Assessing the call answering system efficiency & effectiveness (Frequency) 39
3.19 Overall assessment of usefulness of training programmes (Frequency) 40-41
3.20 Overall Assessment of call handling 41
3.21 Overall Assessment of the information & knowledge available (Frequency) 42
4.1 Rating of Hardware – Percent 44
4.2 Rating of Software – Percent 45-46
4.3 Internet Connectivity – Percent 46
4.4 Frequency of Knowledge Sources used for Answering - Percent 47
4.5 Rating information & knowledge sources used – Percent 48
4.6 Frequency of updating the information in the sources - Percent 49
4.7 Overall Assessment of the Information Sources used for providing technical
information - Percent
50
4.8 Overall Assessment of the Information Sources used for providing
government schemes related information - Percent
52


vi
Table
No
Table Page
No.
4.9 Overall Assessment of the Information Sources used for providing price and
market related information - Percent
53
4.10 Overall Assessment of the above Information Sources for Other information used - percent 54
4.11 Assessment of Kisan Knowledge Management System (KKMS) Website – Percent 55
4.12 Assessment of Farmers Portal Website - Percent 56
4.13 Assessment of m-Kisan Website - Percent 57
4.14 Assessing Call Efficiency – Percent 58-59
4.15 Assessing the call answering efficiency & effectiveness - Percent 59-60
4.16 Infrastructure rating – Percent 61
4.17 Overall assessment of usefulness of training programmes 62
4.18 Self- Assessment of the FTA 63-64
4.19 Overall Assessment of Call Handling 64
4.20 Overall Assessment of hardware, Software and Infrastructure 65
4.21 Overall Assessment of Information Provided 66
4.22 Overall Assessment of Kisan Call Centre - Percent 67
5.1 Sources of information/ advice on farming – awareness, use and frequency of use - Percent 68-69
5.2 Communication media and devices used to source information (Percent) and
Awareness and use (Percent) 71
5.3 Sources of information/ advice on farming - awareness/ usefulness and quality – Percent 72
5.4 Communication media and devices used to source information –
Awareness/ use and quality – Percent
73
5.5 Type of ICT Devices/ Features used and their usefulness – percent 74
5.6 Overall Call Response Efficiency & Quality - Percent 76
5.7 Response to Questions on technical aspects – Percent 78
5.8 Response to Price and Market Questions – Percent 79-80
5.9 Response to Government Schemes Questions – Percent 81
5.10 Response to other questions (weather, services, events etc.) – Percent 82
5.11 Major objectives/ decisions you focus on in your farming – Percent 83-84
5.12 Importance of KCC on important decisions – Percent 85-86
5.13 Impact of KCC on important decisions – Percent 87
5.14 Overall assessment - Percent 89


vii
List of Boxes
Box no. Title Page
no:
1 Farmer Dials Help Line Number 6
List of Graph
Graph
no.
Title Page
no
1 Sources of information/ advice on farming – awareness, use and frequency
of use - Average
69
2 Communication media and devices used to source information Awareness
and use frequency - Average
71
3 Sources of information/ advice on farming - awareness/ usefulness and
quality – Average
72
4 Communication media and devices used to source information –
Awareness/ use and quality – Average
73
5 Type of ICT Devices/ Features used and their usefulness – Average 74
6 Overall Call Response Efficiency & Quality - Average 77
7 Response to Questions on technical aspects - Average 78
8 Response to Price and Market Questions - Average 80
9 Response to Government Schemes Questions - Average 81
10 Response to other questions (weather, services, events etc.) - Average 82
11 Major objectives/ decisions you focus on in your farming - Average 84
12 Importance of KCC on important decisions -Average
86
13 Impact of KCC on important decisions Average
88
14 Overall assessment - Average 89


viii
Executive Summary
Introduction:
There is a crying need to increase the extension services available to farmers.
ICT can also be used to bridge the gap and meet location specific information needs of
the farmers as well as bring farmers in the interiors to access technological
improvements. ICT can also facilitate interactive sessions of knowledge experts with
farmers, and by and large help agricultural universities, farmers and other stakeholders
to come together and share information.
In view of the above, the effectiveness of e services in providing advisory
services to farmers was examined, to observe the extent to which it enabled them to
make appropriate decisions and thus solve the problems they face in farming.
Accordingly a study was undertaken to study the structure, design, implementation and
performance of the government systems of Kisan Call Centres (KCC), Kisan
Knowledge Management System, Farmers’ Portal and M-Kisan Portal in the state of
Maharashtra.
Objectives and Methodology :
The study attempts to note the benefit which the farmers have received from e
services and the extent to which their problems could be solved.
More specifically, the broad objectives of the study are :
1. To examine the organizational setup, infrastructure, ICT and other systems
used and the governance of the system;
2. To observe the profile and pattern of Farmer Tele Advisers (FTAs) and also
users, the number and nature of calls and the responses given by KCCs.
3. To evaluate the performance of the system from the point of view of the
farmers/users including the ease and usefulness of the system.
4. Suggest policy measures so as to strengthen Kisan Call Centres.
The KCC for Maharashtra is located in Pune from where the Farmer Tele
Advisers (FTAs) and supervisors were contacted for relevant information.
Farmers across 4 districts (Pune, Ahmednagar, Solapur and Osmanabad)
were contacted to get appropriate feedback of their experience with KCC.
A neatly designed and very detailed questionnaire was addressed to all
stakeholders of the Kisan Call Centres, namely Supervisors, Farmer Tele Advisors


ix
(30), farmers who avail of services of Kisan Call centres (80) and some non-users (20).
A rating scale is used in the questionnaire which does the following rating:
Strongly Agree -5; Agree -4; Partially Agree/Disagree – 3; Disagree – 2; Strongly Disagree
– 1
Main Findings :
The education profile of the KCC revealed that 80 percent of FTAs were B.Sc graduates
while 13.3 percent were M.Sc graduates and the subject of specialization was mainly
agriculture.
The educational profile in the primary survey of 80 farmers who availed the
services of KCCs indicated that 43.75 percent were higher secondary and 2.50
percent were illiterate.
The caste profile of users indicated that 77.50 belonged to general/other categories.
The age-profile of users indicated that 80 percent were between 18 to 49 years.
After restructuring and shifting to Pune from Nagpur, there was a huge change in
the functioning of KCCs. The total number of FTAs increased to 69 (30 in each
shift and some extra) and the states covered were Maharashtra and Goa.
The languages used to answer queries were Marathi, Hindi and English..
There was remarkable improvement in the hardware as well as software after
restructuring of KCCs as indicated by both supervisors. They also had a data base
of farmers and were in a position to respond to farmers’ queries. All equipment
installed in the KCC improved the efficiency of the KCC.
Both supervisors in the KCC, only partially agreed that the office space was
adequate. One supervisor disagreed on the activity area of each FTA being
sufficient and felt co workers can get disturbed while calls are being answered.
There was also other noise from department and perhaps video surveillance was
not sufficient for monitoring.
One supervisor strongly agreed and the other one only agreed that FTAs are
efficient in responding to calls, answering the queries and can also access the
database/information to answer the questions.
Both supervisors partially agreed that FTAs are motivated and one supervisor only
partially agreed that FTAs take good initiative to improve, innovate and perform
better. One supervisor felt that FTAs need supervision while performing work.


x
Both supervisors felt that for information and knowledge sources, the FTAs
depended on self knowledge and internet search very frequently. The colleagues
and supervisors were frequently referred to for obtaining information.
However, on certain aspects such as knowledge from Nodal officer or field
inquiry, both the supervisors responded that such sources were never resorted to.
Also extension booklets and papers were rarely used.
The questionnaire addressed to FTAs revealed that with respect to hardware more
than half the FTAs responded that the hardware is latest and up to date, it is fast,
reliable, well maintained and interface of key board & mouse is good.
It was observed that the most frequent source of knowledge of FTAs was self
knowledge. With respect to material from Government department, 40 percent
indicated that they rarely resorted to this source and 50 percent never used field
inquiry as a source of knowledge.
More than three-fourths of FTAs strongly agreed or agreed that Kisan Knowledge
Management System (KKMS) website was user friendly, and while 66.67 percent
of FTAs indicated that call clarity is good and farmers do not face any difficulty in
understanding the dialect and overall call efficiency is good, about 30 percent
partially agreed/disagreed that call drops are less.
Also a little more than 40 percent of FTAs partially agreed/ disagreed about getting
irrelevant calls and facing abusive language.
With respect to Farmers Portal also the response of FTAs was encouraging but
36.67 partially agreed/disagreed that the information is regularly updated. The m-
Kisan website response was also on the favorable side and three fourths of FTAs
strongly agreed or agreed about smooth working of the website.
About three fourths of the FTAs together either strongly agreed or only agreed that
they were in a position to handle the questions asked by farmers and queries not
solved by them were well handled by their colleagues or supervisors.
While 50 percent agreed that power cuts are not frequent, the overall picture with
respect to infrastructure is not encouraging. There was partial
agreement/disagreement or strong disagreement over issues such as sufficiency in
lighting, adequate ventilation, noise in other departments which hinders the
answering efficiency and overall good working environment.


xi
More than half the FTAs in the sample partially agreed/disagreed or entirely
disagreed that the training programmes help in operating hardware and software.
With respect to questionnaire addressed to farmers, it was that the most important
source of information was fellow farmers and 95 percent of farmers in the sample
relied on their counterparts for information. Even KCCs were an important source
of information, followed by input companies. Kisan melas were also organized and
gaining in importance to bring awareness among farmers. Although Krishi Vigya
Kendras are supposed to be a major source of information and spread of
technology to farmers, only 28 percent of farmers referred to KVKs for advise.
The most important source of information was the mobile phone and 78 percent of
farmers were aware of the usefulness of mobile phone to access information.
About 43 percent of farmers in the sample used mobile phones frequently to get
information. The next important source of information was television and 43
percent of farmers frequently obtained information from television. It was clear
that information from websites was not at all popular among farmers. None of the
farmers had visited Farmers portal and only one farmer was aware of KKMS.
About 60 percent of farmers agreed that KCC toll free number is easy to reach but
57.50 percent partially agreed/disagreed that wait for KCC call pick –up is not too
long. About two-third of farmers strongly agreed or only agreed that the voice
reception is clear. Majority farmers agreed that FTA greets them courteously,
understands the problem.
More than half the farmers partially agreed/disagreed or disagreed that questions
escalated are well answered by nodal officers and the overall call handling and
efficiency is good. By and large with respect to overall information provided being
good and useful about half the farmers gave favourable response while half
partially agreed/disagreed or disagreed.
While 58.91 percent of farmers, strongly agreed or agreed about satisfaction with
response and information provided by FTAs, the balance partially agreed/disagreed
or disagreed.
More than 70 percent of farmers indicated that good choice of crops, high yields,
good quality of output, efficient use of input, price of produce and marketability
were either extremely important or very important criteria while undertaking
farming.


xii
About 25 percent felt that less risk, least crop loss, respect in community were
moderately important while undertaking farming decisions. About 30 percent
indicated that self consumption is slightly important while selecting the crop.
With respect to credit and insurance decisions, 100 percent of farmers indicated
that KCCs are extremely important to guide them on such issues.
About 74 percent farmers felt that KCCs are very important to advise them on
disease control decisions.
About 67 percent farmers felt that KCCs are useful in providing information on
storage decisions but moderately important on risk reduction decisions.
Half the farmers (52.38 percent) noted that KCCs had only moderate importance
on their planting decisions and quality improvement.
With respect to supply chain and transport decisions 100 percent farmers indicated
that KCCS are not important.
About, 54.43 percent farmers felt that the quality of information provided by KCCs
is good while 40 percent revealed that it is satisfactory.
With respect to continuation of KCCs, 30.38 strongly agreed that KCCs should be
continued while 51.90 percent agreed. Thus overall 82.28 percent of farmers felt
that KCCs should be continued and 17.72 percent partially agreed/disagreed.
Overall, it therefore appears that farmers are very keen on KCCs being
continued, but ofcourse efforts will have to made on various aspects relating to
infrastructure in KCCs as well as quality of response by FTAs so that farmers gain
and FTAs also work under better conditions.
6.2 Policy Implications :
The major policy implications that emerge from the study are :
On visit to the KCC in Pune and also as indicated by supervisors, it was observed
that the activity area of the KCC was insufficient and there was disturbance to
FTAs. Hence, it is necessary to ensure that office space is suitable, well ventilated,
adequate toilet facilities are provided and overall work conditions are improved.
Besides better work conditions, the FTAs also felt that they are not only underpaid
but also have contractual appointment. Hence this issue must be addressed by
concerned officials.
Also since large number of calls come daily, there is need to increase the number
of FTAs in KCC.


xiii
Since self knowledge and internet search were the main source of knowledge to
FTAs, it is very important to provide them with more sources of information such
as booklets, information on latest government schemes, field visits, knowledge
from Nodal officers, etc.
The websites should also be regularly updated and training programmes should be
regularly conducted so that FTAs are in a position to give good advisory services
to farmers which is the very purpose of the scheme.
Efforts must also be made to ensure that farmers are satisfied with response given
by FTAs as this will promote the use of KCCs as a source of extension services.
Also escalation of questions to higher levels must be improved so that if any calls
are not handled by FTAs, they should be satisfied by Nodal officers.
Thus overall it can be concluded that while KCCs do have the potential to
provide extension services to each and every farmer, irrespective of location, the
service must be improved by ensuring that the infrastructure is up to the mark, the
FTAs have upto date knowledge on all agricultural operations as well as on
government schemes and farmers are also aware of such a service. If this happens,
then with increasing use of KCCs, farmers will be able to resolve their queries, avoid
crop failure and thus increase productivity which will provide the much needed boost
to the agricultural sector.


1
Chapter 1
Introduction
1.1 Backdrop :
The agricultural sector in the Indian economy, as is well known, is
experiencing much lower rates of growth as compared to the manufacturing and
service sectors. Hence in order to achieve higher overall economic growth rate, it is
important to increase productivity in the agricultural sector which will also help to
contribute to increased rural incomes and employment. This will help to build a strong
foundation for increase in consumer demand in rural areas and thus stimulate growth
in other sectors of the economy.
However, the agricultural sector is plagued with several handicaps which serve
as an impediment to growth and poor extension services is one such major constraint
which restricts growth in the sector. Lack of resources, reluctance on the part of
government personnel to serve in the interiors, etc. are some factors responsible for
limited availability of extension services. However, farmers require continuous advice
on various technologies including soil health, cropping practices, plant protection,
weather forecast, postharvest technology, clinical services for animals, prices of
various crops, etc. If such timely information is provided, it will help to enhance
productivity of crops/animals and thus ultimately increase incomes of farmers.
Indian agriculture is characterized by a large number of landholdings to the
tune of 138.35 million and thus extension services which should play a lead role in
providing advisory services to farmers are under tremendous stress due to financial,
infrastructural and human resource limitations. Hence farmers do not receive correct
information on crop/animal husbandry which leads to imperfect decisions thus leading
to poor crop performance. At times, the farmers depend upon input dealers for advice
and also end up purchasing spurious inputs which lead to total crop failure and finally
agrarian distress.
In view of the above, the government has encouraged not only public, and
private sector but also NGOs, to provide the much needed extension services to
farmers. However, given the size of the agricultural sector, the magnitude of the
manpower is still insufficient to meet the requirements and therefore the ratio of farm
households to extension workers is far from satisfactory, although it is an important

2
mandate of the government. In this context, recent developments in Information and
Communication Technology (ICT) which can provide speedy advisory services along
with technical updates to farmers in order to resolve their problems are being
promoted. Accordingly, the Government of India under the National e-Governance
Plan have developed e-enabled services such as setting up of Kisan Call Centres
(KCC), Kisan Knowledge Management System (KKMS), Farmers” Portal and M-
Kisan Portal which have gradually evolved since 2004.
1.2 Kisan Call Centres:
In order to harness the potential of ICT in Agriculture, Ministry of Agriculture
took a new initiative by launching a scheme entitled „Kisan Call Centres” on January
21st, 2004, with the main purpose of responding to queries of farmers on agriculture
related information through telephone in the farmer‟s own dialect. A country wide
common eleven digit number 1800-180-1551 has been allotted for the KCC. The
number is accessible through all mobile phones and landlines of all telecom networks
including private service providers. The farmers are given response in 22 local
languages and call are attended from 6.00 A.M. to 100.00 P.M. on all seven days of
the week at each KCC location. During working hours, there is immediate response to
the query of the farmer, but beyond working hours, the call is recorded and the queries
are answered later by post.
The design of the KCC in 2004 when it was launched was that a farmer could
reach an agricultural graduate or expert (Level-I) who was to respond to his queries
and problems. In case the respondent at Level-I is not able to satisfy the farmer, the
call be taken through conference at Level-II to a higher level expert. If the farmer is
not satisfied at Level –II, he could solve his problem at Level-III at the highest level
Nodal centre. However, after setting up KCCs in 2004, there were some teething
problems such as poor monitoring, and large number of locations with a small capacity
and insufficient investment in technology. There was also frequent breakdown of
devices such as telephone lines and telephone instruments. There was also
considerable time to connect to the call and no record of telephonic conversation. The
answers given by Farmer-Tele advisers (FTAs) were also questioned and they received
limited training and capacity building. Further, the feedback of farmers was not taken
on quality of services and by and large there was limited demand for these services
(www.mmp.cips.org.in/documents/workshops/2015/8-11/shri_R_K_ Tripathi pdf)

3
In view of the inherent shortcomings, the call escalation process was
restructured, revised and strengthened from April 2011 and began to involve (i) State
Agricultural Departments from block to state level, (ii) State Agricultural Universities
and Krishi Vigyan Kendras and KCC agents to answer queries of farmers by way of
call conferencing with experts from these organizations in case the call centre agent is
unable to answer the query of the farmer. Active involvement of Common Service
Centres (CSC) and other stakeholders is also envisaged so that the query of the farmer
will be resolved. In the revised plan, since Level II of the escalation after KCC is at the
block level, it is necessary to have atleast one expert on each aspect in every block.
The District Level Designated Officers in each district need to be enabled by State
level Designated Officers. The states have been requested to take up the following
steps to implement the revised escalation matrix :
A Kisan Knowledge Management System (KKMS) to be developed so that
correct, consistent and quick replies to the queries of farmers be given.
Hence appropriate and validated information on Agriculture and allied
sectors must be put up on its website, www.dackkms.gov.in. The web site
contains knowledge data base on package of practices on agriculture,
horticulture and animal husbandry of each state. The KCC agents working at
various locations of the country have access to this web site through their
specific ID‟s and password provided to them and can use the information
provided in this web site to satisfy the query of the farmer.
To proactively get involved in activities of KCCs and supervise the quality
of extension services provided by the KCC agents and ensuring the revised
escalation matrix under Kisan Knowledge Management System (KKMS) is
put in place and higher level officers keep a track of the answers given at the
lower level.
To coordinate with the state IT department to get the scheme rolled out
throughout the CSCs and appointment of a Nodal officer for KCC.
On line monitoring
Keep the KCC agents apprised about new
schemes/programmes/contingency plans implemented by cental and state
government.

4
Provide the KCC agents with latest versions of guide books and booklets
brought out by the state government and the local Agricultural universities.
Organize monthly video conference on pre-announced dates in the
university campus or through State Information Centre for interaction of
KCC agents with the Divisional/Zonal level officers of the state agriculture
and allied departments.
The KCCs must give a weekly feedback to the state department of
agriculture and allied departments regarding the nature of call including area
specific prevalence of crop diseases, pest infestation, etc.
To create login IDs to various officers of the state governments, KVKs and
SAUs from block level upwards.
Besides the KCC agents, farmers and other stakeholders can also have direct
access to the knowledge data base search on package of practices in the KKMS
website by merely clicking on the “Kisan Login” displayed on the front page of web
site to search for desired information available on the web site for their own use.
Further, in order to create awareness among the farming community about KCC
programme, audio/video spots on KCC are broadcast through All India Radio/
Doordarshan and private television channels
(www.mkisan.gov.in/images/featurekccpdf).
Thus as per restructured scheme the KCCs were revamped by consolidation
and appointing a new service provider for KCC namely IFFCO Kisan Sanchar Limited
which is a subsidiary of IFFCO with the purpose of setting up state of the art KCCs at
14 identified locations. The restructured KCCs are thus more professional with the
following innovations :
a) Voice/media Gateways
b) Dedicated MPLS leased line network with dedicated bandwith
c) Call barging
d) SMS to caller farmers providing a gist of advisories to them on mobile
phone

5
e) Voice mail system for recording farmer‟s queries with provision for call
back to the caller
f) Soft phones in every personal computer with caller ID facility
g) Up scaling the knowledge of Call Centre agents by providing them the
latest version of guide books and booklets issued by State Agricultural
Department of the Agricultural Universities.
h) Provision for registering the farmers so that they can receive SMS
messages on agri advisories and mandi prices of various commodities as
per their requirements.
After restructuring, it was observed that the number of calls in all locations
together which was 2.21 lakhs in 2003-04 increased to 20.44 lakh in 2010-11 and is
about 48.01 lakh in 2014-15. This indicates that after restructuring the farmers are
using the services of KCC to satisfy their queries.
Under the revised scheme, if the KCC or the Common Service centre is not
able to respond immediately, the query is sent to block and is to be replied within two
or three days. If the query is not been resolved it is escalated to district level officer
and is to be replied within a week and if still the problem is not addressed, it is referred
to the State Level officer.
Thus the overall functioning of KCCs through the escalation matrix can be
observed from flow chart 1.

6
Source : http://crispindia.org/wp-content/uploads/2015/10/Kisan-Call-Centre-Sudhakar-
Reddy.pdf

7
1.3 M- Kisan Portal – Mobile based services for Farmers :
Under the National e-Governance Plan-Agriculture, an SMS Portal was
inaugurated by the Hon”ble President of India in 2013 which provides mobile based
services to farmers. While mobile phones have deeply penetrated into rural India, the
use of internet facilities is still very limited. In this context, mobile messaging is a very
effective tool which can reach the interiors. Hence M-Kisan-SMS Portal for farmers
was created which enables all central and state government organizations in agriculture
and allied sectors to give information/services/advisories to farmers by SMS in their
language on agricultural practices and specific needs of farmers. Unstructured
Supplementary Service Data (USSD), Interactive Voice Response System (IVRS) and
SMS are also value added services which have enabled farmers and other stakeholders
to not only receive messages which are broadcasted but to also get web based services
on their mobile without having internet. The purpose of this initiative is also to reach
out to semi-literate and illiterate farmers through voice messages. Thus SMS Portal
was conceptualized to give a quantum leap in coverage of farmers and geographical
area in a timely, specific, holistic and need based knowledge dissemination among the
farmers. This is done by leveraging the power of mobile telephony in such a way that
all sectors use this platform to not only reach out to the farmers but also resolve their
problems and queries.
The main objective of the project was to first create a centralized knowledge
base from the perspective of farmers which was termed as Farmers‟ Portal
(www.farmer.gov.in) in Hindi and English language. It was observed that while over
800 websites of various departments and organisations related to agriculture and allied
sectors in the central and state governments and 80 portals of the department pertained
to agriculture and allied departments, there was not a single portal for the farmers. This
created the need for a portal especially for farmers and SMS portal was introduced.
This portal became very popular by all users and a third level domain was created for
all mobile based services for farmers on a Unified Portal namely, www.mkisan.gov.in.
The purpose of the Portal are mainly :
a) To make SMS and other mobile based services as a tool of two way
agricultural extension so that not only specific information/advisory
services are provided to farmers in a broadcast mode but the farmer can
also raise specific queries through Pull SMS or USSD.

8
b) Since mobile phones have penetrated in the interiors at a rapid pace and
there is wide coverage the portal aims at covering every farm household
and bringing a level playing field for small and large farmers also.
c) To bring about a centralized system wherein different modes of information
flow are channelized and spread to the farmers in their own language.
d) To make an integrated portal which ensures storage of previous
advisories/messages and also effective monitoring.
e) Since internet penetration is very limited, sending text messages to bridge
the gap.
f) Providing web based services through SMS or USSD is also an important
goal.
g) Integration with other farmer-centric services such as Kisan Call Centres,
Common Service Centres, Web Portals for extracting relevant information
and also for feeding data from remote locations where internet services are
not available or are unreliable.
The SMS portal has unique features like database to shift farmers to block level
and to select specific agricultural commodities/ correction of messages by supervisory
officers, searchable of data base of previous advisories, etc. Nearly 3000 officers and
experts from central and state government have been activated and are using the portal
in 12 languages by using easy phonetic typing. About 7 million farmers have already
opted to receive advisories & services on their mobile phones. The farmers have been
put in groups depending upon the state, district, block and the crop /activities selected
by respective farmers. Nearly 20 web based services across the country have been
integrated with the SMS portal and many more are in the queue. Some of these include
buyer-seller interface, choice of machine & dealer, Kisan Call Centre, market prices,
agromet advisories, farm mechanization, micro-irrigation, animal husbandry, fertilizer
testing, etc.
The registration of experts has been simplified and made more broad based so
that it reaches to every nook and corner of the country in every aspect of agriculture
and allied services. Further, apart from advisories and information, a number of
government services have been integrated with the portal such as e-Payment,
Licensing of dealers (seeds, fertilizers and pesticides), soil testing and soil health
cards, etc. Monitoring of advisories sent by experts at different levels is also an inbuilt

9
process wherein a senior officer can view the advisories sent by his subordinates and
also rate the same. Wherever needed, these advisories can be revised and resent to the
farmers in supersession to the earlier ones. The dash board of the portal provides a
transparent view of the SMSs sent by experts which can traced down from national to
block level officers, presenting the messages sent by individual experts at respective
levels. Also instead of generic advisories and information, area and crop specific
information, as well as technical inputs are provided
(http://mkisan.gov.in/aboutmkisan.apx).
1.4 Review of Literature :
ICT has a major role to play in agriculture and realizing the importance the
government launched various modes of delivery of e-enabled services under its
National e-Governance Plan. Kisan Call Centres, Kisan Knowledge Management
Systems and Farmer‟s Portal are major e-services provide to farmers. Hence, the use of
these services has been reviewed to reveal the usefulness as well as recommendations
for further improvement of these services.
A study (Sharma, B.R. and others, 2011) analysed the role of Kisan Call
Centres in Himachal Pradesh and noted that this service was more utilized by
progressive farmers and in the total sample, the vegetable growers had maximum calls,
followed by foodgrain growers and fruit growers. The highest calls were recorded for
diseases followed by problems relating to animal husbandry. The study further
revealed that those farmers who used services of KCC benefitted more as their
productivity levels were higher and hence the need for extension services must be
extended so that farmers can produce efficiently as well as scientifically.
A paper on dissemination of farm information through agri portals
(Shankaraiah, n and others, 2012) explains various e-agriculture extension services
which can reach the last mile and thus promote agricultural development in the
country. The study gives the example of Warna , (Maharashtra) a cluster of 70 villages
where a “wired village project” was launched. The project was initiated to serve the
information needs on various crop cultivation practices of major crops, pest and
disease control, marketing information, etc. A survey was conducted to find out the
usefulness of the services of the wired village project and 95 percent of respondents
indicated that electronic services are very useful in improving their standard of living.
Most of them used to spend 1-3 days for availing services, but after the launch of e

10
services, they can access information within an hour. The cost of services has also
reduced after the project was launched and further, farmers felt that they have
experienced increase in production levels due to timely availability of services.
A SWOT analysis (Anup Kumar Das, 2014 http://cckn-
ia.org/download/publications/150122/11_SWOT_Analysis_Report_Odisha.pdf) for
Odisha on agriculture knowledge information networks noted that KCCs provide a
unique platform for providing farm solutions to the community through real time
query resolve process. This forum can be used as a potential source for agriculture and
weather based information dissemination for rural communities. Hence, the analysis
recommended that the subject matter specialists who provide information to KCCs can
be imparted adequate capacity building exposure so that they can gain up-to -date
knowledge base and access to relevant information which will help smooth functioning
of KCCs.
Ramasubbian H, and others (2015) also conducted a study on information and
communication technology in Indian agriculture with special reference to KCC. The
study noted that large part of rural areas did not have access to ICT because of
illiteracy of farmers who mainly belong to low income group. Hence the study
recommended that internet services should be available at low cost and rural
information centres should be set up to facilitate farmers to ease the use of Kisan Call
Centres. Another study (Das, Ganesh, 2016) was conducted to observe the perception
of KCC by the farmers in West Bengal. It was observed from the investigation that
majority of the respondents felt that the system of calling is readily accessible and
SMS from KCC is easily understandable. However, farmers did not feel that response
from voice call was good, perhaps due to inconvenient timings.
Overall, it can be observed from review of literature that there is urgent need to
expedite e services to farmers, so that farmers can access timely agronomic services
and thus improve their productivity levels.
1.5 The need for a strong Information system :
The field of ICT is growing rapidly and even transfer of technology deserves
attention. Web portals facilitate the presentation of information from various sources
in a unified way. With respect to agriculture also, agri portals have been developed
which are supposed to provide most recent information on variables such as prevailing
market prices in various markets, weather reports, creation and maintenance of
statistical data base on major parameters related to agriculture, suitable package of

11
practices for crops, etc. This can help extension workers to access latest information on
agricultural practices and thus ICT and help and expedite the process of transfer of
technology. If farmers get access to this technology, it will definitely help him to
practice farming in a scientific manner and thus increase productivity. This certainly
brings about the need for a strong e-agricultural extension system. When messages are
disseminated to farmers manually, as in the traditional system, it is obvious that
majority of farmers will be excluded. Therefore, in order to reach about 13 crore
farmers in India, spread over a different agro-climatic regions, use of ICT support is
the best solution. ICT can also be used to meet location specific information needs of
the farmers and also bring farmers in the interiors in isolated areas to access
technological improvements. ICT can also facilitate interactive sessions of knowledge
experts with farmers, and by and large help agricultural universities, farmers and other
stakeholders to come together and share information. The extent of learning depends
upon how well the information is assimilated and how widely it is disseminated.
In view of the above, it is important to examine the effectiveness of e
services in providing advisory services to farmers so that they are in a position to make
appropriate decisions and solve the problems they face in farming.
1.6 Objectives of the study :
The main objectives of the report are to study the structure, design,
implementation and performance of the government systems of Kisan Call Centres,
Kisan Knowledge management System, Farmers‟ Portal and M-Kisan Portal in the
state of Maharashtra. The study attempts to note the benefit which the farmers have
received from these services and the extent to which their problems could be solved.
More specifically, the broad objectives of the study are :
1. To examine the organizational setup, infrastructure, ICT and other systems
used information content and flow, ability of manpower involved and the
governance of the system.
2. To observe the record of the use of the systems-the profile and pattern of
users, the number and nature of calls and the responses given by KCCs.
3. To evaluate the performance of the system from the point of view of the
farmers/users including the ease and usefulness of the system. Also the
information needs of the farmers and the extent to which these are satisfied
is noted.

12
4. To suggest policy measures with respect to improvement in the system and
making it more effective so that farm productivity will be enhanced, and
the agricultural sector will get a boost.
1.7 Methodology :
The study is conducted in the state of Maharashtra with the help of primary
and secondary data. The number of calls attended in the state (district-wise) is
indicated in Table 1.1 and the percentage share is indicated in table 1.2.
It can be observed from Table 1.1 that the number of calls in Maharashtra has been
increasing over the years. Before restructuring of KCCs in 2012, the number of
calls from 2003-04 to 2012 were about 4 lakhs, but the number of calls
significantly multiplied from 2013-14. Among the districts of Maharashtra,
maximum calls were received from Ahmednagar district followed by Solapur.
Overall however, over the 36 districts of Maharashtra, the distribution of calls
received by KCC is quite evenly spread. Districts in the Konkan region of the state
have a negligible share in total calls made, perhaps since their cropping pattern is
fixed in terms of paddy due to assured rainfall. Discussions with farmers revealed
that common queries related to usage of appropriate insecticide in case of crop
being attacked by disease, suitable fertilizer to be applied, prevailing price in the
market and decision on whether to store the crop . Also call frequency went up
during harvest time, as farmers wanted information on prevailing market price. In
case standing crop was on field and affected by pests, the KCC received calls on
appropriate pesticide to be used.
The KCC for Maharashtra is located in Pune from where the FTAs and
supervisors were contacted for relevant information. Farmers across 4 districts
were contacted to get appropriate feedback of their experience with KCC.

13
Table 1.1: District-wise Number of Calls attended
Sr. No District Name 2013-14 2014-15 2015-16 2016-17 Overall
1 Ahmadnagar 49552 63718 62734 51817 227821
2 Akola 21026 21918 33297 26586 102827
3 Amravati 19003 21481 27987 23303 91774
4 Aurangabad 30689 38023 45475 40894 155081
5 Beed 29411 33694 41318 38779 143202
6 Bhandara 3857 5268 5305 3408 17838
7 Buldana 38762 37799 60069 44193 180823
8 Chandrapur 5281 6180 7774 7059 26294
9 Dhule 9525 9750 15753 10286 45314
10 Gadchiroli 978 1379 1489 1455 5301
11 Gondiya 1949 2542 2982 2202 9675
12 Hingoli 20056 21594 30058 24902 96610
13 Jalgaon 25612 26627 36761 25496 114496
14 Jalna 26226 36570 39606 36685 139087
15 Kolhapur 10263 10851 12389 8813 42316
16 Latur 15956 20719 22576 21438 80689
17 Mumbai 555 729 697 795 2776
18 Mumbai suburban 112 116 28 17 273
19 Nagpur 9940 12197 13259 10648 46044
20 Nanded 32622 37628 48518 42736 161504
21 Nandurbar 1752 2319 2283 1644 7998
22 Nasik 45562 48559 55943 39632 189696
23 Osmanabad 19703 25279 27062 23503 95547
24 Palghar 0 0 0 5 5
25 Parbhani 24837 27621 39098 32502 124058
26 Pune 20867 23008 25510 19429 88814
27 Raigarh 841 1028 859 705 3433
28 Ratnagiri 630 912 753 526 2821
29 Sangli 16362 16079 18232 12863 63536
30 Satara 12454 13155 15301 10758 51668
31 Sindhudurg 655 745 666 437 2503
32 Solapur 47511 42702 62555 52540 205308
33 Thane 1787 2144 2361 1344 7636
34 Wardha 7200 8709 10440 8167 34516
35 Washim 18805 18371 31847 25121 94144
36 Yevatmal 24102 24840 34125 29714 112781
Total 594443 664254 835110 680402 2774209
Source: Office of Kisan Call Centre, Pune.

14
Table 1.2: District-wise Percentage of Number of Calls attended
Sr.
No District Name
2013-
14
2014-
15
2015-
16
2016-
17 Overall
1 Ahmadnagar 8.34 9.59 7.51 7.62 8.21
2 Akola 3.54 3.30 3.99 3.91 3.71
3 Amravati 3.20 3.23 3.35 3.42 3.31
4 Aurangabad 5.16 5.72 5.45 6.01 5.59
5 Beed 4.95 5.07 4.95 5.70 5.16
6 Bhandara 0.65 0.79 0.64 0.50 0.64
7 Buldana 6.52 5.69 7.19 6.50 6.52
8 Chandrapur 0.89 0.93 0.93 1.04 0.95
9 Dhule 1.60 1.47 1.89 1.51 1.63
10 Gadchiroli 0.16 0.21 0.18 0.21 0.19
11 Gondiya 0.33 0.38 0.36 0.32 0.35
12 Hingoli 3.37 3.25 3.60 3.66 3.48
13 Jalgaon 4.31 4.01 4.40 3.75 4.13
14 Jalna 4.41 5.51 4.74 5.39 5.01
15 Kolhapur 1.73 1.63 1.48 1.30 1.53
16 Latur 2.68 3.12 2.70 3.15 2.91
17 Mumbai 0.09 0.11 0.08 0.12 0.10
18 Mumbai suburban 0.02 0.02 0.00 0.00 0.01
19 Nagpur 1.67 1.84 1.59 1.56 1.66
20 Nanded 5.49 5.66 5.81 6.28 5.82
21 Nandurbar 0.29 0.35 0.27 0.24 0.29
22 Nasik 7.66 7.31 6.70 5.82 6.84
23 Osmanabad 3.31 3.81 3.24 3.45 3.44
24 Palghar 0.00 0.00 0.00 0.00 0.00
25 Parbhani 4.18 4.16 4.68 4.78 4.47
26 Pune 3.51 3.46 3.05 2.86 3.20
27 Raigarh 0.14 0.15 0.10 0.10 0.12
28 Ratnagiri 0.11 0.14 0.09 0.08 0.10
29 Sangli 2.75 2.42 2.18 1.89 2.29
30 Satara 2.10 1.98 1.83 1.58 1.86
31 Sindhudurg 0.11 0.11 0.08 0.06 0.09
32 Solapur 7.99 6.43 7.49 7.72 7.40
33 Thane 0.30 0.32 0.28 0.20 0.28
34 Wardha 1.21 1.31 1.25 1.20 1.24
35 Washim 3.16 2.77 3.81 3.69 3.39
36 Yevatmal 4.05 3.74 4.09 4.37 4.07
Total 100.00 100.00 100.00 100.00 100.00
Source: calculated from Table 1.1.
Overall, the questionnaire was addressed to the supervisors, FTAs and
farmers who were both users as well as non-users. The sampling design can be
observed In Table 1.3.

15
Table 1.3: Address of Questionnaire
Respondent Number
Supervisor 2
Farmer Tele Adviser 30
Farmers who are users of KCC 80
Farmers who are non-users of KCC 20
The districts selected with respect to farmers who used KCC services and
farmers who did not utilize such services can be observed from Table 1.4.
Table 1.4 : District wise selection of sample size of user and non-user farmers of KCC
District Pune Ahmednagar Solapur Osmanabad Total
Users of
KCC
38 25 10 7 80
Non-Users
of KCC
- 20 - - 20
From the data in Table 1.2, it can be observed that over the period 2013-14 and
2016-17, maximum calls were made by Ahmednagar and Solapur districts. The field
work to select the user –farmers of KCC therefore started in these two districts.
However, the field investigators were finding it very difficult to locate the users as
they were spread far and wide and were not accessible on mobile phone. As many
users possible, i.e 25 users in Ahmednagar and 10 users in Solapur, were addressed
with the questionnaire. Farmers belonging to Pune district, who were more conversant
with KCC were also selected to get their views on KCC. Finally, 10 farmers were
selected from Osmanabad district, as this district is facing crisis in the agricultural
sector. Therefore, overall four districts were covered in order to collect data on usage
of KCC by farmers. This enabled us to obtain a broader perspective on views of
farmers with respect to KCC over four districts of the state. With respect to non-users,
Pune district was selected, as the largest number of users in the sample was from this
district.
Thus with the above sample size, the study on Kisan Call centre, Kisan
Knowledge Management System, Farmers‟ Portal and M-Kisan Portal is conducted. A
neatly designed and very detailed questionnaire has been addressed to all stakeholders

16
of the Kisan Call Centres, namely Supervisors, Farmer Tele Advisors, Farmers who
avail of services of Kisan Call centres.A questionnaire has also been addressed to Non-
Users of KCC services A rating scale is used in the questionnaire which does the
following rating:
Strongly Agree -5; Agree -4; Partially Agree/Disagree – 3; Disagree – 2;
Strongly Disagree - 1
The first chapter which is introductory is followed by chapter 2 which first
gives socio-economic characteristics of FTAs and farmers in the sample and then
observes the profile of the KCC by addressing a detailed questionnaire to the two
supervisors of the KCC. In chapter 3, the questionnaire addressed to FTAs is analysed
while in chapter 4, the questionnaire addressed to farmers (both users and non-users is
analysed. In chapter 5 the policy issues to be addressed are discussed.

17
Chapter 2
Sample Profile of Kisan Call Centre (Maharashtra)
2.1 Backdrop:
The Kisan Call Centre for Maharashtra is located in Pune. The number of calls
in Maharashtra has been increasing over the years. Before restructuring of KCCs in
2012, the number of calls from 2003-04 to 2012 were about 4 lakhs, but the number of
calls significantly multiplied from 2013-14. In 2013-14, the number of calls received
was 5.94 lakh which increased to 6.64 lakh in 2014-15. There was a further increase in
number of calls received in 2015-16 to 8.35 lakh. This shows that after restructuring
was done farmers began availing of the facility of KCC in a bigger way. However, if
we take into consideration the number of farmers in each district, the average call per
farmer is even less than one. This indicates that all farmers in the district are not
regularly using services of KCCs.
In what follows, an attempt is made to understand the profile of the KCC office
located in Pune.
2.2 Profile of FTAs and Farmers (Users and Non-Users of KCC Services) :
It can be observed from Table 2.1, that out of 30 FTA’s who were addressed
with a questionnaire, 56.67 percent were male and 43.3 percent were female.
Table 2.1 : Gender Profile of FTA’s Surveyed
Gender Number Percent (%)
Male 17 56.67
Female 13 43.33
Total 30 100.00
Source : KCC survey, Pune.
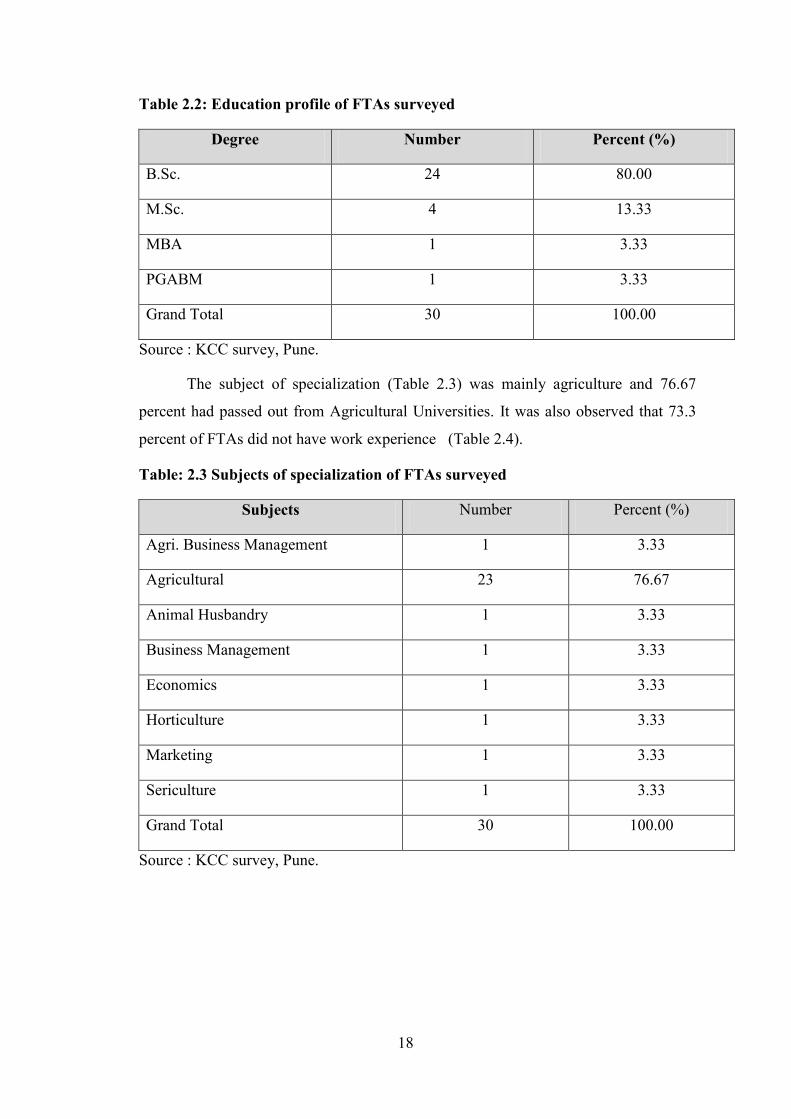
The education profile of the KCC (Table 2.2) reveals that 80 percent of the
FTAs were B.Sc. graduates while 13.33 percent were M.Sc. graduates.
18
Table 2.2: Education profile of FTAs surveyed
Degree Number Percent (%)
B.Sc. 24 80.00
M.Sc. 4 13.33
MBA 1 3.33
PGABM 1 3.33
Grand Total 30 100.00
Source : KCC survey, Pune.
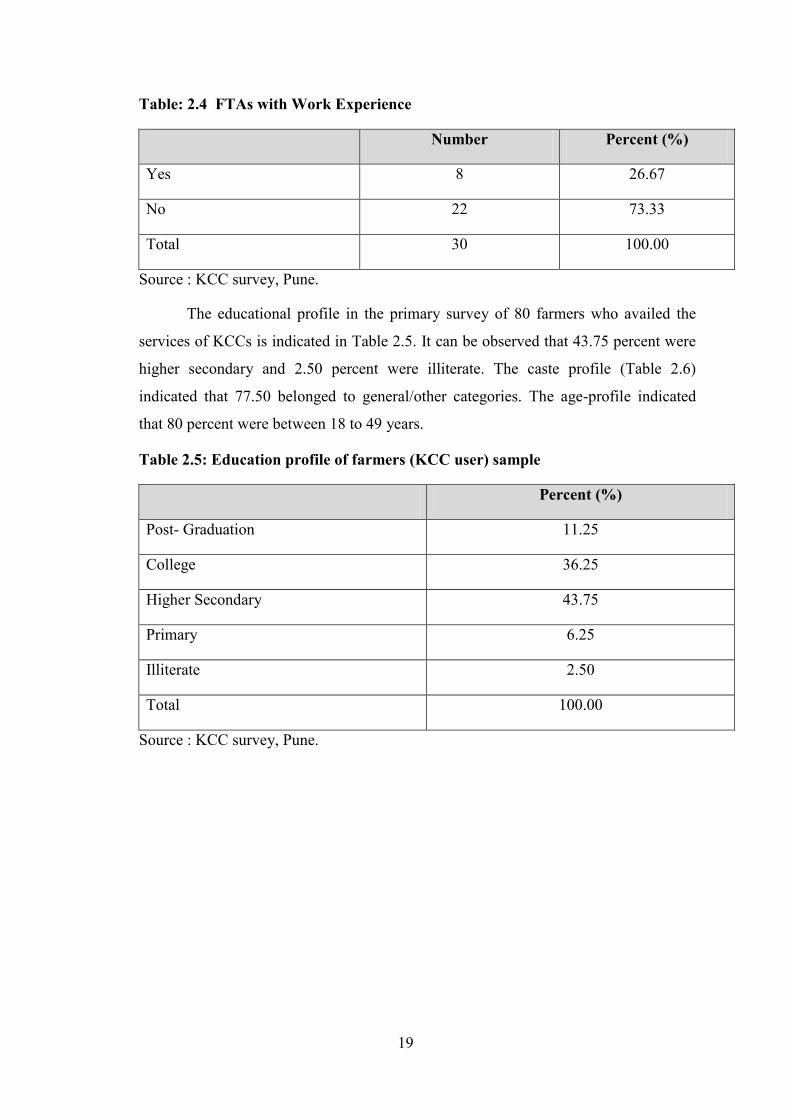
The subject of specialization (Table 2.3) was mainly agriculture and 76.67
percent had passed out from Agricultural Universities. It was also observed that 73.3
percent of FTAs did not have work experience (Table 2.4).
Table: 2.3 Subjects of specialization of FTAs surveyed
Subjects Number Percent (%)
Agri. Business Management 1 3.33
Agricultural 23 76.67
Animal Husbandry 1 3.33
Business Management 1 3.33
Economics 1 3.33
Horticulture 1 3.33
Marketing 1 3.33
Sericulture 1 3.33
Grand Total 30 100.00
Source : KCC survey, Pune.
19
Table: 2.4 FTAs with Work Experience
Number Percent (%)
Yes 8 26.67
No 22 73.33
Total 30 100.00
Source : KCC survey, Pune.
The educational profile in the primary survey of 80 farmers who availed the
services of KCCs is indicated in Table 2.5. It can be observed that 43.75 percent were
higher secondary and 2.50 percent were illiterate. The caste profile (Table 2.6)
indicated that 77.50 belonged to general/other categories. The age-profile indicated
that 80 percent were between 18 to 49 years.
Table 2.5: Education profile of farmers (KCC user) sample
Percent (%)
Post- Graduation 11.25
College 36.25
Higher Secondary 43.75
Primary 6.25
Illiterate 2.50
Total 100.00
Source : KCC survey, Pune.

20
Table 2.6: Caste profile of farmer (KCC users) sample
Caste Percent (%)
Others/General 77.50
OBC 21.25
ST 0.00
SC 1.25
Total 100.00
Source : KCC survey, Pune.
Table 2.7: Age Profile Sample Farmers (KCC Users)
Age Group Number Per cent (%)
18-29 20 25.00
30-39 24 30.00
40-49 20 25.00
50-59 9 11.25
60-69 7 8.75
70 and Above 0 0.00
Total 80 100.00
Source : KCC survey, Pune.
A similar exercise was conducted with respect to non-user farmers of KCC
services. It was observed that 45 percent were higher secondary pass and 25 percent
were illiterate. With respect to caste (Table 2.9) it was observed that 55 percent were
OBC category while 40 percent belonged to other/General category. The age profile of
non-users showed that 45 percent were in the age group 50-59 years.

21
Table 2.8 : Education profile – Non-users
Education Percent (%)
Post-Graduation 5.00
College 25.00
Higher Secondary 45.00
Primary 0.00
Illiterate 25.00
Total 100.00
Source : KCC survey, Pune.
Table 2.9 : Caste Profile-Non-Users
Caste Per cent (%)
Others/General 40.00
OBC 55.00
ST 0.00
SC 5.00
Total 100.00
Source : KCC survey, Pune.

22
Table 2.10: Age Profile Farmers (Non-Users)
Age Group Number Percent (%)
18-29 0 0.00
30-39 3 15.00
40-49 4 20.00
50-59 9 45.00
60-69 3 15.00
70 and Above 1 5.00
Total 20 100.00
Source : KCC survey, Pune.

23
Chapter 3
Profile of Kisan Call Centre and Functioning
3.1 Backdrop :
Kisan Call Centres are supposed to play a very useful role in providing timely
information to farmers. However, in order that they function efficiently, it is important
that suitable infrastructure is in place, in terms of hardware, software and other
facilities to FTAs. In the absence of a conducive environment, the supervisors as well
as FTAs may not be able to function efficiently. Hence in this chapter the profile of
KCC for Maharashtra and its functioning is observed.
3.2 Profile of Kisan Call Centre :
The Kisan Call Centre, located in Pune provides advisory services to farmers in
Maharashtra and Goa. Prior to being stationed in Pune, it was located in Nagpur in
2004. However, when the KCC office was in Nagpur, its functioning was very limited
due to inadequate infrastructure. The calls were received on landline and there were
only 3 FTAs in each shift and one supervisor. The calls received per day were barely
200 and information available with FTAs was also very limited. However, in 2012
restructuring took place, and KCC office was established in Pune on 1st May 2012.
After shifting to Pune, there was a huge change in the functioning of KCCs. The total
number of FTAs increased to 69 (30 in each shift) and the states covered were
Maharashtra and Goa languages used to answer queries were Marathi, Hindi and
English (Table 3.1 ).
Table 3.1 : Profile of Kisan Call Centre
States
Covered
Maharashtra, Goa
Languages
Used
Marathi, Hindi, English
Number of
FTA's
69
Source : KCC survey, Pune.

24
Table 3.2 : History of Development of Kisan Call Centre
Location
1st 2nd 3rd
Year of
Start/
relocation
Nagpur
2004
Pune
2012 -
Number of
FTA's 3 in each shift 27 in each shift -
Number of
KCC agents 1 in each shift 1 in each shift
Source : KCC survey, Pune.
3.3 : Improvements in KCCs Post Restructuring :
The purpose of restructuring KCCs was to improve the software, hardware and
also increase the scale of operations. Hence in the following questionnaires addressed
to the two supervisors in the KCC office at Pune, (from Table 3.3 to Table3.8 ), an
attempt is made to assess the improvement in the equipment and the software that is
used.
From Table 2.13, it can be observed that there was remarkable improvement in
the hardware as well as software after restructuring of KCCs. The KCC had two
supervisors and both supervisors strongly agreed that there is better hardware, better
software and much improved connectivity. They also had a data base of farmers and
were in a position to respond to farmers’ queries. All equipment installed in the KCC
improved the efficiency of the KCC. By and large, responses related to hardware as
well as software revealed that both supervisors felt that they were very satisfied and
hence efficiency of KCC is enhanced.

25
Table 3.3 : Comparison of present and past KCC by Supervisors (Number)
Strongly
Agree Agree
Partially
Agree/Disagree Disagree
Strongly
Disagree
Better
Hardware/equipment
2 - - - -
Better Software 2
- - - -
Better Connectivity 2
- - - -
Better farmer
database
2 - - - -
Better ability to
respond farmers calls
2 - - - -
Source : KCC survey, Pune.
Note : The KCC has 2 supervisors. So 2 refers to response of both supervisors.
Table 3.4 : Present Hardware Profile
Type No. Rating
PC's HP 28
5
Headphones JABRA
28
3.5
Printers and
scanners
HP Lezor jet M12, 16
1
4.5
Source : KCC survey, Pune.
Table 3.5: Present Software Profile
Call Handling Softwares
Available Rating
Agent Openscape Contact
Centre Yes 5
Openscape Desktop Yes 5
Real Time Viewer Yes 5
Source : KCC survey, Pune.

26
Table 3.6: Hardware Overall Ratings by Supervisors (Number)
Strongly
Agree
Agree Partially
Agree/Disagree
Disagree Strongly
Disagree
The Hardware is latest / up
–to-date
2 0 0 0 0
It is fast 1 1 0 0 0
It is relaiable 0 2 0 0 0
It is convenient to use for
responding to farmer calls
1 1 0 0 0
It is well maintained 0 2 0 0 0
It can handle the call load 1 1 0 0 0
It does not breakdown
frequently
0 1 1 0 0
It works even in power
outage
1 1 0 0 0
The computer disply is
good
1 1 0 0 0
The interface of keyboard
& mouse is good
0 2 0 0 0
Mouse work well 0 1 1 0 0
Headset are comfortable
and work well
1 1 0 0 0
The peripheral such as
printer and scanner are
good
0 2 0 0 0
The hardware is good for
the work requirements
1 0 0 0 0
Source : KCC survey, Pune. Note : 1 refers to response of 1 supervisor (out of 2) and
2 refers to response of both the supervisors.

27
Table 3.7: Software Overall Ratings(Number)
Strongly
Agree
Agree Partially
Agree/Disagree
Disagree Strongly
Disagree
The software is up-to-date 2 0 0 0 0
It is fast 0 2 0 0 0
It is user friendly 1 1 0 0 0
The screen interface it shows is
good & useful
1 1 0 0 0
Calls can be handled easily 1 1 0 0 0
The voice quality is good &
clear
1 1 0 0 0
Calls do not get dropped, lost or
mishandled by the software
1 0 1 0 0
The software can handle heavy
call traffic
0 2 0 0 0
Caller details can be easily
recorded and registered
0 2 0 0 0
Question details can be easily &
quickly recorded
1 1 0 0 0
Answers can be easily found in
the database
0 2 0 0 0
The database is adequate for
answering questions
0 1 1 0 0
Answer details can be easily
recorded & saved
1 0 1 0 0
All the call & answer details
can be easily reviewed later
1 1 0 0 0
Call data can be easily analyzed
daily/weekly/monthly/yearly
1 1 0 0 0
Software does not frequently
crash
0 2 0 0 0
The system is not affected by
viruses & is well protected
1 1 0 0 0
It is easy to transfer calls to
other FTAs or supervisor
1 1 0 0 0
It is easy to escalate calls to
higher levels
1 1 0 0 0
It is easy to monitor &
supervise the call & FTA
activity
1 1 0 0 0
The software meets the
requirements
1 1 0 0 0
Source : KCC survey, Pune. Note : 1 refers to response of supervisor 1 (out of 2) and 2 refers
to response of both the supervisors.
28
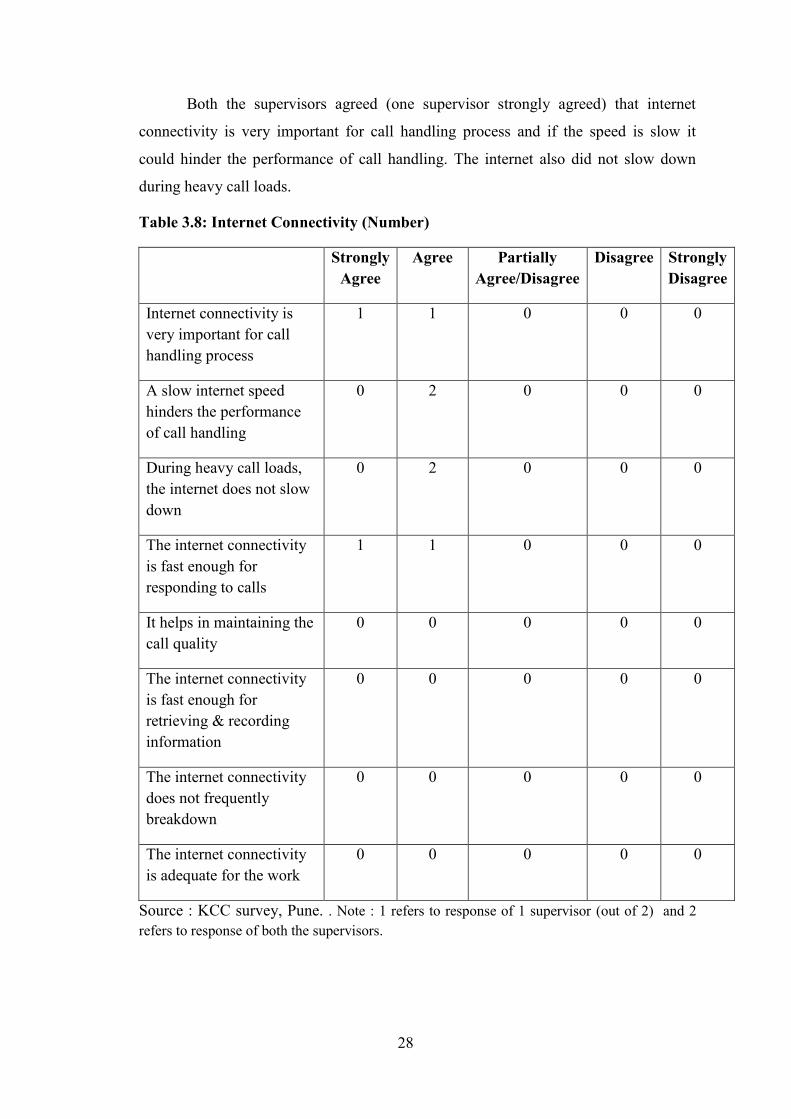
Both the supervisors agreed (one supervisor strongly agreed) that internet
connectivity is very important for call handling process and if the speed is slow it
could hinder the performance of call handling. The internet also did not slow down
during heavy call loads.
Table 3.8: Internet Connectivity (Number)
Strongly
Agree
Agree Partially
Agree/Disagree
Disagree Strongly
Disagree
Internet connectivity is
very important for call
handling process
1 1 0 0 0
A slow internet speed
hinders the performance
of call handling
0 2 0 0 0
During heavy call loads,
the internet does not slow
down
0 2 0 0 0
The internet connectivity
is fast enough for
responding to calls
1 1 0 0 0
It helps in maintaining the
call quality
0 0 0 0 0
The internet connectivity
is fast enough for
retrieving & recording
information
0 0 0 0 0
The internet connectivity
does not frequently
breakdown
0 0 0 0 0
The internet connectivity
is adequate for the work
0 0 0 0 0
Source : KCC survey, Pune. . Note : 1 refers to response of 1 supervisor (out of 2) and 2
refers to response of both the supervisors.

29
3.4 Infrastructure of KCC:
The infrastructure at the KCC can be observed from Table 3.9 to Table3.10.
The KCC (Table 3.9) has 5 ACs installed and other facilities such as CCTVs, drinking
water facilities, washroom and dining facilities. However, personal visit to KCC centre
revealed that considering that washroom is utilized by 60 FTAs in a day (30 in each
shift), the washroom facility is not enough and needs more maintenance.
From Table3.10, it can be observed that both supervisors only partially agreed
that the office space was adequate. One supervisor disagreed on the activity area of
each FTA being sufficient and felt co workers can get disturbed while calls are being
answered. There was also other noise from department and perhaps video surveillance
was not sufficient for monitoring.
Table 3.9: Infrastructure/ Office Equipment’s
Facilities No.
No. of AC's Installed 5
No. of CCTV Cameras 1
Drinking Water Facility 1
Washroom Facility 1
Lunch/Dinner Facility 1
Source : KCC survey, Pune.

30
Table 3.10: Infrastructure Rating (Number)
Strongly
Agree Agree
Partially
Agree/Disagree Disagree
Strongly
Disagree
The office space
is adequate 0 0 2 0 0
The activity area
of each FTA is
sufficient
1 0 0 1 0
The activity area
of each FTA is
well separated
0 2 0 0 0
Co-workers
working does not
get disturbed
while answering
of calls
0 1 0 1 0
Lighting is
sufficient 0 2 0 0 0
There is adequate
ventilation 0 1 0 1 0
Video
surveillance is
sufficient for
monitoring
0 0 1 1 0
Power cuts are
not frequent 0 2 0 0 0
Other
departments
noise does not
hinders your
answering
efficiency
0 1 0 1 0
Supporting
facilities &
utilities are
adequate
0 2 0 0 0
Overall there is
good working
environment
0 2 0 0 0
Source : KCC survey, Pune. . Note : 1 refers to response of 1 supervisor (out of 2) and 2
refers to response of both the supervisors.

31
3.5 Efficiency of FTAs :
Since FTAs are the main source of extension service to farmers, it is useful to
judge their efficiency and also the sources of knowledge, the training programmes, etc.
The same is indicated from Table 3.11onwards. One supervisor strongly agreed and
the other one only agreed that FTAs are efficient in responding to calls, answer the
queries and also access the database/information to answer the questions. Both
supervisors partially agreed that FTAs are motivated and one supervisor only partially
agreed that FTAs take good initiative to improve, innovate and perform better. One
supervisor felt that FTAs need supervision while performing work.
Table 3.11: Assessment of FTA Efficiency (Number)
Strongly
Agree Agree
Partially
Agree/Disagree Disagree
Strongly
Disagree
FTAs are quick in
responding to calls 1 1 0 0 0
FTAs are able to handle the
hardware and software 1 1 0 0 0
FTA’s are able to manage
the calls efficiently. 1 1 0 0 0
The FTAs have sufficient
knowledge & capability to
answer questions
1 1 0 0 0
FTAs are generally able to
answer the questions by
themselves
1 1 0 0 0
FTAs are able to quickly
access the
database/information to
answer questions
1 1 0 0 0
FTAs often take the help of
colleagues to answer
questions
0 2 0 0 0
FTAs often escalate to
higher levels to answer
questions
0 0 0 2 0

32
Strongly
Agree Agree
Partially
Agree/Disagree Disagree
Strongly
Disagree
FTAs are able to
satisfactorily find answer
the farmers questions
0 2 0 0 0
FTAs properly record the
questions and answers 1 1 0 0 0
FTAs do not need much
supervision 0 1 0 1 0
FTAs show good
discipline, attendance &
punctuality
0 1 1 0 0
FTAs are well motivated 0 0 2 0 0
FTAs take good initiative
to improve, innovate and
perform better
0 1 1 0 0
FTAs are well trained 1 1 0 0 0
FTA’s activities are well
monitored/ supervised 1 1 0 0 0
Overall the performance of
the FTAs is good 0 2 0 0 0
Source : KCC survey, Pune. . Note : 1 refers to response of 1 supervisor ( out of 2) and 2
refers to response of both the supervisors.
3.6 Assessment of Knowledge sources :
An FTA can answer queries of farmers and impart perfect information only if
he has the appropriate knowledge and access to information. Hence in Table 3.12 an
assessment on information and knowledge sources as well as data base is indicated.
Both supervisors indicated that the FTAs had good self knowledge. One
supervisor felt that FTAs did not prepare excel sheets and data on material available.
However, there appeared to be a major problem on knowledge sources with respect to
material from government sources, University experts and even field sources. This
appears to be a major problem as it is likely to hamper the efficiency of the FTAs and
they will not be in a position to respond to certain queries of farmers.

33
Table 3.12: Assessment of information & knowledge sources and databases uses
(Number)
Excellent Good Satisfactory Somewhat poor Very poor
Self-Knowledge 0 2 0 0 0
Colleagues &
Supervisor 0 2 0 0 0
Prepared Excel
sheets & material 0 0 1 0 1
Internet search 0 2 0 0 0
Extension Booklets,
books, papers 0 0 1 0 1
Government
department
sources/material
0 0 0 0 2
Knowledge
acquired in Training 1 0 1 0 0
University
experts/Nodal
officer knowledge
0 0 0 0 2
Information from
other farmers 0 1 1 0 0
Field Inquiry 0 0 0 0 2
Other sources
(Please Specify) 0 0 0 0 0
Source : KCC survey, Pune. . Note : 1 refers to response of 1 supervisor (out of 2) and 2
refers to response of both the supervisors.

34
From Table 3.13, it can be observed that both supervisors felt that for
information and knowledge sources, the FTAs depended on self knowledge and
internet search very frequently. The colleagues and supervisors were frequently
referred to for obtaining information. However, on certain aspects such as knowledge
from Nodal officer or field inquiry, both the supervisors responded that such sources
were never resorted to. Also extension booklets and papers were rarely used. Hence
the overall conclusion appears that for information and knowledge by FTAs was most
often obtained from their own knowledge as well as from internet search.
The overall assessment on information provided (Table3.14) reveals that the
supervisors were not confident on whether up-to date answers on technical questions,
questions related to government schemes, market related questions or those related to
weather were given. It was also not clear whether farmers were satisfied with the
information that they were provided.
As observed earlier, FTAs very frequently used internet for knowledge and in
Table 3.15 the various websites used is indicated. KKMS, AgMarket, Agricultural
University Portal etc were used constantly and consistently. The assessment of KKMS
portal was very frequently used, easy to use and organization of information on the
system screen was clear. Both supervisors strongly agreed to these aspects of the
website. However, with respect to information on the website being regularly updated,
one response indicated strong disagreement. The overall picture that emerges is that
although the KKMS portal is user friendly, there is scope to improve the website by
getting it regularly updated.

35
Table 3.13: Assessment of information & knowledge sources and databases uses
(Number)
Very
frequently
Frequently Occasionally Rarely Never
Self-Knowledge 2 0 0 0 0
Colleagues &
Supervisor 1 1 0 0 0
Prepared Excel
sheets & material 0 0 1 0 1
Internet search 2 0 0 0 0
Extension
Booklets, books,
papers
0 0 1 0 1
Government
department
sources/material
1 0 0 0 1
Knowledge
acquired in
Training
0 0 1 1 0
University
experts/Nodal
officer
knowledge
0 0 1 0 1
Information from
other farmers 0 0 1 0 1
Field Inquiry 0 0 0 0 2
Other sources
(Please Specify) 0 0 0 0 0
Source : KCC survey, Pune. . Note : 1 refers to response of 1 supervisor (out of 2) and 2
refers to response of both the supervisors.

36
Table 3.14 : Websites used for information source (%) usage in percentage of time
Websites
Farmer's Portal 85
Kisan Knowledge Management System 100
AgMarket 100
Agricultural University Portal 100
I-Kedut Portal 100
State Seeds Corporation Ltd 85
Accuweather 100
Source : KCC survey, Pune.
Table 3.15 : Assessment of KKMS Portal (Frequency)
Strongly
Agree
Agree Partially
Agree/disagre
e
Disagre
e
Strongly
Disagree
KKMS website is frequently
used
2 0 0 0 0
KKMS website is easy to
use
2 0 0 0 0
The organization of
information on the system
screens is clear
2 0 0 0 0
KKMS website response is
fast enough
0 2 0 0 0
Work can get quickly done
on the website
1 1 0 0 0
KKMS website is very
useful
1 1 0 0 0
Information on the website
is regularly updated
0 0 1 0 1
KKMS website does not fail
to respond or crash during
use
0 1 1 0 0
Overall the KKMS website
works well
0 2 0 0 0
Source : KCC survey, Pune. . Note : 1 refers to response of 1 supervisor (out of 2) and 2
refers to response of both the supervisors.

37
Table 3.16: Assessment of Farmer Portal Website (Frequency)
Strongly
Agree
Agree Partially
Agree/disagre
e
Disagre
e
Strongly
Disagree
The website is frequently
used
1 1 0 0 0
The website is easy to use 1 1 0 0 0
The organization of
information on the system
screens is clear
1 1 0 0 0
The website response is fast
enough
1 1 0 0 0
Work can get quickly done
on the website
0 2 0 0 0
The website is very useful 1 1 0 0 0
Information on the website
is regularly updated
1 0 1 0 0
The website does not fail to
respond or crash during use
1 1 0 0 0
Overall the website works
well
1 1 0 0 0
Source : KCC survey, Pune. . Note : 1 refers to response of 1 supervisor (out of 2) and 2
refers to response of both the supervisors.
An important feature of the KCC is that there is call escalation which means
that if the FTA is unable to answer the query of the farmer, it is escalated to higher
levels. However, it was revealed from Table 3.17 that only one supervisor agreed that
queries which could not be solved by FTAs are answered by colleagues while the other
supervisor disagreed that queries are answered by colleagues. Again, only one
supervisor agreed that calls not answered by colleagues are answered by supervisors
while the other supervisor disagreed on this point. Both supervisors strongly disagreed
that calls are escalated to level 2 or 3.

38
Table 3.17: Call Escalation System Frequency
1. Frequency of Level 1 calls Strongly
Agree
Agree Partially
Agree/disagr
ee
Disagree Strongly
Disagree
No. of
Call per
Day
1 Queries not solved by FTA’s are
answered by colleagues 0 1 1 0 0 20
2 Queries not solved by colleagues
are answered by Supervisors 0 1 0 1 0 35
3 Queries not solved by supervisors
are escalated to level 2 0 0 0 0 2 0
2. Frequency of Level 2 calls
1 Frequency of calls escalated to
level 2 0 0 0 0 2 0
2 Queries not solved in level 2 are
escalated to level 3 0 0 0 0 2 0
3. Frequency of Level 3 calls
1 Frequency of calls escalated to
Level 3 0 0 0 0 2 0
2 Queries are solved at level 3 0 0 0 0 2 0
Source : KCC survey, Pune. . Note : 1 refers to response of 1(out of 2) supervisor (out of 2)
and 2 refers to response of both the supervisors

39
Table 3.18 : Assessing the call answering system efficiency & effectiveness
(Frequency)
Strongly
Agree
Agree Partially
Agree/disagree
Disagree Strongly
Disagree
Generally, the FTAs are
able to answer and handle
the questions
1 1 0 0 0
Queries not solved by
FTA’s are well answered by
colleagues
1 1 0 0 0
Queries not solved by
colleagues are well
answered by Supervisors
0 1 0 1 0
Queries not solved by
supervisors are easily
escalated to level 2
0 1 0 0 1
Queries escalated to level 2
are well attended by State
Agriculture Experts
0 1 0 0 1
Level 2 experts speedily
attend to the queries 0 0 0 1 1
Level 2 experts
satisfactorily attend to the
queries
0 0 0 1 1
Queries not solved in level
2 are escalated to level 3 0 0 0 0 2
Queries escalated to level 3
are well attended by Nodal
officer
0 0 0 0 2
Nodal officers respond to
farmers by
call/SMS/post/email
0 0 0 0 2
Overall the call answering
system is adequate 0 2 0 0 0
Source : KCC survey, Pune. . Note : 1 refers to response of 1 supervisor (out of 2) and 2 refers
to response of both the supervisors.

40
FTAs attended training programmes, in order to update their knowledge and
therefore be in a better position to answer the queries of farmers. However, one
supervisor disagreed that the training programme helps in understanding call handling
procedure of the KCC and also in operating the hardware as well as software. Also,
both supervisors strongly agreed that more and better training is required and also the
training should be regular and not occasional.
The overall assessment of call handling indicated that one supervisor strongly
disagreed that large number of calls are received every day and one supervisor
disagreed that all calls are handled efficiently. Supervisors did not give any response
with respect to the overall functioning of the hardware or software.
The overall assessment of the information and knowledge available
revealed that information is easily available; it is up to date and available on time. The
FTAs also have sufficient knowledge and farmers are satisfied with the information
given to them.
Table 3.19 : Overall assessment of usefulness of training programmes (Frequency)
strongly
Agree
Agree, Partially
Agree/Disagree,
Disagree strongly
Disagree
It helps in
understanding call
handling procedure of
the KCC
0 1 0 1 0
It helps in operating of
the hardware 0 1 0 1 0
It helps in operating of
the software 0 1 0 1 0
It helps in
understanding
questions of farmer
1 1 0 0 0
It helps in how to
handle the questions of
farmer
0 2 0 0 0
It helps in getting the
necessary knowledge 1 1 0 0 0

41
strongly
Agree
Agree, Partially
Agree/Disagree,
Disagree strongly
Disagree
It helps in updating
knowledge 1 1 0 0 0
It helps in getting
knowledge of
government schemes
0 0 1 0 1
More & better training
is required 2 0 0 0 0
It should be regularly
given to all FTA’s 2 0 0 0 0
Overall the available
training is useful &
sufficient
0 0 1 1 0
Source : KCC survey, Pune. . Note : 1 refers to response of 1 supervisor (out of 2) and 2
refers to response of both the supervisors.
Table 3.20: Overall Assessment of call handling
Strongly
Agree Agree
Partially
Agree/Disagree Disagree
Strongly
Disagree
Average
Large number
of calls are
received
everyday
0 0 0 0 1 0.5
All calls are
handled
efficiently
0 0 0 1 0 0.5
Call handling
system are
good
- - - - -
-
Farmer & FTA
have good
communication
- - - - - -
Overall the
farmers are
satisfied with
call handling
- - - - - -
Source : KCC survey, Pune. . Note : 1 refers to response of 1 supervisor (out of 2) and 2
refers to response of both the supervisors.

42
Table 3.21: Overall Assessment of the information & knowledge available (Frequency)
Strongly
Agree
Agree Partially
Agree/
Disagree
Disagree Strongly
Disagree
Information is easily available 0 2 0 0 0
Important and critical information
required is easily available 0 1 1 0 0
There is sufficient information &
knowledge with the FTA’s 0 2 0 0 0
The information is reliable 1 1 0 0 0
The information is up-to-date 0 2 0 0 0
The information is available on
time 0 2 0 0 0
Information available is easy to
understand 1 1 0 0 0
Farmers can understand the
information and process it easily 1 1 0 0 0
Farmers seem to be satisfied with
the information provided 1 1 0 0 0
Overall there is sufficient & quality
information available to answer
farmers questions
0 1 1 0 0
Source : KCC survey, Pune. . Note : 1 refers to response of 1 supervisor (out of 2) and 2
refers to response of both the supervisors.

43
Chapter 4
Results : Farmer Tele Adviser (FTA) Survey
4.1 Backdrop :
The role of FTA in Kisan Call Centre is of utmost importance because he/she is
the first level where the call is handled. The FTA is required to refer to Farmers Portal
and all other relevant websites to answer the queries of the farmers. He must therefore
have easy online access to the various websites as they are expected to use the data
base extensively. This will enable farmers to get timely, correct and useful information
which they can use for their agricultural practices and thus increase farm productivity.
4.2 Status of Hardware, Software and Internet Connectivity:
The status of hardware, software and internet connectivity can be observed
from Table 4.1 to 4.3. With respect to hardware more than half the FTAs responded
that the hardware is latest and up to date, it is fast, reliable, well maintained and
interface of keyboard & mouse is good. However 50 percent FTAs partially
agreed/disagreed that the hardware breaks down frequently, 36.67 percent disagreed
that headsets are comfortable and work well and 46.67 percent strongly disagreed that
peripherals such as printer and scanner work well. This indicates the need to improve
accessories such as headsets, printer, scanner, etc.
With respect to software, more than 50 percent FTAs agreed that it was user
friendly in most aspects but 33.3 percent partially agreed/disagreed that the software
could handle heavy traffic and does not crash frequently. Also more than half the
FTAs agreed the importance of good internet connectivity. However 40 percent
agreed/disagreed that during heavy call loads, the internet does not slow down.

44
Table 4.1: Rating of Hardware - Percent
Strongly
Agree Agree
Partially
Agree/Disagre
e
Disagre
e
Strongly
Disagree
Average
Rating
The hardware is latest/up-to-
date 13.33 50.00 30.00 6.67 0.00 3.70
It is Fast 23.33 53.33 13.33 10.00 0.00 3.90
It is reliable 33.33 53.33 10.00 3.33 0.00 4.17
It is convenient to use for
responding to farmer calls 23.33 56.67 16.67 3.33 0.00 4.00
It is well maintained 10.00 46.67 26.67 16.67 0.00 3.50
It can handle the call load 20.00 43.33 26.67 10.00 0.00 3.73
It does not breakdown
frequently 0.00 26.67 50.00 20.00 3.33 3.00
It works even in power outage 26.67 46.67 13.33 13.33 0.00 3.87
The computer display is good 50.00 36.67 6.67 6.67 0.00 4.30
The interface of keyboard &
mouse is good 10.00 50.00 13.33 23.33 3.33 3.40
Headsets are comfortable and
work well 3.33 20.00 23.33 36.67 16.67 2.57
The peripherals such as printer
and scanner are good 3.33 13.33 26.67 10.00 46.67 2.17
The hardware is good for the
work requirements 13.33 33.33 40.00 3.33 10.00 3.37
Mouse quality is good 13.33 33.33 30.00 10.00 13.33 3.23
Source : Field Survey
Strongly Agree -5; Agree -4; Partially Agree/Disagree – 3; Disagree – 2;
Strongly Disagree - 1

45
Table 4.2: Rating of Software - Percent
Strongly
Agree Agree
Partially
Agree/Disa
gree
Disagre
e
Strongl
y
Disagre
e
Average
Rating
The software is up-to-date 30.00 50.00 13.33 6.67 0.00 4.03
It is fast 26.67 56.67 10.00 6.67 0.00 4.03
It is user friendly 23.33 63.33 6.67 6.67 0.00 4.03
The screen interface it shows is
good & useful 33.33 46.67 20.00 0.00 0.00 4.13
Calls can be handled easily 23.33 60.00 10.00 6.67 0.00 4.00
The voice quality is good &
clear 6.67 50.00 30.00 13.33 0.00 3.50
Calls do not get dropped, lost or
mishandled by the software 10.00 60.00 10.00 20.00 0.00 3.60
The software can handle heavy
call traffic 16.67 43.33 33.33 6.67 0.00 3.70
Software does not frequently
crash 33.33 56.67 10.00 0.00 0.00 4.23
Caller details can be easily
recorded and registered 26.67 56.67 13.33 3.33 0.00 4.07
Question details can be easily &
quickly recorded 23.33 56.67 13.33 3.33 3.33 3.93
Answers can be easily found in
the available database 20.00 40.00 23.33 16.67 0.00 3.63
The database is adequate for
answering questions 30.00 53.33 16.67 0.00 0.00 4.13
Answer details can be easily
recorded and saved 23.33 26.67 30.00 16.67 3.33 3.50
All the calls and answers details
can be easily reviews later 26.67 46.67 13.33 10.00 3.33 3.83
Call data can be easily analyzed
daily/week/monthly/yearly 6.67 56.67 23.33 13.33 0.00 3.57

46
Strongly
Agree Agree
Partially
Agree/Disa
gree
Disagre
e
Strongl
y
Disagre
e
Average
Rating
Software dose not frequently
crash 6.67 20.00 33.33 30.00 10.00 2.83
Repeated Irrelevant calls can be
blocked by the software 20.00 53.33 16.67 10.00 0.00 3.83
The system is not affected by
viruses and is well protected 20.00 50.00 16.67 10.00 3.33 3.73
It is easy to escalate calls to
higher levels 23.33 56.67 10.00 10.00 0.00 3.93
Source : Field Survey, Strongly Agree -5; Agree -4; Partially Agree/Disagree – 3;
Disagree – 2; Strongly Disagree - 1
Table 4.3: Internet Connectivity - Percent
Strongly
Agree Agree
Partially
Agree/
Disagree
Disagree Strongly
Disagree
Average
Rating
Internet connectivity is very important
for call handling process 43.33 50.00 6.67 0.00 0.00 4.37
A slow internet speed hinders the
performance of call handling 13.33 53.33 20.00 6.67 6.67 3.60
During heavy call loads, the internet
does not slow down 0.00 30.00 40.00 30.00 0.00 3.00
Internet connectivity is fast enough for
responding to calls 13.33 46.67 33.33 3.33 3.33 3.63
It helps in maintaining the call quality 20.00 60.00 10.00 6.67 3.33 3.87
Internet connectivity is fast enough for
retrieving & recording information 13.33 60.00 13.33 13.33 0.00 3.73
Internet connectivity does not
frequently breakdown 10.00 36.67 33.33 16.67 3.33 3.33
Internet connectivity is adequate for
the work 26.67 50.00 10.00 10.00 3.33 3.87
Source : Field Survey

47
4.3 Information and Knowledge sources used by FTAs:
The information and knowledge sources used by FTAs are indicated from
Table 4.4 to 4.7. It can be observed that the most frequent source of knowledge was
self knowledge. With respect to material from Government department, 40 percent
indicated that they rarely resorted to this source and 50 percent never used field
inquiry as a source of knowledge. About 26.67 percent indicated that extension
booklets, books and papers were never used for updating their knowledge. Little more
than 30 percent rarely or never used University experts or Nodal officers or even
obtained information from other farmers to update their knowledge.
Table 4.4: Frequency of Knowledge Sources used for Answering - Percent
Very
Frequently
Frequently Occasionally Rarely Never Average
Rating
Self-Knowledge 33.33 66.67 0.00 0.00 0.00 4.33
Colleagues &
Supervisor 33.33 40.00 26.67 0.00 0.00 4.07
Prepared Excel
sheets & material 43.33 43.33 10.00 3.33 0.00 4.27
Internet search 50.00 46.67 3.33 0.00 0.00 4.47
Extension Booklets,
books, papers 10.00 30.00 16.67 16.67 26.67 2.80
Government
department
sources/material 0.00 23.33 33.33 40.00 3.33 2.77
Knowledge
acquired in
Training 10.00 50.00 20.00 20.00 0.00 3.50
University
experts/Nodal
officer knowledge 16.67 23.33 33.33 6.67 20.00 3.10
Information from
other farmers 10.00 20.00 40.00 23.33 6.67 3.03
Field Inquiry 0.00 6.67 10.00 33.33 50.00 1.73
Source : Field Survey ; 5-Very Frequently; 4-Frequently; 3-Ocassionally;2-Rarely; 1-
Never

48
Table 4.5: Rating information & knowledge sources used - Percent
Excellent Good Satisfactory
Somewhat
Poor Very Poor
Average
Rating
Self-Knowledge 56.67 43.33 0.00 0.00 0.00 4.57
Colleagues & Supervisor 3.33 50.00 43.33 3.33 0.00 3.53
Prepared Excel sheets
& material 23.33 56.67 20.00 0.00 0.00 4.03
Internet search 43.33 30.00 16.67 3.33 6.67 4.00
Extension Booklets,
books, papers 10.00 16.67 20.00 26.67 26.67 2.57
Government department
sources/material 13.33 16.67 30.00 36.67 3.33 3.00
Knowledge acquired
in Training 10.00 46.67 26.67 13.33 3.33 3.47
University experts/
Nodal officer knowledge 10.00 10.00 43.33 20.00 16.67 2.77
Information from
other farmers 3.33 13.33 43.33 30.00 10.00 2.70
Field Inquiry 6.67 10.00 16.67 20.00 46.67 2.10
Source : Field Survey, Excellent-5; Good-4;Satisfactory – 3;Somewhat Poor – 2; Very
Poor- 1

49
Table 4.6: Frequency of updating the information in the sources - Percent
Very
Frequently Frequently Occasionally Rarely Never
Average
Rating
Self-Knowledge 36.67 60.00 3.33 0.00 0.00 4.33
Colleagues &
Supervisor 20.00 50.00 23.33 6.67 0.00 3.83
Prepared Excel
sheets &
material 23.33 46.67 23.33 3.33 3.33 3.83
Internet search 53.33 36.67 10.00 0.00 0.00 4.43
Extension
Booklets,
books, papers 10.00 20.00 16.67 26.67 26.67 2.60
Government
department
sources/material 3.33 40.00 23.33 30.00 3.33 3.10
Knowledge
acquired in
Training 6.67 43.33 33.33 13.33 3.33 3.37
University
experts/Nodal
officer
knowledge 6.67 36.67 20.00 20.00 16.67 2.97
Information
from other
farmers 13.33 30.00 23.33 20.00 13.33 3.10
Field Inquiry 0.00 10.00 13.33 30.00 46.67 1.87
Source : Field Survey, 5-Very Frequently; 4-Frequently; 3-Ocassionally;2-Rarely; 1-Never

50
Table 4.7: Overall Assessment of the Information Sources used for providing technical
information - Percent
Strongly
Agree
Agree Partially
Agree/
Disagree
Disagree Strongly
Disagree
Average
Rating
Information is easily
available 36.67 56.67 6.67 0.00 0.00 4.30
Important and critical
information required is
easily available
10.00 63.33 26.67 0.00 0.00 3.83
The information is
reliable 26.67 53.33 16.67 3.33 0.00 4.03
The information is up-
to-date 10.00 53.33 20.00 13.33 3.33 3.53
the information is
availible on time 16.67 60.00 16.67 3.33 3.33 3.83
information availible is
easy to understand 30.00 60.00 10.00 0.00 0.00 4.20
Farmers can
understand the
information and
process it easily
23.33 60.00 16.67 0.00 0.00 4.07
Farmers seem to be
satisfied with the
information provided
16.67 76.67 3.33 0.00 3.33 4.03
Overall there is
sufficient & quality
information available
to answer farmer’s
questions
6.67 70.00 16.67 3.33 3.33 3.73
Source : Field Survey, Strongly Agree -5; Agree -4; Partially Agree/Disagree – 3;
Disagree – 2; Strongly Disagree – 1

51
4.4 Overall assessment of Information from Various Source :
The FTAs obtain information from various sources on government schemes,
market prices, Kisan Knowledge Management System (KKMS), Farmers Portal, m-Kisan
website, and the overall assessment of the information, etc. From Table 4.8 to Table 4.13
the ease with which the information can be accessed is indicated.
With respect to government schemes while by and large a little more or a little less
of 50 percent of FTAs agreed that the information is easily available, reliable, easy to
understand about 30 percent partially agreed/disagreed that information is up-to date or
farmers are satisfied with the information provided. However, this finding does not match
with our general discussion with officials at KCC and IFFCO who indicated that there was
severe lack of information on government schemes and queries related to this aspect could
not be resolved.
About three fourths either strongly agreed or agreed that price and market
information was easily accessible and farmers were satisfied with the answers received
from FTAs. Similarly more than three-fourths of FTAs strongly agreed or agreed that
KKMS website was user friendly, though 23.3 percent disagreed that changes can be made
in the information after it is recorded. With respect to Farmers Portal also the response of
FTAs was encouraging but 36.67 partially agreed/disagreed that the information is
regularly updated. The m-Kisan website response was also on the favorable side and three
fourths of FTAs strongly agreed about smooth working of the website.

52
Table 4.8: Overall Assessment of the Information Sources used for providing
government schemes related information - Percent
Strongly
Agree Agree
Partially
Agree/Disagree Disagree
Strongly
Disagree
Average
Rating
Information is
easily
available 23.33 60.00 13.33 0.00 3.33 4.00
Important and
critical
information
required is
easily
available 10.00 60.00 23.33 3.33 3.33 3.70
The
information is
reliable 13.33 56.67 23.33 6.67 0.00 3.77
The
information is
up-to-date 13.33 46.67 30.00 6.67 3.33 3.60
The
information is
available on
time 20.00 46.67 23.33 6.67 3.33 3.73
Information
available is
easy to
understand 16.67 66.67 13.33 0.00 3.33 3.93
Farmers can
understand
the
information
and process it
easily 10.00 56.67 23.33 6.67 3.33 3.63
Farmers seem
to be satisfied
with the
information
provided 10.00 50.00 30.00 6.67 3.33 3.57
Overall there
is sufficient &
quality
information
available to
answer
farmer’s
questions 16.67 53.33 23.33 3.33 3.33 3.77
Source : Field Survey ; Strongly Agree -5; Agree -4; Partially Agree/Disagree – 3;
Disagree – 2; Strongly Disagree - 1

53
Table 4.9: Overall Assessment of the Information Sources used for providing price
and market related information - Percent
Strongly
Agree Agree
Partially
Agree/Disagree Disagree
Strongly
Disagree Average
Rating
Information is
easily available 36.67 56.67 6.67 0.00 0.00 4.30
Important and
critical
information
required is easily
available 33.33 43.33 20.00 0.00 3.33 4.03
The information
is reliable 20.00 53.33 20.00 3.33 3.33 3.83
The information
is up-to-date 26.67 43.33 20.00 6.67 3.33 3.83
The information
is available on
time 23.33 46.67 23.33 3.33 3.33 3.83
Information
available is easy
to understand 30.00 53.33 10.00 3.33 3.33 4.03
Farmers can
understand the
information and
process it easily 26.67 60.00 10.00 0.00 3.33 4.07
Farmers seem to
be satisfied with
the information
provided 30.00 46.67 13.33 3.33 6.67 3.90
Overall there is
sufficient &
quality
information
available to
answer farmer’s
questions 30.00 50.00 13.33 3.33 3.33 4.00
Source : Field Survey, Strongly Agree -5; Agree -4; Partially Agree/Disagree – 3;
Disagree – 2; Strongly Disag

54
Table 4.10 Overall Assessment of the above Information Sources for Other information
used - percent
Strongly
Agree Agree
Partially
Agree/Disagree Disagree
Strongly
Disagree
Average
Rating
Information is
easily
available
50.00 46.67 3.33 0.00 0.00 4.47
Important and
critical
information
required is
easily
available
26.67 66.67 6.67 0.00 0.00 4.20
The
information is
reliable
23.33 63.33 13.33 0.00 0.00 4.10
The
information is
up-to-date
20.00 60.00 16.67 3.33 0.00 3.97
The
information is
available on
time
36.67 50.00 13.33 0.00 0.00 4.23
Information
available is
easy to
understand
36.67 53.33 10.00 0.00 0.00 4.27
Farmers can
understand
the
information
and process it
easily
16.67 73.33 10.00 0.00 0.00 4.07
Farmers seem
to be satisfied
with the
information
provided
30.00 53.33 16.67 0.00 0.00 4.13
Overall there
is sufficient &
quality
information
available to
answer
farmer’s
questions
20.00 56.67 23.33 0.00 0.00 3.97
Source : Field Survey ; Strongly Agree -5; Agree -4; Partially Agree/Disagree – 3;
Disagree – 2; Strongly Disagree - 1

55
Table 4.11: Assessment of Kisan Knowledge Management System (KKMS) Website -
Percent
Strongly
Agree Agree
Partially
Agree/Disagree Disagree
Strongly
Disagree
Average
Rating
KKMS website is
easy to use 50.00 50.00 0.00 0.00 0.00 4.50
The organization of
information on the
system screens is
clear 53.33 40.00 6.67 0.00 0.00 4.47
KKMS website
response is fast
enough 33.33 60.00 6.67 0.00 0.00 4.27
Work can get quickly
done on the website 36.67 50.00 13.33 0.00 0.00 4.23
Information on the
website is regularly
updated 33.33 53.33 13.33 0.00 0.00 4.20
KKMS website does
not fail to respond or
crash during use 16.67 56.67 20.00 6.67 0.00 3.83
More information can
be added to the
website 30.00 56.67 10.00 3.33 0.00 4.13
Errors made during
recording the details
can be rectified 6.67 46.67 33.33 10.00 3.33 3.43
You can make
changes in the
information after the
information is
recorded 16.67 23.33 30.00 23.33 6.67 3.20
Retrieving
information from
KKMS is easy 16.67 46.67 23.33 13.33 0.00 3.67
Yesterday’s data can
be easily accessed in
KKMS 23.33 30.00 23.33 20.00 3.33 3.50
Overall the KKMS
website works well 23.33 56.67 13.33 6.67 0.00 3.97
Source : Field Survey ; Strongly Agree -5; Agree -4; Partially Agree/Disagree – 3; Disagree – 2; Strongly
Disagree - 1

56
Table 4.12: Assessment of Farmers Portal Website - Percent
Strongly
Agree Agree
Partially
Agree/Disagree Disagree
Strongly
Disagree Average Rating
The website is
frequently used 23.33 66.67 6.67 3.33 0.00 4.10
The website is
easy to use 36.67 50.00 13.33 0.00 0.00 4.23
The
organization of
information on
the system
screens is clear 23.33 66.67 10.00 0.00 0.00 4.13
The website
response is fast
enough 30.00 46.67 20.00 3.33 0.00 4.03
Work can get
quickly done on
the website 16.67 60.00 20.00 3.33 0.00 3.90
The website is
very useful 26.67 50.00 20.00 3.33 0.00 4.00
Information on
the website is
regularly
updated 20.00 40.00 36.67 0.00 3.33 3.73
The website
does not fail to
respond or crash
during use 16.67 53.33 26.67 0.00 3.33 3.80
Overall the
website works
well 13.33 70.00 16.67 0.00 0.00 3.97
Source : Field Survey, Strongly Agree -5; Agree -4; Partially Agree/Disagree – 3;
Disagree – 2; Strongly Disagree - 1

57
Table 4.13: Assessment of m-Kisan Website - Percent
Strongly
Agree Agree
Partially
Agree/Disagree Disagree
Strongly
Disagree Average Rating
The website is
frequently used 10.00 60.00 26.67 3.33 0.00 3.77
The website is
easy to use 23.33 60.00 16.67 0.00 0.00 4.07
The organization
of information on
the system
screens is clear 23.33 60.00 13.33 3.33 0.00 4.03
Registration of
SMS is easy 30.00 46.67 13.33 10.00 0.00 3.97
List of services
available are
useful 3.33 80.00 10.00 3.33 3.33 3.77
The website
response is fast
enough 10.00 66.67 23.33 0.00 0.00 3.87
Work can get
quickly done on
the website 16.67 56.67 20.00 6.67 0.00 3.83
The website is
very useful 10.00 63.33 20.00 6.67 0.00 3.77
Information on
the website is
regularly updated 13.33 60.00 23.33 3.33 0.00 3.83
The website does
not fail to respond
or crash during
use 3.33 60.00 33.33 0.00 3.33 3.60
Overall the
website works
well 13.33 73.33 10.00 3.33 0.00 3.97
Source : Field Survey, Strongly Agree -5; Agree -4; Partially Agree/Disagree – 3;
Disagree – 2; Strongly Disagree - 1

58
4. 5 Assessing Call Efficiency :
It is important to assess the efficiency with which the FTAs can handle calls
and hence the same is observed in Table 4.14 and Table 4.15. While 66.67 percent of
FTAs indicated that call clarity is good and farmers do not face any difficulty in
understanding the dialect and overall call efficiency is good, about 30 percent partially
agreed/disagreed that call drops are less. Also a little more than 40 percent of FTAs
partially agreed/ disagreed about getting irrelevant calls and facing abusive language.
This issue is unfortunate and farmers must be discouraged from doing so.
About three fourths of the FTAs together either strongly agreed or only agreed
that they were in a position to handle the questions, queries not solved by them were
well handled by their colleagues or supervisors. However about 50 percent FTAs
disagreed or strongly disagreed that queries not solved in level 2 are escalated to level
3, or are well attended by Nodal officers or even responded to farmers by e mail,
SMS/post. Hence it appears that FTAs did not have enough faith in level 2 or level 3.
Table 4.14: Assessing Call Efficiency - Percent
Strongly
Agree Agree
Partially
Agree/Disagree Disagree
Strongly
Disagree
Average
Rating
Voice reception
over the phone is
clear 10.00 46.67 33.33 10.00 0.00 3.57
During slow
internet, voice
reception is clear 13.33 43.33 26.67 13.33 3.33 3.50
Call drops are
very less 16.67 46.67 30.00 6.67 0.00 3.73
Call clarity is
good 10.00 66.67 16.67 6.67 0.00 3.80
It is easy to
understand the
queries from
farmers 20.00 70.00 10.00 0.00 0.00 4.10
You are able to
easily understand
various dialects 16.67 73.33 10.00 0.00 0.00 4.07
Farmers does not
face difficulty in
understanding
your dialect 16.67 66.67 16.67 0.00 0.00 4.00

59
Strongly
Agree Agree
Partially
Agree/Disagree Disagree
Strongly
Disagree
Average
Rating
Farmers does not
face difficulty in
understanding
scientific/technical
words 10.00 60.00 30.00 0.00 0.00 3.80
You generally do
not get irrelevant
calls 10.00 33.33 43.33 13.33 0.00 3.40
You generally do
not face abusive
language 10.00 43.33 40.00 6.67 0.00 3.57
Overall, call
efficiency is good 10.00 66.67 20.00 3.33 0.00 3.83
Source : Field Survey ; Strongly Agree -5; Agree -4; Partially Agree/Disagree – 3;
Disagree – 2; Strongly Disagree - 1
Table 4.15: Assessing the call answering efficiency & effectiveness - Percent
Strongly
Agree
Agree Partially
Agree/Di
sagree
Disagr
ee
Strongl
y
Disagre
e
Average
Rating
Generally, you are able
to answer and handle
the questions 43.33 56.67 0.00 0.00 0.00 4.43
Queries not solved by
you are well answered
by colleagues 20.00 60.00 20.00 0.00 0.00 4.00
Queries not solved by
colleagues are well
answered by
Supervisors 20.00 56.67 16.67 6.67 0.00 3.90
Queries not solved by
supervisors are easily
escalated to level 2 6.67 46.67 16.67 20.00 10.00 3.20
Queries escalated to
level 2 are well
attended by State
Agriculture Experts 3.33 20.00 40.00 20.00 16.67 2.73

60
Strongly
Agree
Agree Partially
Agree/Di
sagree
Disagr
ee
Strongl
y
Disagre
e
Average
Rating
Level 2 experts
speedily attend to the
queries 3.33 20.00 40.00 33.33 3.33 2.87
Level 2 experts
satisfactorily attend to the
queries 3.33 30.00 30.00 23.33 13.33 2.87
Queries not solved in
level 2 are escalated to
level 3 0.00 26.67 23.33 23.33 26.67 2.50
Queries escalated to
level 3 are well
attended by Nodal
officer 3.33 16.67 23.33 26.67 30.00 2.37
Nodal officers respond
to farmers by
call/SMS/post/email 0.00 20.00 33.33 16.67 30.00 2.43
Overall the call
answering system is
adequate 6.67 43.33 33.33 3.33 13.33 3.27
Source : Field Survey ; Strongly Agree -5; Agree -4; Partially Agree/Disagree – 3;
Disagree – 2; Strongly Disagree - 1
4.6 Infrastructure Rating :
Conducive environment and suitable infrastructure will go a long way in
boosting the morale of FTAs and also in improving their efficiency. Hence in Table
4.16, the infrastructure in the KCC where the FTAs handle the calls is assessed. While
50 percent agreed that power cuts are not frequent, the overall picture with respect to
infrastructure is not encouraging. There was partial agreement/disagreement or strong
disagreement over issues such as sufficiency in lighting, adequate ventilation, noise in
other departments which hinders the answering efficiency and overall good working
environment. In a personal visit to the KCC centre at Pune also it was observed that
there is scope to improve the overall environment of the KCC in terms of toilet
facilities, ventilation, noise, etc.

61
Table 4.16 Infrastructure rating - Percent
Strongly
Agree Agree
Partially
Agree/Disagree Disagree
Strongly
Disagree
Average
Rating
The office space is
adequate 10.00 13.33 26.67 33.33 16.67 2.67
The activity area for
calling is sufficient 10.00 16.67 30.00 33.33 10.00 2.83
The activity area is
well separated 6.67 13.33 36.67 33.33 10.00 2.73
You do not get
disturbed while
answering of calls 6.67 16.67 33.33 30.00 13.33 2.73
Lighting is sufficient 20.00 20.00 20.00 26.67 13.33 3.07
There is adequate
ventilation 10.00 16.67 30.00 26.67 16.67 2.77
Video surveillance is
sufficient for
monitoring 0.00 40.00 20.00 26.67 13.33 2.87
Power cuts are not
frequent 6.67 50.00 20.00 16.67 6.67 3.33
Other departments
noise does not hinder
your answering
efficiency 10.00 36.67 16.67 26.67 10.00 3.10
Supporting facilities
& utilities are
adequate 0.00 16.67 43.33 30.00 10.00 2.67
Overall there is good
working environment 10.00 26.67 43.33 16.67 3.33 3.23
Source : Field Survey ; Strongly Agree -5; Agree -4; Partially Agree/Disagree – 3;
Disagree – 2; Strongly Disagree - 1
4.7 Usefulness of training programmes :
Training programmes should be conducted regularly so that FTAs are able to
update their knowledge. However, more than half the FTAs in the sample partially
agreed/disagreed or entirely disagreed that the training programmes help in operating
hardware and software. Also about 43 percent of FTAs partially agreed/disagreed that
the training programmes help in getting knowledge about government schemes. Even
during the personal visit, there was complaint from supervisors and FTAs that they are
not well informed about government schemes. This poses a serious problem to them
while answering questions related to government schemes because the farmers are
very keen to take benefit of these schemes. They therefore want to know the terms and
conditions of the scheme, the subsidy that might be given and other formalities. If the

62
FTAs do not have details of the schemes, they may misguide the farmers and thus
create problems. Hence FTas must be well informed about the modalities of
government schemes.
Table 4.17: Overall assessment of usefulness of training programmes - Percent
Strongly
Agree Agree
Partially
Agree/Disagree Disagree
Strongly
Disagree
Average
Rating
It helps in
understanding call
handling procedure
of the KCC 36.67 53.33 6.67 0.00 3.33 4.20
It helps in
operating of the
hardware 3.33 26.67 20.00 40.00 10.00 2.73
It helps in
operating of the
software 3.33 26.67 23.33 36.67 10.00 2.77
It helps in
understanding
questions of farmer 26.67 60.00 10.00 0.00 3.33 4.07
It helps in how to
handle the
questions of farmer 26.67 56.67 13.33 0.00 3.33 4.03
It helps in getting
the necessary
knowledge 26.67 56.67 13.33 0.00 3.33 4.03
It helps in updating
knowledge 36.67 40.00 16.67 3.33 3.33 4.03
It helps in getting
knowledge of
government
schemes 6.67 33.33 43.33 10.00 6.67 3.23
More & better
training is required 56.67 30.00 3.33 6.67 3.33 4.30
Training should be
regularly given 43.33 36.67 6.67 6.67 6.67 4.03
Overall the
available training is
useful & sufficient 10.00 56.67 26.67 3.33 3.33 3.67
Source : Field Survey ; Strongly Agree -5; Agree -4; Partially Agree/Disagree – 3;
Disagree – 2; Strongly Disagree – 1

63
4.8 Self-Assessment of FTAs :
The self assessment of FTAs (Table 5.18 to 5.21) indicated that they were
satisfied with their own performance. Most responses showed that they strongly agreed
or agreed with respect to being quick in responding to calls, handling them efficiently
alongwith software and hardware, quickly access the data base, can satisfy the farmers,
feel motivated and take initiative to perform better and overall are satisfied with their
own performance. The main negative point perhaps was that 40 percent partially
agreed/disagreed that they could escalate calls to higher levels to answer questions.
The FTAs also strongly agreed or agreed that large number of calls are
received everyday, all calls are handled efficiently, call handling procedures are good,
the farmer can understand the FTA, and overall the farmers seemed satisfied with the
handling and speed of response. The performance of the hardware and software used
was good and helpful but 43.3 percent FTAs partially agreed/disagreed that the
performance of the internet connectivity was good. About 40 percent disagreed that
infrastructure service support is good.
Thus overall it can be observed that while FTAs were satisfied with the
hardware and software, the infrastructure and service support was not up to the mark
and hence need improvement.
Table 4.18: Self- Assessment of the FTA - Percent
Strongly
Agree Agree
Partially
Agree/Disagree Disagree
Strongly
Disagree
Average
Rating
You are quick in
responding to calls 63.33 36.67 0.00 0.00 0.00 4.63
You are able to handle
the hardware and
software 43.33 50.00 6.67 0.00 0.00 4.37
You are able to manage
the calls efficiently. 46.67 53.33 0.00 0.00 0.00 4.47
You have sufficient
knowledge & capability
to answer questions 40.00 56.67 3.33 0.00 0.00 4.37
You are generally able
to answer the questions
by yourself 40.00 60.00 0.00 0.00 0.00 4.40
You are able to quickly
access the
database/information to
answer questions
46.67 50.00 3.33 0.00 0.00 4.43

64
Strongly
Agree Agree
Partially
Agree/Disagree Disagree
Strongly
Disagree
Average
Rating
You can take the help of
colleagues to answer
questions 23.33 53.33 20.00 3.33 0.00 3.97
You can escalate calls to
higher levels to answer
questions 10.00 30.00 40.00 13.33 6.67 3.23
You are able to satisfactorily find answers
for the farmer’s
questions 33.33 53.33 13.33 0.00 0.00 4.20
You properly record the
questions and answers 46.67 50.00 3.33 0.00 0.00 4.43
You do not need much
supervision 23.33 63.33 3.33 10.00 0.00 4.00
You show good
discipline, attendance &
punctuality 43.33 53.33 3.33 0.00 0.00 4.40
You are well motivated 60.00 40.00 0.00 0.00 0.00 4.60
You take good initiative
to improve, innovate and
perform better 36.67 63.33 0.00 0.00 0.00 4.37
You are well trained 40.00 56.67 0.00 3.33 0.00 4.33
Overall you are satisfied
with your performance 40.00 56.67 0.00 3.33 0.00 4.33
Source : Field Survey ; Strongly Agree -5; Agree -4; Partially Agree/Disagree – 3;
Disagree – 2; Strongly Disagree - 1
Table 4.19: Overall Assessment of Call Handling - Percent
Strongly
Agree Agree
Partially
Agree/Disagree Disagree
Strongly
Disagree
Average
Rating
A large number of calls
are received every day
at the KCC 56.67 43.33 0.00 0.00 0.00 4.57
All calls can be handled
efficiently at the KCC 30.00 63.33 6.67 0.00 0.00 4.23
Call handling
systems/procedures are
good 26.67 63.33 10.00 0.00 0.00 4.17
The farmer & FTA can
understand each other &
communicate easily 43.33 56.67 0.00 0.00 0.00 4.43
Overall the farmers
seem satisfied with the
handling & speed of
response 16.67 80.00 3.33 0.00 0.00 4.13
Source : Field Survey ; Strongly Agree -5; Agree -4; Partially Agree/Disagree – 3;
Disagree – 2; Strongly Disagree - 1
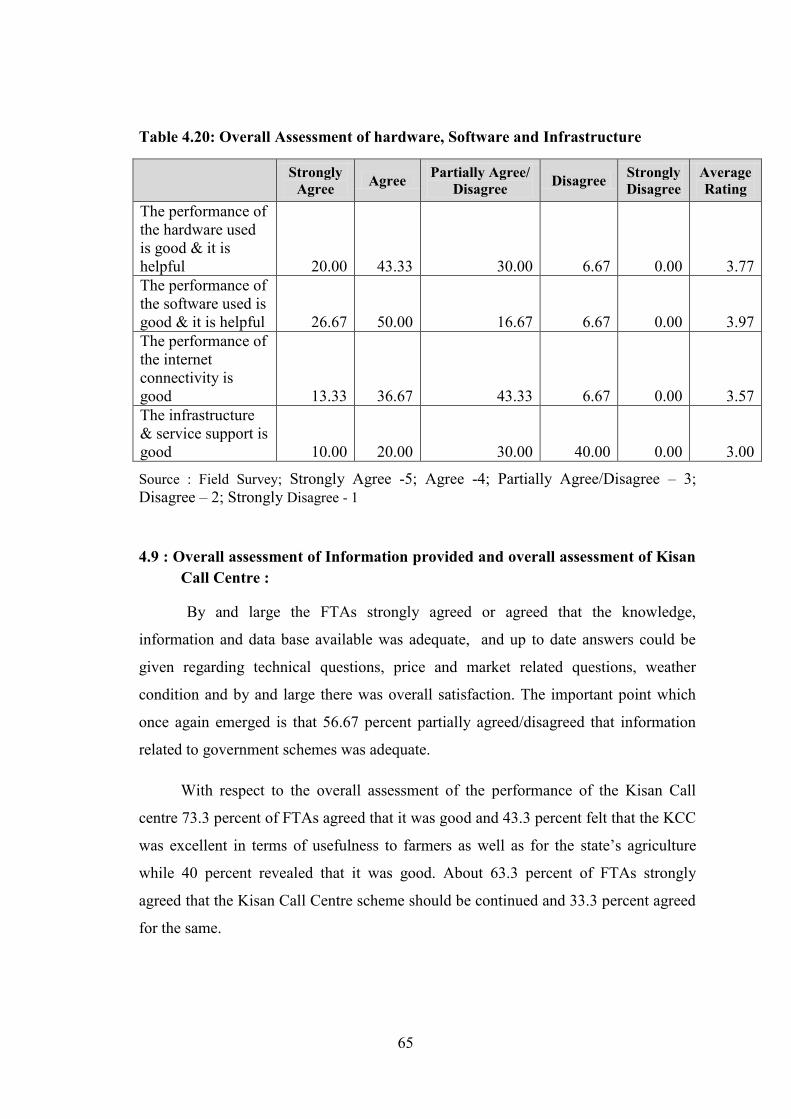
65
Table 4.20: Overall Assessment of hardware, Software and Infrastructure
Strongly
Agree Agree
Partially Agree/
Disagree Disagree
Strongly
Disagree
Average
Rating
The performance of
the hardware used
is good & it is
helpful 20.00 43.33 30.00 6.67 0.00 3.77
The performance of
the software used is
good & it is helpful 26.67 50.00 16.67 6.67 0.00 3.97
The performance of
the internet
connectivity is
good 13.33 36.67 43.33 6.67 0.00 3.57
The infrastructure
& service support is
good 10.00 20.00 30.00 40.00 0.00 3.00
Source : Field Survey; Strongly Agree -5; Agree -4; Partially Agree/Disagree – 3;
Disagree – 2; Strongly Disagree - 1
4.9 : Overall assessment of Information provided and overall assessment of Kisan
Call Centre :
By and large the FTAs strongly agreed or agreed that the knowledge,
information and data base available was adequate, and up to date answers could be
given regarding technical questions, price and market related questions, weather
condition and by and large there was overall satisfaction. The important point which
once again emerged is that 56.67 percent partially agreed/disagreed that information
related to government schemes was adequate.
With respect to the overall assessment of the performance of the Kisan Call
centre 73.3 percent of FTAs agreed that it was good and 43.3 percent felt that the KCC
was excellent in terms of usefulness to farmers as well as for the state’s agriculture
while 40 percent revealed that it was good. About 63.3 percent of FTAs strongly
agreed that the Kisan Call Centre scheme should be continued and 33.3 percent agreed
for the same.

66
Table 4.21 Overall Assessment of Information Provided (Percent)
Strongly
Agree Agree
Partially
Agree/Disagree Disagree
Strongly
Disagree
Average
Rating
The knowledge,
information and
data-base available
with you is
adequate 10.00 56.67 33.33 0.00 0.00 3.77
Adequate & up-to-
date answers are
provided on
technical questions 23.33 56.67 16.67 3.33 0.00 4.00
Adequate & up-to-
date answers are
provided on
government
schemes related
questions 6.67 33.33 56.67 0.00 3.33 3.40
Adequate & up-to-
date answers are
provided on price &
market related
questions 33.33 53.33 13.33 0.00 0.00 4.20
Adequate & up-to-
date answers are
provided on
weather & general
questions 33.33 50.00 16.67 0.00 0.00 4.17
Overall the farmers
seem satisfied with
the information
provided 16.67 76.67 6.67 0.00 0.00 4.10
Source : Field Survey; Strongly Agree -5; Agree -4; Partially Agree/Disagree – 3;
Disagree – 2; Strongly Disagree - 1
Thus the overall conclusion with respect to FTAs response on KCCs was that
while they were satisfied with their own performance in answering queries of farmers,
the main limitation was that they were not well informed about government schemes.
Further while there was no problem by and large with the software and hardware, the

67
infrastructure in terms of ventilation, noise, etc needed to be improved. But almost all
FTAs felt that KCC was useful to farmers and needed for the state’s agriculture.
Table 4.22: Overall Assessment of Kisan Call Centre - Percent
Excellent Good Satisfactory
Somewhat
Poor
Very
Poor
Average
Rating
Please give your
overall assessment of
the performance of
the Kisan Call
Centre 13.33 60 23.33 3.33 0 3.83
Please give an
overall assessment of
your own
performance/contrib
ution at the Kisan
Call Centre 20 73.33 6.67 0 0 4.13
Please give your
overall assessment of
the systems &
policies under which
the Kisan Call
Centre is working 10 33.33 50 6.67 0 3.47
Please give your
overall assessment
about the usefulness
of the Kisan Call
Centre to the farmers
& the state’s
agriculture 43.33 40 16.67 0 0 4.27
Strongly
Agree Agree
Partially
Agree/Disagree Disagree
Strongly
Disagree
Average
Rating
Please give your
overall opinion
whether the Kisan
Call Centre Scheme
should be continued
63.33 33.33 3.33 0 0 4.60
Source : Field Survey; Strongly Agree -5; Agree -4; Partially Agree/Disagree – 3;
Disagree – 2; Strongly Disagree - 1


68
Chapter 5
Results : Farmers’ Survey
5.1 Backdrop :
After observing the profile of Kisan Call centres, the assessment of supervisors
and FTAs on KCCs, etc. it is most important to observe the impact of KCCs on farmers.
This is obviously because the very purpose of KCCs is to cater to the need of farmers
answer their queries which will enable them to take appropriate decisions in farming and
thus increase productivity. Attempt is thus made in this direction in this chapter.
5.2 : Sources of Information/advise on farming :
In Table 5.1, the sources of information and advise on farming related activities is
indicated. It can be observed that the most important source of information was fellow
farmers and 95 percent of farmers in the sample relied on their counterparts for
information. Even KCCs were an important source of information, followed by input
companies. Kisan melas are also organized and gaining in importance to bring awareness
among farmers. In the sample, it was observed that 31 percent of farmers gathered
information of Kisan melas. Although Krishi Vigya Kendras are supposed to be a major
source of information and spread of technology to farmers, only 28 percent of farmers
referred to KVKs for advise.
Table 5.1: Sources of information/ advice on farming – awareness, use and frequency of use
- Percent
Aware
(%)
Use
(%)
Very
Frequently
(%)
Frequently
(%)
Occasionall
y
(%)
Rarely
(%)
Never
(%) Average
Rating
Fellow Farmers 95 95 3.16 45.26 35.79 14.74 1.05 3.35
Extension
Worker 61 61 6.56 19.67 59.02 9.84 4.92
3.13
Input Dealers/
Shops 54 54 7.41 27.78 40.74 20.37 3.70
3.15
Cooperative
societies 11 11 9.09 36.36 45.45 0.00 9.09
3.36
Input Companies 17 17 5.88 29.41 41.18 17.65 5.88 3.12
Local Markets 28 28 0.00 29.63 44.44 25.93 0.00 3.04
Krishi Vigyan 28 28 14.29 35.71 35.71 14.29 0.00 3.50

69
Aware
(%)
Use
(%)
Very
Frequently
(%)
Frequently
(%)
Occasionall
y
(%)
Rarely
(%)
Never
(%) Average
Rating
Kendra’s
(KVK’s)
Agricultural
Universities &
their materials
13 13 7.69 30.77 23.08 30.77 7.69 3.00
Kisan melas/
summits 31 31 13.33 23.33 33.33 30.00 0.00
3.20
Meetings &
demonstrations 20 20 10.00 35.00 30.00 25.00 0.00
3.30
Agriculture
experts 16 16 6.25 31.25 56.25 6.25 0.00
3.38
Kisan Call
Centre (KCC) 79 79 15.19 46.84 31.65 5.06 1.27
3.70
Source : Field Survey; 5-Very Frequently; 4-Frequently; 3-Ocassionally;2-Rarely; 1-Never
0
0.5
1
1.5
2
2.5
3
3.5
4
Fel
low
Far
mer
s
Exte
nsi
on
Work
er
Input
Dea
lers
/ S
hops
Cooper
ativ
e so
ciet
ies
Input
Com
pan
ies
Loca
l M
arket
s
Kri
shi
Vig
yan
Ken
dra
’s
(KV
K’s
)
Agri
cult
ura
l
Univ
ersi
ties
& t
hei
r…
Kis
an m
elas
/ su
mm
its
Mee
tings
&
dem
onst
rati
ons
Agri
cult
ure
exper
ts
Kis
an C
all
Cen
tre
(KC
C)
Aver
age
Rati
ng
Graph 1: Sources of information/ advice on farming – awareness, use
and frequency of use - Average

70
5.3 Communication media and devices used to source information and quality of
information:
Information is made available to farmers through various media and the same can
be observed from Table 5.2. The most important source of information was the mobile
phone and 78 percent of farmers were aware of the usefulness of mobile phone to access
information. About 43 percent of farmers in the sample used mobile phones frequently to
get information. The next important source of information was television and 43 percent
of farmers frequently obtained information from television. It is clear from Table 5.2 that
electronic sources were not at all popular among farmers. None of the farmers had visited
Farmers portal and only one farmer was aware of KKMS. This clearly indicates that there
should be more awareness among farmers to use electronic methods to source
information.
Regarding quality of information (Table 5.3) about 45.26 percent of farmers felt
that the information from fellow farmers was good quality and 51.8 percent indicated that
the information from KCC was good. However, with respect to several sources, the
response was only satisfactory and in few cases poor or very poor. With respect to
awareness and quality of information from media and devices (Table 5.4), it appears that
mobile phone are the most important source of information and 43 percent of farmers
found the quality of information through this device good. Also 100 percent farmers
(Table 5.5) in the sample owned and used mobile telephones and 62 percent found their
use to be good. Only 25 percent of farmers had internet connectivity which was used to
access KCC websites and other such related sites.
Overall, it appears that there is scope to improve the quality of information
provided to farmers by various sources so that they are able to solve their queries. Most
important, farmers do not seem to be using digital technology and hence this needs to be
promoted.

71
Table 5.2: Communication media and devices used to source information
Awareness and use frequency - Percent
Aware
(Valid %
in 100
samples)
Use
(Valid
% in
100
samples)
Very
Frequently Frequently Occasionally Rarely Never
Average
Rating
Newspapers/magazines 49 49 6.12 34.69 42.86 16.33 0.00 3.31
Radio 9 9 11.11 22.22 55.56 11.11 0.00 3.33
TV 61 61 4.92 42.62 37.70 13.11 1.64 3.36
Mobile phone 78 74 12.16 43.24 36.49 8.11 0.00 3.59
Mobile Apps 9 9 11.11 22.22 33.33 33.33 0.00 3.11
Computer 3 3 0.00 33.33 0.00 66.67 0.00 2.67
Internet & websites 12 12 8.33 50.00 16.67 25.00 0.00 3.42
Kisan Knowledge
Management System
(KKMS)
1 1 0.00 0.00 100.00 0.00 0.00 3.00
M-Kisan Portal
(Mobile/SMS Service) 1 1 0.00 100.00 0.00 0.00 0.00
4.00
Source : Field Survey; 5-Very Frequently; 4-Frequently; 3-Ocassionally;2-Rarely; 1-Never
0
0.5
1
1.5
2
2.5
3
3.5
4
4.5
New
spap
ers
/ m
agaz
ines
Rad
io
TV
Mo
bil
e ph
one
Mo
bil
e A
pp
s
Com
pute
r
Inte
rnet
& w
ebsi
tes
Kis
an K
no
wle
dge
Man
agem
ent
Sy
stem
(KK
MS
)
M-K
isan
Po
rtal
(Mo
bil
e/S
MS
Ser
vic
e)
Aver
age
Rati
ng
Graph 2: Communication media and devices used to source
information Awareness and use frequency - Average
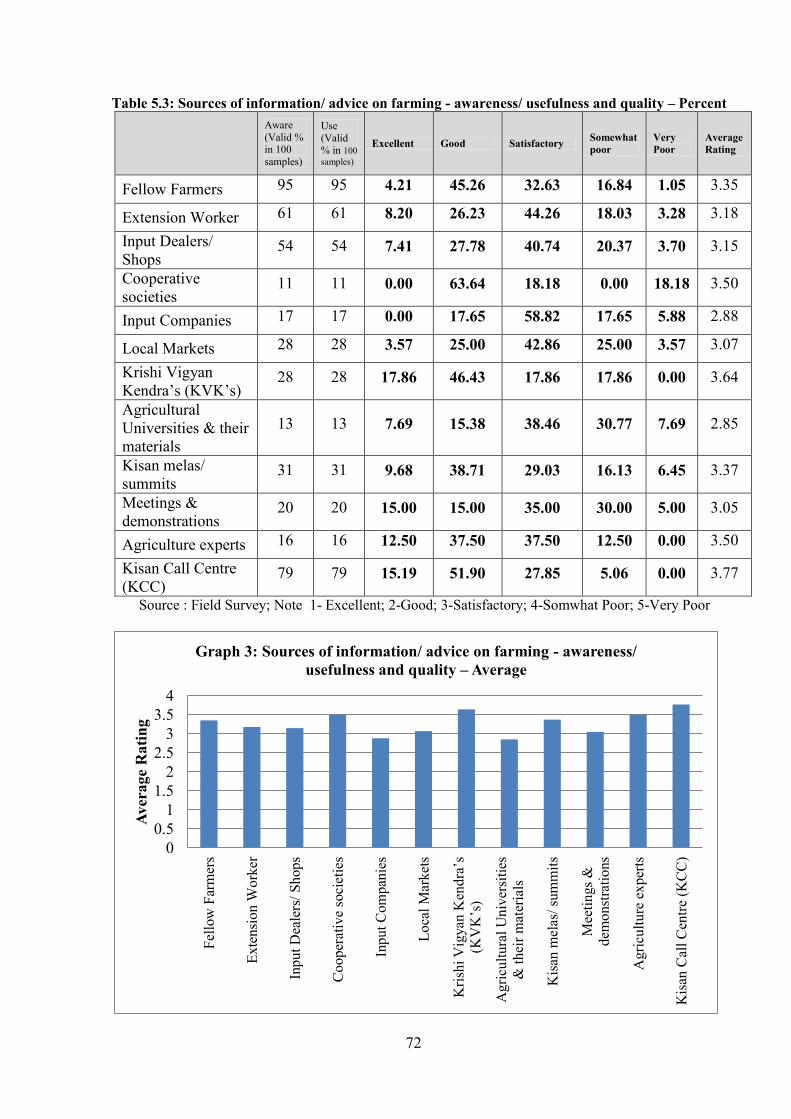
72
Table 5.3: Sources of information/ advice on farming - awareness/ usefulness and quality – Percent
Aware
(Valid % in 100
samples)
Use
(Valid % in 100
samples)
Excellent Good Satisfactory Somewhat
poor
Very
Poor
Average
Rating
Fellow Farmers 95 95 4.21 45.26 32.63 16.84 1.05 3.35
Extension Worker 61 61 8.20 26.23 44.26 18.03 3.28 3.18
Input Dealers/
Shops 54 54 7.41 27.78 40.74 20.37 3.70 3.15
Cooperative
societies 11 11 0.00 63.64 18.18 0.00 18.18 3.50
Input Companies 17 17 0.00 17.65 58.82 17.65 5.88 2.88
Local Markets 28 28 3.57 25.00 42.86 25.00 3.57 3.07
Krishi Vigyan
Kendra’s (KVK’s) 28 28 17.86 46.43 17.86 17.86 0.00 3.64
Agricultural
Universities & their
materials
13 13 7.69 15.38 38.46 30.77 7.69 2.85
Kisan melas/
summits 31 31 9.68 38.71 29.03 16.13 6.45 3.37
Meetings &
demonstrations 20 20 15.00 15.00 35.00 30.00 5.00 3.05
Agriculture experts 16 16 12.50 37.50 37.50 12.50 0.00 3.50
Kisan Call Centre
(KCC) 79 79 15.19 51.90 27.85 5.06 0.00 3.77
Source : Field Survey; Note 1- Excellent; 2-Good; 3-Satisfactory; 4-Somwhat Poor; 5-Very Poor
0
0.5
1
1.5
2
2.5
3
3.5
4
Fel
low
Far
mer
s
Ex
ten
sio
n W
ork
er
Input
Dea
lers
/ S
hop
s
Cooper
ativ
e so
ciet
ies
Inp
ut
Com
pan
ies
Lo
cal
Mar
ket
s
Kri
shi
Vig
yan
Ken
dra
’s
(KV
K’s
)
Agri
cult
ura
l U
niv
ersi
ties
& t
hei
r m
ater
ials
Kis
an m
elas
/ su
mm
its
Mee
tin
gs
&
dem
onst
rati
ons
Agri
cult
ure
exper
ts
Kis
an C
all
Cen
tre
(KC
C)
Aver
age
Rati
ng
Graph 3: Sources of information/ advice on farming - awareness/
usefulness and quality – Average

73
Table 5.4: Communication media and devices used to source information – Awareness/ use
and quality – Percent
Aware
(Valid
% in
100
samples)
Use
(Valid
% in
100
samples)
Excellent Good Satisfactory Some
What
poor
Very
Poor Average
Rating
Newspapers/
magazines 49 49 14.29 30.61 34.69 20.41 0.00 3.39
Radio 9 9 0.00 33.33 66.67 0.00 0.00 3.33
TV 61 61 6.56 44.26 34.43 14.75 0.00 3.43
Mobile
phone 78 74 13.51 43.24 36.49 6.76 0.00 3.64
Mobile Apps 9 9 11.11 44.44 22.22 11.11 11.11 3.33
Computer 3 3 33.33 0.00 33.33 33.33 0.00 3.33
Internet &
websites 12 12 8.33 50.00 25.00 16.67 0.00 3.50
Kisan
Knowledge
Management
System
(KKMS)
1 1 0.00 0.00 100.00 0.00 0.00 3.00
M-Kisan
Portal
(Mobile/SMS
Service)
1 1 0.00 100.00 0.00 0.00 0.00 4.00
Source : Field Survey; Note 1- Excellent; 2-Good; 3-Satisfactory; 4-Somwhat Poor; 5-Very Poor
0
0.5
1
1.5
2
2.5
3
3.5
4
4.5
New
spap
ers/
mag
azin
es
Rad
io
TV
Mobil
e phone
Mobil
e A
pps
Com
pute
r
Inte
rnet
& w
ebsi
tes
Kis
an K
no
wle
dge
Man
agem
ent
Syst
em
(KK
MS
)
M-K
isan
Port
al
(Mobil
e/S
MS
Ser
vic
e)
Aver
ag
e R
ati
ng
Graph 4: Communication media and devices used to source
information – Awareness/ use and quality – Average

74
Table 5.5: Type of ICT Devices/ Features used and their usefulness – percent
Owned
(percent
in 100
samples)
Used
(Percent
in 100
samples)
Used for
KCC/W
ebsites
/Portals
(percent
in 100
samples)
Excellent Good Satisfactory Somewhat
Poor
Very
Poor
Average
Rating
Mobile 100 100 100 17.00 62.00 19.00 1.00 1.00 3.93
Landline 1 1 1 0.00 0.00 100.00 0.00 0.00 3
Mobile
Internet
Connection
25 25 25
12.00 36.00 44.00 4.00 4.00
3.48
Broadband/
Wi-Fi
2 2 2
0.00 0.00 0.00 100.00 0.00
2
Computer 1 1 1 0.00 0.00 100.00 0.00 0.00 3
Source : Field Survey; Note 1- Excellent; 2-Good; 3-Satisfactory; 4-Somwhat Poor; 5-Very Poor
0
0.5
1
1.5
2
2.5
3
3.5
4
4.5
Mobile Landline Mobile Internet
Connection
Broadband/
Wi-Fi
Computer
Aver
ag
e R
ati
ng
Graph 5: Type of ICT Devices/ Features used and their usefulness –
Average

75
5.4 : Overall Call Response Efficiency and Quality
In order that the farmer may make most efficient use of KCC, it is necessary that
the telephone line works efficiently and also the communication skills as well as quality
of response of the FTAs are good. Therefore such questions are addressed in Table 5.6
and 5.7.
It can be observed from Table 5.6 that 60 percent of farmers agreed that KCC toll
free number is easy to reach but 57.50 percent partially agreed/disagreed that wait for
KCC call pick –up is not too long. About two-third of farmers strongly agreed or only
agreed that the voice reception is clear. Majority farmers agreed that FTA greets them
courteously, understands the problem. However, about 43 percent of farmers partially
agreed/disagreed that FTAs response does not take much time and calls are often
escalated to higher authorities. More than half the farmers partially agreed/disagreed or
disagreed that questions escalated are well answered by nodal officer and the overall call
handling and efficiency is good. By and large with respect to overall information
provided being good and useful about half the farmers gave favourable response while
half partially agreed/disagreed or disagreed. This indicates that there is a lot of scope to
solve the queries of farmers.
In Table 5.7 the response to questions on technical aspects is indicated. Again by
and large while half the farmers gave favourable response, the other half partially
agreed/disagreed or fully disagreed on questions such as information being reliable,
provided quickly and easy to understand. While 58.91 strongly agreed or agreed about
satisfaction with response and information provided by FTA, the balance partially
agreed/disagreed or disagreed. Therefore about 40 percent of farmers were not really
satisfied with the responses of FTAs which means there is scope for improvement on
these aspects also.

76
Table 5.6 : Overall Call Response Efficiency & Quality - Percent
Strongl
y Agree
Agree Partially
Agree/
Disagree
Disagree Strongly
Disagree
Average
Rating
KCC toll free number
is easy to reach 11.25 60.00 27.50 1.25 0.00 3.81
The wait for KCC call
pick-up is not too long 2.50 28.75 57.50 10.00 1.25 3.21
Voice reception over
the phone is clear 21.25 45.00 27.50 5.00 1.25 3.80
Call drops are not
frequent 13.75 21.25 41.25 22.50 1.25 3.24
Farmer Tele Advisor
(FTA) greets and
speaks courteously 22.78 34.18 26.58 15.19 1.27 3.62
FTA understands &
responds in your
language 21.52 39.24 32.91 6.33 0.00 3.79
FTA understands your
question or problem
easily 18.75 46.25 27.50 7.50 0.00 3.76
FTA answers clearly
& in a way
understandable to you 21.52 37.97 29.11 11.39 0.00 3.70
FTA’s answer is
useful & solves your
problem/need 17.72 40.51 32.91 8.86 0.00 3.67
FTA’s response does
not take much time 6.25 28.75 43.75 21.25 0.00 3.20
Calls are often
escalated to higher
authorities 7.89 30.26 43.42 17.11 1.32 3.26
Questions escalated
are well answered by
the Agriculture
Experts or Nodal
Officer
16.22 29.73 33.78 18.92 1.35 3.41
Overall the call
handling and
efficiency is good 13.92 37.97 34.18 12.66 1.27 3.51
Overall the
information provided
is good and useful 19.23 32.05 41.03 7.69 0.00 3.63
Source : Field Survey; Strongly Agree -5; Agree -4; Partially Agree/Disagree – 3; Disagree
– 2; Strongly Disagree - 1

77
2.82.9
33.13.23.33.43.53.63.73.83.9
KC
C t
oll
fre
e n
um
ber
is
easy
to r
each
The
wai
t fo
r K
CC
cal
l p
ick
-
up
is
no
t to
o l
on
g
Vo
ice
rece
pti
on o
ver
th
e
ph
on
e is
cle
ar
Cal
l dro
ps
are
no
t fr
equ
ent
Far
mer
Tel
e A
dv
iso
r (F
TA
)
gre
ets
and
sp
eak
s…
FT
A u
nder
stan
ds
&
resp
ond
s in
you
r la
ng
uag
e
FT
A u
nder
stan
ds
yo
ur
ques
tio
n o
r p
roble
m e
asil
y
FT
A a
nsw
ers
clea
rly
& i
n a
way
un
der
stan
dab
le t
o y
ou
FT
A’s
an
swer
is
use
ful
&
solv
es y
ou
r p
rob
lem
/nee
d
FT
A’s
res
po
nse
do
es n
ot
tak
e m
uch
tim
e
Cal
ls a
re o
ften
esc
alat
ed t
o
hig
her
au
tho
riti
es
Ques
tio
ns
esca
late
d a
re w
ell
answ
ered
by
th
e…
Ov
eral
l th
e ca
ll h
and
lin
g
and e
ffic
iency
is
goo
d
Over
all
the
info
rmat
ion
pro
vid
ed i
s g
ood
an
d u
sefu
l
Aver
age
Rati
ng
Graph 6: Overall Call Response Efficiency & Quality - Average

78
Table 5.7 : Response to Questions on technical aspects - Percent
Strongly
Agree Agree
Partially
Agree/Disagree Disagree
Strongly
Disagree
Average
Rating
Information is
easily available
through KCC 8.00 69.33 21.33 0.00 1.33 3.83
Information is
reliable & helpful 12.00 41.33 41.33 5.33 0.00 3.60
Information is
up-to-date 6.67 41.33 46.67 4.00 1.33 3.48
Information is
provided quickly 9.33 34.67 42.67 13.33 0.00 3.40
Information/
Advise is easy to
understand 8.00 49.33 30.67 9.33 2.67 3.51
Information/
Advise is useful
& improves your
performance/
profits
12.00 41.33 40.00 5.33 1.33 3.57
You are satisfied
with the response
& information
provided
15.07 43.84 35.62 4.11 1.37 3.67
Source : Field Survey
3.1
3.2
3.3
3.4
3.5
3.6
3.7
3.8
3.9
Info
rmat
ion
is
easi
ly
avai
lab
le t
hro
ugh
KC
C
Info
rmat
ion
is
reli
able
&
hel
pfu
l
Info
rmat
ion
is
up
-to
-dat
e
Info
rmat
ion
is
pro
vid
ed
quic
kly
Info
rmat
ion
/ A
dv
ise
is e
asy
to
und
erst
and
Info
rmat
ion
/ A
dvis
e i
s
use
ful
& i
mp
rov
es y
our
per
form
ance
/ p
rofi
ts
Yo
u a
re s
atis
fied
wit
h t
he
resp
onse
& i
nfo
rmat
ion
pro
vid
ed
Av
era
ge
Ra
tin
g
Graph 7: Response to Questions on technical aspects - Average

79
5.5: Response on questions related to various aspects of farming operations
The questions asked by farmers relate to various aspects of farming such as price
of produce, information on government schemes, information on weather, etc. Therefore
questions related to these issues are addressed from Table 5.8 to 5.10.
With respect to price and market related questions, about half agreed that
information is easily available through KCC and is reliable. However, the other half
partially agreed/disagreed or disagreed on this aspect. About 54.29 percent of farmers
partially agreed/disagreed that information is up to date and 11.43 percent disagreed
about the same. Only 41.2 percent of farmers indicated that they were satisfied with the
response and information provided by FTAs while 41.18 partially agreed/disagreed and
14.71 disagreed about the same.
A strange finding is observed in Table 5.9 when there was100 percent satisfaction
by farmers on information related to government schemes. This is because an important
complaint by FTAs was that they did not have detailed and up to date knowledge on
government schemes and wanted more information on this aspect. Despite FTAs facing
such constraints, it is revealed that from the farmers side there is complete satisfaction.
More than half the farmers agreed or strongly agreed that information on weather,
services, events, etc is easily available, reliable, up-to –date, provided quickly, easy to
understand and are overall satisfied with the responses given.
Table 5.8 : Response to Price and Market Questions - Percent
Strongly
Agree Agree
Partially
Agree/Disagree Disagree
Strongly
Disagree
Average
Rating
Information is
easily available
through KCC 8.57 42.86 45.71 2.86 0.00 3.57
Information is
reliable & helpful 11.43 40.00 45.71 2.86 0.00 3.60
Information is
up-to-date 5.71 28.57 54.29 11.43 0.00 3.29
Information is
provided quickly 5.71 42.86 34.29 17.14 0.00 3.37
Information/
Advise is easy to
understand 2.86 42.86 45.71 8.57 0.00 3.40

80
Strongly
Agree Agree
Partially
Agree/Disagree Disagree
Strongly
Disagree
Average
Rating
Information/
Advise is useful
& improves your
performance/
profits 2.86 42.86 34.29 17.14 2.86 3.26
You are satisfied
with the response
& information
provided 8.82 32.35 41.18 14.71 2.94 3.29
Source : Field Survey; Strongly Agree -5; Agree -4; Partially Agree/Disagree – 3; Disagree
– 2; Strongly Disagree - 1
3
3.1
3.2
3.3
3.4
3.5
3.6
3.7
Info
rmat
ion i
s ea
sily
avai
lable
thro
ugh K
CC
Info
rmat
ion i
s re
liab
le
& h
elpfu
l
Info
rmat
ion i
s up-t
o-
dat
e
Info
rmat
ion i
s pro
vid
ed
quic
kly
Info
rmat
ion/
Advis
e is
easy
to u
nder
stan
d
Info
rmat
ion/
Advis
e is
use
ful
& i
mpro
ves
your
per
form
ance
/ pro
fits
Yo
u a
re s
atis
fied
wit
h
the
resp
onse
&
info
rmat
ion p
rovid
ed
Aver
age
Rati
ng
Graph 8: Response to Price and Market Questions - Average

81
Table 5.9 : Response to Government Schemes Questions - Percent
Strongly
Agree Agree
Partially
Agree/Di
sagree
Disagree Strongly
Disagree
Average
Rating
Information is
easily available
through KCC 100.00 0.00 0.00 0.00 0.00 5.00
Information is
reliable & helpful 0.00 100.00 0.00 0.00 0.00 4.00
Information is
up-to-date 0.00 100.00 0.00 0.00 0.00 4.00
Information is
provided quickly 0.00 100.00 0.00 0.00 0.00 4.00
Information/
Advise is easy to
understand 0.00 100.00 0.00 0.00 0.00 4.00
Information/
Advise is useful
& improves your
performance/
profits
0.00 100.00 0.00 0.00 0.00 4.00
You are satisfied
with the response
& information
provided
0.00 100.00 0.00 0.00 0.00 4.00
Source : Field Survey : Strongly Agree -5; Agree -4; Partially Agree/Disagree – 3; Disagree – 2; Strongly Disagree – 1
0
1
2
3
4
5
6
Info
rmat
ion i
s ea
sily
avai
lable
thro
ugh K
CC
Info
rmat
ion i
s re
liab
le
& h
elpfu
l
Info
rmat
ion i
s up-t
o-
dat
e
In
form
atio
n i
s pro
vid
ed
quic
kly
Info
rmat
ion/
Advis
e is
easy
to u
nder
stan
d
Info
rmat
ion/
Advis
e is
use
ful
& i
mpro
ves
your
per
form
ance
/ pro
fits
Yo
u a
re s
atis
fied
wit
h
the
resp
onse
&
info
rmat
ion p
rovid
ed
Aver
age
Rati
ng
Graph 9: Response to Government Schemes Questions - Average

82
Table5.10 Response to other questions (weather, services, events etc.) - Percent
Strongly
Agree Agree
Partially
Agree/Disagree Disagree
Strongly
Disagree Average
Information is easily
available through
KCC
17.39 65.22 13.04 4.35 0.00 3.96
Information is
reliable & helpful 17.39 39.13 39.13 4.35 0.00 3.70
Information is up-to-
date 13.04 52.17 30.43 4.35 0.00 3.74
Information is
provided quickly 13.04 52.17 21.74 13.04 0.00 3.65
Information/ Advise
is easy to understand 17.39 56.52 21.74 4.35 0.00 3.87
Information/ Advise
is useful & improves
your performance/
profits
26.09 47.83 13.04 13.04 0.00 3.87
You are satisfied with
the response &
information provided
17.39 43.48 34.78 4.35 0.00 3.74
Source : Field Survey; Strongly Agree -5; Agree -4; Partially Agree/Disagree – 3; Disagree – 2; Strongly Disagree – 1
3.453.5
3.553.6
3.653.7
3.753.8
3.853.9
3.954
Info
rmat
ion i
s ea
sily
avai
lable
thro
ugh K
CC
Info
rmat
ion i
s re
liab
le
& h
elpfu
l
Info
rmat
ion i
s up-t
o-
dat
e
Info
rmat
ion i
s
pro
vid
ed q
uic
kly
Info
rmat
ion/
Advis
e is
easy
to u
nder
stan
d
Info
rmat
ion/
Advis
e is
use
ful
& i
mpro
ves
your
per
form
ance
/ pro
fits
You a
re s
atis
fied
wit
h
the
resp
onse
&
info
rmat
ion p
rovid
ed
Aver
age
Rati
ng
Graph 10: Response to other questions (weather, services, events
etc.) - Average
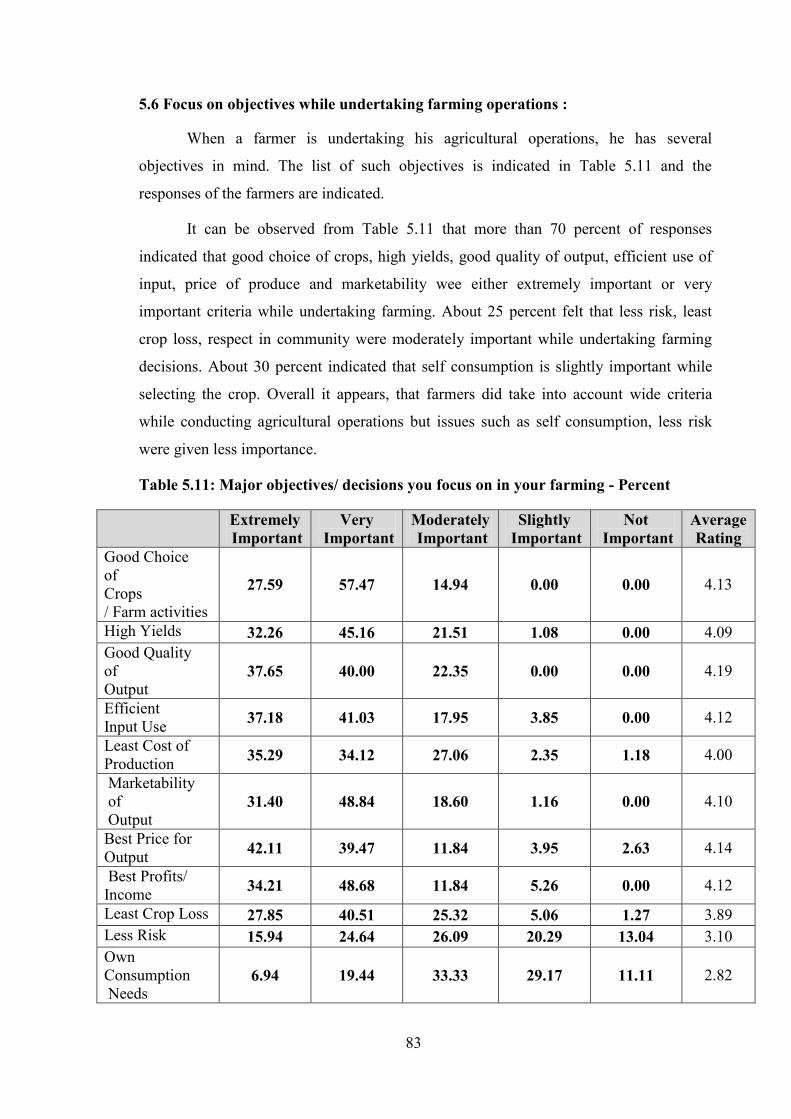
83
5.6 Focus on objectives while undertaking farming operations :
When a farmer is undertaking his agricultural operations, he has several
objectives in mind. The list of such objectives is indicated in Table 5.11 and the
responses of the farmers are indicated.
It can be observed from Table 5.11 that more than 70 percent of responses
indicated that good choice of crops, high yields, good quality of output, efficient use of
input, price of produce and marketability wee either extremely important or very
important criteria while undertaking farming. About 25 percent felt that less risk, least
crop loss, respect in community were moderately important while undertaking farming
decisions. About 30 percent indicated that self consumption is slightly important while
selecting the crop. Overall it appears, that farmers did take into account wide criteria
while conducting agricultural operations but issues such as self consumption, less risk
were given less importance.
Table 5.11: Major objectives/ decisions you focus on in your farming - Percent
Extremely
Important
Very
Important
Moderately
Important
Slightly
Important
Not
Important
Average
Rating
Good Choice
of
Crops
/ Farm activities
27.59 57.47 14.94 0.00 0.00 4.13
High Yields 32.26 45.16 21.51 1.08 0.00 4.09
Good Quality
of
Output 37.65 40.00 22.35 0.00 0.00 4.19
Efficient
Input Use 37.18 41.03 17.95 3.85 0.00 4.12
Least Cost of
Production 35.29 34.12 27.06 2.35 1.18 4.00
Marketability
of
Output 31.40 48.84 18.60 1.16 0.00 4.10
Best Price for
Output 42.11 39.47 11.84 3.95 2.63 4.14
Best Profits/
Income 34.21 48.68 11.84 5.26 0.00 4.12
Least Crop Loss 27.85 40.51 25.32 5.06 1.27 3.89
Less Risk 15.94 24.64 26.09 20.29 13.04 3.10
Own
Consumption
Needs 6.94 19.44 33.33 29.17 11.11 2.82

84
Extremely
Important
Very
Important
Moderately
Important
Slightly
Important
Not
Important
Average
Rating
Personal Safety
& Health 36.36 28.79 30.30 4.55 0.00 3.97
Personal
Achievement/
Knowledge 32.84 38.81 22.39 5.97 0.00 3.99
Respect/
Image in
Community 32.86 35.71 25.71 4.29 1.43 3.94
Long Term
Productivity 29.85 38.81 23.88 7.46 0.00 3.91
Better
Environment 34.92 34.92 25.40 4.76 0.00 4.00
Others 35.90 41.03 17.95 5.13 0.00 4.08
Source : Field Survey; Note : 5- Extremely Important, 4-Very Important; 3-Moderately
Important; 2-Slightly Important; 1- Not Important
5.7 Importance of Kisan Call centres on important decisions:
The farmer needs information on a wide variety of aspects related to agriculture
before sowing his crop, during harvest as well as post harvest. He receives this
information from various sources including from KCCs. Therefore in Table 5.12, we
tried to observe on which aspect he is dependent on KCC.
0
0.5
1
1.5
2
2.5
3
3.5
4
4.5
Go
od C
ho
ice
of
Cro
ps/
Far
m a
ctiv
itie
s
Hig
h Y
ield
s
Go
od Q
ual
ity
of
Ou
tput
Eff
icie
nt
Inp
ut
Use
Lea
st C
ost
of
Pro
duct
ion
Mar
ket
abil
ity
of
Outp
ut
Bes
t P
rice
fo
r O
utp
ut
Bes
t P
rofi
ts/
Inco
me
Lea
st C
rop
Loss
Les
s R
isk
Ow
n C
on
sum
pti
on
Nee
ds
Per
son
al S
afet
y &
Hea
lth
Per
son
al A
chie
vem
ent/
Kn
ow
led
ge
Res
pec
t/ I
mag
e in
Com
mu
nit
y
Lo
ng
Ter
m P
rod
uct
ivit
y
Bet
ter
En
vir
on
men
t
Oth
ers
Aver
age
Rati
ng
Graph 11: Major objectives/ decisions you focus on in your farming -
Average

85
It can be observed from Table 5.12 that with respect to credit and insurance
decisions, 100 percent of farmers indicated that KCCs are extremely important to guide
them on such issues. About 74 percent farmers felt that KCCs are very important to
advise them on disease control decisions. About 67 percent farmers felt that KCCs are
useful in providing information on storage decisions but moderately important on risk
reduction decisions. Half the farmers (52.38 percent) noted that KCCs had only moderate
importance on their planting decisions and quality improvement. With respect to supply
chain and transport decisions 100 percent farmers indicated that KCCS are not important.
Table 5.12: Importance of KCC on important decisions - Percent
Extremely
Important
Very
Important
Moderately
Important
Slightly
Important
Not
Important
Average
Rating
Crop selection decisions 4.35 58.70 34.78 0.00 2.17 3.77
Variety selection decisions 17.07 53.66 24.39 4.88 0.00 3.83
Input purchase decisions 10.53 42.11 31.58 15.79 0.00 3.47
Planting decisions 4.76 42.86 52.38 0.00 0.00 3.52
Soil management decisions 17.65 35.29 41.18 5.88 0.00 3.65
Fertilizer/ feed application
decisions 27.91 53.49 18.60 0.00 0.00 4.09
Water management
decisions 26.32 36.84 21.05 15.79 0.00 3.74
Weather/ rainfall related
decisions 18.18 45.45 27.27 4.55 4.55 3.68
Crop management decisions 17.65 64.71 11.76 5.88 0.00 3.94
Agricultural machinery
decisions 44.44 11.11 11.11 22.22 11.11 3.56
Insect pest control decisions 25.64 48.72 23.08 2.56 0.00 3.97
Disease control decisions 10.87 73.91 10.87 4.35 0.00 3.91
Weed control decisions 8.33 58.33 25.00 8.33 0.00 3.67
Cost reduction/ efficiency
increasing decisions 0.00 44.44 55.56 0.00 0.00 3.44
Quality improvement
decisions 12.50 37.50 50.00 0.00 0.00 3.63
Harvesting & post-harvest
decisions 25.00 41.67 25.00 8.33 0.00 3.83
Marketing decisions 19.35 41.94 32.26 6.45 0.00 3.74
Price & profit related 20.00 40.00 33.33 0.00 6.67 5.31

86
Extremely
Important
Very
Important
Moderately
Important
Slightly
Important
Not
Important
Average
Rating
decisions
Supply chain & transport
decisions 0.00 0.00 0.00 0.00 100.00 1
Storage decisions 0.00 66.67 0.00 0.00 33.33 3
Risk reduction decisions 0.00 33.33 66.67 0.00 0.00 3.33
Credit decisions 100.00 0.00 0.00 0.00 0.00 5
Insurance decisions 100.00 0.00 0.00 0.00 0.00 4
Government schemes
& assistance decisions 0.00 100.00 0.00 0.00 0.00 2.5
Source : Field Survey; Note : 5- Extremely Important, 4-Very Important; 3-Moderately
Important; 2-Slightly Important; 1- Not Important
5.8 Impact of KCC on important decisions:
Since the very purpose of KCCs is to solve farmers’ queries and have
impact on them, the same was observed with respect to various aspects and indicated in
Table 5.13. More than 70 percent of farmers indicated that KCCs had significant impact
on fertilizer/feed application, crop management decisions, insect/pest control decisions.
About half the farmers said that KCCs had moderate impact on planting decisions, credit
decisions and insurance decisions. Also storage decisions and risk reduction decisions
had moderate to small impact by KCCs on farmers. It was observed that 100 percent
0
1
2
3
4
5
6
Cro
p s
elec
tion d
ecis
ions
Var
iety
sel
ecti
on d
ecis
ions
Input
purc
has
e dec
isio
ns
Pla
nti
ng d
ecis
ions
Soil
man
agem
ent
dec
isio
ns
Fer
tili
zer/
fee
d…
Wat
er m
anag
emen
t…
Wea
ther
/ ra
infa
ll r
elat
ed…
Cro
p m
anag
emen
t…
Inse
ct p
est
contr
ol…
Dis
ease
contr
ol
dec
isio
ns
Wee
d c
ontr
ol
dec
isio
ns
Cost
red
uct
ion/…
Qual
ity i
mpro
vem
ent…
Har
ves
ting &
post
-…
Mar
ket
ing d
ecis
ions
Pri
ce &
pro
fit
rela
ted…
Supply
chai
n &
…
Sto
rage
dec
isio
ns
Ris
k r
educt
ion d
ecis
ions
Cre
dit
dec
isio
ns
Insu
rance
dec
isio
ns
Gover
nm
ent
schem
es &
…
Aver
age
Rati
ng
Graph 12: Importance of KCC on important decisions -Average

87
farmers indicated that KCCs had significant impact on their taking advantage of
government schemes.
Table 5.13: Impact of KCC on important decisions - Percent
Huge
Impact
Significant
Impact
Moderate
Impact
Small
Impact
No
Impact
Average
Rating
Crop selection decisions 4.17 58.33 35.42 0.00 2.08 3.63
Variety selection decisions 12.20 53.66 29.27 4.88 0.00 3.73
Input purchase decisions 9.09 40.91 36.36 13.64 0.00 3.45
Planting decisions 8.70 34.78 52.17 4.35 0.00 3.48
Soil management decisions 8.00 48.00 32.00 12.00 0.00 3.52
Fertilizer/ feed
application decisions 23.26 55.81 18.60 2.33 0.00 4
Water management decisions 26.32 42.11 21.05 10.53 0.00 3.84
Weather/ rainfall
related decisions 18.18 50.00 22.73 4.55 4.55 3.73
Crop management decisions 11.76 64.71 17.65 5.88 0.00 3.82
Agricultural machinery
decisions 30.77 23.08 23.08 7.69 15.38 3.46
Insect pest control decisions 26.09 47.83 19.57 6.52 0.00 3.93
Disease control decisions 14.58 58.33 20.83 6.25 0.00 3.81
Weed control decisions 0.00 50.00 25.00 16.67 8.33 3.17
Cost reduction/ efficiency
increasing decisions 0.00 33.33 55.56 11.11 0.00 3.22
Quality improvement
decisions 11.11 44.44 33.33 11.11 0.00 3.56
Harvesting &
post-harvest decisions 23.08 30.77 30.77 7.69 7.69 3.54
Marketing decisions 17.95 51.28 23.08 5.13 2.56 3.77
Price & profit related decisions 20.00 40.00 26.67 6.67 6.67 3.6
Supply chain & transport
decisions 0.00 0.00 0.00 0.00 100.00 1
Storage decisions 0.00 33.33 33.33 0.00 33.33 2.67
Risk reduction decisions 0.00 33.33 33.33 33.33 0.00 3
Credit decisions 50.00 0.00 50.00 0.00 0.00 4
Insurance decisions 50.00 0.00 50.00 0.00 0.00 4
Government schemes &
assistance decisions 0.00 100.00 0.00 0.00 0.00 3
Source : Field Survey; Note : 5- Huge Impact; 4- Significant Impact; 3-Moderate Impact; 2- Small Impact; 1- No Impact

88
5.9 Overall assessment of KCCs by farmers :
Since the very purpose of KCCs is to benefit the farmers and provide them
with useful information, in Table 5.14 we tried to capture the overall assessment of
KCCs by farmers by addressing them with few questions.
It can be observed from Table 5.14 that there were negligible farmers who
indicated that KCCs were excellent while 52 percent assessed them as good, 65.82
percent felt they were good with respect to response and efficiency. Further, 54.43
percent farmers felt that the quality of information provided by KCCs is good while 40
percent revealed that it is satisfactory.
With respect to continuation of KCCs, 30.38 strongly agreed that KCCs should
be continued while 51.90 percent agreed. Thus overall 82.28 percent of farmers felt that
KCCs should be continued and 17.72 percent partially agreed/disagreed. Overall, it
therefore appears that farmers are very keen on KCCs being continued, but ofcourse
efforts will have to made on various aspects relating to infrastructure in KCCs as well as
quality of response by FTAs so that farmers gain and FTAs also work under better
conditions.
0
0.5
1
1.5
2
2.5
3
3.5
4
4.5
Cro
p s
elec
tio
n d
ecis
ions
Var
iety
sel
ecti
on
dec
isio
ns
Inp
ut
pu
rch
ase
dec
isio
ns
Pla
nti
ng
dec
isio
ns
So
il m
anag
emen
t d
ecis
ion
s
Fer
tili
zer/
fee
d
app
lica
tion
…
Wat
er m
anag
emen
t d
ecis
ion
s
Wea
ther
/ ra
infa
ll r
elat
ed…
Cro
p m
anag
emen
t d
ecis
ion
s
Ag
ricu
ltura
l m
ach
iner
y…
Inse
ct p
est
contr
ol
dec
isio
ns
Dis
ease
co
ntr
ol
dec
isio
ns
Wee
d c
on
tro
l d
ecis
ion
s
Cost
red
uct
ion/
effi
cien
cy…
Qu
alit
y i
mp
rov
emen
t…
Har
ves
tin
g &
po
st-h
arv
est…
Mar
ket
ing d
ecis
ion
s
Pri
ce &
pro
fit
rela
ted
…
Su
pply
ch
ain
& t
ran
sport
…
Sto
rag
e d
ecis
ions
Ris
k r
edu
ctio
n d
ecis
ion
s
Cre
dit
dec
isio
ns
Insu
ran
ce d
ecis
ion
s
Go
ver
nm
ent
sch
emes
&
ass
ista
nce
dec
isio
ns
Av
era
ge
Ra
tin
g
Graph 13 :Impact of KCC on important decisions Average
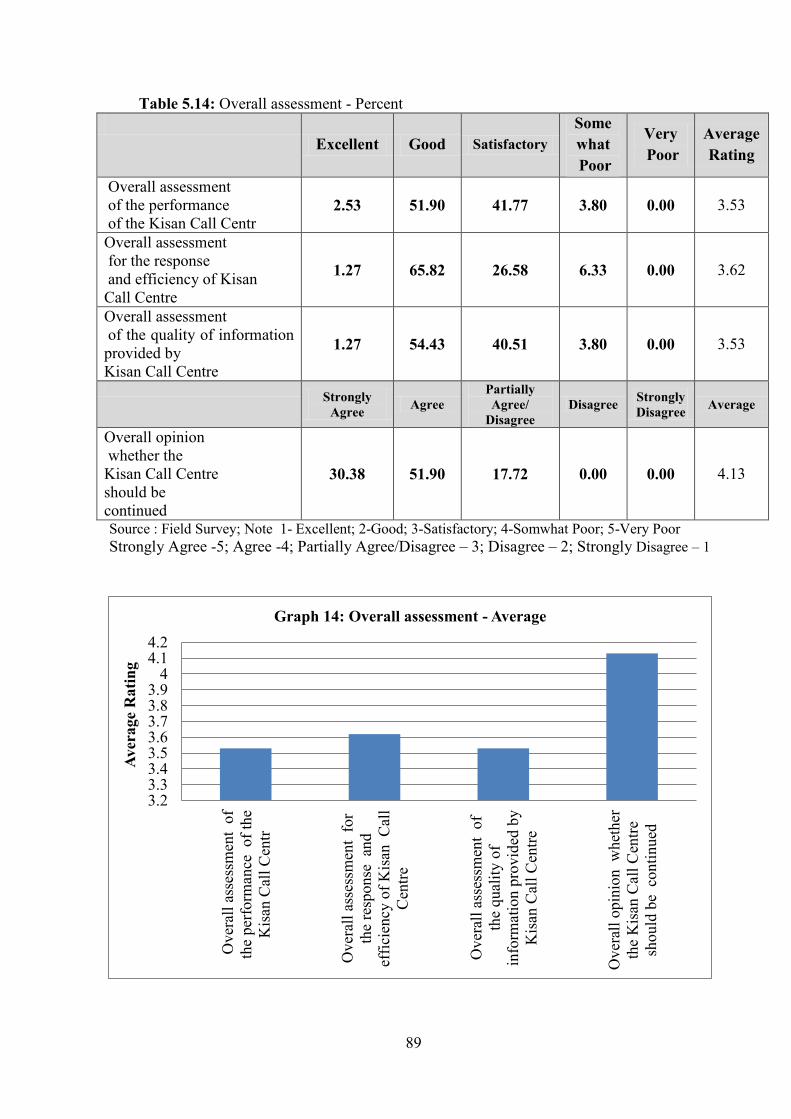
89
Table 5.14: Overall assessment - Percent
Excellent Good Satisfactory
Some
what
Poor
Very
Poor
Average
Rating
Overall assessment
of the performance
of the Kisan Call Centr 2.53 51.90 41.77 3.80 0.00 3.53
Overall assessment
for the response
and efficiency of Kisan
Call Centre
1.27 65.82 26.58 6.33 0.00 3.62
Overall assessment
of the quality of information
provided by
Kisan Call Centre
1.27 54.43 40.51 3.80 0.00 3.53
Strongly
Agree Agree
Partially
Agree/
Disagree
Disagree Strongly
Disagree Average
Overall opinion
whether the
Kisan Call Centre
should be
continued
30.38 51.90 17.72 0.00 0.00 4.13
Source : Field Survey; Note 1- Excellent; 2-Good; 3-Satisfactory; 4-Somwhat Poor; 5-Very Poor
Strongly Agree -5; Agree -4; Partially Agree/Disagree – 3; Disagree – 2; Strongly Disagree – 1
3.23.33.43.53.63.73.83.9
44.14.2
Over
all
asse
ssm
ent
of
the
per
form
ance
of
the
Kis
an C
all
Cen
tr
Over
all
asse
ssm
ent
for
the
resp
onse
an
d
effi
cien
cy o
f K
isan
C
all
Cen
tre
Ov
eral
l as
sess
men
t o
f
the
qual
ity o
f
info
rmat
ion p
rovid
ed b
y
Kis
an C
all
Cen
tre
Over
all
opin
ion w
het
her
the
Kis
an C
all
Cen
tre
should
be
conti
nued
Aver
age
Rati
ng
Graph 14: Overall assessment - Average

90
Chapter 6
Summary and Conclusions
6.1 Introduction:
The agricultural sector in the Indian economy, as is well known, is
experiencing much lower rates of growth as compared to the manufacturing and service
sectors. Hence in order to achieve higher overall economic growth rate, it is important to
increase productivity in the agricultural sector which will also help to contribute to
increased rural incomes and employment. A major constraint to growth in the agricultural
sector is poor extension services due to lack of resources, limited manpower, reluctance on
the part of government personnel to serve in the interiors, etc. In this context, recent
developments in Information and Communication Technology (ICT) which can provide
speedy advisory services alongwith technical updates to farmers in order to help them with
appropriate extension services are being promoted. Accordingly, the Government of India
under the National e-Governance Plan have developed e-enabled services such as setting
up of Kisan Call Centres (KCC), Kisan Knowledge Management System (KKMS),
Farmers’ Portal and M-Kisan Portal which have gradually evolved since 2004 and makes
it possible to reach the entire farming community spread over different agro-climatic
regions.
ICT can also be used to meet location specific information needs of the farmers
and also bring farmers in the interiors in isolated areas to access technological
improvements. ICT can also facilitate interactive sessions of knowledge experts with
farmers, and by and large help agricultural universities, farmers and other stakeholders
to come together and share information. The extent of learning depends upon how well
the information is assimilated and how widely it is disseminated.
In view of the above, it is important to examine the effectiveness of e
services in providing advisory services to farmers so that they are in a position to make
appropriate decisions and solve the problems they face in farming. Accordingly a
study was undertaken to study the structure, design, implementation and performance
of the government systems of Kisan Call Centres, Kisan Knowledge Management
System, Farmers’ Portal and M-Kisan Portal in the state of Maharashtra.

91
6.2 Objectives of the study and Methodology :
The study attempts to note the benefit which the farmers have received from e
services and the extent to which their problems could be solved.
More specifically, the broad objectives of the study are :
1. To examine the organizational setup, infrastructure, ICT and other systems
used, information content and flow, ability of manpower involved and the
governance of the system.
2. To observe the record of the use of the systems-the profile and pattern of
users, the number and nature of calls and the responses given by KCCs.
3. To evaluate the performance of the system from the point of view of the
farmers/users including the ease and usefulness of the system. Also the
information needs of the farmers and the extent to which these are satisfied
is noted.
4. Policy measures with respect to improvement in the system and making it
more effective so that farm productivity will be enhanced, livelihoods of
the rural persons will improve and finally the agricultural sector will get a
boost.
The KCC for Maharashtra is located in Pune from where the Farmer Tele
Advisers (FTAs) and supervisors were contacted for relevant information. Farmers
across 4 districts (Pune, Ahmednagar, Solapur and Osmanabad) were contacted to get
appropriate feedback of their experience with KCC.
A neatly designed and very detailed questionnaire was addressed to all
stakeholders of the Kisan Call Centres, namely Supervisors, Farmer Tele Advisors
(30), farmers who avail of services of Kisan Call centres (80) and some non-users (20).
A rating scale is used in the questionnaire which does the following rating:
Strongly Agree -5; Agree -4; Partially Agree/Disagree – 3; Disagree – 2; Strongly Disagree
– 1

92
6.3 Main Findings :
1. The education profile of the KCC (Table 2.2) reveals that 80 percent of the FTAs
were B.Sc. graduates while 13.33 percent were M.Sc. graduates. The subject of
specialization was mainly agriculture and 76.67 percent had passed out from
Agricultural Universities. It was also observed that 73.3 percent of FTAs did not
have work experience
2. The educational profile in the primary survey of 80 farmers who availed the
services of KCCs indicated that 43.75 percent were higher secondary and 2.50
percent were illiterate. The caste profile indicated that 77.50 belonged to
general/other categories. The age-profile indicated that 80 percent were between 18
to 49 years. A similar exercise was conducted with respect to non-user farmers of
KCC services. It was observed that 45 percent were higher secondary pass and 25
percent were illiterate. With respect to caste it was observed that 55 percent were
OBC category while 40 percent belonged to other/General category. The age
profile of non-users showed that 45 percent were in the age group 50-59 years.
3. Initially, when the KCC office was set up in Nagpur in 2004, its functioning was
very limited due to inadequate infrastructure. The calls were received on landline
and there were only 3 FTAs in each shift and one supervisor. The calls received
per day were barely 200 and information available with FTAs was also very
limited. However, restructuring took place, and KCC office was established in
Pune on 1st May 2012. After shifting to Pune, there was a huge change in the
functioning of KCCs. The total number of FTAs increased to 69 (30 in each shift
and some extra) and the states covered were Maharashtra and Goa. The languages
used to answer queries were Marathi, Hindi and English.
4. There was remarkable improvement in the hardware as well as software after
restructuring of KCCs as indicated by both supervisors. They also had a data base
of farmers and were in a position to respond to farmers’ queries. All equipment
installed in the KCC improved the efficiency of the KCC.
5. Both supervisors only partially agreed that the office space was adequate. One
supervisor disagreed on the activity area of each FTA being sufficient and felt co
workers can get disturbed while calls are being answered. There was also other
noise from department and perhaps video surveillance was not sufficient for
monitoring.

93
6. One supervisor strongly agreed and the other one only agreed that FTAs are
efficient in responding to calls, answer the queries and also access the
database/information to answer the questions. Both supervisors partially agreed
that FTAs are motivated and one supervisor only partially agreed that FTAs take
good initiative to improve, innovate and perform better. One supervisor felt that
FTAs need supervision while performing work.
7. Both supervisors felt that for information and knowledge sources, the FTAs
depended on self knowledge and internet search very frequently. The colleagues
and supervisors were frequently referred to for obtaining information. However,
on certain aspects such as knowledge from Nodal officer or field inquiry, both the
supervisors responded that such sources were never resorted to. Also extension
booklets and papers were rarely used. Hence the overall conclusion appears that
information and knowledge by FTAs was most often obtained from their own
knowledge as well as from internet search. Calls were seldom escalated to level 2
and 3.
8. The questionnaire addressed to FTAs revealed that with respect to hardware more
than half the FTAs responded that the hardware is latest and up to date, it is fast,
reliable, well maintained and interface of key board & mouse is good. However 50
percent FTAs partially agreed/disagreed that the hardware breaks down frequently,
36.67 percent disagreed that headsets are comfortable and work well and 46.67
percent strongly disagreed that peripherals such as printer and scanner work well.
9. With respect to software, more than 50 percent FTAs agreed that it was user
friendly in most aspects but 33.3 percent partially agreed/disagreed that the
software could handle heavy traffic and does not crash frequently. Also more than
half the FTAs agreed the importance of good internet connectivity. However 40
percent agreed/disagreed that during heavy call loads, the internet does not slow
down.
10. It was observed that the most frequent source of knowledge of FTAs was self
knowledge. With respect to material from Government department, 40 percent
indicated that they rarely resorted to this source and 50 percent never used field
inquiry as a source of knowledge. About 26.67 percent indicated that extension
booklets, books and papers were never used for updating their knowledge. Little
more than 30 percent rarely or never used University experts or Nodal officers or
even obtained information from other farmers to update their knowledge.

94
11. About three fourths of FTAs, either strongly agreed or agreed that price and market
information was easily accessible and farmers were satisfied with the answers
received from FTAs. Similarly more than three-fourths of FTAs strongly agreed or
agreed that KKMS website was user friendly, though 23.3 percent disagreed that
changes can be made in the information after it is recorded. With respect to
Farmers Portal also the response of FTAs was encouraging but 36.67 partially
agreed/disagreed that the information is regularly updated. The m-Kisan website
response was also on the favorable side and three fourths of FTAs strongly agreed
or agreed about smooth working of the website.
12. While 66.67 percent of FTAs indicated that call clarity is good and farmers do not
face any difficulty in understanding the dialect and overall call efficiency is good,
about 30 percent partially agreed/disagreed that call drops are less. Also a little
more than 40 percent of FTAs partially agreed/ disagreed about getting irrelevant
calls and facing abusive language.
13. About three fourths of the FTAs together either strongly agreed or only agreed that
they were in a position to handle the questions asked by farmers and queries not
solved by them were well handled by their colleagues or supervisors. However
about 50 percent FTAs disagreed or strongly disagreed that queries not solved in
level 2 are escalated to level 3, or are well attended by Nodal officers or even
responded to farmers by e mail, SMS/post. Hence it appears that FTAs did not
have enough faith in level 2 or level 3.
14. While 50 percent agreed that power cuts are not frequent, the overall picture with
respect to infrastructure is not encouraging. There was partial
agreement/disagreement or strong disagreement over issues such as sufficiency in
lighting, adequate ventilation, noise in other departments which hinders the
answering efficiency and overall good working environment.
15. More than half the FTAs in the sample partially agreed/disagreed or entirely
disagreed that the training programmes help in operating hardware and software.
Also about 43 percent of FTAs partially agreed/disagreed that the training
programmes help in getting knowledge about government schemes. Even during
the personal visit, there was complaint from supervisors and FTAs that they are not
well informed about government schemes.
16. The self assessment of FTAs indicated that they strongly agreed or agreed that
large number of calls are received everyday, all calls are handled efficiently, call

95
handling procedures are good, the farmer can understand the FTA, and overall the
farmers seemed satisfied with the handling and speed of response. The
performance of the hardware and software used was good and helpful but 43.3
percent FTAs partially agreed/disagreed that the performance of the internet
connectivity was good. About 40 percent disagreed that infrastructure service
support is good.
17. With respect to questionnaire addressed to farmers, it was that the most important
source of information was fellow farmers and 95 percent of farmers in the sample
relied on their counterparts for information. Even KCCs were an important source
of information, followed by input companies. Kisan melas were also organized and
gaining in importance to bring awareness among farmers. Although Krishi Vigya
Kendras are supposed to be a major source of information and spread of
technology to farmers, only 28 percent of farmers referred to KVKs for advise.
18. The most important source of information was the mobile phone and 78 percent of
farmers were aware of the usefulness of mobile phone to access information.
About 43 percent of farmers in the sample used mobile phones frequently to get
information. The next important source of information was television and 43
percent of farmers frequently obtained information from television. It was clear
that information from websites was not at all popular among farmers. None of the
farmers had visited Farmers portal and only one farmer was aware of KKMS.
19. About 60 percent of farmers agreed that KCC toll free number is easy to reach but
57.50 percent partially agreed/disagreed that wait for KCC call pick –up is not too
long. About two-third of farmers strongly agreed or only agreed that the voice
reception is clear. Majority farmers agreed that FTA greets them courteously,
understands the problem. However, about 43 percent of farmers partially
agreed/disagreed that FTAs response does not take much time and calls are often
escalated to higher authorities. More than half the farmers partially
agreed/disagreed or disagreed that questions escalated are well answered by nodal
officer and the overall call handling and efficiency is good. By and large with
respect to overall information provided being good and useful about half the
farmers gave favourable response while half partially agreed/disagreed or
disagreed.
20. . While 58.91 strongly agreed or agreed about satisfaction with response and
information provided by FTA, the balance partially agreed/disagreed or disagreed.

96
Therefore about 40 percent of farmers were not really satisfied with the responses
of FTAs which means there is scope for improvement on these aspects also.
21. More than 70 percent of farmers indicated that good choice of crops, high yields,
good quality of output, efficient use of input, price of produce and marketability
were either extremely important or very important criteria while undertaking
farming. About 25 percent felt that less risk, least crop loss, respect in community
were moderately important while undertaking farming decisions. About 30 percent
indicated that self consumption is slightly important while selecting the crop.
22. With respect to credit and insurance decisions, 100 percent of farmers indicated
that KCCs are extremely important to guide them on such issues. About 74 percent
farmers felt that KCCs are very important to advise them on disease control
decisions. About 67 percent farmers felt that KCCs are useful in providing
information on storage decisions but moderately important on risk reduction
decisions. Half the farmers (52.38 percent) noted that KCCs had only moderate
importance on their planting decisions and quality improvement. With respect to
supply chain and transport decisions 100 percent farmers indicated that KCCS are
not important.
23. With respect to overall assessment of Kisan Call Centres, there were negligible
farmers who indicated that KCCs were excellent while 52 percent assessed them as
good, 65.82 percent felt they were good with respect to response and efficiency.
Further, 54.43 percent farmers felt that the quality of information provided by
KCCs is good while 40 percent revealed that it is satisfactory.
24. With respect to continuation of KCCs, 30.38 strongly agreed that KCCs should be
continued while 51.90 percent agreed. Thus overall 82.28 percent of farmers felt
that KCCs should be continued and 17.72 percent partially agreed/disagreed.
Overall, it therefore appears that farmers are very keen on KCCs being
continued, but ofcourse efforts will have to made on various aspects relating to
infrastructure in KCCs as well as quality of response by FTAs so that farmers gain
and FTAs also work under better conditions.
6.4 Policy Implications :
The major policy implications that emerge from the study are :
1. On visit to the KCC in Pune and also as indicated by supervisors, it was observed
that the activity area of the KCC was insufficient and there was disturbance to

97
FTAs. Hence, it is necessary to ensure that office space is suitable, well ventilated,
adequate toilet facilities are provided and overall work conditions are improved.
This will also motivate the FTAs to perform better. Some FTAs felt the need to
have transport facilities for work, especially for female FTAs.
2. Besides better work conditions, the FTAs also felt that they are not only underpaid
but also have contractual appointment. Hence they did not have incentive to
continue in the job. Also since large number of calls come daily, there is need to
increase the number of FTAs in KCC. For example, on the day the visit was made
to KCC, the number of calls received was 3410 while only 2455 calls could be
attended. Hence to avoid call waiting, the number of FTAs may be increased and
salary may also be raised.
3. Since self knowledge and internet search were the main source of knowledge to
FTAs, it is very important to provide them with more sources of information such
as booklets, information on latest government schemes, field visits, knowledge
from Nodal officers, etc. The websites should also be regularly updated and
training programmes should be regularly conducted so that FTAs are in a position
to give good advisory services to farmers which is the very purpose of the scheme.
4. Despite KCCs having the potential to reach out to farmers across the state, it was
observed that farmers still depend upon fellow farmers for extension services.
Hence all round effort must be made to ensure that there is increasing use of KCCs
to solve the queries of farmers.
5. Efforts must also be made to ensure that farmers are satisfied with response given
by FTAs as this will promote the use of KCCs as a source of extension services.
Also escalation of questions to higher levels must be improved so that if any calls
are not handled by FTAs, they should be satisfied by Nodal officers.
Thus overall it can be concluded that while KCCs do have the potential to
provide extension services to each and every farmer, irrespective of location, the
service must be improved by ensuring that the infrastructure is up to the mark, the
FTAs have upto date knowledge on all agricultural operations as well as
government schemes and farmers are also aware of such a service. If this happens,
then with increasing use of KCCs, farmers will be able to resolve their queries,
avoid crop failure and thus increase productivity which will provide the much
needed boost to the agricultural sector.

98
References:
Shankaraiah, N. , and others (2012), Dissemination of Farm Information Through Agri
Portals, International Journal of Advanced Biological
Research,Vol.2(3)2012:382-391, ISSN 2250-3579
Ganesh Das (2016), “Perception of Kisan call centre (Farmer Call centre) by the farming
community with their socio-economic variable: A study on Coochbehar
District”, IRCST international Journal of Advanced Computing, Engineering
and Application (IJACEA), ISSN:2319-281x,vol.5,No.3, May-June2016
Web Site
1. www.dackkms.gov.in
2. www.mkisan.gov.in/images/featurekccpdf
3. http://mkisan.gov.in/aboutmkisan.apx
4. http://ccknia.org/download/publications/150122/11SWOT AnalysisReportodisha.pdf


99
Review of the Report
(I) Title of the Draft Study Report Examined:
‘’Decision-oriented Information System for Farmers: A Study of Kisan Call Centres (KCC),
Kisan Knowledge Management System (KKMS), Farmers Portal and M-Kisan Portal in
Maharashtra”
by Sangeeta Shroff
(II) Date of Receipt of the Draft Report: 15-12-2017
(III) Date of Dispatch of Comments: 28-02-2018
(IV) General Comments
There is frequently a significant information gap between the outside world and the farmers this often
seriously affects their decisions and perfomance. The extension service of the government used to
play an important role in bridging this gap but has become inadequate in the recent years. The Kisan
Call Centre (KCC) scheme is a recent major initiative of the government to try and bridge this
information gap using the vast telecommunication network. The performance of the agriculture sector
in Maharashtra is of significant importance for meeting food demand and raising rural incomes. The
present study has made a significant effort to evaluate the structure, functioning and effectiveness of
the KCC scheme in Maharashtra.
(V) Comments on Methodology and Analysis
1. The methodology followed is quite sound.
2. What is the rationale behind selecting the sample districts? Kindly mention some points.
3. In the Introduction, it would be useful to examine some call patterns in KCC. For e.g. Which
topics (Agriculture related) and crops constitute more of the calls? In which month the call
frequency is higher? Which district is higher in call frequency?
A. Centre Study (Chapter 3):
1. For Tables where Likert scales are used, it would good to show the values of the scale below
the Table. For example: Excellent=5, Good=4, Satisfactory=3, Somewhat poor=2, Very
Poor=1. It would help the reader to understand the meaning of numbers mentioned in the
tables.
2. Table 3.3, 3.6, 3.7, 3.8, 3.10, etc. - In the responses, what does no. 2 signify? If it is the
response of both the supervisors, then it would be good to indicate this in the Table below or
indicate 1 as 1st Supervisor, 2
nd Supervisors.

100
3. In Table 3.17- Question 2 „Queries not solved by colleagues are answered by Supervisors‟,
there appear to be conflicting answers. What can be the possible reason? Please check the
scale & data, if it is frequency.
4. In Table 3.18- Question 3 „Queries not solved by colleagues are answered by Supervisors‟,
there appear to be conflicting answers. What can be the possible reason? Which one is true?
5. In Table 3.18- Question 4 „Queries not solved by colleagues are answered by Supervisors‟,
there appear to be conflicting answers.. What can be the possible reason?
6. Please check for conflicting responses. It may create confusion for the readers.
B. FTA (Chapter 4):
1. Table 4.2- Last question- Average comes out to be 0.07. Please check.
2. Page No. 51- Last line- Please reword „‟Strongly Agreed or Disagreed‟‟ – it is confusing.
3. Table 4.22- Average Rating appears to have some error.
C. Farmer (Chapter 5):
1. In Table 5.9- There is no variation. It may be useful to check the data.
2. For Table 5.1, 5.2, 5.3, 5.4: It would be useful. if a few figures/graphs are made.
(VI) Comment on other issues
1. Page No. 2- 1st Paragraph-3
rd line- “along with” instead of alongwith.
2. Page No. 2- 1.2- Kisan Call Centre- Presently KCC runs on all holidays – please check.
3. Page No. 2- 3rd
Paragraph- Citation format can be changed and this could be included in
References.
4. Page No. 3- 1st Bullet point- „‟password‟‟ instead of pass word.
5. Page No. 4- 1st Paragraph- Citation format can be changed and it could be included in
references.
6. Page No. 6- Figure- Format of “source” can be changed.
7. Page No. 9- Last paragraph- Citation format can be changed and it could be included in
references.
8. Page No. 15- Last paragraph- 5th Line- There appears to be an incompelete word.
9. Page No. 16- 2.2 Title- „‟Services‟‟ instead of sevices.
10. In chapter 2, Table alignment can be improved.
11. Page No. 43- 2nd
Paragraph- 4th
line „‟keyboard‟‟ instead of key board.
12. Page No. 80- Last Paragraph- 3rd
line- check typo
13. Page No. 92- Point No. 17- 1st Line- „‟Questionnaire‟‟ instead of questionairree
14. Page No. 95- References- Few typos in 1st and 2
nd reference. Website reference can be
reformatted.
15. List of abbreviations used in the report can be added at the beginning of the report.
16. Few tables need to be aligned again. This could improve the quality of the Tables and the
Report.

101
(VII) Overall view on the acceptability of report:
The report has addressed the major questions & issues on the structure, functioning and performance
of the KCC scheme in Maharashtra. The report is acceptable and provides may useful insights about
the functioning of KCC in Maharashtra. If most of the above suggestions & comments made above
can be addressed, it will improve the quality of the report.
Action Taken
All the suggestions made have been incorporated in the Report.


![Benefit Segmentation-A Decision-Oriented Research Tool[1]](https://img.dokumen.tips/doc/110x75/577cbfc11a28aba7118dfca2/benefit-segmentation-a-decision-oriented-research-tool1.jpg)


