Embed Size (px)
Citation preview
Decision Analysis
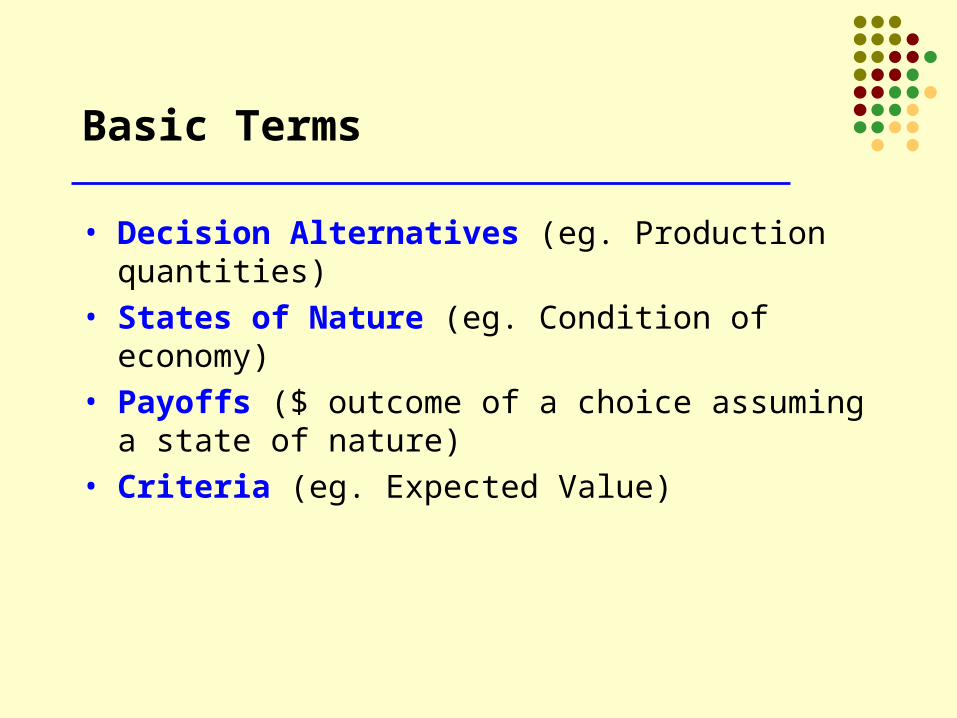
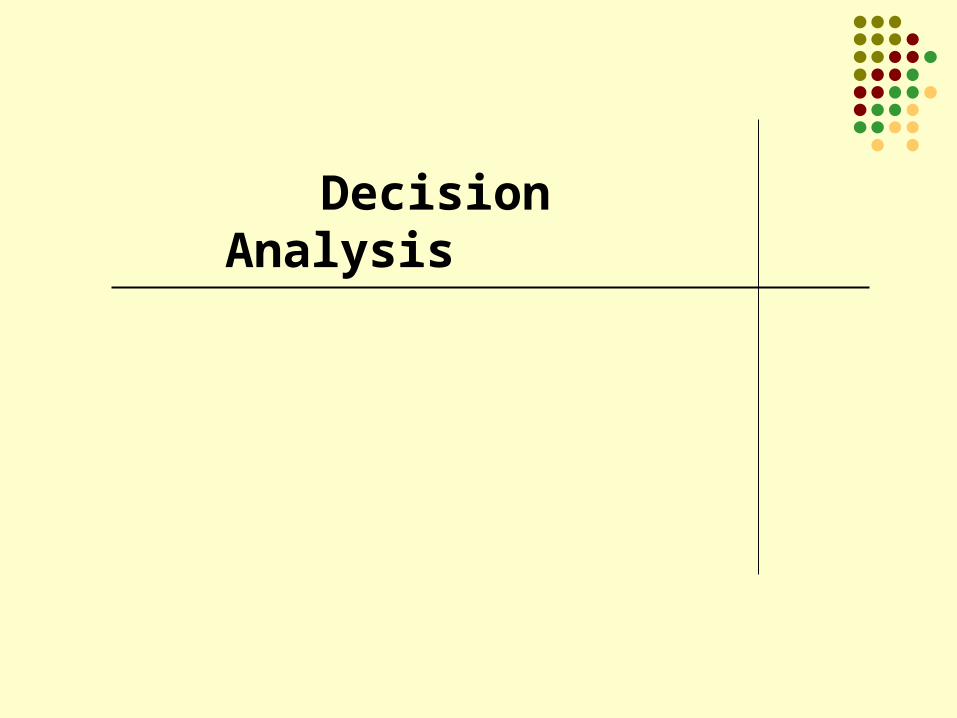
Basic Terms
• Decision Alternatives (eg. Production quantities)
• States of Nature (eg. Condition of economy)
• Payoffs ($ outcome of a choice assuming a state of nature)
• Criteria (eg. Expected Value)

What kinds of problems?
• Alternatives known
• States of Nature and their probabilities are known.
• Payoffs computable under different possible scenarios

Decision Environments
Ignorance – Probabilities of the states of nature are unknown, hence assumed equal
Risk / Uncertainty – Probabilities of states of nature are known
Certainty – It is known with certainty which state of nature will occur. Trivial problem.

Example – Decisions under Ignorance
Payoff Table
S1(Poor)
S2 (Avg)
S3(Good)
A1 (10 units) 300 350 400
A2 (20 units) -100 600 700
A3 (40 units) -1000 -200 1200
Assume the following payoffs in $ thousand for 3 alternatives – building 10, 20, or 40 condos. The payoffs depend on how many are sold, which depends on the economy. Three scenarios are considered - a Poor, Average, or Good economy at the time the
condos are completed.

Maximax - Risk Seeking Behavior
S1 S2 S3 MAXIMAX
A1 300 350 400 400
A2 -100 600 700 700
A3 -1000 -200 1200 1200
What would a risk seeker decide to do? Maximize payoff without regard for risk. In other words, use the MAXIMAX criterion. Find maximum payoff for each alternative, then the maximum of those.
The best alternative under this criterion is A3, with a potential payoff of 1200.
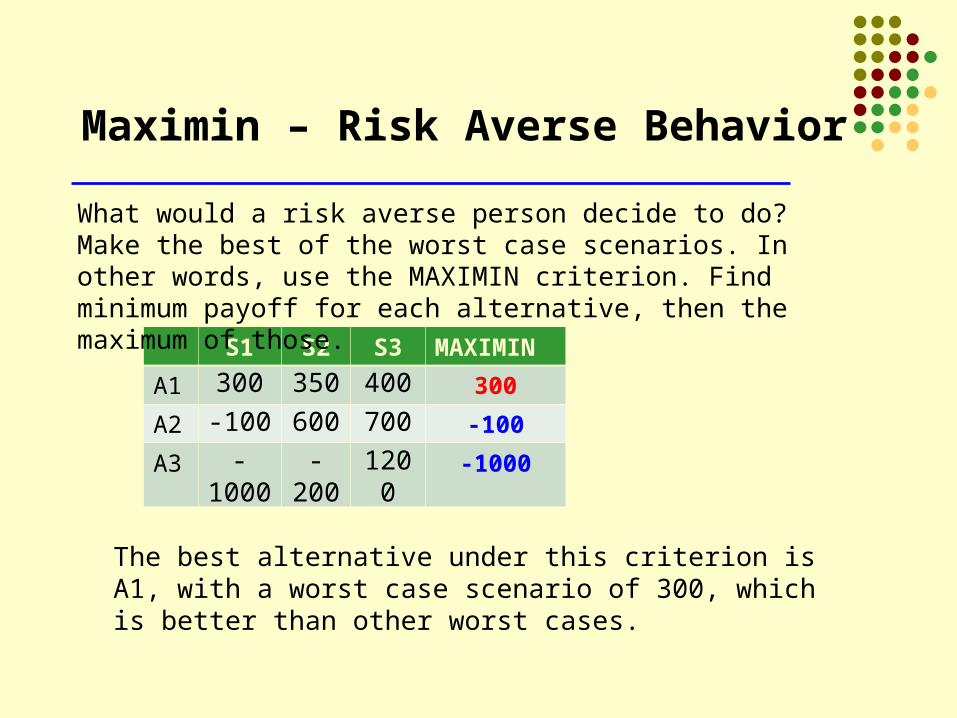
Maximin – Risk Averse Behavior
S1 S2 S3 MAXIMIN
A1 300 350 400 300
A2 -100 600 700 -100
A3 -1000 -200 1200 -1000
What would a risk averse person decide to do? Make the best of the worst case scenarios. In other words, use the MAXIMIN criterion. Find minimum payoff for each alternative, then the maximum of those.
The best alternative under this criterion is A1, with a worst case scenario of 300, which is better than other worst cases.

LaPlace – the Average
S1 S2 S3 LaPlace
A1 300 350 400 350
A2 -100 600 700 400
A3 -1000 -200 1200 0
What would a person somewhere in the middle of the two extremes choose to do? Take an average of the possible payoffs. In other words, use the LaPlace criterion (named after mathematician Pierre LaPlace). Find the average payoff for each alternative, then the maximum of those.
The best alternative under this criterion is A2, with an average payoff of 400, which is better than the other two averages.
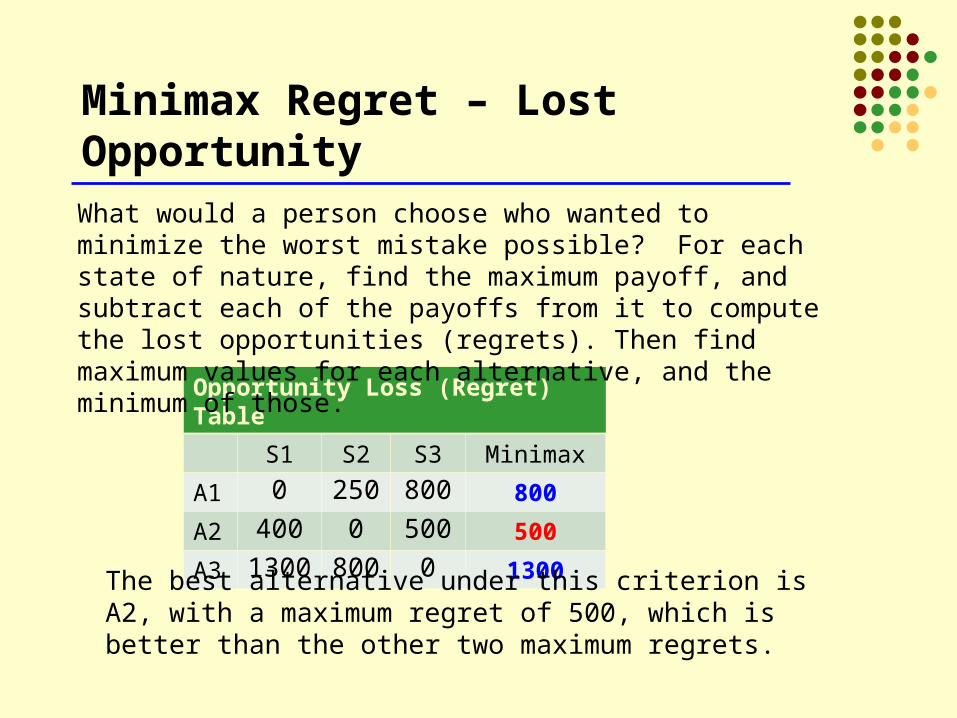
Minimax Regret – Lost Opportunity
Opportunity Loss (Regret) Table
S1 S2 S3 Minimax
A1 0 250 800 800
A2 400 0 500 500
A3 1300 800 0 1300
What would a person choose who wanted to minimize the worst mistake possible? For each state of nature, find the maximum payoff, and subtract each of the payoffs from it to compute the lost opportunities (regrets). Then find maximum values for each alternative, and the minimum of those.
The best alternative under this criterion is A2, with a maximum regret of 500, which is better than the other two maximum regrets.

Example – Decisions under Risk
S1(Poor)
S2 (Avg)
S3(Good)
A1 (100 units) 300 350 400
A2 (200 units) -100 600 700
A3 (400 units) -1000 -200 1200
Probabilities 0.30 0.60 0.10
Assume now that the probabilities of the states of nature are known, as shown below.

Expected Values
Payoff Table
S1 S2 S3 EV
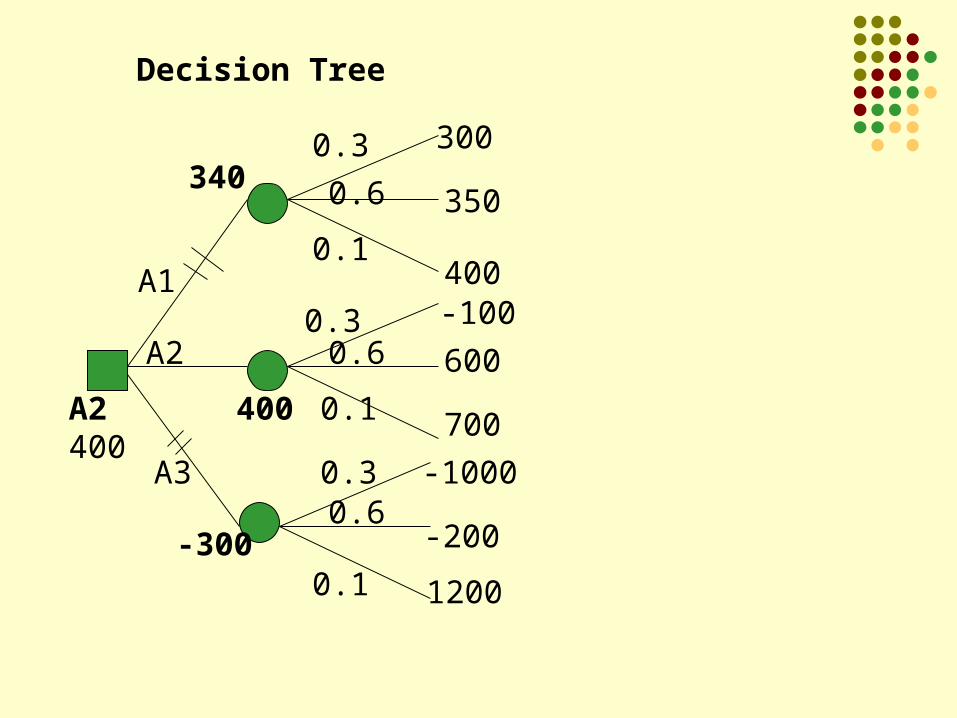
A1 300 350 400 340
A2 -100 600 700 400
A3 -1000 -200 1200 -300
Probabilities 0.30 0.60 0.10
When probabilities are known, compute a weighed average of payoffs, called the Expected Value, for each alternative and choose the maximum value.
The best alternative under this criterion is A2, with a maximum EV of 400, which is better than the other two EVs.

Expected Opportunity Loss (EOL)
Opportunity Loss (Regret) Table
S1 S2 S3 EOL
A1 0 250 800 230
A2 400 0 500 170
A3 1300 800 0 870
Probabilities 0.30 0.60 0.10
Compute the weighted average of the opportunity losses for each alternative to yield the EOL.
The best alternative under this criterion is A2, with a minimum EOL of 170, which is better than the other two EOLs.
Note that EV + EOL is constant for each alternative! Why?

EVUPI: EV with Perfect Information
S1(Poor)
S2 (Avg)
S3(Good)
A1 (100 units) 300 350 400
A2 (200 units) -100 600 700
A3 (400 units) -1000 -200 1200
Probabilities 0.30 0.60 0.10
If you knew everytime with certainty which state of nature was going to occur, you would choose the best alternative for each state of nature every time. Thus the EV would be the weighted average of the best value for each state. Take the best times the probability, and add them all.
300*0.3 = 90 600*0.6 = 360 1200*0.1 = 120_____________Sum = 570
Thus EVUPI = 570

EVPI: Value of Perfect Information
If someone offered you perfect information about which state of nature was going to occur, how much is that information worth to you in this decision context?
Since EVUPI is 570, and you could have made 400 in the long run (best EV without perfect information), the value of this additional information is 570 - 400 = 170.
Thus, EVPI = EVUPI – Evmax
= EOLmin
0.6 350
400-100
600
700
-1000
-200
1200
300
0.1
0.3
0.30.6
0.1
0.1
0.60.3
340
400
-300
A2400
A1
A2
A3
Decision Tree

Sequential Decisions
• Would you hire a consultant (or a psychic) to get more info about states of nature?
• How would additional info cause you to revise your probabilities of states of nature occuring?
• Draw a new tree depicting the complete problem.

Consultant’s Track Record
S1 S2 S3
Past Fav. 20 60 70
Forecast Unfav. 80 40 30
100 100 100
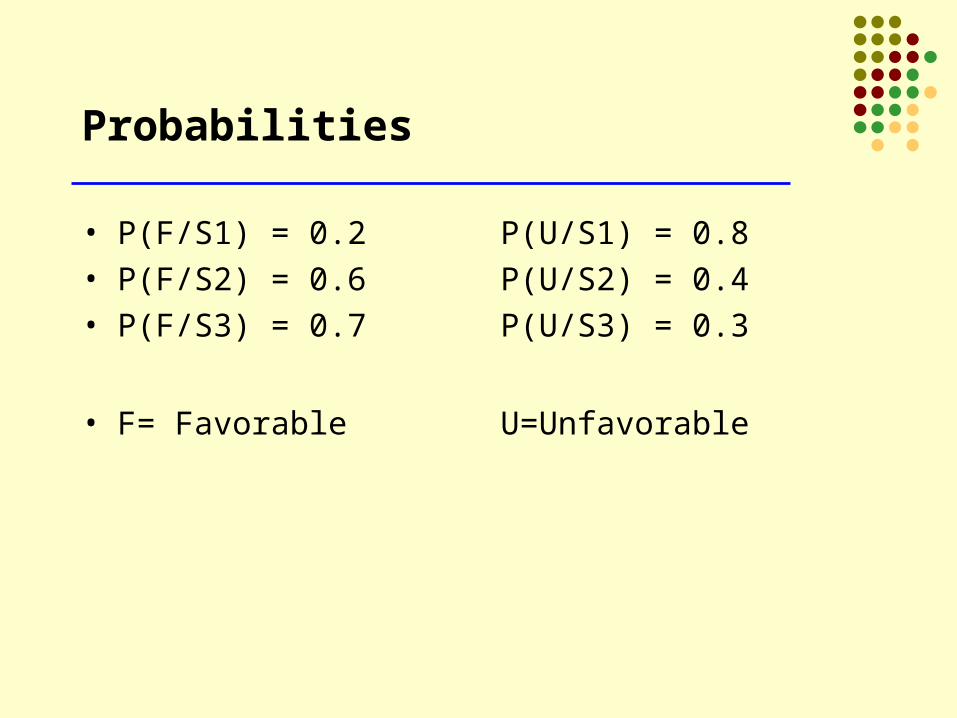
Probabilities
• P(F/S1) = 0.2 P(U/S1) = 0.8
• P(F/S2) = 0.6 P(U/S2) = 0.4
• P(F/S3) = 0.7 P(U/S3) = 0.3
• F= Favorable U=Unfavorable

Joint Probabilities
S1 S2 S3 Total
Fav. 0.06 0.36 0.07 .49
Unfav. 0.24 0.24 0.03 .51
PriorProbs
0.3 0.6 0.1 1.00
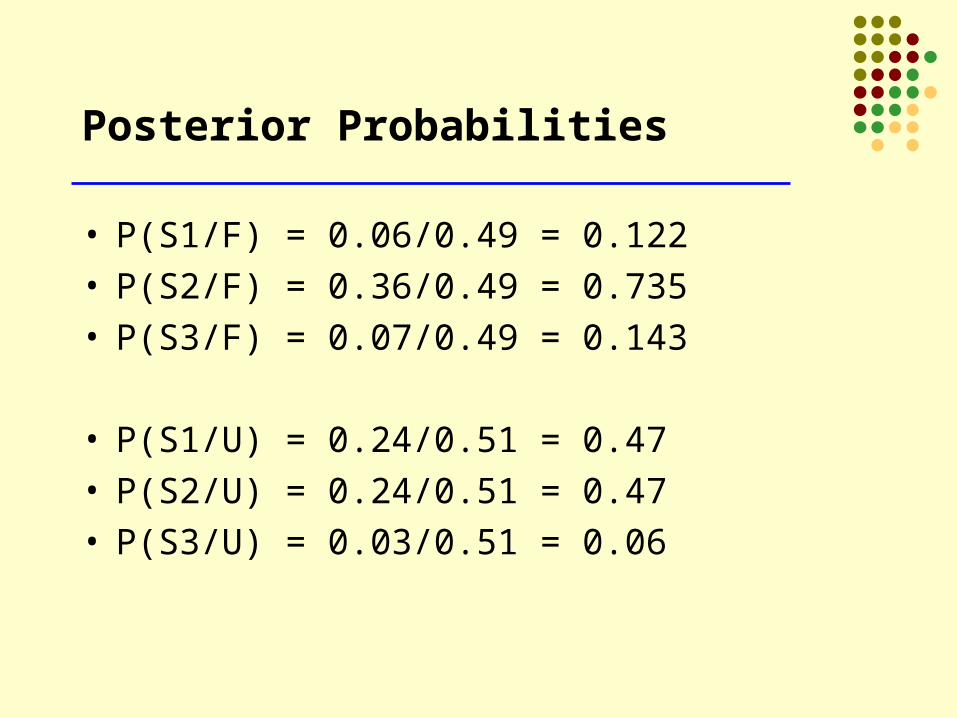
Posterior Probabilities
• P(S1/F) = 0.06/0.49 = 0.122• P(S2/F) = 0.36/0.49 = 0.735• P(S3/F) = 0.07/0.49 = 0.143
• P(S1/U) = 0.24/0.51 = 0.47• P(S2/U) = 0.24/0.51 = 0.47• P(S3/U) = 0.03/0.51 = 0.06
Solution
• Solve the decision tree using the posterior probabilities just computed.