Embed Size (px)
Citation preview

Chapter 6 Assessing Groundwater Potentiality
293 A WATERSHED APPROACH FOR SUSTAINABLE ECOSYSTEM MANAGEMENT OF MEENACHIL RIVER BASIN WITH EMPHASIS ON REMOTE SENSING AND GIS
DECIPHERING GROUNDWATER POTENTIAL ZONES IN SUBWATERSHEDS OF MEENACHIL RIVER BASIN
USING GEOSPATIAL TECHNOLOGY Objectives
1. To prepare various thematic layers such as drainage density, lineament density, slope,
lithology, geomorphology and landuse/land cover using SOI topographical maps, remote
sensing data and GIS.
2. To prioritize the weightages of individual themes and feature score depending upon their
suitability to hold groundwater.
3. To prepare the integrated final groundwater potential map (GPM) using the ‘Raster
Calculator’ option of spatial analyst
6.1 Introduction Groundwater is a vital natural resource for the reliable and economic provision of potable
water supply in both urban and rural environment. Hence it plays a fundamental role in
human well-beings, as well as that of some aquatic and terrestrial ecosystems. At present,
groundwater contributes around 34% of the total annual water supply and is an important
fresh water resource. So, an assessment for this resource is extremely significant for the
sustainable management of groundwater systems. GIS and remote sensing tools are
widely used for the management of various natural resources (Dar et al., 2010; Krishna
Kumar et al., 2011; Magesh et al., 2011a,b). Delineating the potential groundwater zones
using remote sensing and GIS is an effective tool. In recent years, extensive use of
satellite data along with conventional maps and rectified ground truth data has made it
easier to establish the base line information for groundwater potential zones (Tiwari and
Rai, 1996; Das et al., 1997; Thomas et al., 1999; Harinarayana et al., 2000; Muralidhar et
al., 2000; Chowdhury et al., 2010). Remote sensing not only provides a wide-range scale
Cha
pter
6

Chapter 6 Assessing Groundwater Potentiality
294 A WATERSHED APPROACH FOR SUSTAINABLE ECOSYSTEM MANAGEMENT OF MEENACHIL RIVER BASIN WITH EMPHASIS ON REMOTE SENSING AND GIS
of the space-time distribution of observations, but also saves time and money (Murthy,
2000; Leblanc et al., 2003; Tweed et al., 2007). In addition it is widely used to
characterize the earth surface (such as lineaments, drainage patterns and lithology) as
well as to examine the groundwater recharge zones (Sener et al., 2005).
In the study area, the groundwater forms the principal source of water for
domestic and drinking purpose and most of the people depend on dug/tube well for their
daily needs. Even though the study area receives high rainfall, the area experiences
severe dry condition in the summer seasons. At that time, the people in the area depends
on the rationed water supply of local administrative bodies. Besides this, rapid
urbanization, developmental activities and the increased population have lead to the
groundwater pollution and water table depletion. Therefore, the present study focuses on
the identification of groundwater potential zones in selected subwatersheds of Meenachil
River Basin (MRB) using the advanced technology of remote sensing and GIS for the
planning, utilization, administration, and management of groundwater resources.
6.2 Review of literature Groundwater is a valuable dynamic and renewable natural resource in present day and
limited in extent. Groundwater resource assessment of a region involves a detailed study
of the sub-surfacewater, including geology and hydrogeology, monitoring and record of
well data. Exploitation and utilization of groundwater requires proper understanding of its
origin, occurrence and movement, are directly or indirectly controlled by terrain
characteristics (Khan and Moharana, 2002). Groundwater occurrence being subsurface
phenomenon, its identification and location is based on indirect analysis of some directly
observable terrain features. The interpretation of satellite data in conjunction with
sufficient ground real information makes it possible to identify and outline various
ground features such as geological structures, geomorphic features and their hydraulic
characters (Srinivas Rao et al., 2000); and these may serve as direct or indirect indicators
of the presence of groundwater (Ravindran and Jeyaram, 1997; Sree Devi et al., 2001;
Gopinath and Saralathan, 2004).

Chapter 6 Assessing Groundwater Potentiality
295 A WATERSHED APPROACH FOR SUSTAINABLE ECOSYSTEM MANAGEMENT OF MEENACHIL RIVER BASIN WITH EMPHASIS ON REMOTE SENSING AND GIS
Geophysical methods are conventionally employed for groundwater prospecting
though there are several methodologies to locate and map the occurrence and distribution
of groundwater.
The identification and location of groundwater resources using remote sensing
data is based on an indirect analysis of some directly observable terrain features like
geomorphology, geology, slope, landuse/land cover and hydrologic characteristics. With
the capabilities of the remotely sensed data and GIS techniques, numerous databases can
be integrated to produce conceptual model for delineation and evaluation of groundwater
potential zones of an area (Chaterjee and Bhattacharya, 1995; Krishnamurthy and
Srinivas, 1995; Srivasthava and Bhattacharya, 2000; Taylor and Howard, 2000; Sarkar et
al., 2001; Prasad, et al., 2008).
The geographic information system (GIS) has emerged as an effective tool for
handling spatial data and decision making in several areas including engineering, geology
and environmental fields. Remotely sensed data are one of the main sources for providing
information on land and water related subjects (Brunner et al., 2007; Jha et al., 2007). A
review of GIS applications in hydrology and water management has been presented by
several researchers during mid nineties and recently such as El-Kadi et al. (1994),
Kamaraju et al. (1995), Krishnamurthy et al. (1996), Gogu et al. (2001), Sikdar et al.
(2004), Dawoud et al. (2005), Vittala et al. (2005), Solomon and Quiel (2006), Leblanc et
al. (2007), Münch and Conrad (2007), Vijith (2007), These reviews indicate that GIS
applications in hydrology and water management are essentially in a modeling dominated
context.
In the recent years digital technique is used to integrate various data to delineate
not only groundwater potential zone but also solve other problems related to
groundwater. These various data are prepared in the form of thematic map using
geographical information system (GIS) software tool. These thematic maps are then
integrated using ‘‘Spatial Analyst’’ tool. The ‘‘Spatial Analyst’’ tool with mathematical
and Boolyan operators is then used to develop model depending on objective of problem
at hand, such as delineation of groundwater potential zones.

Chapter 6 Assessing Groundwater Potentiality
296 A WATERSHED APPROACH FOR SUSTAINABLE ECOSYSTEM MANAGEMENT OF MEENACHIL RIVER BASIN WITH EMPHASIS ON REMOTE SENSING AND GIS
In recent years, many workers such as Shahid and Nath (1999), Goyal et al.
(1999), and Saraf and Choudhary (1998) have used the approach of remote sensing and
GIS for groundwater exploration and identification of artificial recharge sites. Jaiswal et
al. (2003) have used the GIS technique for generation of groundwater prospect zones
towards rural development. Murthy (2000), Obi et al. (2000), and Pratap et al. (2000)
have used GIS to delineate groundwater potential zone. Srinivasa and Jugran (2003) have
applied GIS for processing and interpretation of groundwater quality data. GIS has also
been considered for multicriteria analysis in resource evaluation. Shahid et al. (2000),
Boutt et al. (2001) and Jacob et al. (1999) have carried out groundwater modeling
through the use of GIS. Mohammed et al. (2003) have carried out
hydrogeomorphological mapping using remote sensing techniques for water resource
management around palaeochannels. GIS has been applied to groundwater potential
modeling by Rokade et al. (2007).
6.3 Materials and methods In the present study, Survey of India (SOI) toposheets (58C/9, 58C/10, 58C/11, 58C/13
and 58C/14) of scale 1:50,000; geocoded IRS P6 LISS III images (P100/R67) acquired
on 19th February 2004 and geocoded IRS - Linear Imaging Self Scanning Sensor (LISS-
III) 2007 image with a resolution of 22.5 meter covering Kottayam area; geological map
(1:2,50,000 scale), published by Geological Survey of India and field data were used for
the preparation of desired themes. The thematic layers prepared include geomorphology,
lithology, slope and landuse/ land cover of the area. Geographic Information System
(ArcGIS 9.3) was used for the preparation of thematic layers.

Chapter 6 Assessing Groundwater Potentiality
297 A WATERSHED APPROACH FOR SUSTAINABLE ECOSYSTEM MANAGEMENT OF MEENACHIL RIVER BASIN WITH EMPHASIS ON REMOTE SENSING AND GIS
Table 6.1: Theme weightages and feature class score assigned by multi criteria evaluation (MCE) technique
Theme Weightage (%) Feature Class Score
Geomorphology 20
Denudational Hills 2 Flood Plain 5 Lower Plateau Lateritic 3 Piedmont 3 Residual Hills 2 Structural Valley 1 Structural Hills 1 Valley 4 Valley fill 3 Valley flat 4 Pediment 3 Residual Hill Complex 2 Residual Mound 1
Geology 10
Biotite gneiss 4 Charnockite 5 Dolerite 1 Granite 3 Pyroxene granulite 1 Quartzite 2
Slope 35
1-8o 5
9-15o 4
16-25o 3
26-35o 2
>45o 1
Landuse 5
Grassland 3 Mixed vegetation 2 Paddy fields 5 River 5 Barren Rock 1 Rubber plantation 2 Settlement 1 Tea plantation 2 Settlement with mixed crops 2 Fallow land 4 Palm/coconut 2

Chapter 6 Assessing Groundwater Potentiality
298 A WATERSHED APPROACH FOR SUSTAINABLE ECOSYSTEM MANAGEMENT OF MEENACHIL RIVER BASIN WITH EMPHASIS ON REMOTE SENSING AND GIS
Drainage density 5
Very low 1 Low 2 Medium 3 High 4 Very high 5
Lineament density 25
Very low 1 Low 2 Medium 3 High 4 Very high 5
The weightages of individual themes and feature score were fixed and added to
each layers depending on their suitability to hold groundwater (Table 6.1). This process
involves raster overlay analysis and is known as multi criteria evaluation techniques
(MCE). Of several methods available for determining interclass/ inter-map dependency, a
probability weighted approach has been adopted that allows a linear combination of
probability weights of each thematic map and different categories of derived thematic
maps have been assigned scores, by assessing the importance of it in groundwater
occurrence. The maximum value is given to the feature with highest groundwater
potentiality and the minimum being to the lowest potential feature. The procedure of
weighted linear combination dominates in raster based GIS software systems. After
assigning the weightages and scores to the themes and features, all the themes were
converted to raster format using ‘Spatial analyst’, extension of ArcInfo ArcGIS software.
While converting to raster, the scores assigned to the individual features were taken in the
value field. Then, the individual themes were normalized by dividing theme weightages
by 100. The ‘Raster Calculator’ option of spatial analyst was used to prepare the
integrated final groundwater potential map (GPM) of the area. The map algebra (ESRI
2007), used in the raster calculator is (Eq. 1),
GPM = (Slope) × 0.35 + (Lineament density) × 0.25+ (Geomorphology) × 0.20 +
(Geology) × 0.10 + (Drainage density) × 0.05 + (Landuse) × 0.05
(1)
The procedure of the groundwater recharge zoning is illustrated in Fig. 6.2.

Chapter 6 Assessing Groundwater Potentiality
299 A WATERSHED APPROACH FOR SUSTAINABLE ECOSYSTEM MANAGEMENT OF MEENACHIL RIVER BASIN WITH EMPHASIS ON REMOTE SENSING AND GIS
Fig. 6.1: Flowchart for delineating groundwater potential zones using integrated remote sensing and GIS techniques
Preparation of Recharge Zone Map
Delineation of Groundwater Recharge Zones
Integration of Thematic Layers
Categorization and Weight Assignment
Generation of Thematic Layers in GIS (Lithology, Geomorphology, Slope, Drainage Density, Lineament density, Landuse)
Drainage density
Lineament density
Landuse Lineament Drainage Slope Geomorphology Lithology
SOI Toposheet GSI Map
Remote Sensing Conventional Maps/Existing Maps

Chapter 6 Assessing Groundwater Potentiality
300 A WATERSHED APPROACH FOR SUSTAINABLE ECOSYSTEM MANAGEMENT OF MEENACHIL RIVER BASIN WITH EMPHASIS ON REMOTE SENSING AND GIS
Major effect Minor effect
Fig. 6.2: Schematic sketch showing the interactive influence of factors concerning recharge property (modified from Shaban et
al., 2006)
Drainage density
Lineament density
Landuse/ land cover
Slope Lithology
Geomorphology

Chapter 6 Assessing Groundwater Potentiality
301 A WATERSHED APPROACH FOR SUSTAINABLE ECOSYSTEM MANAGEMENT OF MEENACHIL RIVER BASIN WITH EMPHASIS ON REMOTE SENSING AND GIS
6.3.1 Interrelationships between the factors of the groundwater recharge potential
There might be interactions between the factors of groundwater recharge. This study used
five factors of groundwater recharge potential, namely lithology, landuse/cover,
lineaments, drainage, and slope. A plot of the interrelationship between these factors is
shown in Fig. 6.2. Figure 6.2 illustrates the primary and secondary interrelationships
among the factors. Each relationship is weighted according to its strength. The
representative weight of a factor of the recharge potential is the sum of all weights from
each factor. A factor with a higher weight value shows a larger impact on groundwater
recharge.
6.4 Results and discussion 6.4.1 Kattachira subwatershed (W1)
Thematic layers
Geomorphology
In the present study, the geomorphological map was prepared based on specific tone,
texture, size, shape and association characteristics of remotely sensed data and significant
geomorphic units were identified and delineated viz., valley fill, lower lateritic plateau
and flood plain (Fig. 6.3). Floodplain deposits occur mainly along the stream channels in
the eastern part of the study area and comprise chiefly poorly sorted to well-sorted clay,
silty clay, loam, clayey silt and silt containing scattered granules and pebbles along with
moderately to well-stratified loam, sandy loam or fine sand. Valley-fill deposits are
generally unconsolidated alluvial and colluvial materials consisting of sand, silt, gravels,
pebbles, etc., deposited along the floor of a stream valley. This type of landform is mostly
present along the major river systems of the study area with a width of 3–4 km. Laterites
are iron-rich duricrusts which have formed directly from the breakdown of materials in
their immediate vicinity, and so do not contain any readily identifiable allochthonous
component, whereas, ferricretes are duricrusts which incorporate materials non-
indigenous to the immediate locality (Widdowson, 2003). Table-lands is a general term
for a flat elevated region. Lateritic plateaus are also popularly known as rock outcrops,

Chapter 6 Assessing Groundwater Potentiality
302 A WATERSHED APPROACH FOR SUSTAINABLE ECOSYSTEM MANAGEMENT OF MEENACHIL RIVER BASIN WITH EMPHASIS ON REMOTE SENSING AND GIS
i.e., habitats where portions of freely exposed bedrocks protrude above the soil level due
to natural reasons (Watve, 2009).
Flood plains and valley fills are comprised of charnockites and mostly covered
with paddy fields. About 75% of the study area is falling under the lower plateau lateritic
geomorphologic feature. This region has dense lineaments. It is moderate to suitable for
groundwater occurrence.
Lithology
Kattachira subwatershed comprises of charnockite, dolerite, magnetite-quartzite and
quartzite (Fig. 6.4). The flood plain with dolerite consists of thick deposits of alluvium
with high water holding capacity. Valley fills with dolerite consists of loose and
unconsolidated materials, indicating recharge zone. Flood plains with charnockite come
under the suitable category. Loose unconsolidated fill materials add more water to the
valley fills with charnockite. Casings are required in the case of dug wells.
Drainage density
Drainage density is defined as the closeness of spacing of stream channels. It is a measure
of the total length of the stream segment of all orders per unit area. The drainage density
is an inverse function of permeability. The less permeable a rock is, the less the
infiltration of rainfall, which conversely tends to be concentrated in surface runoff.
Drainage density measurements range from 0 to 2.01 km km-2. The drainage density map
for the study area is shown in Fig. 6.5. Based on the drainage density of the micro-basins,
it can be grouped into three classes: (1) 0–0.75 km km-2, (2) 0.75–1.5 km km-2 and (3)
1.5–2.5 km km-2 as illustrated in Fig. 6.5. Accordingly, these classes have been assigned
to ‘good,’ ‘moderate’ and ‘poor’ categories, respectively. High drainage density is
recorded in the eastern parts of the study area (Fig. 6.5). The high drainage density area
indicates low-infiltration rate whereas the low-density areas are favourable with high
infiltration rate.

Chapter 6 Assessing Groundwater Potentiality
303 A WATERSHED APPROACH FOR SUSTAINABLE ECOSYSTEM MANAGEMENT OF MEENACHIL RIVER BASIN WITH EMPHASIS ON REMOTE SENSING AND GIS
Fig. 6.3: Thematic layer of geomorphology Kattachira subwatershed (Ajaykumar, 2010)

Chapter 6 Assessing Groundwater Potentiality
304 A WATERSHED APPROACH FOR SUSTAINABLE ECOSYSTEM MANAGEMENT OF MEENACHIL RIVER BASIN WITH EMPHASIS ON REMOTE SENSING AND GIS
Fig. 6.4: Thematic layer of lithology Kattachira subwatershed (Ajaykumar, 2010)

Chapter 6 Assessing Groundwater Potentiality
305 A WATERSHED APPROACH FOR SUSTAINABLE ECOSYSTEM MANAGEMENT OF MEENACHIL RIVER BASIN WITH EMPHASIS ON REMOTE SENSING AND GIS
Fig. 6.5: Drainage density map Kattachira subwatershed

Chapter 6 Assessing Groundwater Potentiality
306 A WATERSHED APPROACH FOR SUSTAINABLE ECOSYSTEM MANAGEMENT OF MEENACHIL RIVER BASIN WITH EMPHASIS ON REMOTE SENSING AND GIS
Lineament density
Lineaments like joints, fractures and faults are hydrogeologically very important and may
provide the pathways for groundwater movement (Sankar, 2002). Presence of lineaments
may act as a conduit for ground water movement which results in increased secondary
porosity and therefore, can serve as groundwater prospective zone. The extension of large
lineaments representing a shear zone or a major fault can extend subsurface from hilly
terrain to alluvial terrain. It may form a productive groundwater reserve. Similarly
intersection of lineaments can also be the probable sites of groundwater accumulation.
Therefore, areas with high lineament density may have important groundwater prospects
even in hilly regions which otherwise have nil groundwater prospects. In Kattachira
subwatershed, regions with high lineament density, less drainage density, flood plains
and valley fills with charnockite served as suitable regions for groundwater exploration
(Fig. 6.6).
Slope
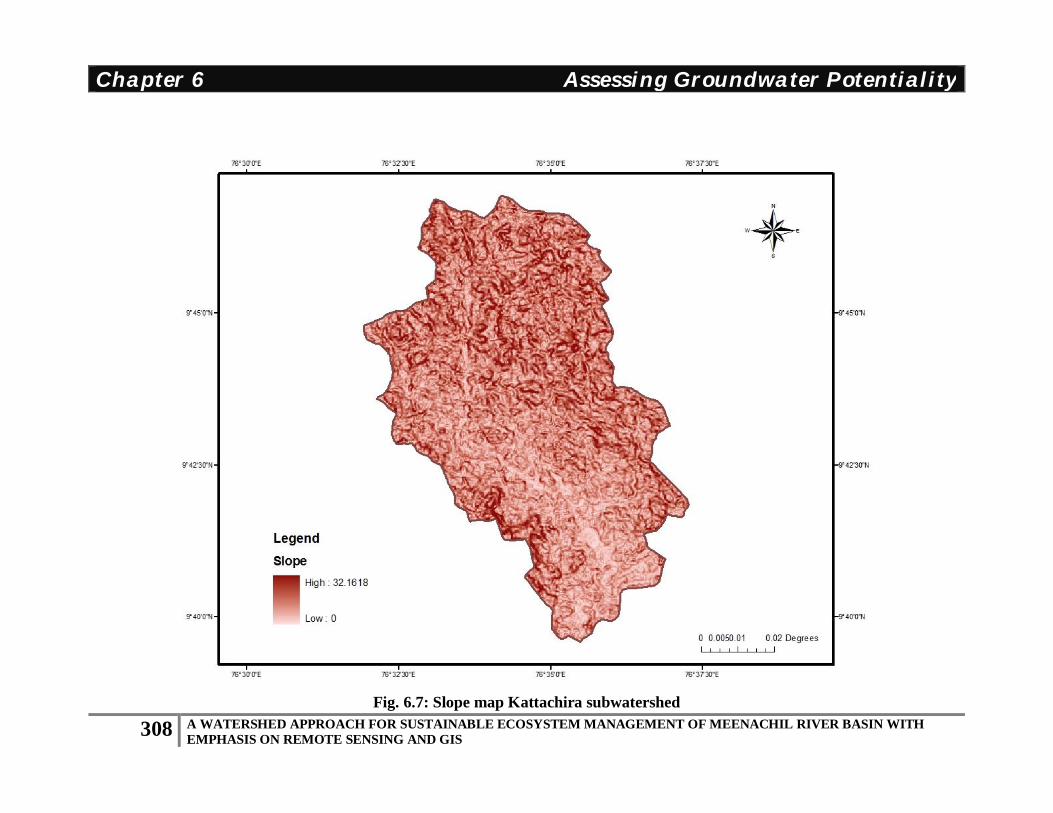
A slope map prepared from the Survey of India toposheets of the study area is shown in
Fig. 6.7. The identified slope category varies from 1o to >35o in the study area and are
classified into five classes like, 0–8o (gentle slope), 9–15o (moderate slope), 16–25o
(pronounced slope), 26–35o (steep slope) and >35o (very steep slope) (Figure 6.7).
Based on the slope, the study area can be divided into five slope classes. The
areas having 0-8o slope fall into the ‘very good’ category because of the nearly flat terrain
and relatively high infiltration rate. The areas with 9o -15o slope are considered as ‘good’
for groundwater storage due to slightly undulating topography with some runoff. The
areas having a slope of 16o–25o are categorized as ‘moderate’. The areas having a slope
of 26–35o cause relatively high runoff and low infiltration, and hence are categorized as
‘poor’ and areas having a slope >27o are considered as ‘very poor’ due to higher slope
and runoff.

Chapter 6 Assessing Groundwater Potentiality
307 A WATERSHED APPROACH FOR SUSTAINABLE ECOSYSTEM MANAGEMENT OF MEENACHIL RIVER BASIN WITH EMPHASIS ON REMOTE SENSING AND GIS
Fig. 6.6: Lineament density map Kattachira subwatershed
Chapter 6 Assessing Groundwater Potentiality
308 A WATERSHED APPROACH FOR SUSTAINABLE ECOSYSTEM MANAGEMENT OF MEENACHIL RIVER BASIN WITH EMPHASIS ON REMOTE SENSING AND GIS
Fig. 6.7: Slope map Kattachira subwatershed

Chapter 6 Assessing Groundwater Potentiality
309 A WATERSHED APPROACH FOR SUSTAINABLE ECOSYSTEM MANAGEMENT OF MEENACHIL RIVER BASIN WITH EMPHASIS ON REMOTE SENSING AND GIS
Landuse/land cover
The identified landuse/land cover features from the IRS imagery of the study area
are agricultural land (palm, rubber and tea plantations, paddy fields and cropland), waste
land (land with or without scrub and barren rocky area), water bodies (river), mixed
vegetation, grasslands and built-up land. Out of the total area, >85 % is falling under
rubber plantation. From figure 6.8, it is clear that about >70 % come under the category
of suitable (value 2) groundwater potential, whereas 20% shows the potential value of 4
(less suitable) (Fig. 6.9). Very few areas are covered by the values of 3 (good to very
good) and 5 (poor to very poor).
6.4.2 Koduvan subwatershed (W2)
Thematic layers
Geomorphology
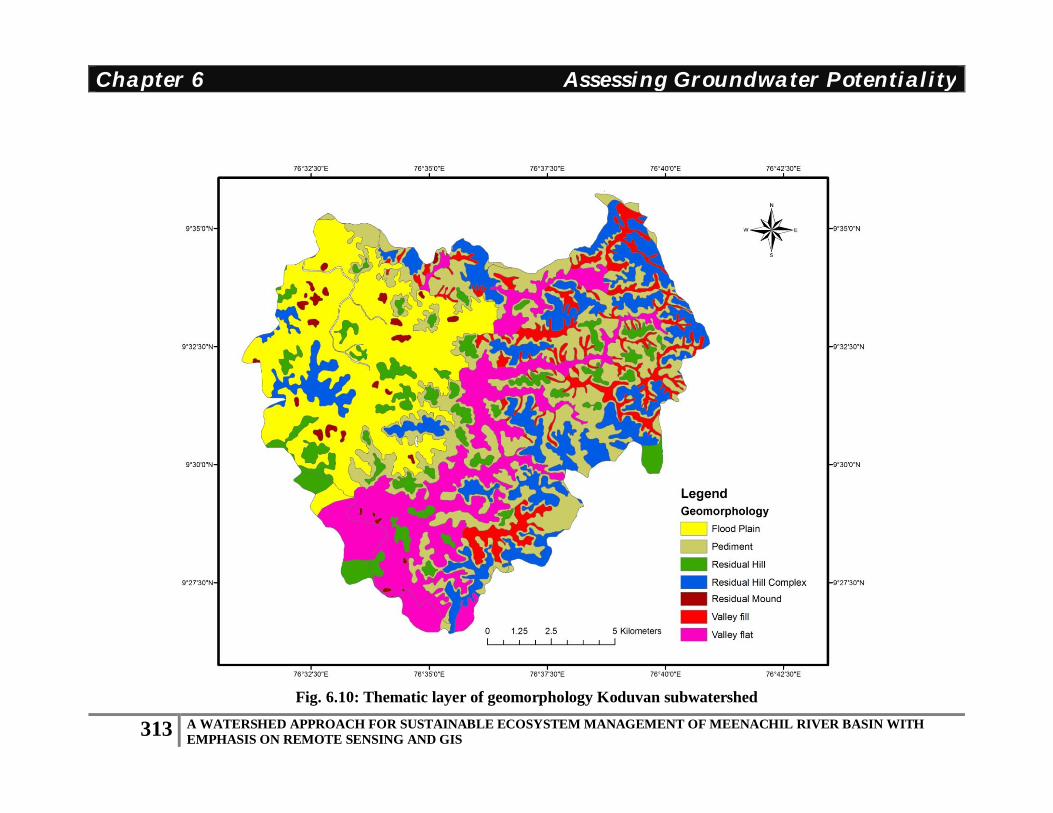
Geomorphological mapping involves the identification and characterization of the
fundamental units of landscape. The underlying lithology, slope and the type of existing
drainage pattern influences the genesis and processes of different geomorphic units. The
significant geomorphic units identified based on their image characteristics include
residual hill complex, residual hill, residual mound, pediment, valley fills, valley flat,
flood plain and alluvial plain (NRSA, 2000; Soman, 2002). The eastern part of the study
area covered by residual hill complex where as residual hill spread over the central and
eastern part of the study area. Residual hills are the end products of the process of
pediplanation, which reduces the original mountain masses in to a series of scattered
knolls standing on the pediplains (Thornbury, 1990). The residual hills are identified in
the imageries grey tone and coarse texture in black and which images and dark reddish
colour in standard false colour composite with radial drainage pattern. Groundwater
potentiality is found to be poor in the areas. The isolated relief projections, residual
mounds are scattered in western and central part of the study area. In between the hills, a
significant area is covered by pediments. Being subjected to stream actions, the land
forms are interspersed with well defined narrow and flat valleys by the deposition of

Chapter 6 Assessing Groundwater Potentiality
310 A WATERSHED APPROACH FOR SUSTAINABLE ECOSYSTEM MANAGEMENT OF MEENACHIL RIVER BASIN WITH EMPHASIS ON REMOTE SENSING AND GIS
unconsolidated sediments (valley fills and valley flat). The central part of the area was
covered by valley flat. The flat land surface, flood plain by lateral erosion, characterized
by thin cover of alluvium composed mostly of sand and silt and is exposed at western and
central part of the study area (Fig. 6.10).
Lithology
Geologically, the study area has been divided in to two classes; Precambrian formations
and recent formations. Even though majority of the study area covered by Precambrian
formation (Charnockite), the western part of the area under recent formation (Sandy silty
alluvium). There are nine rock types identified in the area and are, sandy silty alluvium,
laterite, lignite gritty sandstone, pegmatite and quartzveins, garnet biotite gneiss,
cordierite gneiss, charnockite, quartz feldspar and quartzite. The predominant rock types,
charnockite and sandy silty alluvium are found in the central and western part of the
study area (Fig. 6.11).
Drainage density
The drainage pattern of any terrain reflects the characteristics of surface as well as
subsurface information. The drainage density (in terms of km/km2) indicates the
closeness of spacing of channels. More the drainage density, higher would be the run-off.
Thus drainage density characterizes the run-off in the area or, in the other words, the
quantum of rainwater that could have infiltered. Hence lesser the drainage density, higher
is the probability of recharge or potential groundwater zones (Fig. 6.12). The drainage
density in the area has been calculated as 1.87 km/km2.
Lineament density
The lineaments and fractures present in the area shows a general trend of NNW-NNE
(Fig. 6.13).

Chapter 6 Assessing Groundwater Potentiality
311 A WATERSHED APPROACH FOR SUSTAINABLE ECOSYSTEM MANAGEMENT OF MEENACHIL RIVER BASIN WITH EMPHASIS ON REMOTE SENSING AND GIS
Fig. 6.8: Landuse map Kattachira subwatershed

Chapter 6 Assessing Groundwater Potentiality
312 A WATERSHED APPROACH FOR SUSTAINABLE ECOSYSTEM MANAGEMENT OF MEENACHIL RIVER BASIN WITH EMPHASIS ON REMOTE SENSING AND GIS
Fig. 6.9: Groundwater potential zone map Kattachira subwatershed
Chapter 6 Assessing Groundwater Potentiality
313 A WATERSHED APPROACH FOR SUSTAINABLE ECOSYSTEM MANAGEMENT OF MEENACHIL RIVER BASIN WITH EMPHASIS ON REMOTE SENSING AND GIS
Fig. 6.10: Thematic layer of geomorphology Koduvan subwatershed

Chapter 6 Assessing Groundwater Potentiality
314 A WATERSHED APPROACH FOR SUSTAINABLE ECOSYSTEM MANAGEMENT OF MEENACHIL RIVER BASIN WITH EMPHASIS ON REMOTE SENSING AND GIS
Fig. 6.11: Thematic layer of lithology Koduvan subwatershed

Chapter 6 Assessing Groundwater Potentiality
315 A WATERSHED APPROACH FOR SUSTAINABLE ECOSYSTEM MANAGEMENT OF MEENACHIL RIVER BASIN WITH EMPHASIS ON REMOTE SENSING AND GIS
Fig. 6.12: Drainage density map Koduvan subwatershed

Chapter 6 Assessing Groundwater Potentiality
316 A WATERSHED APPROACH FOR SUSTAINABLE ECOSYSTEM MANAGEMENT OF MEENACHIL RIVER BASIN WITH EMPHASIS ON REMOTE SENSING AND GIS
Fig. 6.13: Lineament density map Koduvan subwatershed

Chapter 6 Assessing Groundwater Potentiality
317 A WATERSHED APPROACH FOR SUSTAINABLE ECOSYSTEM MANAGEMENT OF MEENACHIL RIVER BASIN WITH EMPHASIS ON REMOTE SENSING AND GIS
Slope
For the generation of slope, the digital elevation modelling (DEM) has done by
the interpolation of contours, which in turn digitized from SOI toposheets using ArcGIS.
DEM is a digital representation of continuous variation of topographic surface with the
elevation or ground height above any geodetic datum. The generated DEM is used for
generation of slope using ‘3D analyst’ an extension tool of ArcGIS. This helps for
appreciating, the terrain and a supporting factor for the slope analysis. A slope map
prepared from the Survey of India toposheets of the study area is shown in Fig. 6.14. The
slope analyses have been carried out in the subwatershed level and are divided into five
classes according to groundwater holding capacity. The integrated potential zone map
indicate that, alluvial plain, flood plain, with sandy silty alluvium, coastal sand and
brown sand with gentle slope (0–7o) having excellent potentiality. Valley flat, valley fills
with lignite gritty sandstone, sandy silty alluvium with a slope (8–15o) are coming under
very good potential zones. The other areas come under good, moderate and poor has
covered with residual hill complex, residual hill and residual mound etc (Fig. 6.16).
Landuse/Land cover
Realizing the importance of landuse/ land cover in groundwater potentiality, landuse/
land cover map was prepared using geocoded IRS P6 LISS III (P100/R67) images
acquired on 19th February 2004 and IRS LISS-III data acquired in 2007 and field data.
The various landuse/ land cover classes delineated by employing the standard methods of
visual interpretation and the identified features includes, paddy field, fallowland,
settlements/mixed crop, rubber plantation, palm/coconut, settlements and water body
(Fig. 6.15). In this, majority of the area was used for rubber plantation followed by paddy
fields. In some areas, paddy fields are reclaimed and are used for other mixed crop
cultivation.

Chapter 6 Assessing Groundwater Potentiality
318 A WATERSHED APPROACH FOR SUSTAINABLE ECOSYSTEM MANAGEMENT OF MEENACHIL RIVER BASIN WITH EMPHASIS ON REMOTE SENSING AND GIS
Fig. 6.14: Slope map Koduvan subwatershed

Chapter 6 Assessing Groundwater Potentiality
319 A WATERSHED APPROACH FOR SUSTAINABLE ECOSYSTEM MANAGEMENT OF MEENACHIL RIVER BASIN WITH EMPHASIS ON REMOTE SENSING AND GIS
Fig. 6.15: Landuse map Koduvan subwatershed

Chapter 6 Assessing Groundwater Potentiality
320 A WATERSHED APPROACH FOR SUSTAINABLE ECOSYSTEM MANAGEMENT OF MEENACHIL RIVER BASIN WITH EMPHASIS ON REMOTE SENSING AND GIS
Fig. 6.16: Groundwater potential zone map Koduvan subwatershed
Chapter 6 Assessing Groundwater Potentiality
321 A WATERSHED APPROACH FOR SUSTAINABLE ECOSYSTEM MANAGEMENT OF MEENACHIL RIVER BASIN WITH EMPHASIS ON REMOTE SENSING AND GIS
6.4.3 Mannani subwatershed (W3)
Thematic layers
Geomorphology
Valley fills are linear depressions present in between the hill ranges and occupy the
lowest reaches in topography, commonly filled with pebbles, cobbles, gravel, sand, silt,
and other detrital material. The groundwater potential ranges from moderate to good.
These valleys are developed along the fractures and such places can be exploited for
groundwater through deep bores. In general, it is observed that adequate recharge source
of groundwater is met within valley fillings. Valley fills in the study area occupy the
central portion. In such places, the groundwater is considered to be moderately better
with adequate source of water. This has very good porosity and permeability but
sometimes the presence of clay may make it impermeable.
Flood plains and valley fills are comprised of charnockites and mostly covered
with paddy fields. About 80% of the study area is falling under the lower plateau lateritic
geomorphologic feature (Fig. 6.17). This region has dense lineaments. It is moderate to
suitable for groundwater occurrence. Mannani subwatershed, slope class of 0-32o,
geomorphological units such as residual mound, settlement/mixed crop area of
landuse/land cover units and geology with charnockite rocks make the zone less suitable
(Fig. 6.23).
Lithology
Mannani subwatershed 92.4% of the total area is covered by precambian formations,
mainly charnockite followed by intrusive rocks such as dolerite and gabbro (Fig. 6.18).
Drainage density
The drainage density in the area has been calculated after digitization of the entire
drainage pattern and shown in Fig. 6.19. The subwatershed experiences a maximum of
2.83 km km-2. The high drainage density area indicates low-infiltration rate whereas the
low-density areas are favourable with high infiltration rate

Chapter 6 Assessing Groundwater Potentiality
322 A WATERSHED APPROACH FOR SUSTAINABLE ECOSYSTEM MANAGEMENT OF MEENACHIL RIVER BASIN WITH EMPHASIS ON REMOTE SENSING AND GIS
Fig. 6.17: Thematic layer of geomorphology Mannani subwatershed (Ajaykumar, 2010)

Chapter 6 Assessing Groundwater Potentiality
323 A WATERSHED APPROACH FOR SUSTAINABLE ECOSYSTEM MANAGEMENT OF MEENACHIL RIVER BASIN WITH EMPHASIS ON REMOTE SENSING AND GIS
Fig. 6.18: Thematic layer of lithology Mannani subwatershed (Ajaykumar, 2010)

Chapter 6 Assessing Groundwater Potentiality
324 A WATERSHED APPROACH FOR SUSTAINABLE ECOSYSTEM MANAGEMENT OF MEENACHIL RIVER BASIN WITH EMPHASIS ON REMOTE SENSING AND GIS
Fig. 6.19: Drainage density map Mannani subwatershed

Chapter 6 Assessing Groundwater Potentiality
325 A WATERSHED APPROACH FOR SUSTAINABLE ECOSYSTEM MANAGEMENT OF MEENACHIL RIVER BASIN WITH EMPHASIS ON REMOTE SENSING AND GIS
Lineament density
In the study area, slope and lineaments play a significant role in groundwater potentiality.
Lineaments, particularly joints, fracture and their intersection enhances the potential of
hydrogeomorphic units. Areas with high lineament density are good for groundwater
development (Figure 6.20).
Slope
A slope map prepared from the Survey of India toposheets of the study area is shown in
Fig. 6.21. The identified slope category varies from 1o to >35o in the study area and are
classified into five classes like, 0–8o (gentle slope), 9–15o (moderate slope), 16–25o
(pronounced slope), 26–35o (steep slope) and >35o (very steep slope) (Figure 6.21).
Based on the slope, the study area can be divided into five slope classes. The
areas having 0-8o slope fall into the ‘very good’ category because of the nearly flat terrain
and relatively high infiltration rate. The areas with 9o -15o slope are considered as ‘good’
for groundwater storage due to slightly undulating topography with some runoff. The
areas having a slope of 16o–25o are categorized as ‘moderate’. The areas having a slope
of 26–35o cause relatively high runoff and low infiltration, and hence are categorized as
‘poor’ and areas having a slope >27o are considered as ‘very poor’ due to higher slope
and runoff.
Landuse/land cover
The identified landuse/land cover features from the IRS imagery of the study area fallow
land, settlements, settlement/mixed crops, rubber plantations and river channel (Figure
6.22). Out of the total area, >85 % is falling under rubber plantation. From figure 6.23, it
is clear that about >70 % come under the category of suitable (value 2) groundwater
potential, whereas 28% shows the potential value of 3 (good to very good).

Chapter 6 Assessing Groundwater Potentiality
326 A WATERSHED APPROACH FOR SUSTAINABLE ECOSYSTEM MANAGEMENT OF MEENACHIL RIVER BASIN WITH EMPHASIS ON REMOTE SENSING AND GIS
Fig. 6.20: Lineament density map Mannani subwatershed

Chapter 6 Assessing Groundwater Potentiality
327 A WATERSHED APPROACH FOR SUSTAINABLE ECOSYSTEM MANAGEMENT OF MEENACHIL RIVER BASIN WITH EMPHASIS ON REMOTE SENSING AND GIS
Fig. 6.21: Slope map Mannani subwatershed

Chapter 6 Assessing Groundwater Potentiality
328 A WATERSHED APPROACH FOR SUSTAINABLE ECOSYSTEM MANAGEMENT OF MEENACHIL RIVER BASIN WITH EMPHASIS ON REMOTE SENSING AND GIS
Fig. 6.22: Landuse map Mannani subwatershed

Chapter 6 Assessing Groundwater Potentiality
329 A WATERSHED APPROACH FOR SUSTAINABLE ECOSYSTEM MANAGEMENT OF MEENACHIL RIVER BASIN WITH EMPHASIS ON REMOTE SENSING AND GIS
Fig. 6.23: Groundwater potential zone map Mannani subwatershed

Chapter 6 Assessing Groundwater Potentiality
330 A WATERSHED APPROACH FOR SUSTAINABLE ECOSYSTEM MANAGEMENT OF MEENACHIL RIVER BASIN WITH EMPHASIS ON REMOTE SENSING AND GIS
6.4.4 Payappara subwatershed (W4)
Thematic layers
Geomorphology
Topography is an important indicator of groundwater conditions in crystalline rock
terrains (Davis and De Wiest, 1966). The geomorphic imprints can be considered as
surface indicators for identification of subsurface water conditions. This information
provides a reliable base for effective planning, development and management of
groundwater resources of an area. The MRB has a dominant rocky terrain where the
upland region is manifested by hills and undulating surfaces and the low land region form
a gently undulating plain. Eight distinct geomorphologic units have been identified and
delineated from the study area (Fig. 6.24); include structural hills, residual hills,
denudational hills, lower plateau lateritic (LPL), LPL valley, piedmont, flood plain and
valley. These distinct geomorphic features are resulted from the complexity of
geomorphic evolution. The distribution and extent of these geomorphic zones are varying
from place to place.
The upstream regions of the subwatershed are mainly characterized by the
structural and denudational hills. The structural hills are controlled with complex folding,
faulting and criss-crossed by numerous joints which facilitate some infiltration and
mostly act as null off zones. The denudational hills are marked by sharp to blunt crest
lines with rugged tops indicating that the surface runoff at the upper reaches of the hills
has caused hill erosion.
The slope of the hills ranges more than 50 degree. Denudational hills are
comprised of charnockites and mostly covered with rubber plantations.
Residual hills are described as isolated hills. These are found as an isolated patch
western part of the study area. The groundwater prospect in this zone is also described as
moderate. Floodplain deposits occur mainly along the stream channels in the southern
part of the study area. Valley deposits are generally unconsolidated alluvial and colluvial
materials consisting of sand, silt, gravels, pebbles, etc., deposited along the floor of a

Chapter 6 Assessing Groundwater Potentiality
331 A WATERSHED APPROACH FOR SUSTAINABLE ECOSYSTEM MANAGEMENT OF MEENACHIL RIVER BASIN WITH EMPHASIS ON REMOTE SENSING AND GIS
stream valley. This type of landform is mostly present along the major river systems of
the study area with a width of 3–4 km. These units are characterized by the high porosity
and permeability resulting in high infiltration rate. These geomorphic units are moderate
to highly suitable potential zones. About 80% of the study area is falling under the lower
plateau lateritic geomorphologic feature. This region has dense lineaments. It is moderate
to suitable for groundwater occurrence.
Lithology
Of course, the lithologic character of the exposed rocks is significant in governing
recharge. Some studies neglected this factor once they use the lineament and drainage
(El-Shazly et al., 1983; Edet et al., 1998). This is because they consider the lineaments
and drainage characters as a function of primary and secondary porosity, thus providing
information on the lithology. But others (Salman, 1983; El-Baz and Hamida, 1995)
incorporate the lithology factor because of its strong influence on water percolation. In
this paper, the lithology is used to serve confirming and supporting assessment of
recharge factors. This will tend to minimize erroneous interpretations that may result
from using lineaments and drainage factors alone.
The area forms part of the Precambrian granulite terrain and it is traversed by
intrusives of later age (Fig. 6.25). The main rock types of the area belong to Charnockite
Group of Archaean age. This group includes charnockite and pyroxene granulite. The
quartzite belong to Khondalite group of Archaean age, biotite gneiss belongs to
Migmatite complex of Archaean. NNW – SSE and NW – SE trending numerous dolerite
and gabbro intrusions belong to Basic intrusives of Mesocainozoic age are the main
attractions regarding the petrology of the area (Ajaykumar, 2010). Numerous dolerite and
gabbro dykes trending NW-SE traverse the older basement rocks in the central and
eastern parts. A prominent gabbro dyke extends from north to south with a NNW – SSE
trend.

Chapter 6 Assessing Groundwater Potentiality
332 A WATERSHED APPROACH FOR SUSTAINABLE ECOSYSTEM MANAGEMENT OF MEENACHIL RIVER BASIN WITH EMPHASIS ON REMOTE SENSING AND GIS
Fig. 6.24: Thematic layer of geomorphology Payappara subwatershed (Ajaykumar, 2010)

Chapter 6 Assessing Groundwater Potentiality
333 A WATERSHED APPROACH FOR SUSTAINABLE ECOSYSTEM MANAGEMENT OF MEENACHIL RIVER BASIN WITH EMPHASIS ON REMOTE SENSING AND GIS
Fig. 6.25: Thematic layer of lithology Payappara subwatershed (Ajaykumar, 2010)

Chapter 6 Assessing Groundwater Potentiality
334 A WATERSHED APPROACH FOR SUSTAINABLE ECOSYSTEM MANAGEMENT OF MEENACHIL RIVER BASIN WITH EMPHASIS ON REMOTE SENSING AND GIS
Drainage density
The drainage pattern of any terrain reflects the characteristics of surface as well as
subsurface information. The drainage density (in terms of km/km2) indicates the
closeness of spacing of channels. More the drainage density, higher would be the run-off.
Thus drainage density characterizes the run-off in the area or, in the other words, the
quantum of rainwater that could have infiltered. Hence lesser the drainage density, higher
is the probability of recharge or potential groundwater zones. Drainage density
measurements range from 0 to 1.69 km km-2. The drainage density map for the study area
is shown in Fig. 6.26. Based on the drainage density of the micro-basins, it can be
grouped into three classes: (1) 0–0.75 km km-2, (2) 0.75–1.5 km km-2 and (3) 1.5–2.5 km
km-2 as illustrated in Fig. 6.26. Accordingly, these classes have been assigned to ‘good,’
‘moderate’ and ‘poor’ categories, respectively. High drainage density is recorded in the
southern parts of the study area (Fig. 6.26). The high drainage density area indicates low-
infiltration rate whereas the low-density areas are favourable with high infiltration rate.
Lineament density
Sabins (2000) have defined lineaments as extended mappable linear or curvilinear
features of a surface whose parts align in straight or nearly straight relationships that may
be the expression of folds, fractures, or faults in the subsurface. Several sets of
lineaments have been identified from the imageries of the study area of Payappara
subwatershed (Fig 6.27). Areas with such high lineament density usually host high-
yielding aquifers especially at the zones of intersection. Nair (1990) has identified five
major sets of lineaments in Kerala as a whole, but the most dominant trends in the study
area are NNW-SSE, NW-SE and ESE-WNW. The lineaments can be correlated with the
fractures and joints in the rocks of the area. The Payappara subwatershed is very much
within an area marked by historic as well as recent low-intensity seismicity. The river
courses follow the lineament trends and the NNW-SSE lineaments cut across E-W
trending course of Meenachil River. The shifts north and south from the E-W trend of
Meenachil river could be due to the shifts along the later NNW-SSE lineaments
(Rajendran et al., 2009).

Chapter 6 Assessing Groundwater Potentiality
335 A WATERSHED APPROACH FOR SUSTAINABLE ECOSYSTEM MANAGEMENT OF MEENACHIL RIVER BASIN WITH EMPHASIS ON REMOTE SENSING AND GIS
Fig. 6.26: Drainage density map Payappara subwatershed

Chapter 6 Assessing Groundwater Potentiality
336 A WATERSHED APPROACH FOR SUSTAINABLE ECOSYSTEM MANAGEMENT OF MEENACHIL RIVER BASIN WITH EMPHASIS ON REMOTE SENSING AND GIS
Fig. 6.27: Lineament density map Payappara subwatershed

Chapter 6 Assessing Groundwater Potentiality
337 A WATERSHED APPROACH FOR SUSTAINABLE ECOSYSTEM MANAGEMENT OF MEENACHIL RIVER BASIN WITH EMPHASIS ON REMOTE SENSING AND GIS
Although lineaments have been identified throughout the area, it is the lineaments
in the Lower plateau lateritic (LPL) which is considered significant from groundwater
occurrence point of view. Those across the denudational hills (DH), residual hills (RH)
and high-slope area or in the area occupied by clay zones are of less significance as there
could be high runoff along them and these may act only as conduit to transmit infiltrated
rain water.
Slope
Slope is an important factor for the identification of groundwater potential zones. Higher
degree of slope results in rapid runoff and increased erosion rate with feeble recharge
potential (Magesh et al., 2011a & b). A slope map prepared from the Survey of India
toposheets of the study area is shown in Fig. 6.28. The identified slope category varies
from 1o to >35o in the study area and are classified into five classes like, 0–8o (gentle
slope), 9–15o (moderate slope), 16–25o (pronounced slope), 26–35o (steep slope) and
>35o (very steep slope).
Based on the slope, the study area can be divided into five slope classes. The
areas having 0-8o slope fall into the ‘very good’ category because of the nearly flat terrain
and relatively high infiltration rate. The areas with 9o -15o slope are considered as ‘good’
for groundwater storage due to slightly undulating topography with some runoff. The
areas having a slope of 16o–25o are categorized as ‘moderate’. The areas having a slope
of 26–35o cause relatively high runoff and low infiltration, and hence are categorized as
‘poor’ and areas having a slope >27o are considered as ‘very poor’ due to higher slope
and runoff.
Landuse/land cover
Land cover/land use is a significant factor affecting the recharge process. This factor
involves a number of elements but the major ones are the soil deposits, human
settlements and vegetation cover. The major effect of soil deposits on water percolation
into the subsurface media is attributed to its clayey content, as it controls the retention
capacity of water. It is usually related to the terrain slope. Their geographic distribution in

Chapter 6 Assessing Groundwater Potentiality
338 A WATERSHED APPROACH FOR SUSTAINABLE ECOSYSTEM MANAGEMENT OF MEENACHIL RIVER BASIN WITH EMPHASIS ON REMOTE SENSING AND GIS
the study area is obviously different. Isolated thin soil deposits can be found in the
mountainous regions, while thick and well-developed soil deposits are located on
relatively flat areas. However, thick accumulations of soil deposits reduce the rate of
water percolation. The human settlement has a definite role in retarding the recharge
process. Man-made constructions, such as concrete embankments, buildings, roads, etc.
create a compacted terrain that seals the ground surface, thus preventing water to
recharge easily (Bou Kheir et al., 2003). Vegetation cover can be considered as an
enhancing one, notably in the humid tropical climate. In this respect, the higher the
vegetation cover, the higher the evapotranspiration rate and this implies less chance for
percolation to the subsurface layers. But the density of the cover has to be considered as
well as its geographic extent. Nevertheless, these processes are contradictory. First, the
biochemical disruption of the terrain surfaces, whether it is soil or rock, by the roots and
organisms. Second is that the vegetal cover helps in confining the water under the vegetal
zone (in an umbrella scheme), therefore preventing water from direct evaporation. The
third is the ability of plants to hold soil in place rather than to erode with an increase in
water runoff. In summary, it can be assumed that the vegetation cover is an effective
factor in the enhancement of recharge rate.
The identified landuse/land cover features from the IRS imagery of the study area
are agricultural land (palm, rubber and tea plantations, paddy fields and cropland), waste
land (land with or without scrub and barren rocky area), water bodies (river), mixed
vegetation, grasslands and built-up land. Out of the total area, >85 % is falling under
rubber plantation. From figure 6.29, it is clear that about >70 % come under the category
of suitable (value 2) groundwater potential, whereas 20% shows the potential value of 4
(less suitable) (Fig. 6.30). Very few areas are covered by the values of 3 (good to very
good) and 5 (poor to very poor).

Chapter 6 Assessing Groundwater Potentiality
339 A WATERSHED APPROACH FOR SUSTAINABLE ECOSYSTEM MANAGEMENT OF MEENACHIL RIVER BASIN WITH EMPHASIS ON REMOTE SENSING AND GIS
Fig. 6.28: Slope map Payappara subwatershed

Chapter 6 Assessing Groundwater Potentiality
340 A WATERSHED APPROACH FOR SUSTAINABLE ECOSYSTEM MANAGEMENT OF MEENACHIL RIVER BASIN WITH EMPHASIS ON REMOTE SENSING AND GIS
Fig. 6.29: Landuse map Payappara subwatershed

Chapter 6 Assessing Groundwater Potentiality
341 A WATERSHED APPROACH FOR SUSTAINABLE ECOSYSTEM MANAGEMENT OF MEENACHIL RIVER BASIN WITH EMPHASIS ON REMOTE SENSING AND GIS
Fig. 6.30: Groundwater potential zone map Payappara subwatershed

Chapter 6 Assessing Groundwater Potentiality
342 A WATERSHED APPROACH FOR SUSTAINABLE ECOSYSTEM MANAGEMENT OF MEENACHIL RIVER BASIN WITH EMPHASIS ON REMOTE SENSING AND GIS
6.4.5 Thikovil subwatershed (W5)
Thematic layers
Geomorphology
The study area has a dominant rocky terrain, which is manifested by hills and undulating
surfaces. Nine distinct geomorphologic units have been identified and delineated from the
study area (Fig. 6.31); include structural hills, structural valley, residual mounds,
denudational hills, lower plateau lateritic, piedmont, flood plain and valley. These distinct
geomorphic features are resulted from the complexity of geomorphic evolution. The
distribution and extent of these geomorphic zones are varying from place to place.
Floodplain deposits occur mainly along the stream channels in the southern and eastern
part of the study area. Valley-fill deposits are generally unconsolidated alluvial and
colluvial materials consisting of sand, silt, gravels, pebbles, etc., deposited along the floor
of a stream valley. This type of landform is mostly present along the major river systems
of the study area with a width of 3–4 km. Except for the eastern portion where mainly
floodplain deposit and valley-fill deposit types of geomorphologic features predominate.
These units are characterized by the high porosity and permeability resulting in high
infiltration rate. The geomorphic units such as valley fill and valley flat are good to
excellent potential zones. The upstream regions of Thikovil subwatershed are mainly
characterized by the structural and denudational hills. The structural hills are controlled
with complex folding, faulting and criss-crossed by numerous joints which facilitate
some infiltration and mostly act as null off zones. These hills are structurally controlled
with complex folding, faulting and criss-crossed by numerous joints/fractures, which
facilitate some infiltration and mostly act as run off zones. These units are found to be at
northwestern parts of the study area. The slope of the hills ranges more than 3 degree.
The denudational hills are marked by sharp to blunt crest lines with rugged tops
indicating that the surface runoff at the upper reaches of the hills has caused hill erosion.
The most dominant geomorphic unit in the basin is denudational slopes which cover
more than 40% of the total area. The residual mounds are mainly concentrated in the
midstream to downstream regions. Among various geomorphic units, structural hill,

Chapter 6 Assessing Groundwater Potentiality
343 A WATERSHED APPROACH FOR SUSTAINABLE ECOSYSTEM MANAGEMENT OF MEENACHIL RIVER BASIN WITH EMPHASIS ON REMOTE SENSING AND GIS
denudational hill, lateritic upland and residual mound are considered as moderate to poor
potential zones.
Lithology
Of course, the lithologic character of the exposed rocks is significant in governing
recharge. Some studies neglected this factor once they use the lineament and drainage
(El-Shazly, et al., 1983; Edet et al., 1998). This is because they consider the lineaments
and drainage characters as a function of primary and secondary porosity, thus providing
information on the lithology. But others (Salman, 1983; El-Baz and Hamida, 1995)
incorporate the lithology factor because of its strong influence on water percolation. In
this paper, the lithology is used to serve confirming and supporting assessment of
recharge factors. This will tend to minimize erroneous interpretations that may result
from using lineaments and drainage factors alone.
The area forms part of the Precambrian granulite terrain and it is traversed by
intrusives of later age (Fig. 6.32). The main rock types of the area belong to Charnockite
Group of Archaean age. This group includes charnockite and pyroxene granulite. The
quartzite belong to Khondalite group of Archaean age, biotite gneiss belongs to
Migmatite complex of Archaean age and granite belongs to Acid intrusives of
Proterozoic age are also present in the basin. NNW – SSE and NW – SE trending
numerous dolerite and gabbro intrusions belong to Basic intrusives of Mesocainozoic age
are the main attractions regarding the petrology of the area (Ajaykumar 2010).
Drainage density
The drainage density is an inverse function of permeability. The less permeable a rock is,
the less the infiltration of rainfall, which conversely tends to be concentrated in surface
runoff. This gives rise to a well-developed and fine drainage system. Since the drainage
density can indirectly indicate the suitability for groundwater recharge of an area because
of its relation with surface runoff and permeability, it was considered as one of the
indicators of artificial groundwater recharge. Drainage density measurements range from
0.5 to 2.62 km km-2. The drainage density map for the study area is shown in Fig. 6.33.
Chapter 6 Assessing Groundwater Potentiality
344 A WATERSHED APPROACH FOR SUSTAINABLE ECOSYSTEM MANAGEMENT OF MEENACHIL RIVER BASIN WITH EMPHASIS ON REMOTE SENSING AND GIS
Based on the drainage density of the micro-basins, it can be grouped into three classes:
(1) 0–0.75 km km-2, (2) 0.75–1.5 km km-2 and (3) 1.5–2.62 km km-2 as illustrated in Fig.
6. Accordingly, these classes have been assigned to ‘good,’ ‘moderate’ and ‘poor’
categories, respectively. Most of the study area (90%) has a drainage density of 0.75–1.5
km km-2. High drainage density is recorded in the north and eastern parts of the study
area (Fig. 6.33).
Lineament density
Sabins (2000) have defined lineaments as extended mappable linear or curvilinear
features of a surface whose parts align in straight or nearly straight relationships that may
be the expression of folds, fractures, or faults in the subsurface. Several sets of
lineaments have been identified from the imageries of the study area of Thikovil subbasin
(Fig 6.34). Areas with such high lineament density usually host high-yielding aquifers
especially at the zones of intersection. Nair (1990) has identified five major sets of
lineaments in Kerala as a whole, but the most dominant trends in the study area are
NNW-SSE, NW-SE and ESE-WNW. The lineaments can be correlated with the fractures
and joints in the rocks of the area. The Thikovil subwatershed is very much within an
area marked by historic as well as recent low-intensity seismicity. The river courses
follow the lineament trends and the NNW-SSE lineaments cut across E-W trending
course of Meenachil River. The shifts north and south from the E-W trend of Meenachil
river could be due to the shifts along the later NNW-SSE lineaments (Rajendran et al.,
2009).
Although lineaments have been identified throughout the area, it is the lineaments
in the valley fill (VF) which is considered significant from groundwater occurrence point
of view. Those across the denudational hills (DH), residual hills (RH), in the high-
drainage density and high-slope area or in the area occupied by clay zones are of less
significance as there could be high runoff along them and these may act only as conduit
to transmit infiltrated rain water.

Chapter 6 Assessing Groundwater Potentiality
345 A WATERSHED APPROACH FOR SUSTAINABLE ECOSYSTEM MANAGEMENT OF MEENACHIL RIVER BASIN WITH EMPHASIS ON REMOTE SENSING AND GIS
Fig. 6.31: Thematic layer of geomorphology Thikovil subwatershed (Ajaykumar, 2010)

Chapter 6 Assessing Groundwater Potentiality
346 A WATERSHED APPROACH FOR SUSTAINABLE ECOSYSTEM MANAGEMENT OF MEENACHIL RIVER BASIN WITH EMPHASIS ON REMOTE SENSING AND GIS
Fig. 6.32: Thematic layer of lithology Thikovil subwatershed (Ajaykumar, 2010)

Chapter 6 Assessing Groundwater Potentiality
347 A WATERSHED APPROACH FOR SUSTAINABLE ECOSYSTEM MANAGEMENT OF MEENACHIL RIVER BASIN WITH EMPHASIS ON REMOTE SENSING AND GIS
Fig. 6.33: Drainage density map Thikovil subwatershed

Chapter 6 Assessing Groundwater Potentiality
348 A WATERSHED APPROACH FOR SUSTAINABLE ECOSYSTEM MANAGEMENT OF MEENACHIL RIVER BASIN WITH EMPHASIS ON REMOTE SENSING AND GIS
Fig. 6.34: Lineament density map Thikovil subwatershed

Chapter 6 Assessing Groundwater Potentiality
349 A WATERSHED APPROACH FOR SUSTAINABLE ECOSYSTEM MANAGEMENT OF MEENACHIL RIVER BASIN WITH EMPHASIS ON REMOTE SENSING AND GIS
Slope
Slope is an important factor for the identification of groundwater potential zones. Higher
degree of slope results in rapid runoff and increased erosion rate with feeble recharge
potential (Magesh et al., 2011a & b). A slope map prepared from the Survey of India
toposheets of the study area is shown in Fig. 6. The identified slope category varies from
1o to >35o in the study area and are classified into five classes like, 0–8o (gentle slope), 9–
15o (moderate slope), 16–25o (pronounced slope), 26–35o (steep slope) and >35o (very
steep slope) (Figure 6.35).
Based on the slope, the study area can be divided into five slope classes. The
areas having 0-8o slope fall into the ‘very good’ category because of the nearly flat terrain
and relatively high infiltration rate. The areas with 9o -15o slope are considered as ‘good’
for groundwater storage due to slightly undulating topography with some runoff. The
areas having a slope of 16o–25o are categorized as ‘moderate’. The areas having a slope
of 26–35o cause relatively high runoff and low infiltration, and hence are categorized as
‘poor’ and areas having a slope >27o are considered as ‘very poor’ due to higher slope
and runoff.
Landuse/land cover
Landuse/land cover is an important factor in groundwater recharge. It includes the type of
soil deposits, the distribution of residential areas, and vegetation cover. Shaban et al.
(2006) concluded that vegetation cover benefits groundwater recharge in the following
ways. (1) Biological decomposition of the roots helps loosen the rock and soil, so that
water can percolate to the surface of the earth easily. (2) Vegetation prevents direct
evaporation of water from soil. (3) The roots of a plant can absorb water, thus preventing
water loss. Leduc et al. (2001) estimated the difference in the amount of groundwater
recharge due to changes of land utilization and vegetation from changes in the
groundwater level. Land use/cover was included in this study as an important factor
affecting the groundwater recharge process.

Chapter 6 Assessing Groundwater Potentiality
350 A WATERSHED APPROACH FOR SUSTAINABLE ECOSYSTEM MANAGEMENT OF MEENACHIL RIVER BASIN WITH EMPHASIS ON REMOTE SENSING AND GIS
Fig. 6.35: Slope map Thikovil subwatershed

Chapter 6 Assessing Groundwater Potentiality
351 A WATERSHED APPROACH FOR SUSTAINABLE ECOSYSTEM MANAGEMENT OF MEENACHIL RIVER BASIN WITH EMPHASIS ON REMOTE SENSING AND GIS
Fig. 6.36: Landuse map Thikovil subwatershed
Chapter 6 Assessing Groundwater Potentiality
352 A WATERSHED APPROACH FOR SUSTAINABLE ECOSYSTEM MANAGEMENT OF MEENACHIL RIVER BASIN WITH EMPHASIS ON REMOTE SENSING AND GIS
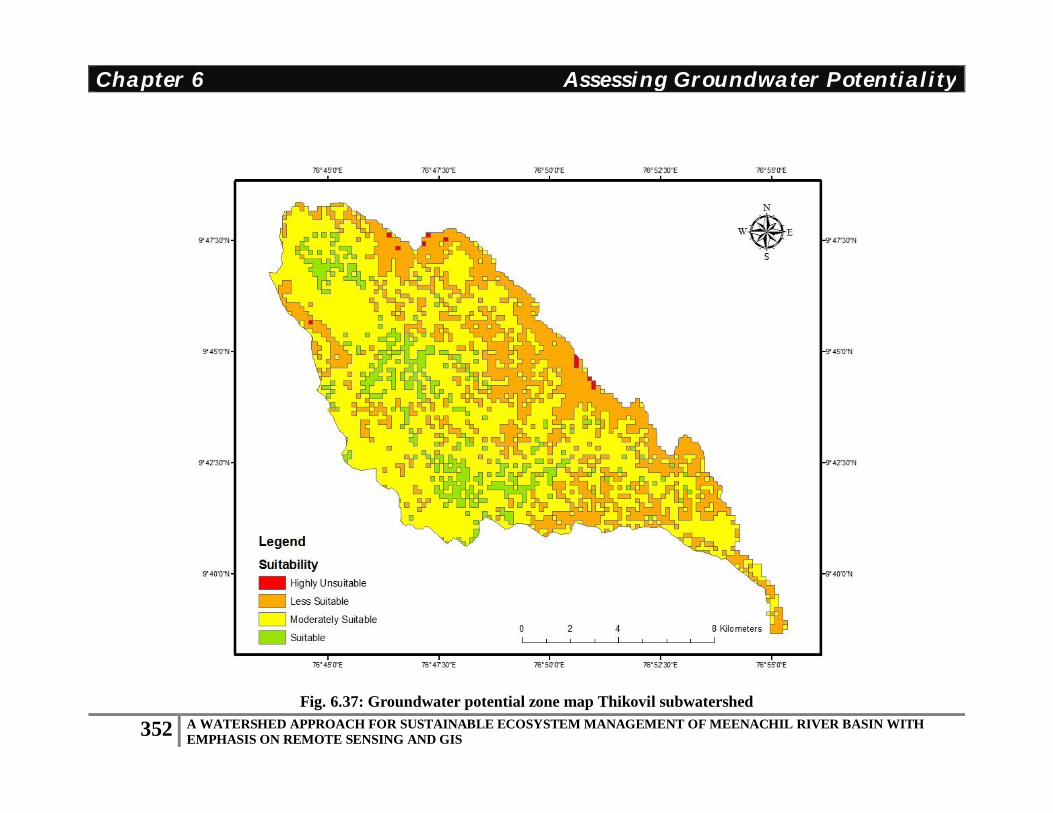
Fig. 6.37: Groundwater potential zone map Thikovil subwatershed

Chapter 6 Assessing Groundwater Potentiality
353 A WATERSHED APPROACH FOR SUSTAINABLE ECOSYSTEM MANAGEMENT OF MEENACHIL RIVER BASIN WITH EMPHASIS ON REMOTE SENSING AND GIS
The identified landuse/land cover features from the IRS imagery of the study area
are agricultural land (palm, rubber and tea plantations, paddy fields and cropland), waste
land (land with or without scrub and barren rocky area), water bodies (river), mixed
vegetation, grasslands and built-up land. Out of the total area, >76 % is falling under
rubber plantation. From the figure 7, it is clear that about >75 % come under the category
of suitable (value 2) groundwater potential, whereas 20% shows the potential value of 4
(less suitable) (Fig. 6.36). Very few areas are covered by the values of 3 (good to very
good) and 5 (poor to very poor). No area comes under the category of highly suitable
with a value of 1.
6.5 Conclusion The ultimate objective of the investigation was to find out the areas, which are promising
groundwater in the hard rock terrain of the Western Ghats. In the present study, the
choice among a set of zones for development of groundwater is based upon multiple
criteria, which gives linear combination of probability weights for lithology,
geomorphology, lineament density, drainage density, slope and land use/land cover. The
composite map represents regions with weight factors as values. The integrated final map
has generated a range of values from 1–5, which is reclassified into four zones, to
represent the groundwater potentiality of the area. The groundwater potentiality is
classified as suitable, moderately suitable, less suitable and highly unsuitable. Majority of
the area come under the moderately suitable category. Hydrogeomorphological units such
as fracture valley, valley fill pediments and denudational slope are potential zones for
groundwater exploration and development of the study area. In the study area, slope and
lineaments play a significant role in groundwater potentiality. Lineaments, particularly
joints, fracture and their intersection enhances the potential of hydrogeomorphic units.
Areas with high lineament density are good for groundwater development. The
lineaments mapped from the satellite images cut across slope categories and litho-units,
thereby indicating the possibility of acting as major conduits for subsurface movement
and linear aquifer for the storage of water. It has been observed in the field and from the
groundwater potential map; the gentler slope has more potential for groundwater.

Chapter 6 Assessing Groundwater Potentiality
354 A WATERSHED APPROACH FOR SUSTAINABLE ECOSYSTEM MANAGEMENT OF MEENACHIL RIVER BASIN WITH EMPHASIS ON REMOTE SENSING AND GIS
Thus the above study has demonstrated the capabilities of a remote sensing data
and GIS technique for demarcation of groundwater potential zones in hard rock terrain.
This vital information could be used effectively for identification of suitable locations for
extraction of potable water for rural populations. The current multiparametric approach
using GIS and remote sensing is holistic in nature and will minimize the time and cost
especially for identifying groundwater-potential zones and suitable site-specific recharge
structures, especially in hard rock terrain on a regional as well as local scale, thus
enabling quick decision-making for water management.
6.6 References Ajaykumar, B. 2010. Studies on River Sinuosity of Meenachil River, with special
reference to its Palaeo-Channels, using remote sensing. Ph. D. Thesis. Mahatma
Gandhi University, Kottayam, Kerala.
Bou Kheir, R., Shaban, A., Girard, M. C., Khawlie, M. and Abdallah, C. 2003.
Caracterisation morpho-pedologique des zones karstiques du Liban sensibilite des
sols a I erosion hydrique. Secheresse, 14: 4.
Boutt, D. F., David, W. H., Bryan, C. P. and David, T. L. 2001. Identifying potential land
use-derived solute sources to stream baseflow using ground water models and
GIS. Ground Water, 39: 24–34.
Brunner, P., Hendricks Franssen, H. J., Kgotlhang, L., Bauer-Gottwein, P. and
Kinzelbach, W. 2007. How can remote sensing contribute in groundwater
modeling? Hydrogeology J., 15: 5–18.
Chaterjee, R. S. and Bhattacharya, A. K. 1995. Delineation of drainage pattern of coal
basin related inference using satellite remote sensing techniques. Asia Pacific
Remote Sensing Journal, 1: 107–114.
Chowdhury, A., Jha, M. K. and Chowdary, V. M. 2010. Delineation of groundwater
recharge zones and identification of artificial recharge sites in West Medinipur

Chapter 6 Assessing Groundwater Potentiality
355 A WATERSHED APPROACH FOR SUSTAINABLE ECOSYSTEM MANAGEMENT OF MEENACHIL RIVER BASIN WITH EMPHASIS ON REMOTE SENSING AND GIS
district, West Bengal, using RS, GIS and MCDM techniques. Env Ear Sci., 59:
1209–1222.
Dar, I. A., Sankar, K. and Dar, M. A. 2010. Deciphering groundwater potential zones in
hard rock terrain using geospatial technology. Env Monit Ass., 173: 597–610.
Das, S., Behera, S. C., Kar, A., Narendra, P. and Guha, S. 1997. Hydrogeomorphological
mapping in groundwater exploration using remotely sensed data: A case study in
Keonjhar District, Orissa. J Indian Soc Rem Sens.,25: 247–259.
Davis, S. N. and Dewiest, R. J. M. 1966. Hydrogeology. New York: Wiley. 463 p
Dawoud, M. A., Darwish, M. M. and El-Kady, M. M. 2005. GIS-based groundwater
management model for western Nile delta. Wat Res Manag., 19: 585–604.
Edet, A. E., Okereke, C. S., Teme, S. C., and Esu, E. O. 1998. Application of remote-
sensing data to groundwater exploration: a case study of the Cross River State,
southeastern Nigeria. Hydrogeology J., 6(3): 394–404.
El-Baz, F. and Himida, I. 1995. Groundwater potential of the Sinai Peninsula, Egypt.
Project Summary. AID, Cairo.
El-Kadi, A. I., Oloufa, A. A., Eltahan, A. A. and Malic, H. U. 1994. Use of a geographic
information system in site specific groundwater modeling. Ground Water, 32:
617–625.
El-Shazly, E. M., El Raikaiby, N. M. and El Kassas, I. A. 1983. Groundwater
investigation of Wadi Araba area, Eastern Desert of Egypt, Using Landsat
Imagery. Proceedings of the 17th Symposium on Remote Sensing of the
Environment, Ann Arbor, Michigan, 9–13 May 1983, pp: 1003–1013.

Chapter 6 Assessing Groundwater Potentiality
356 A WATERSHED APPROACH FOR SUSTAINABLE ECOSYSTEM MANAGEMENT OF MEENACHIL RIVER BASIN WITH EMPHASIS ON REMOTE SENSING AND GIS
Gogu, R. C., Carabin, G., Hallet, V., Peters, P. and Dassargues, A. 2001. GIS-based
hydrogeological databases and groundwater modeling. Hydrogeology J., 9: 555–
569.
Gopinath, G. and Saralathan, P. 2004. Identification of groundwater prospective zones
using IRS-1D LISS III and Pump test methods. J Indian Soc Rem Sens., 32: 329–
342.
Goyal, S., Bharawadaj, R. S. and Jugran, D. K. 1999. Multicriteria analysis using GIS for
groundwater resource evaluation in Rawasen and Pilli watershed, U.P.
http://www.GISdevelopment.net Cited 17 Dec 2003
Harinarayana, P., Gopalakrishna, G. S. and Balasubramanian, A. 2000. Remote sensing
data for groundwater development and management in Keralapura watersheds of
Cauvery basin, Karnataka, India. The Indian Mineralogists, 34: 11–17.
Jacob, N., Saibaba, J., Prasada Raju, P. V. S. P. 1999. Groundwater modelling for
sustainable development using GIS techniques. Preconference volume 264–267
Geoinformetis Beyond 2000, Dehradun, India.
Jaiswal, R. K., Mukherjee, S., Krishnamurthy, J. and Saxena, R. 2003. Role of remote
sensing and GIS techniques for generation of groundwater prospect zones towards
rural development-an approach. Int J Remote Sens., 24: 993–1008
Jha, M. K., Chowdhury, A., Chowdary, V. M. and Peiffer, S. 2007. Groundwater
management and development by integrated remote sensing and geographic
information systems: prospects and constraints. Wat Res Manag., 21: 427–467.
Kamaraju, M. V. V., Bhattacharya, A., Reddy, G. S., Rao, G. C., Murthy, G. S. and Rao,
T. C. M. 1995. Groundwater potential evaluation of West Godavari District,
Andhra Pradesh State, India—A GIS approach. Ground Water, 34(2): 318–325.
Khan, M. A., and Moharana, P. C. 2002. Use of remote sensing and Geographical
Information System in the delineation and characterization of groundwater
prospect zones. J Indian Soc Rem Sens.,30: 132–141.

Chapter 6 Assessing Groundwater Potentiality
357 A WATERSHED APPROACH FOR SUSTAINABLE ECOSYSTEM MANAGEMENT OF MEENACHIL RIVER BASIN WITH EMPHASIS ON REMOTE SENSING AND GIS
Krishna Kumar, S., Chandrasekar, N., Seralathan, P., Godson, Prince S. and Magesh, N.
S. 2011. Hydrogeochemical study of shallow carbonate aquifers, Rameswaram
Island, India. Env Moni Ass., 184(27): 4127-4138.
Krishnamurthy, J. and Srinivas, G. 1995. Roll of geological and geomorphological
features in groundwater exploration: a study using IRS LISS data. Int J Rem
Sens., 16(14): 2595–2618.
Leblanc, M., Leduc, C., Razack, M., Lemoalle, J., Dagorne, D. and Mofor, L. 2003.
Application of remote sensing and GIS for groundwater modeling of large
semiarid areas: example of the Lake Chad Basin, Africa. In: Hydrology of
Mediterranean and Semiarid Regions Conference, Montpieller, France. Red
Books Series, 278. IAHS, Wallingford, pp. 186–192.
Leblanc, M., Favreau, G., Tweed, S., Leduc, C., Razack, M. and Mofor, L. 2007. Remote
sensing for groundwater modelling in large semiarid areas: Lake Chad Basin,
Africa. Hydrogeology J., 15: 97–100.
Leduc, C., Favreau, G. and Schroeter, P. 2001. Long-term rise in a Sahelian water table:
the Continental Terminal in southwest Niger. J Hydrol., 243: 43–54.
Magesh, N. S., Chandrasekar, N. and Soundranayagam, J. P. 2011a. Morphometric
evaluation of Papanasam and Manimuthar watersheds, parts of Western Ghats,
Tirunelveli district, Tamil Nadu India: a GIS approach. Environmental Earth
Science, 64: 373–381.
Magesh, N. S., Chandrasekar, N. and Vetha Roy, D. 2011b. Spatial analysis of trace
element contamination in sediments of Tamiraparani estuary, southeast coast of
India. Estuarine, Coastal and Shelf Science, 92: 618–628.
Mohammed Aslam M. A., Balasubramanian A., Kondoh A., Rokhmatuloh R. and
Mustafa A. J. 2003. Hydrogeomorphological mapping using remote sensing
techniques for water resource management around palaeochannels, geoscience

Chapter 6 Assessing Groundwater Potentiality
358 A WATERSHED APPROACH FOR SUSTAINABLE ECOSYSTEM MANAGEMENT OF MEENACHIL RIVER BASIN WITH EMPHASIS ON REMOTE SENSING AND GIS
and remote sensing symposium, IGARSS -APOS;03. Proceedings of the 2003
IEEE International, Toulouse, France, vol 5. Issue 2003, pp: 3317–3319
Münch, Z. and Conrad, J. 2007. Remote sensing and GIS based determination of
groundwater dependent ecosystems in the Western Cape, South Africa.
Hydrogeology J., 15: 19–28.
Muralidhar, M., Raju, K. R. K., Raju, K. S. V. P. and Prasad, J. R. 2000. Remote sensing
applications for the evaluation of water resources in rainfed area, Warangal
district, Andhra Pradesh. The Indian Mineralogists, 34: 33–40.
Murthy, K. S. R. 2000. Groundwater potential in a semi-arid region of Andhra Pradesh: a
geographical information system approach. Int J Remote Sens., 21(9): 1867–1884.
Nair, M. M. 1990. Structural trend line patterns and lineaments of the Western Ghats,
south of 13° latitude. Jour Geol Soc India, 35: 99–105.
Obi Reddy, G. P., Chandra Mouli, K., Srivastav, S. K., Srinivas, C. V. and Maji, A. K.
2000. Evaluation of groundwater potential zones using remote sensing data- a
case study of Gaimukh watershed, Bhandara district, Maharashtra. J Indian Soc
Rem Sens., 28(1): 19–32.
Prasad, R. K., Mondal, N. C., Banerjee, P., Nandakumar, M. V. and Singh, V. S. 2008.
Deciphering potential groundwater zone in hard rock through the application of
GIS. Env Geol., 55: 467–475.
Pratap, K., Ravindran, K. V. and Prabakaran, B. 2000. Groundwater prospect zoning
using remote sensing and geographical information system: a case study in Dala-
Renukoot Area, Sonbhadra District Uttar Pradesh. J Indian Soc Rem Sens., 28(4):
249–263.
Rajendran, C. P., John, B., Sreekumari, K. and Rajendran, K. 2009. Reassessing the
Earthquake Hazard in Kerala Based on the Historical and Current Seismicity.
Jour. Geol. Soc. India, 73: 785–802.

Chapter 6 Assessing Groundwater Potentiality
359 A WATERSHED APPROACH FOR SUSTAINABLE ECOSYSTEM MANAGEMENT OF MEENACHIL RIVER BASIN WITH EMPHASIS ON REMOTE SENSING AND GIS
Ravindran, K. V. and Jeyaram, A. 1997. Groundwater prospects of Shahbad Tehsil,
Basan District, Eastern Rajasthan, A Remote Sensing Approach. J Indian Soc
Rem Sens., 25: 239–246.
Rokade, V. M., Kundal, P. and Joshi, A. K. 2007. Groundwater potential modeling
through remote sensing and GIS: a case study from Rajura Taluka, Chandrapur
District, Maharastra. J Geol Soc India, 69: 943–948.
Sabins, F. F. 2000. Remote Sensing: Principles and Interpretation, W.H. Freeman and
Company, 494 p.
Salman, A. A. 1983. Using Landsat imagery interpretation prospection around Qena
providence, Egypt. Int J Remote Sens., 4: 1489–1497.
Saraf, A. and Choudhary, P. R. 1998. Integrated remote sensing and GIS for ground
water exploration and identification of artificial recharge site. Int J Remote Sens.,
19: 1825–1841.
Sarkar, B. C., Deota, B. S., Raju, P. L. and Jugran, D. K. 2001. A Geographic
Information System approaches to evaluation of groundwater potentiality of
Shamri microwatershed in the Shimla Taluk, Himachal Pradesh. J Ind Soc Rem
Sens., 29: 152–163.
Sener, E., Davraz, A. and Ozcelik, M. 2005. An integration of GIS and remote sensing in
groundwater investigations: a case study in Burdur, Turkey. Hydrogeology J., 13:
826–834.
Shaban, A., Khawlie, M. and Abdallah, C. 2006. Use of remote sensing and GIS to
determine recharge potential zone: the case of Occidental Lebanon. Hydrogeol J.,
14: 433–443.
Shahid, S. and Nath, S. K. 1999. GIS Integration of remote sensing and electrical
sounding data for hydrogeological exploration. J Spat Hydrol., 2(1): 1–12
Chapter 6 Assessing Groundwater Potentiality
360 A WATERSHED APPROACH FOR SUSTAINABLE ECOSYSTEM MANAGEMENT OF MEENACHIL RIVER BASIN WITH EMPHASIS ON REMOTE SENSING AND GIS
Shahid, S., Nath, S. K. and Roy, J. 2000. Ground water potential modeling in soft rock
area using GIS. J Remote Sens., 21: 1919–1924
Sikdar, P. K., Chakraborty, S., Adhya, E. and Paul, P. K. 2004. Land use/land cover
changes and groundwater potential zoning in and around Raniganj coal mining
area, Bardhaman District, West Bengal: A GIS and remote sensing approach. J
Spat Hydrol., 4(2): 1–24.
Solomon, S. and Quiel, F. 2006. Groundwater study using remote sensing and geographic
information systems (GIS) in the central highlands of Eritrea. Hydrogeology J.,
14: 1029–1041.
Sree Devi, P. D., Srinivasalu, S., and Kesava Raju, K. 2001. Hydrogeomorphological and
groundwater prospects of the peregu river basin by using remote sensing data.
Env Geol, 40: 1088–1094.
Srivasthava, P. K. and Bhattacharya, A. K. 2000. Delineation of groundwater potential
zones in a hard rock terrain of Baragarh District, Orissa using IRS data. J Ind Soc
Rem Sens., 28(2&3): 129–140.
Srinivasa Rao, Y. and Jugran, K. D. 2003. Delineation of groundwater potential zones
and zones of groundwater quality suitable for domestic purposes using remote
sensing and GIS. Hydrogeol Sci J., 48: 821–833.
Srinivas Rao, Y., Reddy, T. V. K. and Nayudu, P. T. 2000. Groundwater targeting in hard
rock terrain using fracture pattern modelling, Niva river basin, Andhra Pradesh,
India. Hydrogeology J., 8: 494–502.
Taylor, R. and Howard, K. 2000. A tectono-geomorphic model of the hydrogeology of
deeply weathered crystalline rock: Evidence from Uganda. Hydrogeol J., 8: 279–
294.
Teeuw, R. 1995. Groundwater exploration using remote sensing and a low cost
geographic information system. Hydrogeology J., 3: 21–30.

Chapter 6 Assessing Groundwater Potentiality
361 A WATERSHED APPROACH FOR SUSTAINABLE ECOSYSTEM MANAGEMENT OF MEENACHIL RIVER BASIN WITH EMPHASIS ON REMOTE SENSING AND GIS
Thomas, A., Sharma, P. K., Sharma, M. K. and Sood, A. 1999. Hydrogeomorphological
mapping in assessing groundwater by using remote sensing datada case study in
Lehra Gage Block, Sangrur district, Punjab. J Ind Soc Rem Sens., 27: 31–42.
Tiwari, A. and Rai, B. 1996. Hydromorphological mapping for groundwater prospecting
using landsat e MSS imagesda case study of Part of Dhanbad District, Bihar. J Ind
Soc Rem Sens., 24: 281–285.
Tweed, S. O., Leblanc, M., Webb, J. A. and Lubczynski, M. W. 2007. Remote sensing
and GIS for mapping groundwater recharge and discharge areas in salinity prone
catchments, southeastern Australia. Hydrogeology J., 15: 75–96.
Vijith, H. and Satheesh, R. 2007. Geographical Information System based assessment of
spatiotemporal characteristics of groundwater quality of upland sub-watersheds of
Meenachil River, parts of Western Ghats, Kottayam district, Kerala, India. Env
Geol., 53(1): 1–9.