Embed Size (px)
Citation preview
7/31/2019 Deciding on the Type of the Degree Distribution of a Graph from Traceroute-like Measurements
http://slidepdf.com/reader/full/deciding-on-the-type-of-the-degree-distribution-of-a-graph-from-traceroute-like 1/17

7/31/2019 Deciding on the Type of the Degree Distribution of a Graph from Traceroute-like Measurements
http://slidepdf.com/reader/full/deciding-on-the-type-of-the-degree-distribution-of-a-graph-from-traceroute-like 2/17
International Journal of Computer Networks & Communications (IJCNC) Vol.4, No.3, May 2012
152
by the m easurem ent procedure, which may have a st rong influence on the observeddegree d ist r ibu t ion [9, 1, 17, 27].
As a consequence, the curr ent sit ua t ion regarding the degree d ist r ibu t ion of theInternet is unclear [27, 19, 16, 18]. The relevance of ob t a ined samples regard - ing thedegree d ist r ibu t ion observed from t hem is far from being est ab lished. In p art icu lar , t hereis a cont roversy on whet her the Internet t op olog y may have a homogeneous (typ ica llyPoisson), or het eroge neous (t yp ically power-law) degree d ist r ibu t ion [16, 27]. In order toob t a in an answer to t h is quest ion, the m ost widely used approach curr ent ly is tocondu ct larger and larger m easurem ent s, in the exp ec t a t ion that t hese will lead toaccu ra t e observa t ions [18, 24, 8]. How- ever, t h is may be a dead end: the degreed ist r ibu t ion may be int r insically b iased by the m easurem ent process [1, 17] and inpract ice i t may depend much on t he sample size [18 ].
We explore here a com p let ely d iff erent approach: we consider a simple m odel of Internet t op olog y m easu rem ent s and try to derive the t ype of the degree d ist ribu t ionof the underlying graph from t h is lim it ed observa t ion. Our basic goal t heref ore is toanswer the following quest ion : given the lim it ed in f orm a t ion ob t a ined fromm easurem ent , does the underlying t op olog y more likely have a power-law or a Poissondegree d ist r ibu t ion?
In many cases (t r ace r ou t e m easurem ent s, BGP t ab les, and AS-level t r ace - r ou t e ,typ ica lly) , the m easurem ent process may be app roxim a t ed by a BF S (B read t h FirstSearch) t ree from a given node of the net work . Indeed, Int ernet m easu rem ent s m ost lyconsist in s et s of routes (i.e. paths in the considered t op olog y) going from am on it or to a set of t arget s, collec t ed from as m any m on it ors as possible. Since eachrou t e is modeled as a s hort est path and s ince one may exp ec t rou t es to have long commonprefixes, the view from each m on it or may be app roxim a t ed by a BFS. Alt hough t h is is arough app roxim at ion, in t he lack of a widely acce p t ed and better s olu t ion, it has been usedin many occ asions [17, 22, 1, 25, 9].
Deciding on the degree d ist r ibu t ion from such a view is a challenging t ask , and wewill make a few assum p t ions in order to make a first st ep t owards t h is amb it ious goal.We first assume that the size of the graph, i.e. it s number of nodes n, is given. In thecase of the Internet, t h is is a reasonable assump t ion [25, 14]. In add it ion, we willassume that the underlying graph is a rand om graph wi t h ei t her a Poisson or power-law degree d ist r ibu t ion. And finally, we assume that we have a complete BFS of theconsidered graph: all nodes (bu t not all links) in the graph are reached by theexp lora t ion. Finally, we assum e that the number of links m of the graph is known. It isclear that the last t wo assum p t ions are very s t rong, and are not attainable in pract ice .We however consider t hem as reasonable for a first app roxim a t ion, and give h int s of howt o ge t rid of the knowledge of the number of links in the last sec t ion of the pap er .
This paper cont a ins six main s ect ions. We describe our m et hodolog y in Sec t ion 2.
It relies on several s t ra t egie s to infer a degree d ist r ibu t ion f rom a BFS, which wedet a il in Sec t ion 3. In Sec t ions 4 and 5 we exper im ent ally eva lua t e the va lid it y of ourapproach on model graphs and real-world graph s resp ec t ively. In Sec t ion 6, we proposea m et hod to reduce the in it ia l in f orm a t ion needed by our approach. We discusslim it a t ions and f u t ure work in Sec t ion 7.

7/31/2019 Deciding on the Type of the Degree Distribution of a Graph from Traceroute-like Measurements
http://slidepdf.com/reader/full/deciding-on-the-type-of-the-degree-distribution-of-a-graph-from-traceroute-like 3/17
International Journal of Computer Networks & Communications (IJCNC) Vol.4, No.3, May 2012
153
Figure 1: Scheme of our m et h o d . G is an unknown graph on w h ic h we perform am ea su r em en t which gives its number of nodes n, it s number of links m and a BFS T . Wet h en consider t wo d iff e r en t h y p o t h eses: G has a Poisson degree d is t r ibu t ion w it h averaged eg r ee λ or it has a power- law degree d is t r ibu t ion w it h ex p on en t α . W e build t wo graphsG1 and G2 each w it h a st r a t egy in a cc o r d a n ce w it h the corresponding h y p ot h esis . We t h en compare the d eg r ee d is t r ibu t ion of G1 to the ex p ec t ed one of G if hy p ot h esis 1 is t r u e , andthe one of G2 to the ex p ec t ed one of G if h y p o t h esis 2 is t r u e . The h y p o t h esis which leads tothe m ost similar degree d is t r ibu t ion s is ex p ec t ed to be co rr ec t .
2. M e t h o d olog yOur m et hodolog y is s k et ched in Figure 1. It aims at deciding the t yp e of the
degree d ist r ibu t ion of an unknown graph G from one of it s BFS t ree T , it s number of nodes n and it s number of links m ob t ained t h rough a m easu rem ent . To do so, we
consider the two following hyp ot heses:
For each hyp ot hesis, we build a graph according to a s t ra t egy which we det a il inSec t ion 3, t hu s ob t a in ing G1 and G2, resp ec t ively. Our exp ec t a t ion is that if hyp ot hesis
H 1 is true (G is Poisson) t hen the degree d ist r ibu t ion P G1 of G1 will be closer to the
t heoret ica l d ist r ibu t ion P (1) than P G2 to P ( 2 ) , and conversely if H 2 is true (G ispower-law) t hen the degree d ist r ibu t ion P G2 of G2 will be closer to P (2) than P G1
to P ( 1) . To compare two d ist r ibu t ions, we will use d iff erent d ist ances D (we will
define several b elow ) and compare D(P ( 1) , P G1 ) to D(P ( 2) , P G2 ) .

7/31/2019 Deciding on the Type of the Degree Distribution of a Graph from Traceroute-like Measurements
http://slidepdf.com/reader/full/deciding-on-the-type-of-the-degree-distribution-of-a-graph-from-traceroute-like 4/17
International Journal of Computer Networks & Communications (IJCNC) Vol.4, No.3, May 2012
154
We exp er im en t a lly assess the va lid it y of t h is approach by applying it to cases where weknow the original graph G (we ob t ain such graphs using models in Sec- t ion 4 and usingreal-world data in Sec t ion 5). We t hen compare the expec t ed t heoret ica l degreed ist r ibu t ion to the ones of the graphs ob t a ined from each st ra t egy and check conformance of resu lt s wi t h exp ec t a t ions. Comparing d ist r i- bu t ions is a challenge it self ,for which no general au t om a t ic procedure is com - monly acce p t ed. To perform t h is, wewill use two co m p lem ent ary app roaches: visual insp ec t ion of p lot s of the inversecumu la t ive degree d ist r ibu t ions (IC DD ) , t oge t her wi t h t wo classical s t a t ist ica l t est s, theKolmogorov-Smirnov test [11 ] and St a t ist ica l Dist ance [5] d ist ances, defined as:
In Sec t ion 6, we ex t end our approach to get in f orm at ion on the degree d is- t ribu t ionof a graph when the number of links is not known, which is a m ore rea list ic assum p t ion. In that case we use our rebuilding s t rat egie s for a wide range of possible values of mand infer the m ost probable typ e of degree d ist r i- bu t ion as previously, see Figure 2.
3. Building s t r a t e gi e sSt art ing from a BFS T of a graph G wi t h n nodes and m links and an
hyp ot hesis (H1 or H2) on the degree d ist r ibu t ion of G (t yp e Poisson or p ower- law), our
obj ect ive here is to it era t ively add m − n + 1 links to T in order t o build a graph G
′
wit h n nodes, m links, and degree d ist r ibu t ion similar to t he one of G. We defined iff erent link add it ion s t ra t egie s according to the s upp osed t yp e of G, Poisson or power-law. And in each case, we show how to com pu t e the degree d ist r ibu t ion of theresu lt ing graph.
3.1. H1: G is Poisson (RR st r a t egy)
We may t h ink of building a graph G′ similar to G by using a variant of the ER
const ruct ion : starting wi t h the n nodes and n − 1 links of a BFS t ree T , the m − n + 1missing links are randomly added as in the ER model. Bu t then T may not be a
possible BFS of G′ : any link in G which is not in T is necessarily between t wo nodes
in consecu t ive levels of T , or in the same level of T (ot herwise T would not be a

7/31/2019 Deciding on the Type of the Degree Distribution of a Graph from Traceroute-like Measurements
http://slidepdf.com/reader/full/deciding-on-the-type-of-the-degree-distribution-of-a-graph-from-traceroute-like 5/17
International Journal of Computer Networks & Communications (IJCNC) Vol.4, No.3, May 2012
155
short est path t ree and t hu s not a BFS, see Figure 3). In order to ensure that T is also
a possible BFS of G′ we t heref ore add links only b etwee n nodes in consecu t ive levels or
in the same level. Since b ot h ext rem it ies of links are randomly chosen, we call t h is
const ruct ion the RR (Random-Random) s t ra t egy.
Figure 2: Scheme of our m et h o d , in the case when m is un k n ow n . G is an unknown graphon which we perform a m ea su r em en t w h ic h gives its number of nodes n and a BFS t r ee T .We t h en con si d e r t wo d iff e r en t t y p e of h y p o t h eses: (H1) G has a Poisson d eg r ee d is t r ibu t ion w it h average degree λ or (H2) it has a p ow e r -law d eg r ee d is t r ibu t ion w it h ex p on en t α . B o t h p a r a m et e r s λ and α a r e eq u iva le n t to the number of links m. Then we build t wo families of graphs G 1 , m and G 2 , m in accordance w it h t h ese t wo h y p o t h esis a nd d iff e r en t m. We t h encompare the degree d is t r ibu t ion of G 1 , m t o t h e ex p ec t ed one of G if (H1) is true, and theone of G 2 , m t o t h e ex p ec t ed one of G if (H2) is true. The hy p o t h esis which leads to t h e m ost similar degree d is t r ibu t ion s is ex p ec t ed to be c o rr ec t .
Figure 3: Le t us consider a part of a BFS of G, composed of a se t o f links A-B, A-c, B-D, C-Ea nd
C-F. Links B-E and D-E may also be p r ese n t in G, but n o t link A- F .

7/31/2019 Deciding on the Type of the Degree Distribution of a Graph from Traceroute-like Measurements
http://slidepdf.com/reader/full/deciding-on-the-type-of-the-degree-distribution-of-a-graph-from-traceroute-like 6/17
International Journal of Computer Networks & Communications (IJCNC) Vol.4, No.3, May 2012
156
We now show that the exp ect ed node degree d ist r ibu t ion of G′ ob t a ined wi t h
the RR s t ra t egy can be d irec t ly com pu t ed from n, m and T wi t hou t exp lici t ly
const ruct ing G′ .
Theorem 1. Given a tree T with n nodes, if we construct a graph G′ using the
RR strategy, then the expectation of a node v with degree l in G′ is:
As each newly added link im pact s t wo nodes, the values of P (k → l, j ) are
ind ep end ent from the ot her P (k ′ → l
′ , j′ ). We will consider that t h is im pact can be
ignored, when n and m is large enough. From t h is resu lt , one may est im a t e the
exp ec t a t ion of the degree d ist r ibu t ion of G′ from n , m and T , wi t hou t const ruct ing
it exp lici t ly. This is of high int erest in pract ice , since it allows to com pu t e the
exp ec t a t ion of degree dist r ibu t ion and compare it wi t h degree d ist r ibu t ions ob t a ined by the const ruct ing st ra t egie s. Going f ur t her would however need precise resu lt s on theexp ec t a t ion of degrees in T , which is a d ifficu lt problem [1].
7/31/2019 Deciding on the Type of the Degree Distribution of a Graph from Traceroute-like Measurements
http://slidepdf.com/reader/full/deciding-on-the-type-of-the-degree-distribution-of-a-graph-from-traceroute-like 7/17
International Journal of Computer Networks & Communications (IJCNC) Vol.4, No.3, May 2012
157
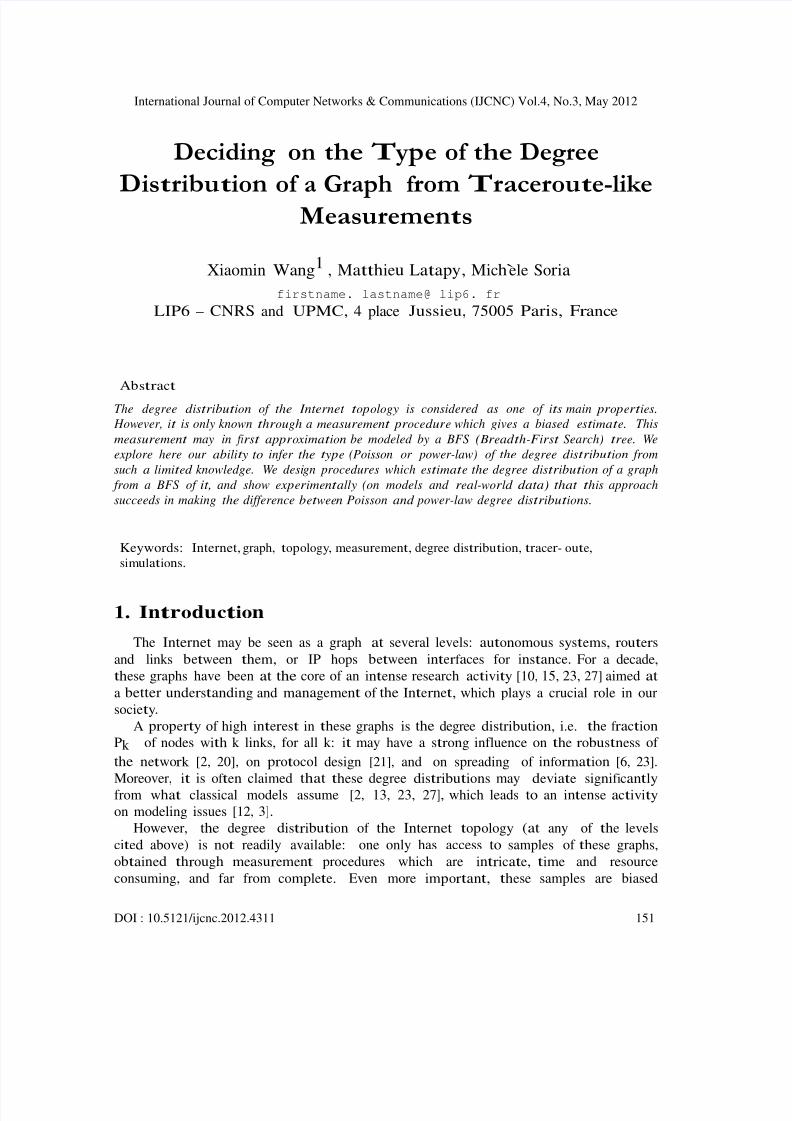
3.2. H2: G is power-law (PP st r a t egies )Suppose now that G is a power-law graph. We t heref ore aim at design ing a process
which builds from a BFS T of G, a graph G′ wi t h power-law node degree
d ist r ibu t ion. To do t h is, as before, we add m − n + 1 links b etween nodes in app ropr ia t e levels of T . However, t hese pairs of nodes are no longer chosen uniformly at random.Inst ead, we use a s elec t ion scheme inspired from the p ref - erent ia l attachment of theclassical Barab asi-Alb er t model [4]: we choose ( in the a pp rop r ia t e levels) nodesrandomly wi t h p robab ility p rop ort iona l to t heir degree in T . As we choose b ot h ext rem it ies of added links according to p ref - e rent ia l attachment, we call t h is procedurethe PP (P ref eren t ial-P ref erent ia l) st ra t egie s.
We now show how to com pu t e, for t h is s t rat egy, the exp ec t ed ob t ained degreed ist r ibu t ion.
Theorem 2. Given a tree T with n nodes, if we construct a graph G′ using the
PP strategy, then the expectation of a node v with degree l in G′ is:
′ where n j k is the number of nodes with degree k at level j in T and P (k → l, j, m′ ) is the
probability that a node v with degree k at level j in T is constructed a s a node withdegree l in G
′ after m′ links have been added into T .
Computation process.. The t erm P (k → l, j, m′ ) may be ob t a ined recursively:
We s p lit P (k → l, j, m′ ) int o t wo parts which correspond to t wo cases (linked to t h is
node or not) when a new link is added. The probab ilit y that a newl y added link changes the node from degree k to k + 1 is denot ed by θ .
In the following, we com pu t e θ using four t erm s:
• θ 1 : the p robab ilit y that the node v is s elec t ed as the first endp oin t of t he newlyadded link .
• θ 2 : the probab ilit y that a node at upper level j − 1 is s elec t ed as the firstendp oint , and v is s elec t ed as the second endp oint .
• θ 3 : the p robab ilit y that a node (excep t v) at level j is s elec t ed as the firstendp oint , and v is s elec t ed as the second endp oint .
• θ 4 : the probab ilit y that a node at lower level j + 1 is s elec t ed as thefirst endp oin t , and v is s elec t ed as the second endp oint .
7/31/2019 Deciding on the Type of the Degree Distribution of a Graph from Traceroute-like Measurements
http://slidepdf.com/reader/full/deciding-on-the-type-of-the-degree-distribution-of-a-graph-from-traceroute-like 8/17
International Journal of Computer Networks & Communications (IJCNC) Vol.4, No.3, May 2012
158
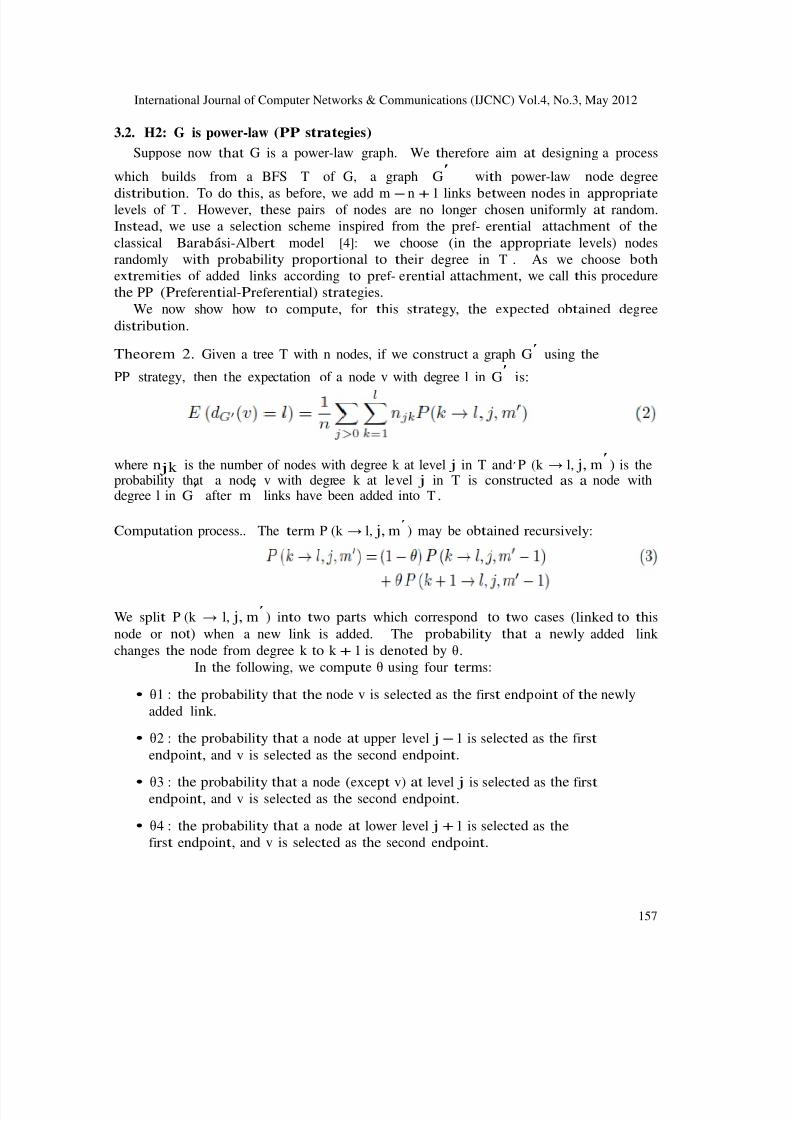
The sum of degrees of all nodes at the level i af t er t links have been add ed is di, t .In the following, we give the det a ils of how to ca lcu la t e for the case of PP s t ra t egy.
Using equa t ion (9) in the expressions (8) shows that d j , t is a f un ct ion of d j′
, t − 1 ,which can be calcu la t ed by dynamic programm ing t echn iques.
Our com pu t a t ion process is not exact , since we have neglec t ed to t ak e int o acco un tpossible collision, i.e. posit ions to be s elec t ed several t im es. Howe ver , since we dealwit h sparse graphs, in the case of model graphs as well as rea l graphs, the number of links to be added to the BFS t ree is much smaller t han the number of possibleposit ions, and so t here are very few collisions. From a pract ica l view p oint , in thebuilding process, we just ignore mu lt ip le link s.
4. V a li d a t io n using model g r a ph s
Our exp ec t a t ion is that the s t ra t egie s described in previous s ec t ion succee d in building agraph G
′ similar (regarding degree d ist r ibu t ion ) to G when t he app rop r iat e st rat egy is used wit h an app rop r ia t e graph (RR if G is Poisson, PP if G is power-law).
In add it ion, we exp ec t that the degree d ist r ibu t ion of G′ will differ s ign ificant ly from
that of G if a wrong s t ra t egy is applied (RR if G is power-law, PP if G is Poisson). Int h is s ec t ion we condu ct exp er im ent s on model graphs, i.e. random graphs in the classes of Poisson graphs or power-law graph s wit h given param et ers (average degree and
7/31/2019 Deciding on the Type of the Degree Distribution of a Graph from Traceroute-like Measurements
http://slidepdf.com/reader/full/deciding-on-the-type-of-the-degree-distribution-of-a-graph-from-traceroute-like 9/17
International Journal of Computer Networks & Communications (IJCNC) Vol.4, No.3, May 2012
159
P P
ICDD
ICD
exp onent resp ec t ively) . To ensure that the BFS covers all nodes of the graph, we use asof t ware which genera t es random simple connected graphs according to a given degreesequence (sam p led from the given degree d ist r ibu t ion) [26 ].
1 1G G
RR RR PP PP
0.8
0.8
0.6 0.6
0.6
0.4 0.4
0.4
0.2 0.2
0.2
00 2 4 6 8 10 12 14
degree
0
00 5 10 15 20 25
degree
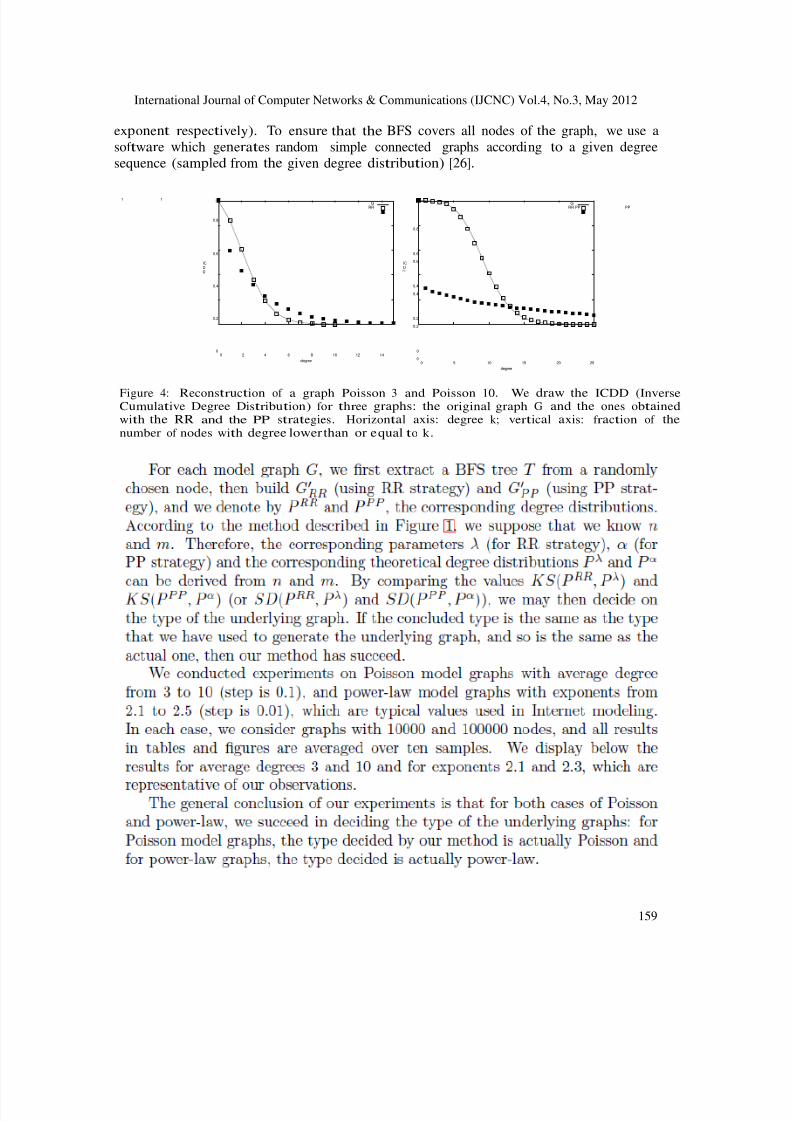
Figure 4: R ec on st r u ct ion of a graph Poisson 3 and Poisson 10 . W e draw the ICDD (InverseC u m u la t ive Degree D is t r ibu t ion ) f o r t h r ee graphs: the original graph G and the ones ob t a in ed w it h the RR and the PP st r a t eg ies . H o r iz on t a l axis: degree k; ve r t ic a l a x is: f r a ct ion of thenumber of nodes w it h degree lower than or equal t o k .

7/31/2019 Deciding on the Type of the Degree Distribution of a Graph from Traceroute-like Measurements
http://slidepdf.com/reader/full/deciding-on-the-type-of-the-degree-distribution-of-a-graph-from-traceroute-like 10/17
International Journal of Computer Networks & Communications (IJCNC) Vol.4, No.3, May 2012
160
4.1. Poisson g r a ph s
In Figure 4 we present the resu lt s for Poisson graphs wit h average degrees 3 and 10 .The degree d ist r ibu t ion ob t a ined wi t h RR s t ra t egy is closer to the or iginal one, as
exp ec t ed. This is confirmed by the KS and SD s t a t ist ics (Table 1): t he sm allest values areob t a ined wi t h RR s t ra t egy.
Not ice that a Poisson graph wi t h a higher degree gives better resu lt s. T h is is probablydue to the f act that we add more links in t h is case, and so s t ra t egie s for doing t h is makemuch more d iff erence.
degree
Figure 5: Reconstruction of a graph power-law 2.1 and 2.3. We draw the ICDD for three graphs: the original graph G,and the ones obtained with the RR and the PP strategies.
.Finally, we conclude that our m et hod succeeds in recognizing random P ois- son graphs.
This is true for all average degrees, but performs best on graph s wit h a rela t ively highaverage degree .
4.2. Power-law gr a ph sSimilar to Poisson model graphs, we condu ct our exp er im ent s wi t h p ower- law model
graph s.In Figure 5 we present ob t a ined resu lt s for power-law graphs wit h exp onen t2.1 and 2.3. To better show the charact er ist ic of the power-law, all p lot s are in log-log scale.Bot h the ICDD p lo t and the statistic test (Table 2) s upp ort our conclusion for allexp onent s and all s izes.

7/31/2019 Deciding on the Type of the Degree Distribution of a Graph from Traceroute-like Measurements
http://slidepdf.com/reader/full/deciding-on-the-type-of-the-degree-distribution-of-a-graph-from-traceroute-like 11/17
International Journal of Computer Networks & Communications (IJCNC) Vol.4, No.3, May 2012
161
ICDD
Table 2: KS and SD for p ower -law model graph sPower-law 2.1 Power-law 2.3
n = 10000 n = 100000 n = 10000 n = 100000K S SD KS S D K S SD K S S D
RR 0.201 0 .432 0 .194 0 .405 RR 0.278 0 .591 0 .274 0 .553PP 0.038 0 .138 0 .049 0 .180 PP 0.030 0 .086 0 .024 0 .095
1 1G G
RR RR PP PP
Figure 6: ICDD of the Skitter and Radar graphs G and the ones obtained with RR and PPstrategies.
Table 3: KS and SD for Sk itt er graph.
K S SDt heory-RR 0.166 0 .359t heory-PP 0.082 0 .235
5. E x p e r im e n t s on real-world d a t aPrevious s ec t ion shows that our m et hod succeeds in making the d iff erence b et wee n
Poisson and power-law random graphs. It is clear however that, in p ract ice , consideredgraphs have neit her p er f ec t Poisson nor power-law degree d ist r ibu t ion, and are not rand om .
We consider in t h is sect ion several real-world da t aset s among the curr ent largestm easurem ent s of the Internet t op olog y. Alt hough ob t a ined graphs are st ill partial viewsand probably are s t rongly biased, t hey const it u t e curr ent st a t e-o f -t he-art of availabledata and we use t hem as b enchm ark s.
Like in previous s ect ion, for each case of real-world graph G, we consider t wo hyp ot heses: (H1) G has a degree d ist r ibu t ion close to a Poisson law; (H2) G has a
degree d ist r ibu t ion close to a power-law. Using s t ra t egie s RR and P P ,
7/31/2019 Deciding on the Type of the Degree Distribution of a Graph from Traceroute-like Measurements
http://slidepdf.com/reader/full/deciding-on-the-type-of-the-degree-distribution-of-a-graph-from-traceroute-like 12/17
International Journal of Computer Networks & Communications (IJCNC) Vol.4, No.3, May 2012
162
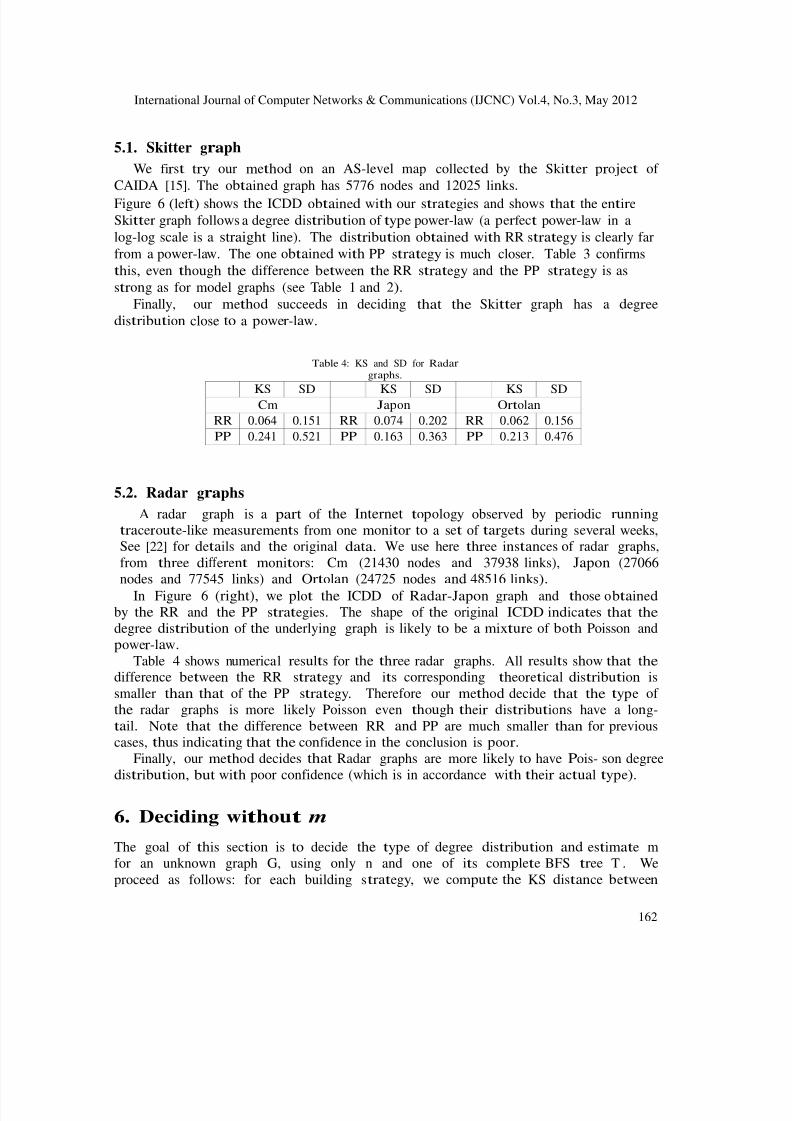
5.1. Skitter gr a phWe first try our m et hod on an AS-level map collec t ed by the Sk itt er pro jec t of
CAIDA [15]. The ob t a ined graph has 5776 nodes and 12025 link s.Figure 6 ( lef t ) shows the ICDD ob t a ined wi t h our s t ra t egie s and shows t ha t the ent ire Sk itt er graph follows a degree d ist r ibu t ion of typ e power-law (a p erf ec t power-law in alog-log scale is a straight line). The d ist r ibu t ion ob t a ined wi t h RR s t ra t egy is clearly farfrom a power-law. The one ob t a ined wi t h PP s t ra t egy is much closer. Table 3 confirmst h is, even t hough the difference b etwee n t he RR s t ra t egy and the PP s t ra t egy is asst rong as for model graphs (see Table 1 and 2) .
Finally, our m et hod succeeds in deciding that the Sk itt er graph has a degreed ist r ibu t ion close to a p ower-law.
Table 4: KS and SD for R ad a r graph s.
KS S D K S SD KS S DCm J ap on O r t olanRR 0.064 0 .151 RR 0.074 0 .202 RR 0.062 0 .156PP 0.241 0 .521 PP 0.163 0 .363 PP 0.213 0 .476
5.2. Radar gr a ph sA radar graph is a part of the Internet t op olog y observed by periodic runn ing
t racerou t e-li k e m easu rem ent s from one m on it or to a set of t arge t s during s evera l weeks,See [22] for det a ils and the original data. We use here t hree inst ances of radar graphs,from t h ree d iff erent m on it ors: Cm (21430 nodes and 37938 links), Japon (27066nodes and 77545 links) and Ort olan (24725 nodes and 48516 link s) .
In Figure 6 (right), we p lot the ICDD of Radar-Japon graph and t hose o b t a inedby the RR and the PP s t rat egie s. The shape of the original IC DD ind ica t es that thedegree d ist r ibu t ion of the underlying graph is likely to be a m ixt u re of b ot h Poisson andpower-law .
Table 4 shows numerical resu lt s for the t h ree radar graphs. All resu lt s show that thedifference between the RR s t ra t egy and it s corresponding t heoret ica l d ist r ibu t ion issmaller than that of the PP s t ra t egy. Therefore our m et hod decide that the t yp e of the radar graphs is more likely Poisson even t hough t heir d ist r ibu t ions have a long-t a il. Not e that the difference b etween RR and PP are much smaller than for previouscases, t hu s ind ica t ing that the con fidence in the conclusion is poo r .
Finally, our m et hod decides that Radar graphs are more likely to have P ois- son degreed ist r ibu t ion, but wit h poor confidence (which is in accordance wi t h t heir act ua l t yp e) .
6. Deciding wi t h o u t m
The goal of t h is sec t ion is to decide the t yp e of degree d ist r ibu t ion and est im a t e mfor an unknown graph G, using only n and one of it s com p let e BFS t ree T . Weproceed as follows: for each building s t ra t egy, we com pu t e the KS d ist ance b et ween

7/31/2019 Deciding on the Type of the Degree Distribution of a Graph from Traceroute-like Measurements
http://slidepdf.com/reader/full/deciding-on-the-type-of-the-degree-distribution-of-a-graph-from-traceroute-like 13/17

7/31/2019 Deciding on the Type of the Degree Distribution of a Graph from Traceroute-like Measurements
http://slidepdf.com/reader/full/deciding-on-the-type-of-the-degree-distribution-of-a-graph-from-traceroute-like 14/17
International Journal of Computer Networks & Communications (IJCNC) Vol.4, No.3, May 2012
164
Table 6: R esu lt s for power-law model graph s
n= 1000 K S m m ’ n= 10000 K S m m ’
power-law 2.10 0 .07 4233 3002 power-law 2.10 0 .06 42326 28129power-law 2.15 0 .09 3662 2936 power-law 2.15 0 .04 36622 25043power-law 2.20 0 .07 3220 2550 power-law 2.20 0 .03 32198 25043power-law 2.25 0 .07 2873 2418 power-law 2.25 0 .03 28730 21085power-law 2.30 0 .06 2598 2168 power-law 2.30 0 .03 25982 21377power-law 2.35 0 .05 2378 2200 power-law 2.35 0 .02 23780 20534power-law 2.40 0 .06 2200 2109 power-law 2.40 0 .02 21996 20274
Figure 8: KS for a power-law model graph w it h ex p on en t 2.2. The le f t figure is the es t im a t ion w it h the RR st r a t egy w it h a m in im u m g r ea t e r than 0.1. The r igh t figure is the es t im a t ion w it h the PP st r a t egy w it h a minimum less than 0 . 1
6.2. Power-law gr a ph sIn Table 6 and Figure 8, we give the resu lt of our exp er im ent s for p owe r-law graphs
wit h exponent s b et ween 2.10 and 2.40 .Again, the m et hod succeeds in deciding the a pp ropr ia t e t yp e of the graph : wi t h PP,
the value of the KS test is smaller than wit h RR. The est im a t e m′ is reasonable, but
lower than the a ct ual va lue.
6.3. Real-world gr a ph sFinally, we apply our m et hod on some real world graph, see Table 7 and Figure 9.
Table 7: R esu lt s for rea l-wo r ld graph s
RR PP m m
Sk itt er 0.109 0 .091 12822 7683Rada r-Or lan t o 0 .150 0 .435 48516 49450Rada r-J ap on 0.067 0 .162 77545 79041
Rada r-Cm 0.051 0 .225 37938 49289

7/31/2019 Deciding on the Type of the Degree Distribution of a Graph from Traceroute-like Measurements
http://slidepdf.com/reader/full/deciding-on-the-type-of-the-degree-distribution-of-a-graph-from-traceroute-like 15/17
International Journal of Computer Networks & Communications (IJCNC) Vol.4, No.3, May 2012
165
Figure 9: KS f o r Sk itt e r -A S g r a ph .
As before, our m et hod succeeds in deciding that the Sk itt er graph is very close to apower-law graph, while radar graphs are closer to a Poisson graph, bu t are act ua lly in
between, the b ot h cases, we ob t a in reasonable est im a t es m′ of the number of links m .
7. C o n cl u s io n
In t h is paper, we present ed a new approach to decide on the t yp e of t he degreed ist r ibu t ion of a graph when only a BFS and it s size are known. We use d iff erentst rat egie s to reco nst ruct a graph from a BFS, according to the p resup - posed t yp e of thegraph. We t hen show how t hese s t ra t egie s allow to decide b et ween Poisson and power-law degree d ist r ibu t ed graphs, wi t h exp er im ent s on random graphs as well as real-worldgraph s.
We worked on two set s of hyp ot heses: we first supposed that, in add it ion to a BFST on the n ver t ices of the unknown original graph G, we know it s number of edgesm: in t h is case we formally com pu t e the exp ec t ed d egree d ist r ibu t ion of the graphs
ob t a ined wi t h the d iff erent reco nst ruct ing s t rat egie s; moreover exp er im ent s on randomgraphs confirm that the knowledge of a BF S and m allows to recognize the t yp e of thegraph. Second, we use the sa m e reco nst ruct ion st ra t egie s wi t hou t knowing the numberof edges m, and we can st ill reasonably pred ic t the t yp e of the original graph.
The main lim it a t ion of our cont r ibu t ion is that we suppose the knowledge of acom p let e BFS of the unknown graph. This hyp ot hesis is not realist ic , t hough, sincepract ica l m easu rem en t s rather provide only paths to a sub set of the real graph vert ice s.Our main perspec t ive t heref ore is to reduce requ irem ent s on data, and designst ra t egie s needing truncated BFS (BFS un t il a cert a in level) only, and partial BFS(that do not cont a in all vert ice s of the graph). Assum ing that such m easurem ent s areavailable is much more rea list ic[22 ].
In f u t u re work, we also want to improve our m et hod by invest iga t ing var iousrefinem ent s: (i) design reco nst ruct ion s t ra t egie s t ak ing int o acco un t more s ub t lepropert ies of the BFS, such as node d ist r ibu t ion on each level, and also ot her localpropert ies such as the clust er ing coe fficient ; (ii) ext end the reco nst ruct ion st ra t egie s inthe d irec t ion of ot her t yp es of d ist r ibu t ions: a first st ep would b e to mix RR and PPst ra t egie s for mixed Poisson power-law graphs, but we also aim at invest iga t ing power-laws wi t h exponent ia l cu t -off , and ot her laws.
7/31/2019 Deciding on the Type of the Degree Distribution of a Graph from Traceroute-like Measurements
http://slidepdf.com/reader/full/deciding-on-the-type-of-the-degree-distribution-of-a-graph-from-traceroute-like 16/17
International Journal of Computer Networks & Communications (IJCNC) Vol.4, No.3, May 2012
166
Ackn owledgeme n t sThis work is partly funded by the European Commission t hrough the E U- LER
pro ject (grant 258307), part of the Future Internet Research and Exper i- mentation(FIRE) obj ec t ive of the Sevent h Framework Programme (F P 7) .
R e f e r e n ce s
[1] D. A ch liop t as, D. Kempe, A. C lau set , and C. Moore. On the bias of t racer - o u t e sampling: or,power-law degree d ist r ibu t ions in regular graphs. A CM Symposium on Theory of Computing,pages 694–703, 2005 .
[2] R. A lb er t , H. Jeong, and A.-L. Barabasi. Error and attack t ole ran ce of complex net work s. Nature, 406(6794):378–382, July 2000 .
[3] D. Alderson, L. Li, W. Willinger, and J. C. Doyle. U nd erst and ing int ernet topology:principles, models, and va lida t ion. IEEE / ACM Transactions on Networking, 13(6):1205–1218,December 2005 .
[4] A. L. Barab asi, R. A lb er t , and H. Jeong. Mean-field t heory for s ca le- f ree random net work s. Physica A: Statistical Mechanics and its App lica tions, 272(1-2):173–187, O ct ob er 1999 .
[5] M. Basseville. Dist an ce measures for signal processing and pattern recog- n it ion. SignalProcess., 18:349–369, December 1989 .
[6] N. Berger, C. Borgs, J. T. Chayes, and A. Saberi. On the spread of viruses on the int ernet . Proceedings of the sixteenth annual ACM-SIAM symposium on Discrete algorithms, pages301–310, 2005 .
[7] B. Bollobas. Random Graphs. Cambridge U n iversity Press, January 2001 . [8] K. Claffy, Y.
Hyun, K. Keys, M. Fomenkov, and D. Krioukov. Int ernet Mapping: From Art to Science.Cybersecurity Applications and Technology Conference for Homeland Security, pages 205–211,March 2009 .
[9] L. Da ll’ast a, I. Alvarez-Hamelin, A. Barrat, A. Vazquez, and A. V esp ignan i. Exploring net work swit h t racerou t e-li k e probes: Theory and s imu la t ions. Theoretical Computer Science,355(1):6–24, April 2006 .
[10] B. Donn et and T. Friedman. Internet t op olog y discovery: A survey. Com- municationsSurveys & Tutor ia ls, IEEE, 9(4):56–69, 2007 .
[11] W. T. Eadie, D. Drijard, F. E. James, M. Roos, and B. Sad ou let . S ta tistica l methods inexperimental physics. American Elsevier Publishing Co, J un e 2008 .
[12] A. Fabrikant, E. Kou t soup ias, and C. P apad imit r iou. Heu r ist ica lly Op t i- mized Trade-Offs:A New Paradigm for Power Laws in the Internet. Au- tomata, Languages and Programming,2380:781, January 2002 .
[13] M. Fa lou t sos, P. Fa lou t sos, and C. Fa lou t sos. On power-law rela t ionsh ips of the Internett op olog y. SIGCOMM: Conference on Applications, technolo- gies, architectures, andprotocols for computer communication, 29 (4) :251– 262, Oct ob er 1999 .
7/31/2019 Deciding on the Type of the Degree Distribution of a Graph from Traceroute-like Measurements
http://slidepdf.com/reader/full/deciding-on-the-type-of-the-degree-distribution-of-a-graph-from-traceroute-like 17/17
International Journal of Computer Networks & Communications (IJCNC) Vol.4, No.3, May 2012
167
[14] J. Heidemann, Y. Pradkin, R. Govindan, C. Papadopoulos, G. Bar t lett , and J. Bann ist er .Census and Survey of the Visible Internet. 8th A CM SIGCOMM conference on Internetmeasurement, pages 169–182, 2008 .
[15]D. Krioukov, F. Chung, K. Claffy, M. Fomenkov, A. Vespignani, and W. Willinger. TheWorkshop on Internet Topology (WIT) R ep or t . S IG- COMM Computer CommunicationReview, pages 69–73, Dec 2007 .
[16] B. K r ishna mur t hy and W. Willinger. What are our s t anda rds for va li- da t ion of m easurem ent -ba sed n et work ing research? ACM S IGME T RI CS Performance EvaluationReview, 36:64–69, A ugust 2008 .
[17] A. Lakhina, J. W. Byers, M. Crovella, and P. Xie. Sampling biases in IP t op olog ym easurem ent s. INFOCOM: 22th Conference on Computer and Communications Societies,1:332–341, 2003 .
[18] M. L a t ap y and C. Magnien. Complex N et work Measurem ent s: E st im a t ing the Relevance of Observed P rop er t ies. INFOCOM: 27th Conference on Computer Communications, pages1660–1668, May 2008 .
[19] L. Li, D. Alderson, W. Willinger, and J. Doyle. A first -p r incip les ap - proach tound erst and ing the int ernet ’s rou t er-le vel t op olog y. S IGCO MM : Conference on Applications,technologies, architectures, and protocols for computer communications, 34(4):3–14, Oct ob er 2004 .
[20] C. Magnien, M. L a t ap y, and J.-L. Guillaume. Im pa ct of Random Fa ilures and A tt ack s onPoisson and Power-Law Random N et work s. ACM Com- puting Surveys, Aug 2009 .
[21] D. Magoni and J.-J. P an siot . Influence of N et work Topology on P rot ocol Si mu la t ion. In terna t iona l Conference on Networking, 2093:762–770, J un e 2001 .
[22] F. Ou edraogo , C. Magnien, and M. L a t ap y. A radar for the int ernet . 1st In terna tiona l Workshop on Analysis of Dynamic Networks, 2008 .
[23] R. P ast or -sa t orr as and A.Vespignani. Evolution and Structure of the In ter - net: A StatisticalPhysics Approach. Cambridge U n iversity Press, 2004 .
[24] Y. Shavitt and E. Shir. DIMES: let the int ernet measure it self . SIGCO MM ComputerCommunication Review, 35(5):71–74, 2005 .
[25] F. Viger, A. Barrat, L. Da ll’As t a, C. H. Zhang, and E. D. Kolaczyk. W ha t is the real size of a sampled net work? The case of the Internet. P hysica l Review E, 75 (5) :056111 + , May 2007 .
[26] F. Viger and M. L a t ap y. E fficient and simple genera t ion of random s im- ple conn ect edgraphs wit h prescribed degree sequence. 11th In terna tiona l Computing and CombinatoricsConference, 3595:440–449, 2005 .
[27] W. Willinger, D. Alderson, and J. C. Doyle. M a t hem a t ics and the Int er - net : A Source of Enormous Confusion and Great P ot ent ia l. Notices of the American Mathematical Society, 56,May 2009 .