Embed Size (px)
Citation preview
Electronic copy available at: http://ssrn.com/abstract=1162654
DECENTRALIZATION, PERFORMANCE EVALUATION AND
GOVERNMENT PERFORMANCE
Tjerk Budding* and Tom Groot
Vrije Universiteit Amsterdam Faculty of Economics and Business Administration
Amsterdam Research Center in Accounting De Boelelaan 1105, room 2E-43
1081 HV Amsterdam, The Netherlands Telephone +31 20 598 60 40
Telefax +31 20 598 98 70 E-mail: [email protected]
*) corresponding author

Electronic copy available at: http://ssrn.com/abstract=1162654
2
DECENTRALIZATION, PERFORMANCE EVALUATION AND
GOVERNMENT PERFORMANCE
Abstract In order to improve the organizational performance of governmental entities, there has been a
tendency in many countries to introduce management reforms that are believed to prevail in
private companies. The term ‘NPM’ (New Public Management) was coined to label these re-
forms. NPM stresses – among many other things - that public services have to be rationalized
and emphasis put on quantification as a means of demonstrating achievements (efficiency
gains, new levels of performance) and of holding responsible people accountable. In the
Netherlands, many municipalities have adopted NPM reforms.
This paper considers the results of these NPM reforms. In particular, it focuses on two re-
forms: the decentralization of decision making authority to middle managers and the greater
emphasis on accounting criteria for performance evaluation. This research explores whether
managers are indeed motivated by such measures using a contingency-type approach.
In this paper, the survey data (214 observations) are analyzed by using Partial Least Squares
(PLS). The analysis shows that the performance evaluation system of municipal departments
is hardly related to the level of decentralization. Furthermore, it is shown that the effect of the
use of accounting performance measures for evaluation purposes on the performance is mod-
erated by the level of environmental uncertainty: the use of these accounting criteria results in
more goal clarity at higher levels of uncertainty. However, we also found that managers are
more concerned about their performance evaluation in these circumstances. These findings
confirm the claim of Hartmann (2000) that environmental uncertainty may have multiple ef-
fects. Organic processes are found to be an important moderator: especially open communica-
tion increases the positive effects of using accounting performance measures at higher levels
of environmental uncertainty and it mitigates the negative effects. The use of objective nonfi-
nancial indicators (such as indicators expressing the quality of services) overall has a positive
effect. For the use of subjective nonfinancial indicators we found opposite effects. Finally, we
show that goal clarity of the managers and agreement on evaluation criteria are positively re-
lated to the performance of municipal departments.
Keywords: Qualitative analysis; Partial Least Squares; Reliance on Accounting Performance
Measures (RAPM); Environmental Uncertainty

3
DECENTRALIZATION, PERFORMANCE EVALUATION AND GOVERNMENT PERFORMANCE
1. INTRODUCTION
Starting from the 1980s important management changes have been introduced in the public
sector in many countries. These changes are frequently labeled ‘New Public Management’
(NPM) (Hood, 1995). NPM should not be considered as an overall theory, but rather as a set
of ideas, theories and techniques that aim to improve government. NPM has two important
characteristics. The first characteristic is the introduction of marked-based techniques in the
public sector, such as the introduction of competition within the government and with organi-
zations outside the government. The second characteristic aims at shifting the emphasis in
control orientation: instead of focusing on the processes, the control should focus on the re-
sults.
In actual practice, governments in many countries have indeed made considerable efforts to
introduce results oriented control. In the Netherlands, the country which this paper focuses on,
especially the local governments have taken many initiatives to modify their planning and
control processes. Many municipalities decentralized their organizational structure and gave
middle managers the authority as well as the responsibility for the management of their enti-
ties. Performance management facilitated the introduction of results control: measurable and
explicit goals should be formulated, results should be measured and managers should be eva-
luated on their performance. At the end of the eighties, the Ministry of Internal Affairs intro-
duced the Policy and Management Instruments (PMI) project1, which stimulated municipali-
ties to apply private sector tools, such as output budgeting, responsibility accounting and cost
allocation (ter Bogt, 2004, p. 244). This project can be considered one of the key manifesta-
tions of NPM in the Netherlands.
Although research shows that the reforms attracted considerable attention in Dutch local gov-
ernment, there is considerable doubt about the successfulness of these changes. Several evalu-
ation studies have been published which were critical of the successes of the PMI project (van
Helden, 1998; Aardema, 2002). These findings correspond with international literature which
on the one hand shows that NPM-like reforms have been implemented to a large extent and
on the other hand question the success of these changes (e.g., Pollitt and Bouckaert, 2004;

4
Guthrie et al., 2005). One might expect that time would be taken in order to evaluate the re-
forms, but in daily practice this is not the case: some recent studies presenting an overview of
governmental reforms claim that NPM is ‘... here to stay’ (Lapsley, 2008) and ‘… there is no
way back’ (OECD, 2005). At the same time, these studies suggest that more attention should
be paid to the characteristics of the organization and its environment, in order to consider the
appropriateness of the reforms for the organization.
This project focuses on the way Dutch municipal middle managers are evaluated by their su-
periors. These managers have a superior in the bureaucracy, most often the division manager
or the municipal executive, as well as a superior in the political system, one of the aldermen.
Budding (2004) found that these managers seem not to be evaluated regularly by the alder-
men, but (only) by their direct civil superiors. Furthermore, this study revealed that these
managers are evaluated on a rather broad range of criteria, in which results and costs oriented
criteria are equally important as other criteria, such as the way they handle their personnel.
This finding is supported by ter Bogt (2003) who finds that municipal aldermen evaluate mu-
nicipal top managers on a broad range of criteria. Based on his analysis, he adds one evalua-
tive style to the styles as distinguished by Hopwood (1973), namely the facilitating style. In
this style, considerable attention is paid to the extent to which a manager acts as a ‘facilitator’,
i.e. ensures that the organization and alderman concerned perform well in the short and long
term (ter Bogt, 2003, p. 316). This finding corresponds with BSC literature advocating the use
of a rather broad set of criteria to evaluate the performance of organizations and their respec-
tive managers (Kaplan and Norton, 1992).
The main goal of this paper is to explore the antecedents and effects of the performance mea-
surement systems (PMS) of Dutch municipalities. In accordance with the contingency litera-
ture, special attention is paid to conditions that seem to be important for the appropriateness
of PMSs.
The structure of this paper is as follows. The next section gives a short overview of literature
on the appropriateness of PMSs. Then the research object, i.e. the Dutch municipalities, is
introduced. This is followed by a literature review in which the hypotheses and research ques-
tions are introduced. The next section describes the study design and method. We will then
present the findings of this study. At the end of the paper the main findings are discussed and
some avenues for further research are suggested.
1 In Dutch: het BBI (Beleid en Beheers Instrumentarium) project

5
2. APPROPRIATENESS OF PMS
In analyzing the appropriateness of PMS, three streams of literature especially seem to pro-
vide relevant insights: the Reliance on Accounting Performance Measures (RAPM) literature,
the contingency-based research in management accounting (hereafter referred to as contin-
gency-based research) and the Balanced Scorecard/nonfinancial measures literature (hereafter
referred to as BSC literature). The RAPM literature is about the behavioral and organizational
effects of using accounting performance measures for the performance evaluation of subordi-
nate managers. The contingency-based research analyses Management Control Systems
(MCS) within its organizational context, attempting to explain the effectiveness of MCS by
examining designs that best suit the organization’s environment, technology, size, structure,
strategy and culture. The BSC literature claims that financial measures provide a rather nar-
row overview of the results of organizations and suggests that nonfinancial measures should
be added to these measures.
RAPM
The starting point for the RAPM literature in management accounting is frequently traced
back to the studies by Hopwood (1972) and Otley (1978). Hopwood (1972) analyzed the be-
havioral consequences of evaluation styles of managers. He distinguished three evaluation
styles (Hopwood, 1972, p. 160):
1. Budget Constrained Style – in organizations using this style the evaluation is primarily
based on the subordinate manager’s ability to meet the budget on a short-term basis.
2. Profit Conscious Style – the performance of the subordinate manager is evaluated on the
basis of his ability to increase the general effectiveness of his unit’s operations in relation
to the long-term purposes of the organization.
3. Nonaccounting Style – accounting data play a relatively unimportant part in the supervi-
sor’s evaluation of the subordinate manager’s performance.
In his study, Hopwood found that the Budget Constrained Style could lead to higher job-
related tension. However, some years later, Otley (1978) replicated Hopwood’s study and
found contradictory results. In his study, the use of the Budget Constrained Style was asso-
ciated with higher managerial performance than other performance evaluation styles. Since
there are no fundamental differences in the measurement instruments used by Hopwood and

6
Otley, the differences in their findings might be attributed to situational differences (Hart-
mann, 2000; Noeverman, 2007).
As Hartmann notes, the contradictory findings of these studies provided a strong incentive for
further empirical research (Hartmann, 2000, p. 454). In 2000, more than 20 years after Otley’s
publication, a special issue of Accounting, Organizations and Society was published dealing
with the state of affairs in RAPM research. Although it concluded that there is now a vast
number of papers in management accounting and control literature on RAPM (Hartmann re-
ports 57 papers in his 2000 AOS publication), another finding was that these studies still fail
to provide clear insight into the behavioral consequences of using accounting measures for
performance evaluation. Furthermore, the studies show contradictory findings. These contra-
dictory findings might be attributed to differences in measurement and the selection of con-
tingency factors.
Otley and Fakiolas (2000) show that the conceptualization and the measurement instruments
used vary among researchers. The main differences in measurement result from the different
ways of scoring the items. In Hopwood’s study a ranking procedure was used to determine the
evaluation style. First, he asked the respondents to give a 5-point Likert importance score to
the eight questionnaire items. Hereafter, the respondents were asked to rank the three most
important factors in order of their importance by attaching the ranks ‘1’, ‘2’ and ‘3’. Only this
ranking information was then used to determine the evaluation style:
• If the item “meeting the budget” was ranked in the top three ranks given, but the item
“my concern with costs” did not appear in these top three ranks, then the style was cate-
gorized as Budget-Constrained.
• If the item “my concern with costs” was ranked in the top three ranks given, but the item
“meeting the budget” did not appear in these top three ranks, then the style was catego-
rized as Profit-Conscious.
• If neither of the two items above appeared in the top three ranks given, then the style was
categorized as Non-Accounting.
• If both items appeared in the top three ranks given, the style was categorized as Budget-
Profit (Otley and Fakiolas, 2000, p. 500).
Brownell (1985) was the first published paper in which the evaluation style was set by using
the importance scores instead of the ranking scores. He used a single overall ranking score
that was calculated by summing up the accounting related items (“meeting the budget” and

7
“concern with costs”). The other items were not taken into account. Otley and Fakiolas (2000)
critically remark that this approach should be grounded by reporting a high inter-correlation
of these items, which Browell (1985) fails to do. The Brownell (1985) approach was also used
by other authors. Dunk (1989 and 1990) used this score to dichotomize between high and low
reliance on budgetary control. However, as Otley and Fakiolas show, this overall score can
only be used to distinguish the non-accounting (low score) from the other styles (score of 6
and higher). Harrison (1992 and 1993) divided the score of the accounting items by the non-
accounting items, expressing the relative importance of the accounting items to the non-
accounting items. In none of the studies reported by Hartmann (2000) a distinction is made
between different kinds of non-accounting items. All items are treated as a common group.
Most researchers used Hopwood’s original items, but modified instruments were also devel-
oped, some with only small (cf. Otley, 1978; Brownell, 1985; for an overview see Otley and
Fakiolas, 2000, p. 499) and some with mayor modifications (Hirst, 1983). The primary reason
for adapting the instruments was to modify them to the organizational context in which the
research project was conducted. Some authors considered Hopwood’s original instrument as
too much focused on manufacturing companies (Hirst, 1983; Hirst and Yetton, 1984), which
is questioned by other authors (Otley and Fakiolas, 2000).
Although nowadays there is a vast amount of papers in management accounting and control
literature on RAPM, these papers mainly focus on manufacturing companies (refer to Table 4-
1). Only 2 of the 54 papers in this overview focus on public sector organizations (Williams et
al., 1990; Macintosh and Williams, 1992), whereas 4 papers use data from public and private
organizations, without treating these organizations as subsamples (Macintosh and Daft 1987;
Ross, 1994 and 1995; Hartmann, 2005). Furthermore, most studies use a survey approach,
examining middle managers’ responses to budgetary control. Most studies are conducted in
the US, Australia, UK and Singapore. Only two papers (van der Stede, 2000; Hartmann,
2005) research organizations in continental Europe.
*** insert Table 4-1 about here ***
Contingency-approach
In Management Control literature, considerable attention has been paid to the suitability of
performance measurement systems in specific circumstances (Chenhall, 2003). In this contin-

8
gency approach, fit is understood as a positive impact on performance due to certain combina-
tions of context and structure. It is assumed that high-performing as well as low-performing
firms do exist as a result of more or less successful combinations of context and structure
(Gerdin and Greve, 2004, p. 307). Starting from the 1970s this approach has been used by
many authors (Otley, 1980). Especially the following aspects were explored: the nature of the
environment, technology, size, structure, strategy and national culture (Chenhall, 2003). In
RAPM studies, this contingency approach also became quite popular (Hartmann, 2000).
However, one of the most important problems in a contingency-based approach is that it ‘all
depends’. It is very hard to select those contingency factors that are important, because so
many variables may have influence. This has also important implications for the data collec-
tion and analysis, as it would be desirable to include all relevant variables in one model, in
order to analyze their relative importance. As Chapman (1997) remarks, this has resulted in
the observation that ‘Contingency studies have come to be seen as large scale, cross sectional,
postal questionnaire based research, which examines the interaction of a limited number of
variables.’ Many review articles have been published (Otley, 1980; Dent, 1990; Langfield
Smith, 1997) showing a lack of an overall framework which could have helped to explain the
sometimes even contradictory findings (Chapman, 1997, p. 189). However, Chapman (1997)
and Hartmann (2000) both point to uncertainty that seems to be an underlying element for
differences in findings. Hartmann (2000) demonstrates that ‘no support exists for a universal
negative effect of uncertainty on the appropriateness of RAPM’ (p. 472) and that the results of
a positive effect of uncertainty on the appropriateness of RAPM are neglected. This project
aims at providing more insight into the effects of uncertainty on the use of accounting meas-
ures for performance evaluation.
Nonfinancial measures
In the late 1970s and 1980s, authors expressed a general dissatisfaction with traditional per-
formance measurement systems. These traditional systems, developed from costing and ac-
counting systems, were criticized for encouraging short termism, lacking strategic focus, en-
couraging local optimization, encouraging minimization of variance rather than continuous
improvement and not being externally focused (Bourne et al., 2000). Furthermore, they fail to
signal changes in the company’s economic value, as an organization makes substantial in-
vestments (or replaces past investments) in intangible assets, such as the skills, motivation,
and capabilities of its employees, customer acquisition and retention, innovative products and
service, and information technology (Kaplan, 2001, p. 357). In an attempt to overcome these

9
criticisms, performance measurement frameworks have been developed to encourage a more
balanced view. The most well known instrument resulting from these attempts is the Balanced
Scorecard (BSC), developed by Kaplan and Norton (1992). Kaplan and Norton call their sco-
recard balanced as it represents a balance between 1. external measures for shareholders and
customers and internal measures for critical business processes, innovation, learning and
growth, 2. the measures are balanced between the outcome measures – the results from past
efforts – and the measures that drive future performance and 3. the measures are balanced be-
tween objective, easily quantified outcome measures and subjective, somewhat judgmental,
performance drivers of the outcome measures (Kaplan and Norton, 1996, p. 10). The Ba-
lanced Scorecard translates mission and strategy into objectives and measures, organized into
four perspectives: financial, customer, internal business process, and learning and growth.
Therefore, the BSC does not only focus on (more short term) financial indicators, but also
pays attention to enablers of (longer term) success. Although the BSC was originally devel-
oped for the private sector, some recent studies also demonstrate the usefulness of the BSC
for non-profit (Kaplan, 2001) and government organizations (Wisniewski and Olafsson,
2004).
3. NPM at DUTCH MUNICIPALITIES
This study analyses decentralization and the use of accounting measures for performance
evaluation in Dutch municipalities. Local government in the Netherlands is considered the
most important and visible level of sub-national government in the Dutch decentralized uni-
tary state (Hendriks and Tops, 2003). It has an autonomous position and can initiate local
policies it considers important for the local community. This freedom is constrained by gen-
eral rules and requirements set by national and regional governments – governments that in
turn are constrained by a general commitment to subsidiarity, power sharing and decentraliza-
tion, and a particular dependence upon local knowledge and implementation capacity vested
in local government (Hendriks and Tops, 2003). Municipalities employ important activities
such as physical planning, public housing, transport, social services, education, culture and
welfare. Some of these activities are obligatory; some are at the discretion of the municipality.
Municipalities consist of two systems: the political bodies (the municipal council and the
board of mayor and aldermen) and the bureaucracy.
Since the mid-1980s, Dutch municipalities have implemented a variety of management re-
forms (ter Bogt and van Helden, 2000; ter Bogt, 2001). These developments were stimulated
10
by spending cuts, national legislation and the Policy and Management Instruments (PMI)
project2. In this paper we will focus on two reforms: internal decentralization – that is the
transfer of decision making authority to subordinate managers – and changes in performance
evaluation. Many municipalities changed their organizational structure from a more central
model to a decentralized model, in which subordinate managers were given more comprehen-
sive decision making authority and which were more focused on customers or custom-related
processes. Furthermore, many municipalities changed their planning and control processes,
aiming to provide more transparency and linking municipal policy and budgets.
Although the reforms attracted considerable attention in Dutch public sector – especially the
PMI project -, we do not know much yet about the results achieved (van Helden and Jansen,
2003). After a review of several studies, Aardema (2002) concludes that the PMI project did
not have much impact on management practices in Dutch municipalities (see also van Helden,
1998). Furthermore, ter Bogt and van Helden (2000) have shown that there is a wide gap be-
tween formal accounting changes and their actual application, implying that the formal level
of implementation (such as reporting performance indicators) is not a good indication for the
actual changes in daily practice. However, ter Bogt (2008) and Groot and Budding (2008)
reveal a somewhat more optimistic view of the successfulness of the management reforms.
They interviewed and surveyed more than 100 people actively involved in public sector man-
agement and most respondents reported (slightly) improvements in performance, partly be-
cause of NPM reforms.
4. Development of hypotheses
Performance Measurement Systems
As has been shown in the previous section, many Dutch municipalities decentralized their
organization structure in the 1990s. Decentralization is viewed here as the locus of decision
making authority that is delegated to the department manager by his/her superiors (cf. Govin-
darajan, 1986). In most Dutch municipalities, managers were given more comprehensive de-
cision making authority (DMA) with regard to financial as well as personnel affairs, generally
as an important component of implementing integral management. We do not know, howev-
er, if this decentralization also led to changes in the performance measurement system. NPM
2 In Dutch: het BBI (Beleid en BeheersInstrumentarium) project
11
calls for both decentralization and accountability for results. Both reforms seem to be interre-
lated: More freedom for middle managers also means an obligation for them to provide more
and better information and to account for their actions (ter Bogt and van Helden, 2000). We
expect this information to be explicit and related to clearly defined targets (Hood, 1995), i.e.
result oriented and objective.
In Management Accounting Research there is only limited understanding of the antecedent
conditions that influence the design of management accounting systems (Bouwens and Aber-
nethy, 2000, p. 221). Chenhall and Morris (1986) found that decentralization is associated
with a preference by decentralized managers for aggregated and integrated information. This
finding is confirmed by Abernethy et al. (2004) who found that corporate management relies
more on divisional summary performance measures (rather aggregated and decision specific
information) when they have delegated authority to divisions (Abernethy et al., 2004, p. 547).
In a study using hospital data, Abernethy and Lillis (2001) found that autonomy is positively
related to the use of the performance management system, especially the use of resource man-
agement data (including cost and productivity data). Based on a study among 34 firms, Gor-
don and Narayanan conclude that decentralization leads to the use of more external, nonfinan-
cial and ex ante information (Gordon and Narayanan, 1984, p. 42).
Based on both NPM and Management Accounting literature therefore our first hypotheses
are:
H1 Decentralized Decision Making Authority (DMA) is positively associated with the
use of (a) Accounting Measures (AM) and (b) objective nonfinancial measures (NF)
for performance evaluation.
H2 Decentralized Decision Making Authority (DMA) is negatively associated with the
use of subjective nonfinancial measures (SUB) for performance evaluation.
PMS effects
In this project, we want to find out under what circumstances it is appropriate to hold manag-
ers accountable for results which might lead to improved organizational performance. In the
RAPM literature, the question is discussed how the appropriateness of APM should be meas-
12
ured. In this paper, we follow Hartmann (1997) and focus on two aspects, goal clarity (GC)
and agreement on evaluated criteria (AEC). We think that one of the most important conse-
quences of PMS is that it provides more clarity over the goals to be attained. Recent literature
has shown that in order to manage human capital effectively and to attain strategic success, it
is essential for employees to have “line of sight” with their organization’s strategic objectives
(Boswell, 2006). Therefore, management must clearly communicate these objectives. This
claim is supported by the goal setting theory. This theory states that, given goal commitment,
a specific challenging goal leads to higher task performance that a vague goal, such as ‘do
your best’ (Locke and Latham 1990). This assertion has been supported in numerous empiri-
cal studies (Locke and Latham, 2002).
However, evidence of this theory in public sector is scarce. Using data derived from hospital
managers, Bouillon et al. (2006) demonstrate that significant economic benefits occur when
organizations realize goal congruence (manager consensus). Hyndman and Eden (2001) inter-
viewed the chief executives of nine agencies and they indicated that a focus in mission, objec-
tives, targets and performance measures had improved the performance of the agency. Using
data from 93 managers of Dutch public sector organizations, Verbeeten concludes that the
definition of clear and measurable goals is positively associated with both quantity perfor-
mance (efficiency, production targets) as well as quality performance (accuracy, innovation,
employee morale) (Verbeeten, 2008, p. 441-442).
Another important attribute of a PMS is that it adds to fairness of the evaluation. Hartmann
(1997, p. 40) argues that prior RAPM studies suggest that disagreement with evaluation crite-
ria is an important consequence of using APM in uncertain environments, and an important
cause of subsequent job-related tension. Such tension negatively influences the organization’s
performance.
In this study, we explore the effects of different groups of performance measures. We distin-
guish between three groups: accounting measures (AM), objective nonfinancial measures
(NF) and subjective nonfinancial measures (SUB). In RAPM literature the attention is rather
limited to the use of accounting measures (refer to paragraph 3). BSC literature has shown the
importance of using a broader set of performance measures, as nonfinancial measures may
express important conditions for more long-term organizational success.

13
The RAPM literature provides mixed evidence with regard to the effects of using accounting
performance measures (AM). AM are rather objective measures which can be measured and
defined. The use of AM can function as a ‘buffer’: budgets provide a buffer between the wid-
er, strategic and external environment of the organization, and the manager’s narrower, func-
tional and internal working environment (Hartmann, 2005, p. 244). The use of accounting
measures may provide structure and certainty, particularly for those managers whose roles
have been defined ambiguously (Marginson and Ogdon, 2005, p. 436). However, the use of
accounting performance measures may imply controllability problems, i.e. managers are held
accountable for results beyond their control. There can be more debate at evaluations about
the aspects managers should be held accountable for.
Therefore, our hypotheses with regard to the use of AM are as follows:
H3 The use of accounting measures (AM) for performance evaluation is (a) positively
associated with Goal Clarity (GC) and (b) negatively associated with Agreement on
Evaluation Criteria (AEC).
Recent performance measurement literature emphasizes the positive attributes of using nonfi-
nancial measures for performance evaluation. Banker et al. (2000) have shown that by includ-
ing nonfinancial measures in the compensation contract, managers more closely align their
efforts along the dimensions emphasized by those measures, resulting in improvements in
performance3. Lau and Sholihin (2005) state that the use of nonfinancial measures may con-
tribute to the perceived fairness of the evaluation procedures. Subordinates generally view
these measures as meaningful and relevant. They provide a broader overview of a subordi-
nate’s accomplishments than if only financial measures are used. The nonfinancial measures
comprise both lagging and leading indicators, thereby including measures that drive future
performance. This may add to the fairness as perceived by subordinates investing in long-term
objectives (Lau and Sholihin, 2005, p. 393). Using a dataset of 70 Indonesian manufacturing
organizations, Lau and Sholihin show that the use of nonfinancial measures indeed contri-
butes to the subordinate’s perceived fairness of the evaluation procedures. Said et al. (2003)
hypothesize that the performance consequences of using nonfinancial measures may depend
on contextual factors, environmental factors, and strategic plans of firms. They expect that
regulated industries more extensively use nonfinancial measures for performance evaluation,
3 See also Anderson et al. (1994), Amir and Lev (1996) and Behn and Riley (1999) amonst others for
studies showing positive effects of using nonfinancial measures.

14
because in these industries the regulator is likely to link profits or rate increases to the
achievement of nonfinancial goals, such as customer satisfaction, reliability and employee
safety. Using a dataset of 1,441 observations from various industries, they indeed find support
for the hypothesis that nonfinancial measures are used more intensively by regulated indus-
tries (see also Itnner et al, 1997). In our sample, we analyze the performance evaluation of
municipalities, which are strongly regulated by central government. Following Said et al.
(2003), we therefore expect the positive effects of using nonfinancial measures to be even
greater than in other industries.
Based on this literature overview, we hypothesize:
H4 The use of objective nonfinancial measures (NF) for performance evaluation is posi-
tively associated with (a) Goal Clarity (GC) and (b) Agreement on Evaluation Criteria
(AEC).
As discussed before, the introduction of New Public Management’s practices in Dutch muni-
cipalities called for the use of more objective instead of subjective indicators for performance
evaluation. However, ter Bogt (2003) and Budding (2004) have shown that in daily practice
these subjective performance indicators, such as having a feeling for political wishes and
needs, showing initiative, having good relations with superiors and contributing to a positive
image of the municipality4, are still used frequently. We expect, however, that the use of these
measures for performance evaluation is not considered positive by the subordinate managers.
The measurement of these indicators is subjective, they heavily depend on the perception of
the superior. Therefore, there can be more debate about the measurement and the interpreta-
tion of these indicators. Furthermore, they do not provide more clarity over the goals, as these
measures do not express clear tasks or responsibilities of the managers. Therefore, our hypo-
thesis is as follows:
H5 The use of subjective nonfinancial measures (SUB) for performance evaluation is ne-
gatively associated with (a) Goal Clarity (GC) and (b) Agreement on Evaluation Cri-
teria (AEC).
4 The first two items are mentioned in ter Bogt’s study (2003), the last two in Budding (2004).

15
Contingencies
Based on the RAPM literature and the findings from previous research (Budding, 2004), we
analyse five groups of contextual variables that might influence the relation between manag-
ers being held accountable and organizational performance. These four groups are: 1. Envi-
ronmental Uncertainty (EU), 2. Task Uncertainty (TU), 3. Funding Uncertainty (FU), and 4.
Organic Processes (OP). For hypothesizing the effects of these groups of uncertainty, we
mainly use arguments derived from RAPM literature and analyze the influence of these un-
certainties on the relationship between the use of accounting measures (AM) and our output
variables, Goal Clarity (GC) and Agreement on Evaluation Criteria (AEC). We choose to fo-
cus on the accounting measures, because New Public Management especially advocates the
use of these measures. Although we also analyzed the effects of using objective and subjec-
tive nonfinancial measures (NF and SUB respectively) on our output variables and the influ-
ence of the moderators on these effects, we do not develop hypotheses for these relationships,
as the literature on the moderating effects of using nonfinancial measures on performance is
still rather limited5. Therefore, these effects are analyzed in an exploratory way. The inclusion
of the nonfinancial measures enables us to compare the effects of different measures and ana-
lyze their relative effects.
Environmental Uncertainty (EU)
Managers feel they are confronted with many uncertainties. Some of these have to do with the
environment of the departments, such as uncertainties stemming from the clientele and the
behavior of suppliers. These uncertainties are more or less the same as in a private sector en-
vironment (e.g. Buchko, 1984; Milliken, 1997). We expected that uncertainties stemming
from the political environment would also be important. Because these uncertainties are com-
parable to commercial organizations, we follow the arguments that are used in RAPM litera-
ture to analyze the influence of environmental uncertainty (EU) on the relation between the
use of accounting measures (AM) for performance evaluation and the outcome variables Goal
Clarity (GC) and Agreement on Evaluation Criteria (AEC).
In RAPM literature there is mixed evidence with regard to the (interaction) effect of EU on
the relation between the use of accounting measures for performance evaluation and output

16
variables, such as performance. Some studies showed a negative effect of environmental un-
certainty on the relationship between reliance on the use of accounting measures for perfor-
mance evaluation and performance (Hirst, 1981 and 1983; Brownell, 1987; Govindarajan,
1988), while other studies do not give evidence for this effect (Merchant, 1984; Brownell,
1985; Lau et al., 1995). However, empirical evidence is increasingly showing that using ac-
counting measures for performance evaluation is especially useful under conditions of high
environmental uncertainty (Ezzamel, 1990; Marginson and Ogden, 2005).
Hartmann (2000) states that there seems to be a paradox with regard to uncertainty. On the
one hand there are the negative effects of using AM under high environmental uncertainty.
These negative effects seem to stem especially from violating the controllability principle
(Hartmann, 2000, p. 471). This principle is about the effects of evaluating managers on items
beyond their control. Generally, it is opposed that evaluating managers on items beyond their
control is considered negative by the subordinates. Therefore, evaluating managers on ac-
counting measures that are not controllable by them may result in tension because the perfor-
mance measurement may be incomplete and irrelevant (Hartmann, 2000, p. 471) and there-
fore, not considered ‘fair’.
On the other hand, the use of AM may also be useful under high environmental uncertainty.
Using budgets enhances managers’ autonomy. Furthermore, uncertain conditions require
more information sharing, which mostly takes place within the context of formal accounting
and control procedures (Hartmann, 2005, p. 244). Finally, budgets may have a buffering func-
tion against the influence of environmental uncertainty. In uncertain conditions, the account-
ing measures provide clarity with respect to the goals to be attained and the evaluation criteria
(e.g., simply not overrunning the budget). Analyzing an organization in the ‘global communi-
cations business’, with a fast-moving business environment, Marginson and Ogden (2005)
indeed show that in this organization budgets offer ‘a source of structure and certainty’ for the
managers. Hartmann (2005) supports this finding and shows that high environmental uncer-
tainty is associated with a more positive opinion of managers about the appropriateness of
using accounting measures for performance evaluation.
Because of the mixed empirical findings thus far, we formulate the hypothesis in the null-
form:
5 Said et al. (2003) is a positive exception. They show that the association between nonfinancial meas-
ures and firm performance is contingent on whether the use of nonfinancial measures matches the

17
H6 The effect of using accounting measures (AM) for performance evaluation on (a)
Goal Clarity (GC) and (b) Agreement on Evaluation Criteria (AEC) is not affected by
Environmental Uncertainty (EU).
Task Uncertainty (TU)
Managers are also confronted with uncertainties that stem from the tasks they perform. If the
tasks of the manager and his employees are less repetitive and there is less knowledge as to
how to perform the tasks, it may be more complex to define the goals and for the manager to
know what should be done (cf. Hirst, 1987). Task uncertainty may also lead to confusion
about the evaluation. If tasks are highly uncertain, it is more difficult to draw up budgets, be-
cause reliable information is missing. Furthermore, under such circumstances it is also harder
to measure accomplishments. Therefore, the use of accounting measures is less appropriate.
Several studies have proved that higher task uncertainty is indeed negatively associated with
the use of accounting based controls (Hirst, 1983; Rockness and Shields, 1984; Abernethy et
al., 1997; see also Chenhall, 2003 for an overview).
With respect to the interaction effect on GC, RAPM literature gives mixed evidence. First,
accounting performance measures may add positively to the structure of the working envi-
ronment, in terms of providing clear and specific objectives. This may be especially appre-
ciated under high task uncertainty and give managers ‘line of sight’. The use of accounting
measures may give managers direction as to what should be done. On the other hand, task
uncertainty leads to confusion about the way in which the budget targets should be attained,
because there is limited knowledge with respect to the way this should be realized and more
variability in the tasks. Hartmann (2005) shows that managers indeed dislike to be evaluated
on accounting performance measures under high levels of task uncertainty. We do not know
which effect is stronger and therefore formulate the hypothesis for the effect on GC in null-
form.
For AEC, we expect that task uncertainty will lead to job related tension, because managers
disagree with the potentially incomplete, irrelevant and uncontrollable accounting perfor-
mance measures (Hirst, 1983). Therefore, we formulate this part of the hypothesis in the
negative direction.
firm’s characteristics.

18
H7 The effect of using accounting measures (AM) for performance evaluation on (a)
Goal Clarity (GC) is not affected by Task Uncertainty (TU) and the effect on (b)
Agreement on Evaluation Criteria (AEC) is negatively affected by Task Uncertainty
(TU).
Funding Uncertainty (FU)
Funding Uncertainty (FU) refers to a manager not being sure whether his department can get
enough resources for operations. In this paper, we aim to analyze the moderating effect of
funding uncertainty on the use of accounting criteria for performance evaluation on GC and
AEC. Prior literature on this effect is not available, but some studies have been published ana-
lyzing the influence of funding uncertainty on the design and use of cost accounting systems.
Geiger and Ittner (1996) show that organizations that are required to “pay their own way” by
fully covering costs through revenues or fees, implement more elaborate cost accounting sys-
tems and also use these systems more intensively. They argue that the requirements to be self
funding increase funding uncertainty, which in turn leads to more elaborate cost control. They
especially use two arguments for this hypothesis. Firstly, they point to the analytical model of
Zimmerman (1976) that suggests that non-profit organizations facing funding uncertainty
(Zimmerman uses the concept ‘budget uncertainty’) will place greater emphasis on budgets
and costs. Secondly, they draw the parallel between funding and environmental uncertainty,
suggesting that both increase the demand for decision-making information. Groot and Bud-
ding (2004) found that organizations that were confronted with lower funding as a result of
changing funding rules, charge tariffs that better represent actual cost levels. Furthermore,
Rockness and Shields (1986) find that research and development organizations facing greater
funding uncertainty placed more emphasis on budgetary controls. However, note that these
studies provide insight into the effects of funding uncertainty on the usefulness of accounting
data for decision making and do not give information about the effects of using AM for per-
formance evaluation.
We think that on the one hand the use of AM may be considered favorable since they are ra-
ther objective criteria. In situations of large funding uncertainty these objective criteria may
be experienced even as more useful than in situations with lower levels of funding uncertain-
ty. On the other hand, funding uncertainty may cause even additional tensions that a manager
may not have enough resources to reach the goals. As a result, the manager may be confused

19
as to which goals he should attain first given the limited resources. Furthermore, this may also
cause tensions at performance evaluation, because there is a risk of being evaluated negatively
for not reaching goals. Therefore, we formulate the hypothesis as follows:
H8 The effect of using accounting measures (AM) for performance evaluation on (a)
Goal Clarity (GC) and (b) Agreement on Evaluation Criteria (AEC) is not affected by
the level of Funding Uncertainty (FU).
Organic Processes
The previous phase of this research project (documented in Budding, 2004) analyzing the fac-
tors that may be contingent upon the effects of using AM for performance evaluation on or-
ganizational performance, revealed that in addition to external contingent factors, attention
should be paid to internal organizational conditions as well. These internal conditions seem to
be under-explored in management accounting research, although some recent publications
have drawn attention to this issue. Otley (2003, p. 323) claims that ‘individuals are affected
by a range of cultural differences beyond those of the nation in which they are brought up, or
in which they currently work.’ and that ‘… All of these aspects remain under-explored….’.
Manzoni (2003, p. 40) states that ‘the Management control community should devote more
attention to studying organizational factors (italics by Manzoni) that make new accounting
methods and systems so hard to implement successfully in practice.’ As early as 1967, Hofs-
tede (1967) made a plea to pay attention to organizational conditions that make management
control systems work effectively.
Chenhall and Morris (1995) and Emsley (2001) point to open and complete communication as
an important condition for the successfulness of using performance evaluation systems. Ems-
ley (2001) shows that the completeness of information that explains budget variances to the
superiors, affects subordinate managers’ ability to understand budget variances and explain
them to their superiors which, in turn, affects subordinates’ level of job related tension, espe-
cially where superiors use a budget-emphasis style of performance evaluation. Chenhall and
Morris (1995) analyze the influence of organic decision and communication processes on the
use of management accounting systems. They find that the combined effect of organic
processes and management accounting systems is associated with superior organizational per-
formance. Although Chenhall and Morris (1995) found two separate dimensions in their con-
struct, they did not analyze the effects of each dimension separately. The first dimension cap-

20
tured the formality of decision processes and openness of communications, and the second
focuses on emphasis of adaptability and change (Chenhall and Morris, 1995, p. 489-490). In
this study, we follow the approach of Chenhall and Morris and we use a construct Organic
Processes that is calculated by taking the average score of all items.
H9 The effect of using accounting measures (AM) for performance evaluation on (a)
Goal Clarity (GC) and (b) Agreement on Evaluation Criteria (AEC) is more positive
for higher levels of Organic Processes (OP).
Government Performance
Previously in this paragraph, we discussed how goal clarity and agreement on evaluation cri-
teria may enhance organizational performance as they represent the behavioral effects of us-
ing a performance evaluation system. Our last hypothesis is about this expected positive in-
fluence:
H10 (a) Goal Clarity (GC) and (b) Agreement on Evaluation Criteria (AEC) is positively
associated with Performance of the department (PD).
In Figure 4-1 our research model is displayed.
*** insert Figure 4-1 around here ***
5. Research method and sample
Data and sample selection
In this project, we want to analyze the implementation and consequences of two specific
NPM reforms, decentralization and changes in performance evaluation.
We aimed at including as much variation as possible, by sending a questionnaire to all Dutch
municipalities. Two municipal departments were the subject of this project: the “department
for civil affairs” (DCA) and the social security department (SSD). We included these two dif-
ferent departments, because this enabled us to analyze the influence of departments’ characte-
ristics on the results of our analysis. The department of civil affairs is responsible for the ad-
21
ministration and execution of marriage law, the provision of a system for the registration of
deeds (births, deaths and marriages), the issuing of driving licences and passports and other
services to citizens. Municipalities do not have much discretion in executing these activities:
they have to provide these services and have to meet certain quality standards (such as keep-
ing passports in a safe). These services can be measured quite easily. Social security depart-
ments are responsible for welfare and employment issues, such as providing help in finding
employment and paying allowances. In the Netherlands, the execution of these services is the
responsibility of municipalities. They have some discretion in executing these tasks: in paying
extraordinary allowances they can formulate their own policy, within certain boundaries.
Most municipalities have their own social security department, although some municipalities
subcontract a part of these services. Because we are interested in the actual results, we chose
the level of analysis at which results could be measured. Therefore, managers were contacted
in this project at the level of a separate identifiable unit.
In order to obtain the data, in November 2002 a questionnaire was sent to the social security
departments (SSD) and the departments of civil affairs (DCA) of almost all Dutch municipali-
ties. In the Netherlands, there were 496 municipalities in 2002. So the total number of ques-
tionnaires would theoretically be 992. However, we made some corrections on this research
sample. First, we excluded the four largest municipalities in the Netherlands (Amsterdam,
Rotterdam, The Hague and Utrecht) because each of them has special legal, administrative
and financial arrangements with the state that do not apply to other Dutch municipalities.
Second, we excluded the departments that participated in earlier stages of this research
project. We approached all other municipalities and asked the name of the manager of the so-
cial security department and of the department of civil affairs. In this way, we learned that
at some municipalities the manager of the social security department was also in charge of the
department of civil affairs. In other municipalities, the tasks of the social security depart-
ment were contracted out to another municipality or to an external organization in which sev-
eral municipalities cooperate in executing tasks in the area of social security (an ‘Interge-
meentelijke Sociale Dienst’ or ‘ISD’). Lastly, some municipalities informed us that a merger
with (an)other municipality(ies) would take place in the short term. Based on these correc-
tions, we came to a research sample of 834 departments. For our data selection we followed
the recommendations of Dillman’s Total Design Method, such as printing the questionnaire in
a booklet format, using several reminders, and making the questionnaire as easy and as inter-
esting to fill in as possible (Dillman, 1991).

22
The data were collected in the period between November 2002 and April 2003. We sent three
reminders. The first one was in the form of a Happy New Year card (December 2002). In
January, we sent a second copy of the questionnaire. In February, the respondents received a
fax message from us with a reminder. We enclosed a non-response card (January) or sheet
(February) to the reminders in 2003, in order to be informed about the reasons for non-
response.
We received 236 questionnaires, leading to a response rate of 28.3%. Furthermore, we re-
ceived 326 non-response cards or sheets, resulting in a total response percentage of 67.4%.
The reason given most frequently (refer to Table 4-2) for not responding was that filling in the
questionnaire was considered too time consuming. This reason was mentioned 192 times, but
many respondents also filled in this reason in the category ‘other reasons’. Another frequently
mentioned reason for not responding was that the manager had only recently been appointed
and therefore considered him/herself as not having enough experience to fill in the question-
naire.
*** inset Table 4-2 about here **
Representation analysis
We also analysed whether our sample offers a good representation of all Dutch municipalities.
Therefore, we calculated the mean costs per inhabitant for the DCA. We think this is an ap-
propriate indicator for the efficiency of a municipality, because every municipality has to pro-
vide a number of obligatory services in this area. The costs of SSDs were not considered ap-
propriate for measuring the efficiency as municipalities have more freedom to establish their
own policy with regard to this policy area. Furthermore, the costs for the SSD depend to a
larger extent on the policy and social-demographic characteristics of the municipalities.
Our results (refer to Table 4-3) show that there is only a small difference between the mean
costs for DCAs for our sample (EUR 27.31) and the mean costs for all Dutch municipalities
(EUR 25.69). The costs of the municipalities from which the managers returned the non-
response card are also comparable (EUR 26.31). There are no statistically significant differ-
ences in costs between the groups. However, the average size of the municipalities that re-
turned the questionnaire was statistically significantly higher (refer to Table 4-4) suggesting a
small bias in our sample (relatively more large municipalities answered our questionnaire).
23
Furthermore, the mean costs for the DCA are lower for municipalities that responded before
the second reminder (EUR 25.75) than for the municipalities that responded after they re-
ceived this second reminder (EUR 30.44, refer to Table 4-3). However, the differences are not
statistically significant.
*** insert Table 4-3 and Table 4-4 about here ***
In several cases (13 times), the name of the respondent did not correspond to the name of the
one to which the survey had been sent. For these cases, we checked whether the respondent
indeed was a manager of the department. For two cases, this resulted in the exclusion for the
analysis. Furthermore, we did a missing value analysis (MVA). This analysis showed that the
number of missing values for the ISDs was quite high. This was due to the fact that the con-
trol and governance structure of the ISDs differed from the DCAs and SSDs. As a result,
some questions did not apply or were not recognizable for the ISD managers. Therefore, we
decided to exclude the 6 ISDs from the analysis. We also did a missing value analysis for the
remaining cases. 14 cases had more than 2 missing items for one of the constructs in the anal-
ysis and were list-wise excluded. As a result 214 surveys were considered appropriate for the
analysis (refer to Table 4-5). We used SPSSs Estimation Maximalisation (EM) algorithm to
impute the missing values, after ensuring that the data were missing completely at random
(MCAR) using Little’s MCAR test. We imputed less than 5% of our variables.
The response rate for the DCAs was higher than for the SSDs (refer to Table 4-5). This is
partly due to the fact that some municipalities cooperate with other municipalities in social
security activities, reducing the number of autonomous SSDs.
*** insert Table 4-5 about here ***
Sample characteristics
Although a municipal department should be considered a business unit, it should be noticed
that the average number of employees in the area of responsibility of the respondents is much
lower in this research than in other RAPM research projects. The average number at this
project is 22.3, whereas the number is 79.0 in the project of Hartmann (1997). Furthermore,
the average respondent appears to be mid-aged (47.5), well educated and with a great deal of
experience with the organization (12.4 years) and the function (11.2 years).
24
Measurement of variables
In this paragraph, the design of the measurement instruments used will be briefly discussed.
In Table 4-6 some descriptives of the variables are displayed.
*** insert Table 4-6 about here ***
Independent variables
Decentralization
The level of decentralization is measured here as the locus of decision-making authority that
is delegated to the department manager by his/her superior (Govindarajan, 1986). Several key
decision areas were identified, namely: 1) hiring and firing of personnel on low and mediate
hierarchical levels, 2) authorizing large investments, 3) giving bonuses, 4) determining wage-
increases and 5) exceeding the budget (cf. Pugh et al., 1968). A self developed eight-item
scale (cf. Singh, 1986) was used to measure the degree of decentralization. Factor analysis
revealed two dimensions: items related to decision making authorities with regard to financial
aspects (such as the authorization of large investments) and those related to personnel aspects
(such as hiring and firing of personnel). The dimensions have a satisfactory Cronbach α of
0.89 and 0.61 respectively. As the dimensions are highly correlated (r=0.52 at p<0.001) and
previous literature did not suggest other effects of both dimensions, we added the scores of
both dimensions, expressing the decision making authority of a middle manager. The instru-
ment DMA has a Cronbach α of 0.83.
RAPM
The RAPM construct was based on the original instrument of Hopwood (1973), translated to
Dutch and modified by Hartmann (1997). This instrument was adapted to a governmental set-
ting. Most important changes were the deletion of the item ‘How much profit I make’ (mu-
nicipalities do not strive to make a profit) and the adaptations to the item ‘meeting the
budget’. Because in Dutch municipalities ‘budget’ is generally considered as the maximum
amount of money which can be spent instead of the combination of performance and the as-
sociated costs, this item was split into ‘Not overrunning the budget’ and ‘Meeting the budget
at the amount of the agreed upon costs’. Factor analysis revealed four dimensions: 1. account-
ing measures (AM), 2. objective nonfinancial measures (NF), 3. items related to the relation-
ship with the operational and political superiors and 4. items related to the extent to which
initiatives are employed that contribute to a good image of the superiors. The third and the

25
fourth dimension are both rather subjective; they cannot be measured easily without the risk
of human bias, because they depend on the judgment of superiors. Furthermore, the dimen-
sions were highly correlated (r=0.4 at p<0.001) and we did not expect to have different find-
ings for these dimensions based on prior literature. Therefore, we added the scores of both
dimensions, resulting in a score for the extent to which subjective nonfinancial measures
(SUB) are used for performance evaluation. The resulting three dimensions (AM, NF and
SUB) are also statistically correlated (refer to Table 4-7), implying differences in more expli-
cit and more implicit evaluation styles (i.e., using a rather broad and rather narrow set of
measures for performance evaluation respectively). All dimensions have a satisfactory α of
0.70 or higher. We did not calculate an ‘overall’ RAPM score, because we aimed at analyzing
the influence of each set of measures separately.
Contingency variables
The construct for Environmental Uncertainty (EU) was based on the instruments developed
by Govindarajan (1984) and Merchant (1990), adapted and translated by Hartmann (1997).
Based on previous literature6, we distinguished four groups of sources of environmental un-
certainty: 1. clients (EU_CL), 2. technological developments (EU_TD), 3. suppliers
(EU_SUP) and 4. politics (EU_POL). We computed an overall score for EU as the average
score of these groups. Because we think that the influence of the uncertainties on the opera-
tional management depends on the combined effect of unpredictability and influence, we cal-
culated the scores by multiplying the questions about the unpredictability and the influence.
The construct for Task Uncertainty (TU) aims to measure the uncertainty associated with the
tasks of the manager and his/her department. We use the instrument developed by Withey et
al. (1983) and translated by Hartmann (1997). Factor analysis showed three dimensions,
which refer to 1. the routines / repetitiousness of the tasks of the manager (TU_RM), 2. know-
ledge about the working procedures of the manager (TU_KM) and 3. the routineness / repeti-
tiousness of the tasks of the employees (TU_RE). The dimensions are positively correlated
(r=0.41 or higher), which is consistent with theoretical expectations (Perrow, 1967) and prior
studies (van de Ven and Delbecq, 1974; Draft and Macintosh, 1981; Abernethy and Stoel-
winder, 1991; Abernethy and Brownell, 1997). The reliability of the constructs is adequate
(Cronbach α of 0.75, 0.80 and 0.78 respectively). Because of the high intercorrelation of the
dimensions and because we did not expect to find other outcomes for the dimensions based on
6 As we consider the underlying items as causal indicators and not reflective indicator (cf. Bisbe et al.,
2006, AOS), it was not considered appropriately to use factor analysis.

26
previous research, we computed an overall score for TU as the mean of the scores on the di-
mensions.
Funding Uncertainty (FU) aims to measure the uncertainty of having not enough resources for
executing the departments’ activities. We used a self-developed one item instrument for mea-
suring FU.
The instrument for organic processes (OP) was based on the study of Chenhall and Morris
(1995). Chenhall and Morris developed an instrument to measure organic processes in organi-
zations, based on previous literature (Khandwalla, 1972) and pilot studies. We added two ad-
ditional items to this instrument, resulting in twelve items. Factor analysis revealed that items
loaded on the same two factors as in Chenhall and Morris’ study, capturing the formality of
decision processes and openness of communication, while the second dimension focuses on
an emphasis of adaptability and change. For comparability purposes and because we did not
expect a different effect of both dimensions beforehand, we used one construct in this study,
calculated by taking the average score of all items in this instrument. This instrument has a
satisfactory Cronbach α of 0.82.
We analyzed whether our independent variables were correlated, indicating possible multicol-
leniarity problems. Table 4-7 shows that none of the contingency variables is correlated, ex-
cept for a negative statistical significant correlation between funding uncertainty (FU) and
organic processes (OP).
*** insert Table 4-7 around here ***
Outcome variables
In this project, we used several variables to measure the performance, expressing the extent to
which managers are incentivized to increase the performance, their own (subjective) judgment
of the performance and the efficiency of the departments.
Behavioral effects
The behavioral effects of the performance measurement system are measured by the con-
structs Goal Clarity (GC) and Agreement on Evaluation Criteria (AEC). Both constructs have

27
been developed by Hartmann (1997). The instrument for GC expresses the degree to which
the goals that have to be reached are clear to the manager. This instrument consists of items
for goal specificity and role ambiguity. The instrument for AEC aims to measure the degree to
which the manager agrees with the way he is being evaluated.
Government performance
In this study we measured the performance of the departments in our study in several ways.
The managers were also asked to give a rate (on a scale from 1 to 10) for the functioning and
performance of their own department (PD) and their own functioning and performance (PI).
Because we think the ultimate goal of managers should be to improve the performance of the
department, we use the performance of the department as the output variable in this study.
Furthermore, this measure was usable for both departments in our study and we did not have
much missing data as for the other performance related data.
Analysis method
We used Partial Least Square (PLS) to test our structural models. PLS is a causal modeling
technique that provides an advanced combination of principal component analysis and path
analysis. This causal modeling technique is well suited to analyze small sample sizes and does
not make distributional assumptions. Furthermore, it allows the inclusion of formative meas-
ures (Chin, 1998, p. x) whereas SEM techniques such as LISREL do not allow this. PLS ge-
nerates standardized βs that are used as path coefficients within the structural model and are
interpreted as in OLS regressions (Chenhall, 2004). Bootstrapping provides a basis to evaluate
parameter estimates. We use bootstrapping with 500 sample replacement, to assess the signi-
ficance of each path coefficient. In order to test the robustness of our models, we also ran an
Ordinary Least Squares analysis for all models. There were no large differences in our PLS
and OLS analyses7.
7 Tables are available on request.

28
6. Findings
Performance Measurement Systems
H1 Decentralized Decision Making Authority (DMA) is positively associated with the
use of (a) Accounting Measures (AM) and (b) objective nonfinancial measures (NF)
for performance evaluation.
H2 Decentralized Decision Making Authority (DMA) is negatively associated with the
use of subjective nonfinancial measures (SUB) for performance evaluation.
*** insert Table 4-8 and Figure 4-2 around here ***
Table 4-8 and Figure 4-2 show that importance attached to specific groups of measures for
performance evaluation is not affected to the level of decentralization. Hypothesis 1, assum-
ing a positive relationship between decentralization and the use of objective performance in-
dicators (AM and NF) is therefore rejected. Hypothesis 2 is also rejected; we did not find a
statistically significant relationship between decentralization and the use of subjective nonfi-
nancial measures (SUB) for performance evaluation.
PMS effects
H3 The use of accounting measures (AM) for performance evaluation is (a) positively
associated with Goal Clarity (GC) and (b) negatively associated with Agreement on
Evaluation Criteria (AEC).
The use of accounting measures (AM) for performance evaluation level is not associated with
the level of GC and AEC, rejecting hypothesis 3a (refer to Table 4-8). Hypothesis 3b is sup-
ported: the use of accounting performance measures for performance evaluation is indeed ne-
gatively associated with AEC.
H4 The use of objective nonfinancial measures (NF) for performance evaluation is posi-
tively associated with (a) Goal Clarity (GC) and (b) Agreement on Evaluation Criteria
(AEC).

29
Hypothesis 4 is strongly supported by our analysis: the use of objective nonfinancial measures
(NF) for performance evaluation is positively associated with the level of GC and AEC. The
use of these indicators therefore seems to provide clarity over the goals to be attained and is
considered appropriate for discussing the realized performance between superior and subordi-
nate.
H5 The use of subjective nonfinancial measures (SUB) for performance evaluation is ne-
gatively associated with (a) Goal Clarity (GC) and (b) Agreement on Evaluation Cri-
teria (AEC).
Hypothesis 5 suggesting that the use of subjective (SUB) performance indicators contributes
negatively to goal clarity (GC) and agreement on the performance evaluation criteria (AEC),
is partially supported by the analysis. The use of subjective nonfinancial indicators is indeed
negatively statistically significantly associated with the level of GC, but not with the level of
AEC. However, the direction of the coefficient of SUB is in the expected negative direction.
Apparently, the subjective criteria introduce more uncertainty and vagueness over the goals of
the manager and do not add to the fairness of evaluation.
Contingencies
Environmental Uncertainty (EU)
H6 The effect of using accounting measures (AM) for performance evaluation on (a)
Goal Clarity (GC) and (b) Agreement on Evaluation Criteria (AEC) is not affected by
Environmental Uncertainty (EU).
Our analyses do not confirm hypotheses 6 that the effect of RAPM on GC and AEC is not
affected by the level of EU. Table 4-8 shows that at higher levels of perceived environmental
uncertainty (EU), the use of accounting performance measures (AM) is considered positive
for providing more clarity over the goals to be attained. On the other hand, the use of these
items at higher levels of EU increases the uncertainty of evaluating subordinates on criteria
that are beyond their control. The effect of the use of other performance evaluation criteria
(NF and SUB) is not statistically significantly moderated by the level of EU.
30
Task Uncertainty (TU)
H7 The effect of using accounting measures (AM) for performance evaluation on (a)
Goal Clarity (GC) is not affected by Task Uncertainty (TU) and the effect on (b)
Agreement on Evaluation Criteria (AEC) is negatively affected by Task Uncertainty
(TU).
The effect of using accounting performance measures (AM) for evaluation purposes on goal
clarity (GC) is not statistically significantly moderated by the level of TU, confirming hypo-
thesis 7a. Furthermore, our analysis fails to support hypothesis 7b that the effect of RAPM on
AEC is more negative for higher levels of TU. The coefficient is in the hypothesized negative
direction, but is not statistically significant. Our analysis also shows that the effect of the use
of subjective nonfinancial measures (SUB) for performance evaluation on AEC is positively
affected by the level of TU, suggesting that in situations of high task uncertainty managers
appreciate it to be evaluated on these subjective criteria. Furthermore, we found a statistical
significant negative relationship between TU and GC, implying less goal clarity in situations
of high task uncertainty.
Funding Uncertainty (FU)
H8 The effect of using accounting measures (AM) for performance evaluation on (a)
Goal Clarity (GC) and (b) Agreement on Evaluation Criteria (AEC) is not affected by
the level of Funding Uncertainty (FU).
Our analysis confirms hypothesis 8 that the effect of using accounting performance measures
for evaluation purposes on GC and AEC is not affected by the level of FU. The coefficients
are not statistically significant. However, we found two significant relationships that were not
hypothesized: First, we found a positive effect of FU on the use of subjective nonfinancial
measures for performance evaluation (SUB) on goal clarity, suggesting that using these
measures improve the clarity of the goals in situations of high funding uncertainty. This might
indicate a compensating mechanism by managers to rely more on interpersonal subjective
information sharing in situations of possible insufficient means. By this informal communica-
tion, managers can share their ideas about the importance of the goals to be achieved. Second,
our analysis showed a direct negative effect of FU on AEC, implicating less reliance on the

31
performance evaluation in situations where the means might to be sufficient to achieve all
goals.
Organic Processes
H9 The effect of using accounting measures (AM) for performance evaluation on (a)
Goal Clarity (GC) and (b) Agreement on Evaluation Criteria (AEC) is more positive
for higher levels of Organic Processes (OP).
Our analysis does not confirm hypothesis 9 that the effect of RAPM on GC and AEC is more
positive for higher levels of OP. We do however find a strong positive main effect of OP on
the level of GC and AEC, but OP does not moderate the relationship between RAPM and GC
and AEC, except for the effect of using subjective nonfinancial (SUB) performance measures
on AEC. This implies that organic processes do add to the goal clarity and the agreement on
evaluation criteria, whatever indicators are used for the performance evaluation.
Government performance
H10 (a) Goal Clarity (GC) and (b) Agreement on Evaluation Criteria (AEC) is positively
associated with Performance of the department (PD).
Table 4-8 shows that the efficiency of the departments in our study is indeed positively re-
lated with the level of GC and AEC, confirming hypothesis 10. The coefficient of both the
effect of GC on PD and of AEC on PD is statistically significant and positive. This suggests
that having more ‘line of sight’ (goal clarity) and more evaluation fairness (agreement on
evaluation criteria) indeed motivate managers. However, the first mentioned relationship is
much stronger, thereby strongly supporting the goal setting theory. Furthermore, the adjusted
R2 for PD is rather low (7.5%) suggesting that several other aspects than the behavioral effects
of the performance measurement system may influence the performance of the department.
32
7. Discussion and conclusions
In this paper we analyzed the results of the implementation of two specific management re-
forms, the decentralization of decision making authority and the use of accounting measures
for performance evaluation. Although these reforms attracted considerable attention, little is
known about the effects of these reforms.
We expected these reforms to be interrelated: when managers are given more comprehensive
decision making authority, we expect them to be evaluated more extensively on accounting
measures, as these express more aggregated and integrated information (Chenhall and Morris,
1986; Abernethy and Lillis, 2001; Abernethy et al., 2004). However, our results indicate that
decentralization and the use of accounting measures for performance evaluation are not statis-
tically significantly correlated. This implies that middle managers are not held more account-
able for results at higher levels of decentralization. This might indicate a possible lack in the
accountability system of municipalities. If more comprehensive decision making authorities
for middle managers are not accompanied by modifications in accountability regimes, one
might wonder whether these systems ensure adequate control of costs and performance. Fur-
thermore, if accountability systems do not follow responsibilities, then what are the determin-
ing factors for the design of evaluation systems? We think these can be institutional factors,
such as norms and common practices within municipalities (Oliver, 1991). Another possibili-
ty is that the design of the system is affected by personal considerations of superiors (leader-
ship styles). If these institutional or personal factors indeed explain differences in perfor-
mance evaluation systems, one might question whether the most appropriate system was im-
plemented. However, our findings might also reflect a temporary situation and that there is a
significant time-lag between organizational changes and changes in the accountability system.
We also analyzed the effects of using various groups of measures for performance evaluation.
To our surprise, accounting performance measures, such as budgets, do not have the most
significant impact on our output variables that represent the behavioral effects of performance
measurement systems. The use of accounting performance measures is not associated with the
level of goal clarity and is even associated with lower levels of agreement on evaluation crite-
ria. Far more and a more positive influence comes from the use of objective nonfinancial in-
dicators, they are positively related to both goal clarity and agreement on evaluation criteria.
This supports recent literature that stresses the benefits of using nonfinancial measures to pro-
vide a broad view of a subordinate’s accomplishments (Ittner and Larcker, 1998; Said et al.,

33
2003; Lau and Sholihin, 2005). Our analysis revealed that these benefits did not depend on
internal or external conditions. Therefore, the use of these objective nonfinancial measures
seems to be desirable in all circumstances.
We also found strong statistically significant relationships between our variable organic
processes and the output variables. This implies that internal conditions, such as having open
communication and readiness for changes, lead to more goal clarity and agreement on evalua-
tion criteria.
The effect of using accounting measures for performance evaluation, however, was much
more complicated. We did not find a direct effect of the use of these indicators on our output
variables. This effect was moderated by the level of environmental uncertainty. The effect of
using accounting measures on goal clarity was positively moderated by the level of environ-
mental uncertainty, whereas this moderating effect was negative for the relationship between
the use of accounting measures and agreement on evaluation criteria. This implies that the use
of accounting measures under high uncertainty may enhance the clarity over the goals to be
accomplished by improving the ‘line of sight’ (Marginson and Ogden, 2005). On the other
hand, this introduces more risk for managers being evaluated on aspects beyond their control.
This calls for implementing mechanisms to ensure middle managers that their evaluation will
be fair, such as using more nonfinancial measures as well as having open communication and
trust in superiors (Ross, 1994; Emsley, 2001; Lau and Buckland, 2001; Manzoni, 2003). Both
elements are needed to specify responsibilities and to separate the influence of chance from
performance effects due to managers’ efforts.
In his 2000 AOS paper, Hartmann (2000) made a plea that ‘RAPM research should be chal-
lenged by finding out whether the appropriateness of RAPM is differently affected by differ-
ent kinds of uncertainty’ (Hartmann, 2000, p. 476). In this study we analyzed several groups
of uncertainties: environmental uncertainty, task uncertainty and funding uncertainty. Our
correlation analysis revealed that these groups were not statistically correlated. They appear to
function as independent sources of uncertainty. Furthermore, the PLS model shows that the
effects of these groups of uncertainties on our output variables are not consistent. Task uncer-
tainty is negatively associated with the level of goal clarity, implying that more fluctuating
and more difficult tasks contribute negatively to the clarity over the goals to be attained.
Funding uncertainty is negatively associated with agreement on evaluation criteria. We think
that in situations of probably insufficient resources, managers feel a bigger risk of being eva-

34
luated on performance that they are incapable of improving, due to lack of resources. Finally,
we found that the negative effects of funding uncertainty on goal clarity (although not statisti-
cally significant) were mitigated by using subjective performance measures instead of objec-
tive performance measures.
In this paper, we used two output variables, goal clarity and agreement on evaluation criteria.
Following Hartmann (1997), we think that these variables are important as they express the
behavioral effects of performance measurement systems. Goal setting theory shows that clari-
ty over the goals is an important determinant of organizational success. Agreement on evalua-
tion criteria is important as it expresses the fairness of the evaluation by the subordinate.
However, we also analyzed whether these output variables were positively and statistically
significantly correlated with performance, measured by a self-rated instrument for the perfor-
mance of the departments. Our analysis shows that the output variables are indeed positively
and statistically significantly correlated with this performance measure.
The usual limitations of survey research apply to this paper. Two specific limitations need to
be mentioned explicitly. The first is the choice of the departments in this study. We have cho-
sen rather ‘production-like’ departments, which may influence the use of criteria for evalua-
tion purposes. We expect the use of accounting based criteria to be more modest in other de-
partments. Therefore, we suggest extending this research to other departments with different
characteristics. Secondly, because of data limitations we had to use rather subjective criteria
for measuring the performance of the departments.

35
REFERENCES
Aardema, H. (2002), Doorwerking van BBI, evaluatie van een veranderingsbeweging bij de Nederlandse gemeenten (Leusden: BMC).
Abernethy, M.A., J. Bouwens and L. van Lent (2004), ‘Determinants of control system design in divisionalized firms’, The Accounting Review, Vol. 79, No. 3, pp. 545-570.
Abernethy, M.A and P. Brownell (1997), ‘Management control systems in research and de-velopment organizations: The role of accounting, behavior and personnel controls’, Accounting, Organizations and Society, Vol. 22, No. 3-4, pp. 233-248
Abernethy, M.A. and A.M. Lillis (2001), ‘Interdependencies in Organization Design: A Test in Hospitals’, Journal of Management Accounting Research, Vol. 13, pp. 107-129.
Abernethy, M.A. and J.U. Stoelwinder (1991), ‘Budget use, task uncertainty, system goal ori-entation and subunit performance: A test of the 'fit' hypothesis in not-for-profit hospitals’, Ac-counting, Organizations and Society, Vol. 16, No. 2, pp. 105-120.
Amir, E. and B. Lev (1996), ‘Value-relevance of nonfinancial information: The wireless communications industry’, Journal of Accounting and Economics, Vol. 22, No. 1-3, pp. 3-30.
Anderson, E.A., C. Fornell and D.R. Lehman (1994), ‘Customer satisfaction, market share and profitability: findings from Sweden’, Journal of Marketing, Vol. 58, pp. 53–66.
Banker, R.D., G. Potter and D. Srinivasan (2000), ‘An empirical investigation of an incentive plan that includes nonfinancial performance measures’, The Accounting Review, Vol. 75, pp. 65-92.
Barret, T.F., P. McDonagh and J. Granleese (1992), ‘The contagion Effect in Performance Evaluation: Evidence from the evaluation of marketing managers: a Research note’, The Brit-ish Accounting Review, Vol 24, pp 331-341.
Behn, B.K. and R.A. Riley (1999), Using Nonfinancial Information to Predict Financial Per-formance: The Case of the US Airline Industry, Journal of Accounting, Auditing and Finance, Vol. 14, No. 1, pp. 29-56.
ter Bogt, H., (2001), ‘Politicians and output-oriented performance evaluation in municipali-ties’, The European Accounting Review, Vol. 10., No. 3, pp. 621-643.
ter Bogt, H. (2003), ‘Performance evaluation styles in governmental organizations: How do professional managers facilitate politicians’ work?’, Management Accounting Research, Vol. 14, No. 4, pp. 311-332.
ter Bogt, H.J. (2004), ‘Politicians in Search of Performance Information? – Survey Research on Dutch Aldermen’s Use of Performance Information’, Financial Accountability & Man-agement, Vol. 20, No. 3, pp. 221-252.
ter Bogt, H. (2008), ‘Recent and Future Management Chnages in Local Government: Contin-uing Focus on Rationality and Efficiency?’, Financial Accountability & Management, Vol. 28, No. 1, pp. 31-57.
ter Bogt, H. and G.J. van Helden (2000), ‘Accounting change in Dutch government: Explor-ing the gap between expectations and realizations’, Management Accounting Research, Vol. 11, No. 2, pp. 263-279.
Boswell, W. (2006), ‘Aligning employees with the organization’s strategic objectives: out of ‘line of sight’, out of mind’, International Journal of Human Resource Management, Vol. 17, No. 9, pp. 1489-1511.

36
Bouillon, M.L., G.D. Ferrier, M.T. Stuebs Jr. and T.D. West (2006), ‘The economic benefit of goal congruence and implications for management control systems’, Journal of Accounting and Public Policy, Vol. 25, No. 3, pp. 265-298.
Bourne, M., J. Mills, M. Wilcox, A. Neely and K. Platts (2000), ‘Designing, implementing and updating performance measurement systems’, International Journal of Operations & Production Management, Vol. 20, No. 7, pp. 754-771.
Bouwens, J. and M.A. Abernethy (2000), ‘The consequences of customization on manage-ment accounting system design’, Accounting, Organizations and Society, Vol. 25, pp. 221-241.
Brownell, P. (1981), ‘Participation in budgeting, Locus of control an organizational Effec-tiveness’, The Accounting Review, Vol. 56, No. 4, pp. 844-860.
Brownell, P. (1982), ‘A field Study Examination of budgetary Participation and Locus of Control’, The Accounting Review Vol. 57, No. 4, pp. 766-777.
Brownell, P. (1985), ‘Budgetary Systems and the Control of Functionally Differentiated Or-ganizational Activities’, Journal of Accounting Research, Vol. 23, No. 2, pp. 502-512.
Brownell, P. (1987), ‘The role of accounting information, environment and management con-trol in multinational organizations’, Accounting and Finance, Vol. 27, p. 1-16.
Brownell, P. and A.S. Dunk (1991), ‘Task uncertainty and its interactions with budgetary par-ticipation and budget emphasis: some methodological issues and empirical investigation’, Ac-counting, Organizations and Society, Vol. 16, No. 8, pp. 693-703.
Brownell, P and M. Hirst (1986), ‘Reliance on Accounting Information, Budgetary Participa-tion and Task Uncertainty: Tests of a three way interaction’, Journal of Accounting Research, Vol. 24, No. 2, pp. 241-249.
Brownell, P and M. McInnes (1986), ‘Budgetary Participation, Motivation, and Managerial Performance’, The Accounting Review, Vol. 61, No. 4, pp. 587-600.
Buchko, A.A. (1984), Conceptualization and measurement of environmental uncertainty: An assessment of the Miles and Snow Perceived Environmental Uncertainty scale, Academy of Management Journal, Vol. 37, No. 2, pp. 410-425.
Budding, G.T. (2004), ‘Accountability, environmental uncertainty and government perform-ance: Evidence from Dutch municipalities’, Management Accounting Research, Vol. 15, No, 3, pp. 285-304.
Chapman, C.S. (1997), ‘Reflections on a contingent view of accounting’, Accounting, Organ-izations and Society, Vol. 22, pp. 189-205.
Chenhall, R.H. and D. Morris (1986), ‘The Impact of Structure, Environment and Interde-pendence on the Perceived Usefulness of Management Accounting Systems’, The Accounting Review, Vol. LXI, No. 1, pp. 16-35.
Chenhall, R.H. and D. Morris (1995), Organic Decision and Communication Processes and Management Accounting Systems in Entrepreneurial and Conservative Business Organiza-tions, Omega, Vol. 23, No. 5, pp. 485-497
Chenhall, R.H. (2003), Management control systems design within its organizational context: findings from contingency-based research and directions for the future, Accounting, Organi-zations and Society, Vol. 28, No. 2/3, pp. 127-168.
Chin, W.W. (1998), Commentary: Issues and Opinion on Structural Equation Modeling, MIS Quarterly, Vol. 22, No. 1, pp. vii-xvi.
37
Dent, J.F. (1990), ‘Strategy, organization and control: some possibilities for accounting re-search’, Accounting, Organizations and Society, Vol. 15, No. 1-2, pp. 3-25.
Dillman, D.A. (1991), ‘The Design and Administration of Mail Surveys’, Annual Review of Sociology, Volume 17, pp. 225-249.
Dunk, A.S. (1989), ‘Budget Emphasis, Budgetary Participation and managerial Performance: A Note’, Accounting, Organizations and Society Vol. 14, No. 4, pp. 321-324.
Dunk, A.S. (1990), ‘Budgetary Participation, Agreement on Evaluation Criteria and Mana-gerial Performance: A Research Note’, Accounting, Organizations and Society, Vol. 15, No. 3, pp. 171-178.
Dunk, A.S. (1992), ‘Reliance on Budgetary Control, Manufacturing Process Automation and Production Subunit Performance: A Research note’, Accounting, Organizations and Society, Vol. 17, No. 3/4, pp. 195-203.
Dunk, A.S. (1993a), ‘The Effect of Budget Emphasis and information Asymmetry on the relation between Budgetary Participation and Slack’, The Accounting Review, Vol. 68. No. 2, pp. 400-410.
Dunk, A.S. (1993b), ‘The Effects of Job-Related Tension on Manegerial Performance in Par-ticipative Budgetary Settings’, Accounting, Organisation and Society, Vol. 18, No. 7/8, pp. 575-585.
Emsley, D. (2001), ‘Budget in Performance Evaluation and Managers’ Job Related Tension: The Moderating Effect of information Completeness’, The British Accounting Review, Vol. 33, No. 3, pp. 399-419.
Ezzamel, M (1990), ‘The Impact of Environmental Uncertainty, Managerial Autonomy and size on Budget Characteristics’, Management Accounting Research, Vol. 1, No. 1, pp. 181-197.
Frucot, V. and W.T. Shearon (1991), ‘Budgetary Participation, Locus of Control, and Mex-ican Managerial Performance and Job Satisfaction’, The Accounting Review, Vol. 66, No. 1, pp. 80-99.
Geiger, D.R. and C.D. Ittner (1996), ‘The Influence of funding source and legislative re-quirements on government cost accounting practices’, Accounting, Organizations and Society, Vol. 21, No. 6, pp. 549-567.
Gerdin, J. and J. Greve (2004), ‘Forms of contingency fit in management accounting research – a critical review’, Accounting, Organizations and Society, Vol. 29, No. 3-4, pp. 303-326.
Gordon, L.A. and V.K. Narayanan (1984), ‘Management accounting systems, perceived envi-ronmental uncertainty and organization structure: An empirical investigation’, Accounting, Organizations and Society, Vol. 9, No. 1, pp. 33-47.
Govindarajan, V. (1984), ‘Appropriateness of accounting data in performance evaluation: An emperical examination of environmental uncertainty as an intervening variable’, Accounting, Organizations and Society, Vol. 9, No. 2, pp. 125-135.
Govindarajan, V. (1986), ‘Decentralization, Strategy, and Effectiveness of Strategic Business Units in Multibusiness Organizations’, Academy of Management Review, Vol. 11, No. 4, pp. 844-856.
Govindarajan, V (1988), ‘A Contingency Approach to Strategy Implementation at the Busi-ness-Unit Level: integrating Administrative Mechanisms with Strategy’, Academy of Man-agement Journal, Vol. 31, No. 4, pp. 828-853.

38
Govindarajan, V. and A.K. Gupta (1985), ‘Linking Control Systems to Business Unit Strate-gy: Impact on Performance’, Accounting, Organizations and Society, Vol. 10, No. 1, pp. 51-66.
Groot, T.L.C.M. and G.T. Budding (2004), ‘The influence of New Public Management Prac-tices on Product Costing and Service Pricing Decisions in Dutch Municipalities’, Financial Accountability & Management, Vol. 20, No. 4, pp. 421-444.
Groot, T.L.C.M. and G.T. Budding (2008), ‘New Public Management’s Current Issues and Future Prospects’, Financial Accountability & Management, Vol. 24, No. 1, pp. 1-12.
Gupta, A. K. (1987), ‘SBU Strategies, Corporate- SBU Relation, and SBU Effectiveness in Strategy Implementation’, Academy of Management Journal, Vol. 30, No. 3, pp. 477-500
Guthrie, J., C. Humphrey, L.R. Jones en O. Olson (2005), International Public Financial Management Reform (Greenwich: Information Age Publishing).
Harrison, G. L. (1992), ‘The Cross-Cultural Generalizability of the Relation between Partici-pation, Budget Emphasis and Job Related Attitudes’, Accounting, Organizations and Society, Vol. 17, No. 1, pp. 1-15.
Harrison, G.L. (1993), ‘Reliance on Accounting Performance Measures in Superior Evalua-tive Style – the Influence of National Culture and Personality’, Accounting, Organizations and Society, Vol. 18, No. 4, pp. 319-339.
Hartmann, F.G.H. (1997), Accounting for Performance Evaluation (Amsterdam: Universiteit van Amsterdam).
Hartmann, F.G.H. (2000), ‘The appropriateness of RAPM: toward the further development of theory’, Accounting, Organizations and Society, Vol. 25, No. 4&5, pp. 451-482.
Hartmann, F.G.H. (2005), ‘The effects of tolerance for ambiguity and uncertainty on the ap-propriateness of accounting performance measures’, Abacus, Vol. 41, No. 3, pp. 241-264.
van Helden, G.J. (1997), ‘Cost Allocation and Product Costing in Dutch Local Government’, The European Accounting Review, Vol. 6, No. 1, pp. 131-145.
van Helden, G.J. (1998), BBI in de praktijk - Een vergelijkend onderzoek naar de planning en control bij acht middelgrote gemeenten (Maastricht: Shaker Publishing).
van Helden, G.J. and E.P. Jansen (2003), ‘New Public Management in Dutch Local Govern-ment’, Local Government Studies, Vol. 29, No. 2, pp. 68-88.
Hendriks, F. and P. Tops (2003) Local public management reforms in the Netherlands: Fads, fashions and winds of change, Public Administration, Vol. 81, No. 2, pp. 301-323.
Hirst M.K. (1981), ‘Accounting Information and te Evaluation of Subordinate Performance: A Situational Approach’, The Accounting Review, Vol. 56, No. 4, pp. 771-784.
Hirst, M.K., (1983), ‘Reliance on Accounting Performance Measures, Task Uncertainty, and Dysfunctional Behavior: Some Extensions’, Journal of Accounting Research, Vol. 21, No. 2, pp. 596-605.
Hirst, M.K. (1987), ‘The Effects of Setting Budget Goals and Task Uncertainty on Perfor-mance: A Theoretical Analysis’, The Accounting Review Vol. 62, No. 4, pp. 774-784.
Hirst, M. K. and P. Yetton (1984), ‘Influence of Reliance on Accounting Performance Meas-ures and Job Structure on Role Ambiguity for Production and Non-Production Jobs’, Austral-ian Journal of Management, Vol. 9, No. 1, pp. 53-61.
Hofstede, G.H. (1967), The Game of Budget Control (Groningen, Rijksuniversiteit Gronin-gen).

39
Hood, C.C. (1995), ‘The 'New Public Management' in the 1980's: variations on a theme’, Ac-counting, Organizations and Society, Vol. 20, No. 2/3, pp. 93-109.
Hopwood, A.G. (1972), ‘An empirical study of the role of accounting data in performance evaluation’, Journal of Accounting Research, Vol. 10, pp. 156-182.
Hopwood, A.G. (1973), An Accounting System and Managerial Behaviour (Farnborough: Saxon House).
Hopwood, A.G. (1974), Leadership Climate and the use of Accounting Data in Performance Evaluation, The Accounting Review, Vol. 49, No. 3, pp. 485-495.
Hughes, M.A. and S.Y. Kwon (1990), An Integrative Framework for Theory Construction and Testing, Accounting, Organizations and Society, Vol. 15, No., 3, pp. 179-191.
Hyndman, N. and R. Eden (2001), ‘Rational Management, Performance Targets and Execu-tive Agencies: Views from Agency Chief Executives’, Public Administration, Vol. 79, No. 3, pp. 579-598.
Imoisili, O.A. (1989), ‘The Role of Budget Data in the Evaluation of Mangerial Perfor-mance’, Accounting, Organizations and Society, Vol. 14, No. 4, pp. 325-335.
Ittner, C. and D.F. Larcker (1998), ‘Are Nonfinancial Measures Leading Indicators of Finan-cial Performance? An Analysis of Customer Satisfaction’, Journal of Accounting Research, Vol. 36, pp. 1-35.
Kaplan, R.S. (2001), ‘Strategic performance measurement and management in non-profit or-ganizations’, Non-profit Management and Leadership, Vol. 11, No. 3, pp. 353-370.
Kaplan, R.S. and D.P. Norton (1992), ‘The Balanced Scorecard – Measures that drive per-formance’, Harvard Business Review, Vol. 70, No. 1, pp. 71-79.
Kaplan, R.S. and D. Norton (1996), The Balanced Scorecard (Harvard: Harvard Business School Press).
Kenis, I. (1979), ‘Effects of Budgetary Goal Characteristics on Managerial Attitudes and Per-formance’, The Accounting Review, Vol. 54, pp. 707-721.
Khandwalla, P.N. (1972), ‘The effect of different types of competition on the use of manage-ment controls’, Journal of Accounting Research, Vol. 10, pp. 275-285.
Kren, K. (1992), Budgetary Participation and Managerial Performance: The Impact of Infor-mation and Environmental Volatility, The Accounting Review, Vol. 67, No. 3, pp. 511-526.
Lal, M., A.S. Dunk and G.D. Smith (1996), ‘The Propensity of Managers to Create Budgetary Slack: A Cross-national Re-examination Using Random Sampling’, The International Journal of Accounting, Vol. 31, No. 4, pp 483-496.
Langfield-Smith, K. (1997), ‘Management Control Systems and Strategy: A critical review’, Accounting, Organizations and Society, Vol. 22, No. 2, pp. 207-232.
Lapsley, I. (2008), ‘The NPM Agenda: Back to the Future’, Financial Accountability & Man-agement, Vol. 28, No. 1, pp. 77-96.
Lau, C.M. and C. Buckland (2001), Budgeting-the Role of Trust and Participation: A Re-search Note, Abacus, Vol. 37, No. 3, pp. 369-388.
Lau, C.M., K.C. Low and I.R.C. Eggleton (1995), The Impact of Reliance on Accounting Per-formance Measures on Job-Related Tension and Managerial Performance: Additional Evi-dence, Accounting, Organizations and Society, Vol. 20, No. 5, pp. 359-381.

40
Lau, C.M., L.C. Low and I.R.C. Eggleton (1997), ‘The Interactive Effect of Budget Empha-sis, Participation and Task Difficulty on Managerial Performance: A Cross-Cultural Study’, Accounting, Auditing & Accountability Journal, Vol. 10, No. 2, pp. 175-197.
Lau, C.M. and M. Shohilin (2005), ‘Financial and nonfinancial performance measures: How do they effect job satisfaction?’, The British Accounting Review, Vol. 37, No. 4, pp. 389-413.
Lau, C.M. and J.J. Tan (1998), ‘The Impact of Budget Emphasis, Participation and Task Dif-feculty on Managerial Performance: A Cross Cultural Study of the Financial Services Sector’, Management Accounting Research, Vol. 9, No. 2, pp. 163-183.
Lau, C.M. and S.L.C. Tan (2006), ‘The effects of Procedural Fairness and Interpersonal Trust on Job Tension in Budgeting’, Management Accounting Research, Vol. 17, No. 2, pp. 171-186.
Locke, E.A. and G.P. Latham (1990), A theory of goal setting & task performance (Engle-wood Cliffs, NJ: Prentice-Hall).
Locke, E.A. and G.P. Latham (2002), ‘Building a practically useful theory of goal setting and task motivation: A 35-year odyssey’, American Psychologist, Vol. 57, No. 9, pp. 705-717.
Macintosh, N. (1985), Human Relations and Budgeting Systems, in; Emmanuel, C., D.T. Ot-ley and K. Merchant (eds.) Readings on Accounting for Management Control (1992), (Lon-don: Chapman & Hall), pp. 9-27.
Macintosh, N.B. and R.L. Daft (1987), ‘Management Control Systems and Departemental Interdependencies: An Empirical Study’, Accounting, Organizations and Society, Vol. 12, No. 1, pp. 49-61.
Macintosh, N.B. and J.J. Williams (1992), ‘Managerial Roles and Budgeting Behavior’, Be-havioral Research in Accounting, Vol. 4, p. 23-48.
Manzoni (2003), ‘Management Control: Toward a New Paradigm?’, Performance Measure-ment and Management Control, Vol. 12, pp. 15-46.
Marginson, D. and S. Ogden (2005), ‘Coping with ambiguity through the budget: the positive effects of budgetary targets on manager’s budgeting behaviours’, Accounting, Organizations and Society, Vol. 30, No. 5, pp. 435-456.
Merchant K.A. (1981), ‘The Design of the corporate Budgeting System : Influences on Manegerial Behaviour and Performance’, The Accounting Review, Vol. 56, No. 4, pp. 816-829.
Merchant, K.A. (1984), ‘Influences on Departmental Budgeting: An Empirical Examination of a Contingency Model’, Accounting, Organizations and Society, Vol. 9, No. 3-4, pp. 291-307.
Merchant, K.A. (1985), ‘Budgeting and the Propensity to create Budget Slack, Accounting Organizations, and Society’, Vol 10, No. 2, pp. 201-210.
Merchant, K.T. (1990), ‘The Effects of Financial Controls on Data Manipulation and Man-agement Myopia’, Accounting, Organizations and Society, Vol. 15, No. 4, pp. 297-313
Noeverman, J. (2007), Management Control Systems, Evaluative Style and Behaviour (Rot-terdam: Erasmus Universiteit Rotterdam).
O’Connor, N.G. (1995), ‘The Influence of Organizational Culture on the Usefulness of Budget Participation by Singaporean-Chinese Managers’, Accounting, Organizations and So-ciety, Vol. 20, No. 5, pp. 383-403.

41
OECD (2005), Modernising Government: The Way Forward (Paris: Organization for Eco-nomic Cooperation and Development).
Oliver, C. (1991), ‘Strategic Responses to Institutional Processes’, The Academy of Management Review, Vol. 16, No. 1, pp. 145-179.
Onsi, M. (1973), ‘Factor Analysis of Behavioral Variables Affecting Budgetary Slack’, The Accounting Review, Vol. 48, No. 3, pp. 535-548
Otley, D.T. (1978), ‘Budget use and Managerial Performance’, Journal of Accounting Re-search, Vol. 16, pp. 122-149
Otley, D.T. (1980), ‘The contingency theory of management accounting: achiement and prognosis’, Accounting, Organizations and Society, Vol. 5, No. 4, pp. 413-428.
Otley, D.T. (2003), ‘Management control and performance management: whence and whither?’, The British Accounting Review, Vol. 35, No. 4, pp. 309-326.
Otley, D. and A. Fakiolas (2000), ‘Reliance on accounting performance measures: dead end or new beginning?’, Accounting, Organizations and Society, Vol. 25, No. 4/5, pp. 497-510.
Otley, D.T. and B.J. Pierce (1995), ‘The Control Problem in Public Accounting Firms: An Emperical Study of the Impact of Leadership Style’, Accounting, Organizations and Society, Vol. 20, No. 5, pp. 405-420
Perrow, C. (1967), ‘A framework for comparative organizational analysis’, American Socio-logical Review, Vol. 32, pp. 194-208.
Pollitt, C. and G. Bouckaert (2004), Public Management Reform; A Comparative Analysis (2nd edition, Oxford: Oxford University Press).
Pugh, D.S., D.J. Hickson; C. R. Hinings and C. Turner (1968), ‘Dimensions of Organization Structure’, Administrative Science Quarterly, Vol. 13, No. 1, pp. 65-105.
Rockness, H.O. and M.D. Shields (1984),’ Organizational control systems in research and development’, Accounting, Organizations and Society, Vol. 9, No. 2, pp. 165-177.
Ross, A. (1994), ‘Trust as a Moderator of the Effect of Performance Evaluation Style on Job-Related Tension: A Research Note’, Accounting, Organizations and Society, Vol. 19, No. 7, pp. 629-635.
Ross, A. (1995), ‘Job Related Tension, Budget Emphasis and Uncertainty: A Research note’, Management Accounting Research, Vol. 6, No. 1, pp. 1-11.
Said, A.A., H.R. HassahElnaby and B. Wier (2003), ‘An Empirical Investigation of the Per-formance Consequences of Nonfinancial Measures’, Journal of Management Accounting Re-search, Vol. 15, pp. 193-223.
Simons, R. (1987), ‘Accounting Control System and business Strategy: An Empirical Analy-sis’, Accounting, Organizations and Society, Vol. 12, No. 4, pp. 357-374.
Singh, J.V., (1986), ‘Performance, slack, and risk taking in organizational decision making’ Academy of Management Journal, Vol. 29, No. 3, pp. 562-585.
Van de Ven, A.H. and A.L. Delbecq (1974), ‘The effectiveness of nominal, Delphi, and inter-acting group decision making processes’, Academy of Management Journal, Vol. 17, No. 4, pp. 605-621.
Van der Stede, W.A. (2000), ‘The relationship between Two Consequences of Budgetary Control: Budgetary Slack Creation and Manegerial Short-Term Orientation’, Accounting, Or-ganizations and Society, Vol. 25, No. 6, pp. 609-622.

42
Verbeeten, F.H.M. (2008), ‘Performance management practices in public sector organiza-tions: Impact on performance’, Accounting, Auditing and Accountability Journal, Vol. 21, No. 3, pp. 427-454.
Williams, J.J. and A.E. Seaman (2002), ‘Management accounting systems change and de-partmental performance: the influence of managerial information and task uncertainty’, Man-agement Accounting Research, Vol. 13, No, 4, pp. 419-445.
Williams, J.J., N.B. Macintosh and J.C. Moore (1990), ‘Budget-Related Behaviour In Public Sector Organizations: Some Empirical Evidence’, Accounting, Organizations and Society, Vol 15, No. 3, pp 221-246.
Wisniewski, M. and S. Olafsson, S. (2004), ‘Developing balanced scorecards in local authori-ties: a comparison of experience’, International Journal of Productivity and Performance Management, Vol. 53 No.7, pp. 602-10.
Withey, M., R.L. Daft and W.H. Cooper (1983), ‘Measures of Perrow’s Work Unit Technol-ogy: An Emperical Assessment and a New Scale’, Academy of Management Journal, Vol. 26, pp. 45-63.
Zimmerman, J.L. (1976), ‘Budget Uncertainty and the Allocation Decision in a Nonprofit Or-ganization’, Journal of Accounting Research, Vol. 14, No. 2, pp. 301-319.

43
Tables
Table 1: Overview of research method and object of RAPM papers8
Study Data collec-tion method
Branch Respondent characte-
ristics
Usable n Country
Abernethy and Brownell, 1997
Survey (1st) and inter-views (2nd)
Large industri-al company and scientific organization
senior research officers in research and devel-opment (R&D) divi-sions
127 Australia (industrial company) and US (scientific organization)
Barrett et al., 1992
survey Medium-sized manufacturing companies
senior marketing man-agers and their subordinates
72 UK
Brownell, 1981
experiment University students and a large manu-facturing com-pany
Students from an un-dergraduate account-ing course and mana-gerial personnel
46 (stu-dents) / 48 (man. company)
US
Brownell, 1982
Questionnaire (survey?)
a large manu-facturing com-pany
Managers holding cost responsibility and representing separate functional divisions
48 US
Brownell, 1985
Survey (1st) and inter-views (2nd)
large multina-tional electron-ics and com-puter business
managers drawn from the marketing and R&D activities (1) and vice-presidents (2) of each function
61 n.i.
Brownell and Dunk, 1991
Survey Manufacturing organizations
Managers in different functional areas, in-cluding production, marketing, research and development, en-gineering and adminis-tration.
79 Australia
Brownell and Hirst, 1986
Survey A large manu-facturing or-ganization
line managers representing a wide variety of functions (i.e., marketing, pro-duction, research, ad-ministration, and dis-tribution)
76 Australia
Brownell and McIness, 1986
Survey Two compa-nies in the electronics industry and one company in the steel industry
224 middle-level man-agers drawn from a variety of functional areas
108 n.i.
Dunk, 1989 n.i. Consumer Production managers 26 UK
8 This table provides an overview of the research method and object of the papers that are reported by
Hartmann (2000) and Noeverman (2007). One paper was added to this list (Hartmann, 2005).
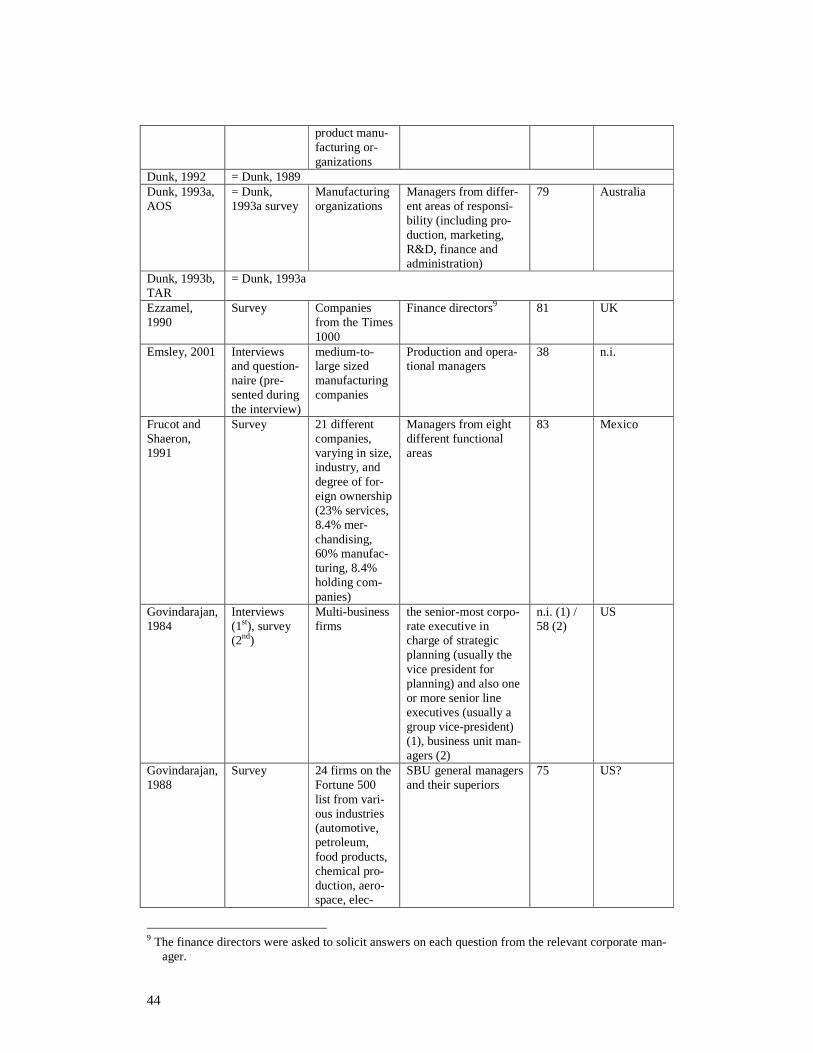
44
product manu-facturing or-ganizations
Dunk, 1992 = Dunk, 1989 Dunk, 1993a, AOS
= Dunk, 1993a survey
Manufacturing organizations
Managers from differ-ent areas of responsi-bility (including pro-duction, marketing, R&D, finance and administration)
79 Australia
Dunk, 1993b, TAR
= Dunk, 1993a
Ezzamel, 1990
Survey Companies from the Times 1000
Finance directors9 81 UK
Emsley, 2001 Interviews and question-naire (pre-sented during the interview)
medium-to-large sized manufacturing companies
Production and opera-tional managers
38 n.i.
Frucot and Shaeron, 1991
Survey 21 different companies, varying in size, industry, and degree of for-eign ownership (23% services, 8.4% mer-chandising, 60% manufac-turing, 8.4% holding com-panies)
Managers from eight different functional areas
83 Mexico
Govindarajan, 1984
Interviews (1st), survey (2nd)
Multi-business firms
the senior-most corpo-rate executive in charge of strategic planning (usually the vice president for planning) and also one or more senior line executives (usually a group vice-president) (1), business unit man-agers (2)
n.i. (1) / 58 (2)
US
Govindarajan, 1988
Survey 24 firms on the Fortune 500 list from vari-ous industries (automotive, petroleum, food products, chemical pro-duction, aero-space, elec-
SBU general managers and their superiors
75 US?
9 The finance directors were asked to solicit answers on each question from the relevant corporate man-
ager.

45
tronics, con-sumer du-rables, clothing manufacture and retail, and various con-sumer nondu-rables indus-tries)
Govindarajan and Gupta, 1985
= Govindarajan, 1984
Gupta, 1987 = Govindarajan, 1984 Harrison, 1992
Survey Department and Retail stores
Middle-level managers in the merchandising and buying functions
117 Singapore Australia
Hartmann, 2005
Survey Diverse organ-izations (both public and private sector)
Responsibility centre managers, across func-tional areas and posi-tions in the organiza-tional hierarchy, in-cluding line and staff managers, and of a single (Dutch) natio-nality.
196 The Nether-lands
Hirst, 1981 No empirical data Hirst, 1983 survey Diverse organ-
izations (not specified)
Part-time students who are responsible for at least one subordinate, and accountable to a superior.
111 Australia
Hirst, 1987 No empirical data Hirst and Yetton, 1984
= Hirst, 1983
Hopwood, 1972, 1973 and 1974
Questionnaire (1st), inter-view (2nd)
One manufac-turing division of a large company
S: Cost center manag-ers/departmental su-pervisors, I: cost center managers as well as other signif-icant members of their organizational role sets (including supervisors, fellow cost center heads, cost center heads in other closely related departments, departmental adminis-trators, departmental accountants and mem-bers of the company’s sales department)
167 (1), 20 (2)
US
Hughes and Kwon (1990)
= Merchant, 1985
Imoisili, 1989 survey Manufacturing companies
Cost center managers and their superiors
102 US?
Kenis, 1979 survey Manufacturing companies
Department managers and supervisors of
169 US
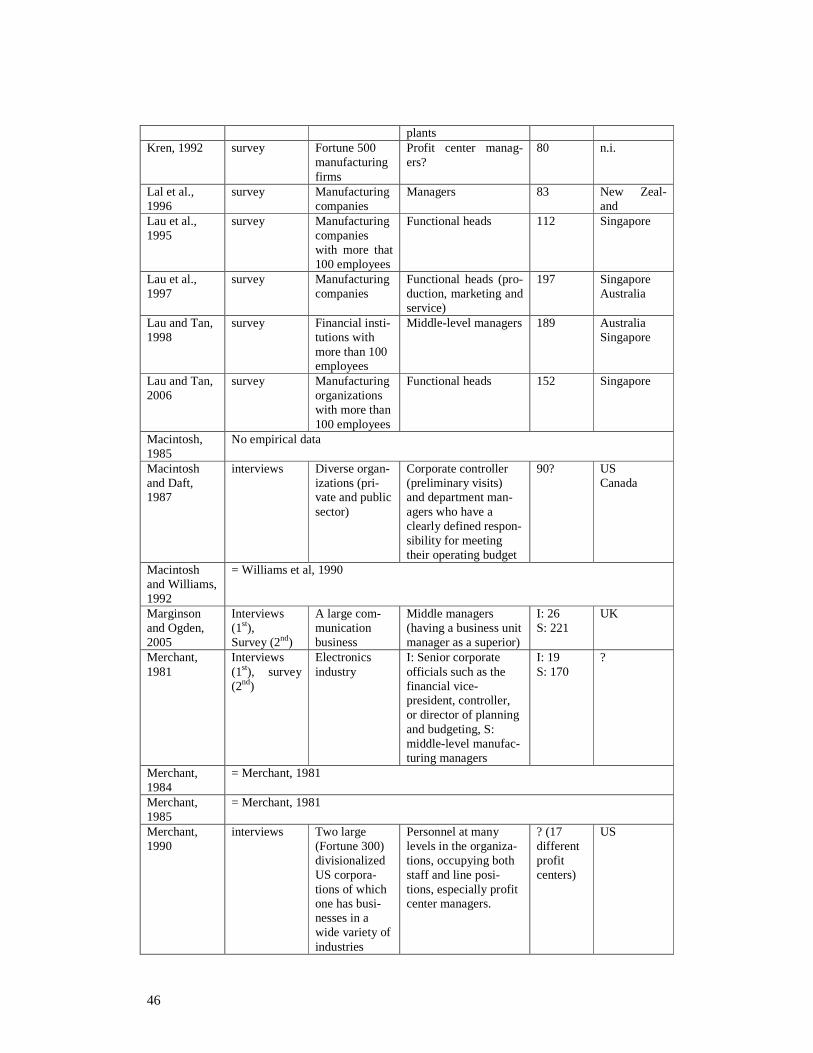
46
plants Kren, 1992 survey Fortune 500
manufacturing firms
Profit center manag-ers?
80 n.i.
Lal et al., 1996
survey Manufacturing companies
Managers 83 New Zeal-and
Lau et al., 1995
survey Manufacturing companies with more that 100 employees
Functional heads 112 Singapore
Lau et al., 1997
survey Manufacturing companies
Functional heads (pro-duction, marketing and service)
197 Singapore Australia
Lau and Tan, 1998
survey Financial insti-tutions with more than 100 employees
Middle-level managers 189 Australia Singapore
Lau and Tan, 2006
survey Manufacturing organizations with more than 100 employees
Functional heads 152 Singapore
Macintosh, 1985
No empirical data
Macintosh and Daft, 1987
interviews Diverse organ-izations (pri-vate and public sector)
Corporate controller (preliminary visits) and department man-agers who have a clearly defined respon-sibility for meeting their operating budget
90? US Canada
Macintosh and Williams, 1992
= Williams et al, 1990
Marginson and Ogden, 2005
Interviews (1st), Survey (2nd)
A large com-munication business
Middle managers (having a business unit manager as a superior)
I: 26 S: 221
UK
Merchant, 1981
Interviews (1st), survey (2nd)
Electronics industry
I: Senior corporate officials such as the financial vice-president, controller, or director of planning and budgeting, S: middle-level manufac-turing managers
I: 19 S: 170
?
Merchant, 1984
= Merchant, 1981
Merchant, 1985
= Merchant, 1981
Merchant, 1990
interviews Two large (Fortune 300) divisionalized US corpora-tions of which one has busi-nesses in a wide variety of industries
Personnel at many levels in the organiza-tions, occupying both staff and line posi-tions, especially profit center managers.
? (17 different profit centers)
US

47
O’Connor, 1995
Interviews (1st) and sur-vey (2nd)
Manufacturing organizations
I: General Manag-ers/Managing Direc-tors and/or their Direc-tors of Personnel, S: Middle-level managers
I: 62? S: 125
Singapore
Onsi, 1973, TAR
Interviews (1st), survey (2nd)
Interviews: Large, national and interna-tional multidi-visional com-panies Survey: large multinational manufacturing corporations
I: corporate control-lers, budget directors, production vice-presidents, sales vice-presidents, and divi-sional managers S: divisional control-lers, budget directors, cost analysts, manu-facturing manager, sales managers
107 US
Otley, 1978 Interview (1st), ques-tionnaire (2nd), docu-ment analysis (3rd)
One single large manufac-turing organi-zation
Interview and survey: unit managers and group staff
41 UK
Otley and Pierce, 1995
survey Big Six audit firms
Audit seniors 257 Ireland
Ross, 1994 survey Diverse organ-izations (both public and private sector)
Senior and middle-level managers having responsibility center control
215 Australia
Ross, 1995 = Ross, 1994 Simons, 1987 Interviews,
survey Manufacturing firms
I: senior general man-agers (usually the chief operating officer of the strategic business unit) S: chief executive of-ficer
I: 12 S: 171
Canada
Van der Stede, 2000
survey Diverse indus-tries (only pri-vate sector)
Business unit general managers
153 Belgium
Williams et al., 1990
Interviews, survey
Public sector organizations
Lower-level managers 201 Canada

48
Figure 4-1: Research model
Table 2: Non response analysis
Reason First mentioned rea-son
Second mentioned reason
Total
Filling in the question-naire is too time con-suming
62.3% (192) 0.0% (0) 62.3% (192)
It is the policy of my municipality not to par-ticipate in surveys
2.9% (9) 3.2% (10) 6.1% (19)
I am only recently ap-pointed manager in my department
10.1% (31) 5.5% (17) 15.6% (48)
I am an interim mana-ger
5.8% (18) 1.9% (6) 7.7% (24)
Some questions do not apply to my municipal-ity
1.0% (3) 2.6% (8) 3.6% (11)
I did not receive the questionnaire
0.6% (2) 0.6% (2) 1.2% (4)
I did respond 1.9% (6) 0.0% (0) 1.9% (6) I will respond 1.3% (4) 0.0% (0) 1.3% (4) Other reason/remarks 13.9% (43) 17.9% (55) 33.8% (98) 100.0% (308) 31.8% (98) 131.8% (406) Table 3: Representation analysis: Costs DCA per inhabitant (in EUR)
Mean costs Min. Max. S.D. All municipalities 25.69 1.78 278.58 14.44 Respondents non-response card 26.31 1.78 278.58 18.80 Respondents survey 27.31 1.78 278.58 23.00 Respondents survey – early response 25.75 1.78 101.68 12.15 Respondents survey – late response 30.44 2.85 278.58 35.90

49
Table 4: Representation analyse: Size of municipalities
Respondents All municipalities
Till 20,000 inh. 41.7% (96) 52.8% (260)
20-50,000 inh. 43.5% (100) 35.4% (174)
50-100,000 inh. 8.3% (19) 7.5% (37)
100,000+ inh. 6.5% (15) 4.3% (21)
Total 100.0% (230) 100.0% (492)
Average number of inh. 33.264** 28.522**
** Statistically significant differences (T-test) at p<0.05
Table 5: Response rate per department
Department Number of responses Number in analysis
department of civil affairs (DCA) 125 116
social security department (SSD) 84 77
DCA / SSD 21 21
ISD 6 -
Total 236 214
Table 6: Descriptive characteristics for variables
Variable Mean SD Possible range Observed range n Min. Max. Min. Max. DMA 2.32 2.38 0 8 0 8 203 RAPM_AM 3.59 0.62 0 5 1 5 214 RAPM_NF 4.19 0.51 0 5 2 5 214 RAPM_SUB 3.25 0.68 0 5 1 5 214 EU 2.05 0.43 0 5 1 3.63 214 TU 3.06 0.58 1 5 1.81 4.69 214 FU 2.10 0.83 1 5 1 4 214 OP 3.53 0.51 1 5 2 5 214 PD 7.39 0.70 1 10 5 9 213

Table 7: Correlation table all variables DMA RAPM_ AM RAPM_ NF RAPM_ SUB EU TU FU OP GC AEC PD DMA - -0.035 -0.087 -0.018 -0.056 0.181*** 0.106 0.033 -0.076 -0.008 -0.152** RAPM_ AM -0.035 - 0.347*** 0.221*** 0.045 -0.097 0.067 0.207*** 0.171** 0.090 -0.007 RAPM_ NF -0.087 0.347*** - 0.104 0.102 -0.032 -0.007 0.297*** 0.327*** 0.395*** 0.147** RAPM_ SUB -0.018 0.221*** 0.104 - -0.188*** -0.023 0.096 0.015 -0.096 -0.110 0.001 EU -0.056 0.045 0.102 -0.188*** - 0.037 -0.053 -0.053 0.020 0.135** 0.049 TU 0.181** -0.097 -0.032 -0.023 0.037 - -0.018 -0.087 -0.279*** -0.034 -0.122* FU 0.106 0.067 -0.007 0.096 -0.053 -0.018 - -0.141** -0.119* 0.160** -0.149** OP 0.033 0.207** 0.297*** 0.015 -0.053 -0.087 -0.141** - 0.391*** 0.416*** 0.178*** GC -0.076 0.171** 0.327*** -0.096 0.020 -0.279*** -0.119* 0.391*** - 0.338*** 0.249*** AEC -0.008 0.090 0.395*** -0.110 0.135** -0.034 -0.160** 0.416*** 0.338*** - 0.172** PD 0.111 0.032 0.104 0.083 -0.014 0.024 -0.094 0.178*** 0.197*** 0.131* 0.425*** n=203-214 (due to missing data)

Table 8: PLS analysis To From Coef. t-value RAPM-AM DMA -0.0377 0.7065 RAPM-NF DMA -0.0839 1.4471 RAPM-SUB DMA -0.0143 0.3292 GC RAPM_AM 0.0115 0.245 RAPM_NF 0.2204*** 2.9941 RAPM_SUB -0.1122* 1.736 EU -0.0246 0.4268 RAPM_AM * EU 0.2025*** 2.4981 RAPM_NF * EU -0.0969 1.3859 RAPM_SUB * EU -0.0056 0.1128 TU -0.2267*** 3.427 RAPM_AM * TU 0.0049 0.0971 RAPM_NF * TU 0.0241 0.6045 RAPM_SUB * TU 0.0284 0.5508 FU -0.0463 1.0944 RAPM_AM * FU -0.0462 0.8644 RAPM_NF * FU -0.0389 0.7582 RAPM_SUB * FU 0.1362* 1.9383 OP 0.2979*** 4.417 RAPM_AM * OP 0.0338 0.5696 RAPM_NF * OP -0.1172 1.4679 RAPM_SUB * OP 0.0696 1.2512 AEC RAPM_AM -0.1341* 1.7603 RAPM_NF 0.3195*** 3.9593 RAPM_SUB -0.0733 1.2802 EU 0.112* 1.7122 RAPM_AM * EU -0.1952* 1.948 RAPM_NF * EU -0.0758 1.1951 RAPM_SUB * EU -0.0154 0.2777 TU -0.0242 0.5578 RAPM_AM * TU -0.0522 0.8912 RAPM_NF * TU 0.0387 0.7818 RAPM_SUB * TU 0.1052* 1.7862 FU -0.1122** 2.0238 RAPM_AM * FU 0.083 1.2412 RAPM_NF * FU -0.0033 0.0702 RAPM_SUB * FU 0.0551 1.0686 OP 0.3144*** 4.5899 RAPM_AM * OP 0.0402 0.4912 RAPM_NF * OP -0.0424 0.7378 RAPM_SUB * OP 0.134* 1.7894 PD GC 0.1982*** 2.7835 AEC 0.1301* 1.6728 RAPM_AM 0.1% RAPM_NF 0.8% RAPM_SUB 0.0% GC 34.7% AEC 39.2% PD 7.5%
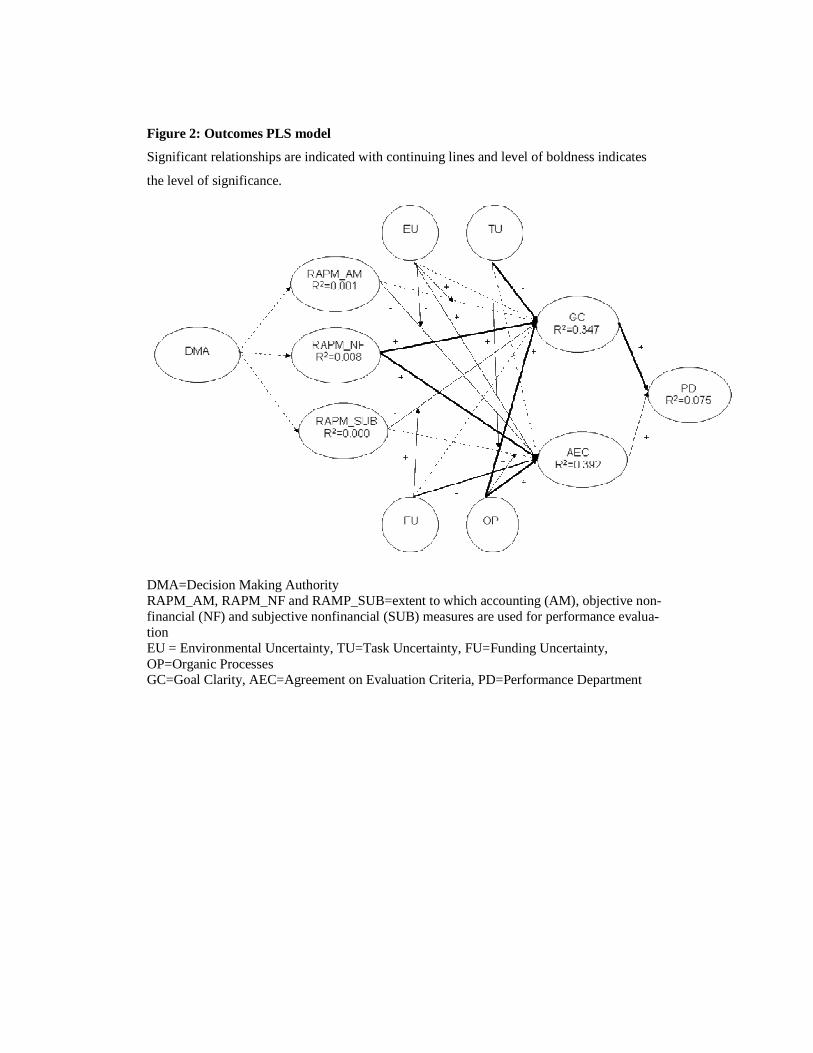
Figure 2: Outcomes PLS model
Significant relationships are indicated with continuing lines and level of boldness indicates
the level of significance.
DMA=Decision Making Authority RAPM_AM, RAPM_NF and RAMP_SUB=extent to which accounting (AM), objective non-financial (NF) and subjective nonfinancial (SUB) measures are used for performance evalua-tion EU = Environmental Uncertainty, TU=Task Uncertainty, FU=Funding Uncertainty, OP=Organic Processes GC=Goal Clarity, AEC=Agreement on Evaluation Criteria, PD=Performance Department