Embed Size (px)
Citation preview

Decentralization and Economic Performance in Indonesia
Thomas B. Pepinsky
Department of Government Cornell University
322 White Hall Ithaca, NY 14853
Maria M. Wihardja
Centre for Strategic and International Studies The Jakarta Post Building, 3rd Floor
Jl. Palmerah Barat no.142-143 Jakarta 10270, Indonesia [email protected]
Abstract
Indonesia’s 1999 decentralization law gave local governments in Indonesia an unprecedented opportunity to adopt pro-development policies. We estimate the effect of decentralization (enacted in 2001) on national economic performance using a synthetic case control methodology. Our results indicate that decentralization has had no discernable effect on Indonesia’s economic output as measured by gross domestic product. To explain this finding, we use subnational data to probe two mechanisms—interjurisdictional competition and democratic accountability—that underlie all theories linking decentralization to better economic outcomes. Our findings suggest that extreme heterogeneity in endowments, factor immobility, and the endogenous deterioration of local institutions can each undermine the supposed development-enhancing promises of decentralized government in developing countries.
FIRST VERSION: August 14, 2009 THIS VERSION: August 19, 2009
1
Decentralization and National Economic Performance in Indonesia
1. INTRODUCTION
Since 2001, Indonesia has embarked on a program of political and economic
decentralization that has fundamentally altered the political economy of the world’s fourth most
populous country. The law implementing decentralization (Indonesia 1999) focused on
improving the ability of local governments to respond to local conditions, but research
commonly links decentralization with superior national economic performance (see Breuss and
Eller 2004 for a review). Most simply, if decentralization yields development-enhancing policies
at the local level, then the sum of the effects of these policies should be improved economic
performance for the country as a whole. Other theoretical links between decentralization and
national economic performance include more participatory policymaking (Cheema and
Rondinelli 1983), lower inflation (Qian and Roland 1998), and more responsive taxation and
public spending (Tiebout 1956; Oates 1993). Accordingly, decentralization is a national
development policy that can yield national development outcomes—in the words of one
Indonesian observer, “through decentralization various national problems will be solved at the
regional level by using local means to cope with local challenges” (Simandjuntak 2003:1).
The specific mechanism through which decentralization may affect economic
development depend on how decentralization is implemented: under political decentralization,
local governments gain autonomous control over some local policies; under fiscal
decentralization, local governments gain the ability levy their own taxes; under various forms of
federalism, local governments may have veto authority over national policies.1 Indonesia’s 1999
decentralization law was more political than fiscal or federal, and local revenues still come
primarily through grants from the central government known as DAU (dana alokasi umum,
2
general allocation grants). Local taxation capabilities, though, were expanded in 2000.2 This
combination of political and fiscal decentralization has afforded local governments
unprecedented responsibility for “all areas of government except for foreign policy, safety, law,
monetary and fiscal policy, religion, and other matters” (Indonesia 1999; see also Brodjonegoro
2004; Seymour and Turner 2002). Indonesia’s decentralization has been heralded as a landmark
policy for advancing Indonesian development by giving local governments the ability to adopt
locally-appropriate regulations, to spend DAU funds in ways seen as suitable for local needs, and
to experiment with development- and welfare-enhancing policies.
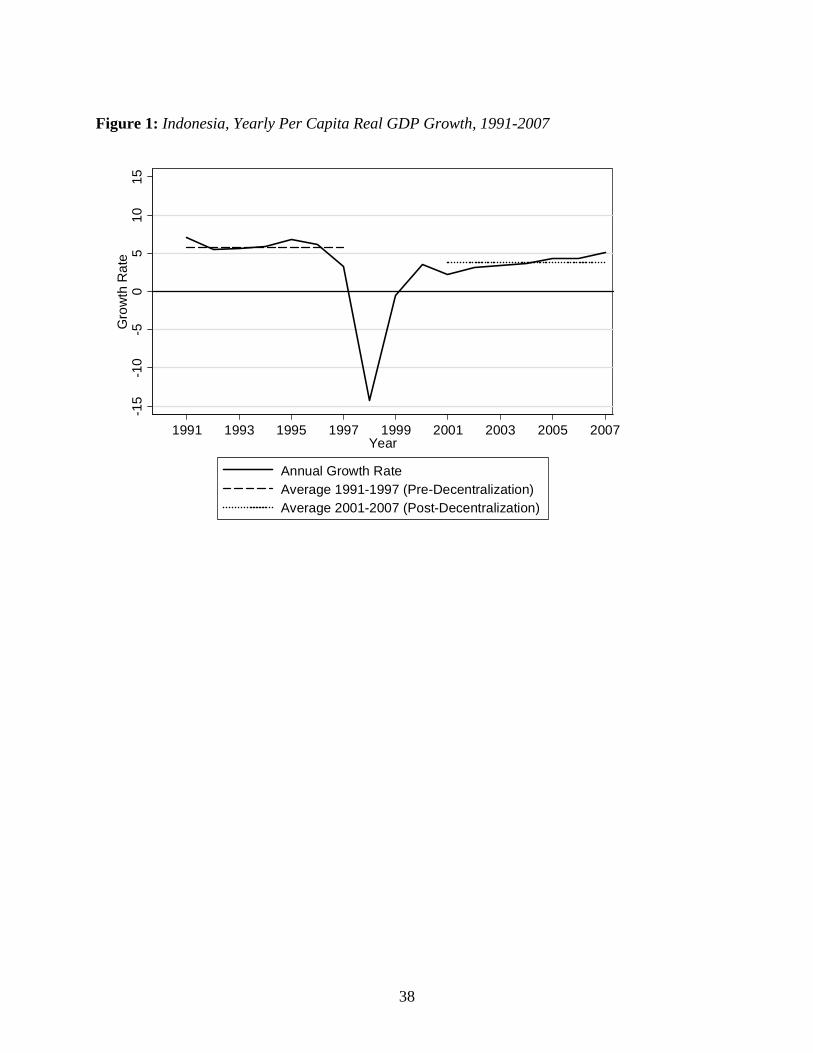
However, evidence that decentralization since 2001 has improved Indonesia’s national
economic performance is elusive. National growth rates since decentralization, for instance,
today still lag behind those achieved under the highly centralized New Order regime (1966-
1998) prior to the Asian Financial Crisis (see Figure 1). Furthermore, there are countless
examples of provincial and local governments that appear unwilling to take advantage of the
opportunities that decentralization has afforded them to create competitive business
environments and responsive social service administrations. Even if decentralization policy has
empowered some local governments to adopt good policies, it may also have empowered others
to adopt bad policies. The net effect of decentralization on Indonesia’s economic performance
therefore remains unclear.
*** Figure 1 about here ***
Our paper makes two contributions. First, we establish that decentralization has not been
associated with a rise in Indonesia’s economic output over and above the economic trajectory
that we would have expected had Indonesia not decentralized. The challenge in making this
claim is that decentralization occurred amidst a number of other dramatic changes in Indonesia’s

3
economy, including democratization and the painful aftermath of a severe financial crisis. To
separate the effect of decentralization from these and other factors, we adopt a synthetic case-
control research strategy proposed by Abadie et al. (2009). We use information from other
developing countries to construct a “synthetic” Indonesia that is as close to possible to Indonesia
but which did not decentralize. Using this strategy, we estimate that Indonesia’s economic output
(as measured by gross domestic product) remains nearly identical to what we predict from a
synthetic Indonesia that has not decentralized, and that this gap has not decreased since the onset
of decentralization in 2001.
Second, to explain why decentralization has not been improved Indonesia’s economic
trajectory in the way that many of decentralization’s proponents believe that it should, we
explore three pathologies of Indonesian decentralization that undermine decentralization’s
desired outcomes: heterogeneity in endowments across jurisdictions, factor immobility, and
endogenous institutional quality. We support our arguments using a mix of individual level
survey data, subnational economic data, and comparative case studies. We argue that
heterogeneity in endowments across Indonesian districts suggests that the mere imposition of
decentralized governance will not force local governments to compete for productive resources.
Moreover, even it were reasonable to expect that decentralization could prompt competition, the
immobility of both labor and capital across jurisdictional boundaries has prevented factors of
production from “voting with their feet,” suggesting that local politicians may be able to exploit
productive assets rather than competing for them. And finally, we argue based on qualitative
research in carefully selected field sites that institutions in backward areas have themselves
deteriorated in response to decentralization. This endogenous institutional decay has undermined

4
the foundations upon which successful local development might occur in the districts where it is
most necessary.
These findings contribute to recent theoretical and empirical studies that explore the logic
of decentralization in order to understand the conditions under which its salutary benefits are
likely to be achieved (see Treisman 2007). Before proceeding, though, we wish to make two
things clear. First, ours is not a critique of decentralization as a theoretical concept or as
practiced in any other country. We have no doubt that under certain conditions (although perhaps
very restrictive ones) we should expect that decentralization will increase national welfare.
Moreover, economic output is not the only metric to measure the “success” of Indonesia’s
decentralization. Other metrics by which to judge decentralization’s success may include other
national economic outcomes such as inflation or central government deficits, or local outcomes
such as the presence or absence of local civil violence and levels of political participation. For
example, by giving citizens greater ability to participate in government, decentralized
government may be normatively superior to centralized government even if it does not contribute
to national development. We leave the systematic study of these alternative measures of
decentralization’s impact on Indonesia for future research.
Second, we make no claim that we have exhaustively catalogued all of the challenges
facing Indonesia in the era of decentralization. Likewise, we do not attempt to gauge the relative
importance of each of the three pathologies we identify for explaining why decentralization has
not been associated with better economic outcomes in Indonesia. Our goals are more modest: to
estimate the overall effect of decentralization on Indonesian development, and to probe several
plausible reasons why we find that this overall effect is zero.
5
The paper proceeds in three parts. In Section 2, we present our main empirical results,
demonstrating that decentralization has not corresponded to an increase in Indonesia’s gross
domestic product when compared to a synthetic control case. To explain these findings, Section
3 probes the theoretical mechanisms linking decentralization to economic development,
identifying three key areas in which decentralization in Indonesia does not match theoretical
models and providing descriptive evidence that illustrates how each has hindered economic
development since decentralization. In Section 4 we conclude our argument and discuss its
implications for decentralization and development.
2. ESTIMATING DECENTRALIZATION’S EFFECT ON INDONESIAN ECONOMIC
PERFORMANCE Indonesia’s 2001 switch to decentralized governance was rapid—Hofman and Kaiser
(2003) call it a “Big Bang”—and happened in one of the world’s most diverse developing
countries. Within the space of just a year, decentralization fundamentally transformed
Indonesia’s political economy. The key inferential problem in studying how this transformation
has shaped Indonesia’s development trajectory is constructing a valid counterfactual. The
Neyman-Rubin causal model (Holland 1996) helps to clarify our objectives. We define the effect
of decentralization on Indonesian development as the difference in economic development
between an Indonesia that has decentralized and an Indonesia that has not decentralized.
Decentralization here can be considered much like a medical treatment, the effect of which is
studied by examining the average difference in health outcomes between those patients who have
taken the treatment and those who have not. The problem is that observing this quantity—the
difference in economic development between an Indonesia that has decentralized and an
Indonesia that has not decentralized—is impossible. Instead, we observe only economic

6
development in Indonesia prior to decentralization and economic development in Indonesia after
decentralization. The proper comparison would be between an Indonesia after decentralization
and, for lack of a better phrase, “an Indonesia after decentralization that did not decentralize.”
We of course cannot observe the latter.
Subnational data are not helpful in this regard, for subnational data too provide no
appropriate counterfactuals. If decentralization had occurred in only a portion of Indonesia’s
provinces or regencies, then we could compare those that had decentralized with those that had
not through some form of difference-in-difference estimation. But decentralization is by
definition a national policy, meaning that all of Indonesia’s regencies have taken the treatment.
One way to proceed would be to collect data from all countries in the world, and to
compare those countries who have decentralized from those who have not. The estimand there,
though, is the average effect of decentralization across all countries, and therefore is not suited to
addressing the effect of decentralization on Indonesian national development. Moreover,
Indonesia’s unique decentralization process has no obvious parallel among other countries, so it
is not clear what other countries display the relevant characteristics that would lead us to
differentiate them from other countries that lack them. To take one example, Indonesian
decentralization gave policy autonomy not to the first tier of subnational government (provinces)
but rather to the second tier, that of districts or regencies (kabupaten) and cities (kota).3 We do
not believe it is possible to assume that Indonesia’s post-decentralization governance structure is
equivalent to that of, say, India or the Philippines across all relevant dimensions.
Alternatively, we might select a single country that shared many of Indonesia’s
characteristics prior to decentralization, but which did not decentralize, and chart how
development has subsequently proceeded in the two countries. If variables held to have
7
determined economic development prior to decentralization were similar in both countries, then
we may infer that difference in development between Indonesia and the “control” country after
Indonesian decentralization is attributable to decentralization itself. Yet no single country seems
an obvious parallel to Indonesia at the close of the twentieth century—a middle-income country
with a large population, an outward-directed development model, relatively high adult literacy
rates, a long period of authoritarian rule followed by abrupt democratization, and long period of
rapid growth followed by a severe economic meltdown. Some countries (Bangladesh, Brazil,
China, India, Malaysia, Mexico, Pakistan, the Philippines, South Africa, Thailand) share one or
two of these characteristics, but none shares all of them.
This observation—that while no country shares all of Indonesia’s characteristics, many
countries share some of Indonesia’s characteristics—forms the basis of our empirical strategy.
Abadie et al. (2009) formalize this as a synthetic case control methodology to gauge the effect of
an intervention (in our case, decentralization) on a treated unit (in our case, Indonesia) and the
uncertainty around that estimate. Let Y1 stand for the post-treatment outcome in the treated case,
let X1 stand for the possible determinants of that outcome in the treated case, let Y0 stand for the
outcome in all non-treated cases, and let X0 stand for the determinants of Y0 in the non-treated
cases. Abadie et al.’s core insight is that among the sample of available control units (in our case,
all countries aside from Indonesia), a weighted average of them can form a “synthetic” Indonesia
which is far more similar across all possible determinants the outcome of interest than is any
single control unit. The weights W* are chosen by searching across the entire set of possible
weights to minimize the difference between the between the synthetic control and the treated unit
prior to the intervention; that is, to minimize WXX 01 − according to some distance metric.4 In
our application, this means choosing W* to produce a synthetic Indonesia whose determinants of
8
economic development were as similar as possible to Indonesia’s prior to decentralization in
2001. The growth trajectory of this synthetic Indonesia after 2001, or WYY 0*
1 = , simulates the
counterfactual of Indonesia’s growth trajectory absent decentralization. To see how Indonesia’s
growth trajectory differs from that of the synthetic control case, we simply compare *1tY and tY1 ,
where t indexes each year after decentralization.
Abadie et al.’s method has several attractive features. Most importantly, it exploits the
full range of information available from all possible control cases, and does not require that any
single control case be considered the perfect counterfactual. Additionally, this method also
makes explicit (1) the relative contribution of each control unit to the counterfactual of interest; and (2) the similarities (or lack thereof) between the unit affected by the event or intervention of interest and the synthetic control, in terms of pre-intervention outcomes and other predictors of post-intervention outcomes (Abadie et al. 2007:3).
Finally, it is possible to provide some sense of the uncertainty surrounding the estimated effects
of the treatment through a “placebo” methodology, estimating the “effect” of the treatment for all
remaining cases in the sample—none of which actually experienced it. If, on average, the
estimated effect for the treated case is large relative to the estimated effect from a placebo case
chosen at random, this increases our confidence that the treatment truly had an effect. We
generate synthetic control cases for every country in our sample, as if each decentralized in 2001.
We then compare these to the effects we estimate for Indonesia to determine whether the
estimate for Indonesia differs systematically from these.
We measure economic development using the natural log of gross domestic product per
capita in constant 2000 US dollars (LNGDPPC). A list of common predictors of gross domestic
product per capita, which comprise the variables we will use to construct a synthetic case control
version of Indonesia, appears in Table 1.

9
*** Table 1 about here ***
Our choice of variables is somewhat more expansive than that of the existing literature using
synthetic case control methods to study economic development (e.g. Abadie and Gardeazabal
2003; Abadie et al. 2007:26-29), for we wish to account for both the important political changes
that have affected Indonesia since 1998 and the painful economic reversal that accompanied the
Asian Financial Crisis. To accomplish the former, we add data on political democracy, regime
durability, checks and balances, and federalism. To accomplish the latter, we use lagged versions
of LNGDPPC in 1990 (the first year in our sample), 1996 (the final year before the onset of the
Asian Financial Crisis), and 2000 (the final year before the onset of decentralization in 2001) as
additional predictors, along with a variable denoting the existing of a speculative attack on a
country’s currency. Excluding both the lags of LNGDPPC and the additional political variables in
our analysis in no way changes our substantive inferences about the consequences of Indonesian
decentralization, although the root mean squared error of our pre-treatment predictions (RMSPE)
increases when we omit prior values of LNGDPPC as predictors.
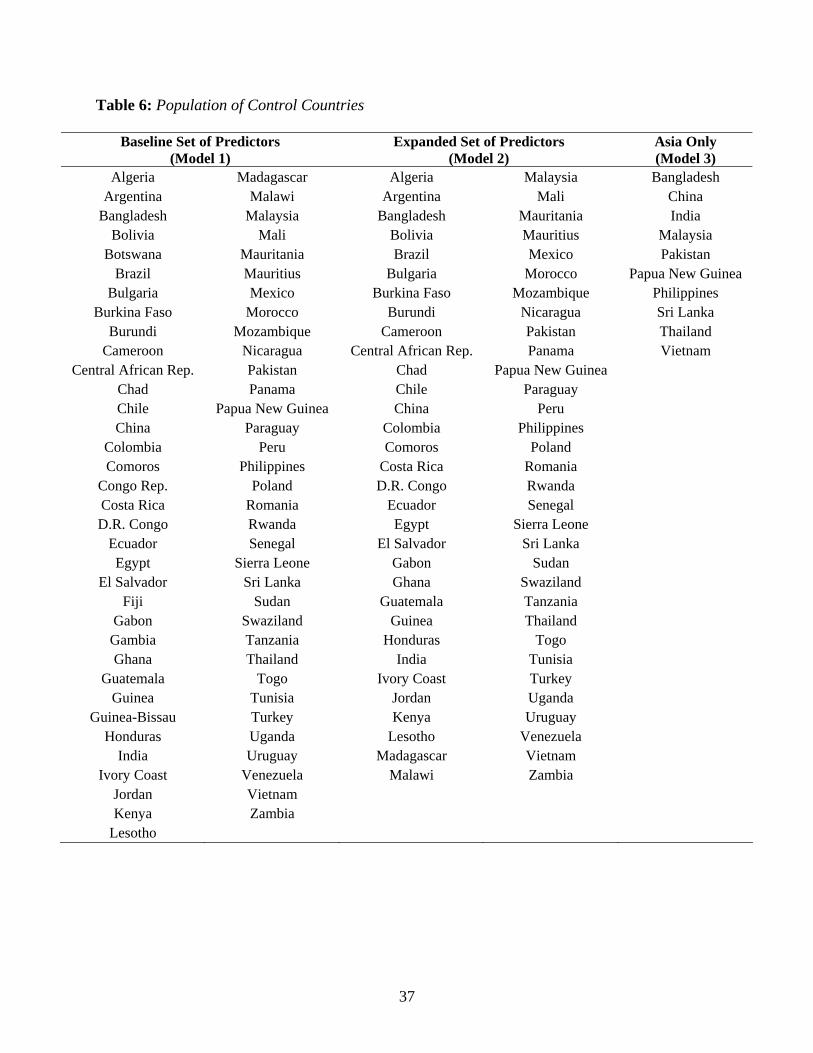
We choose a wide sample of countries as possible control countries, selecting all
countries for which data is available for at least some portion of the period prior to 2001 and
whose per capita gross domestic product is less than US$10,000 in constant 2000 prices. Our
broadest sample includes sixty-nine possible control countries (see the Appendix), although this
sum shrinks to sixty-five possible control countries when we adopt an expanded set of predictors
that includes political variables and adult literacy. Below, we show results using both the
restricted set of predictors (Model 1) and the expanded set of predictors (Model 2). We also
show results using only Asian countries as possible predictors (Model 3).

10
Data on pretreatment predictors for Indonesia and synthetic control countries, across all
three models, appear in Table 2. We also include the average for all available control cases as a
reference, as well as the relative contributions of each country to the synthetic control and the
error of the estimate (W*).
*** Table 2 about here ***
As Table 2 shows, across most variables in all three models a weighted average of control
countries is an improvement over a simple average of all control countries for Indonesia. The
notable exception is for the political variables POLITICAL REGIME and DURABILITY, where our
synthetic controls are less similar to Indonesia than a simple average of all countries. We have
experimented with a number of measures of political regimes, and with other time periods, and
all produce synthetic controls whose balance is even worse than this. We interpret this to mean
that we simply do not have sufficient data in among our control units to produce a suitable
counterpart for Indonesia on these political variables. Finally, in all three models, the root mean
squared prediction error is small; the placebo studies presented below give a sense of how small
this is.
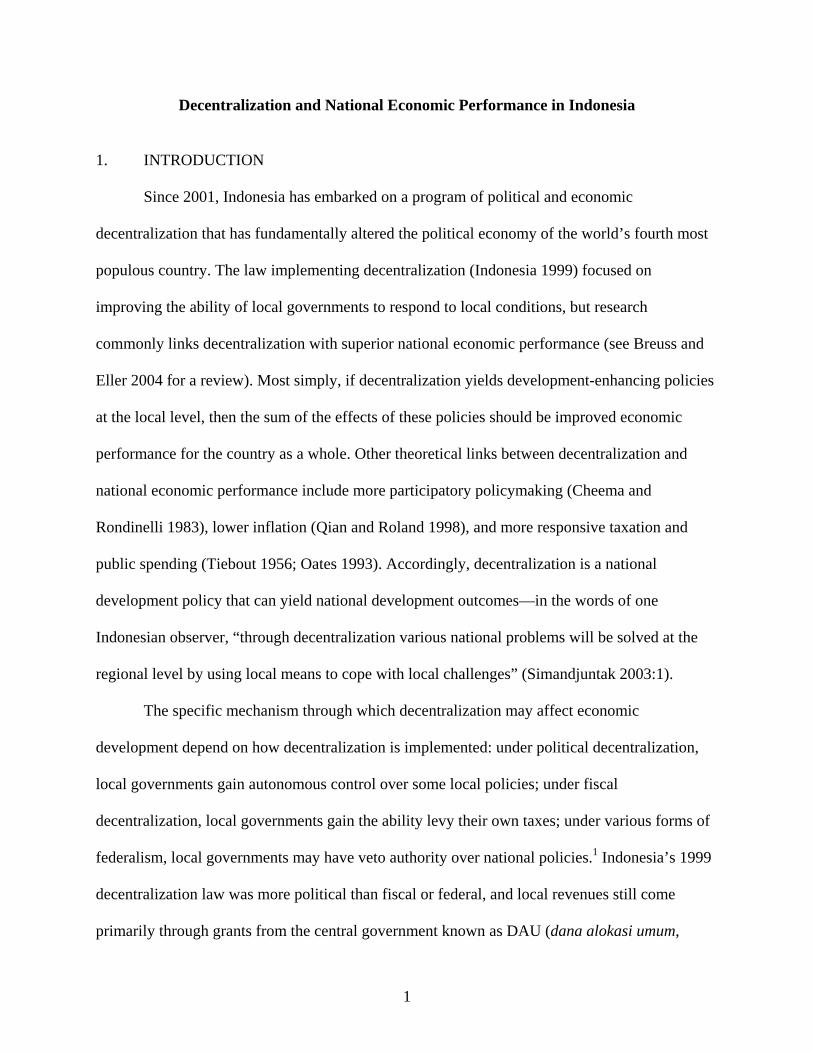
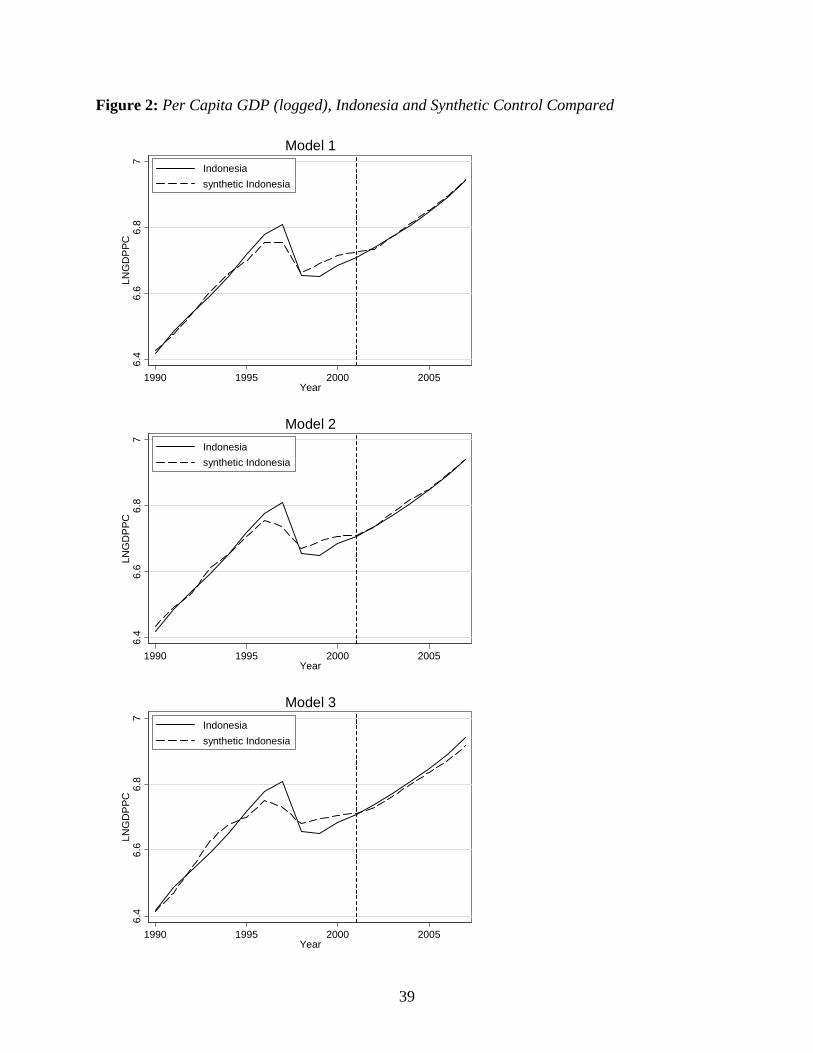
Our main results appear in Figure 2. Each figure shows the path of LNGDPPC for
Indonesia (solid line) and the synthetic control case (dashed line) from 1990 until 2007. The
vertical lines at 2001 mark the onset of decentralization. There are two important conclusions
from this figure. First, in all three models, Indonesia’s level of development prior to 1997 tracks
very closely that of its synthetic counterpart. This correspondence breaks down during the Asian
Financial Crisis, which simply indicates that the crisis in Indonesia was worse than might have
been expected given standard determinants of economic output, but prior to 1997 our method
performs very well in creating a synthetic control for Indonesia. The second and more striking

11
conclusion is that the lines corresponding to Indonesia and its synthetic counterpart track one
another extremely well after 2001 in all three models as well. That is, the development trajectory
for Indonesia since the onset of decentralization is nearly identical to what we might expect
given a country with similar economic, demographic, and political fundamentals but which did
not adopt Indonesia’s policy of decentralization. This holds regardless of the variables that we
use to predict economic development, and regardless of which countries we consider as
appropriate control countries. We estimate the effect of decentralization on national development
in Indonesia by the difference between the growth trajectory of Indonesia and that of the
synthetic Indonesia, and Figure 2 indicates that this effect is at best small (Model 3), and at worst
non-existent (Models 1 and 2).
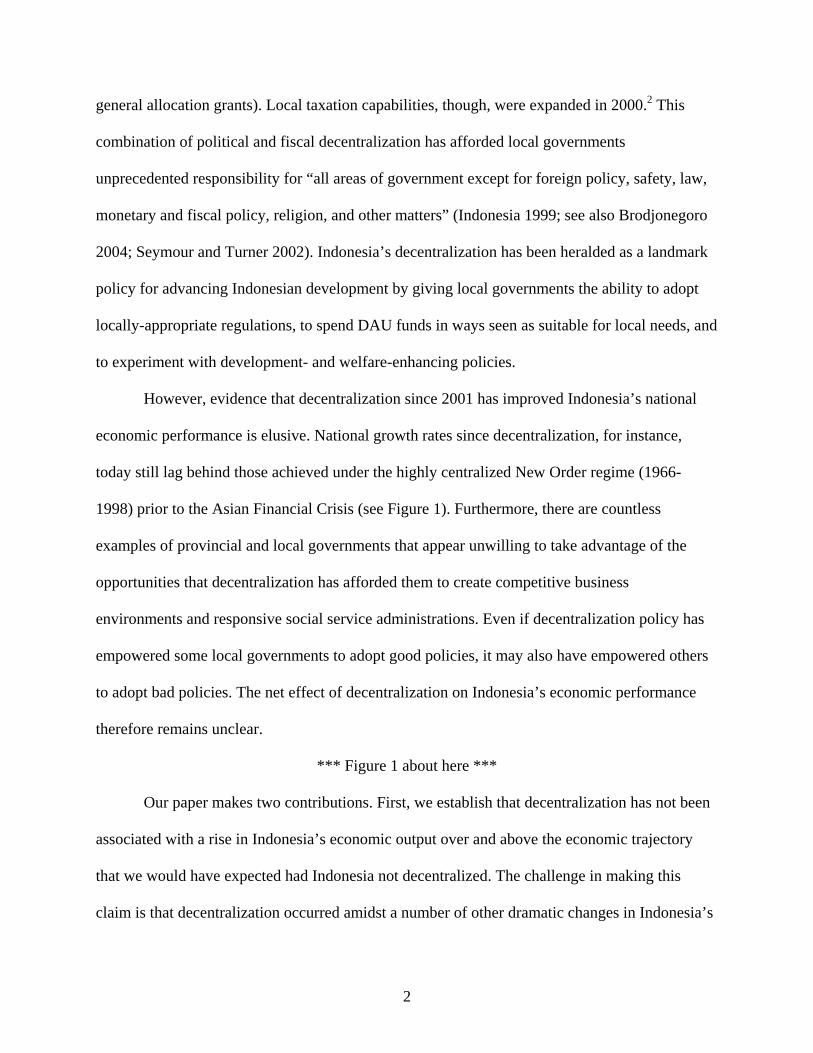
How confident are we in these findings? We turn to this question in Figure 3, which
contains the results of our placebo analysis. The thick black line is the difference between growth
trajectories in Indonesia and its synthetic counterpart (calculated above), so that values below
(above) than zero indicate a lower (higher) than expected per capita GDP. Each thin gray line
corresponds to a similar estimate derived for each individual country in the sample. If our
estimates for Indonesia are large relative to those derived from other countries—in which case
the black line would lie either above or below the mass of gray lines—then we conclude that
decentralization had an effect on Indonesia’s economic output. Otherwise, we will conclude that
our results do not indicate that decentralization has had an effect on Indonesia’s output.
*** Figure 3 about here ***
As expected, Figure 3 shows that the estimates for Models 1 and 2, which found that
decentralization had no effect on Indonesia’s economic output, lie well within the range of
placebo estimates. However, Model 3 (see Figure 2) indicated that if we discard all non-Asian

12
countries from the sample used to construct a synthetic Indonesia, we estimate a small positive
effect of decentralization on economic output. But Figure 3 gives us a sense of our confidence
around that estimate—and it shows that this Model 3’s estimated effect lies precisely in the
middle of the ranges estimated in the placebo study using that sample of countries. We cannot
conclude based on these results that decentralization has had any effect on Indonesia’s economic
output. This conclusion holds even if we discard all placebo control cases from Model 3 whose
RMSPE is less than twice that of Indonesia.5
Taken together, these results indicate that Indonesia’s 2001 decentralization has not had
any appreciable effect on Indonesia’s economic performance. What effect decentralization has
had, moreover, is indistinguishable from what we estimate using a placebo case study
methodology. These results are disappointing for proponents of decentralization as a
development strategy, and call for further investigation. It is to this task that we now turn.
3. THREE PATHOLOGIES OF INDONESIAN DECENTRALIZATION
We focus our discussion of the pathologies of Indonesian decentralization on two central
theoretical mechanisms linking decentralization to superior development outcomes. Because
decentralization gives power to subnational governments, both require us to turn our attention to
subnational political processes and the outcomes that they produce. The first claim is that
interjurisdictional competition forces all local governments to adopt superior policy outcomes.
The second claim is that local democracy forces local governments to adopt welfare-enhancing
policies. Indonesia’s experiences over the past decade reveal that neither of these two
mechanisms appears to be consistently at work across local governments. While local
governments are now free in principle to compete over productive resources, in contemporary
Indonesia extreme heterogeneity across districts and factor immobility hinder these competitive

13
pressures. And while under decentralization local governments are now more accountable to
their citizens than ever before, our field research demonstrates that socioeconomically backward
districts—those for which decentralization’s benefits are most critical—are least likely to have
responsive local governments that will be held accountable by their citizens for failing to adopt
welfare-enhancing policies.
3.1. Heterogeneous Districts
The literature on decentralization suggests that interjurisdictional competition for
resources (usually capital, but also labor) provides a market-like incentive for governments to
provide good policies (see e.g. Montinola et al. 1995; Qian and Roland 1998; Weingast 1995).
Under decentralization, local governments are free to experiment and innovate; those
governments that respond to market demands to provide good policies will attract capital, and
those that fail to adopt good policies will not. Seeing this, the latter group of governments will
adopt policies that resemble the former. Citing this same literature, though, Cai and Treisman
(2005), note that these theoretical results depend critically on the assumption that jurisdictional
units are sufficiently similar for competition to feasible. As an illustrative example, they offer the
following: “even if the Russian republic of Buryatia were to install high-speed fibre-optic cables,
it would not divert much business from Moscow and St. Petersburg” (Cai and Treisman
2005:818). This is because these Moscow and St. Petersburg are so different from their more
backward counterparts elsewhere that no amount of public goods investment or good
government in the backwards regions could induce most businesses to relocate there. Hence
decentralization cannot induce interjurisdictional competition over these businesses. Cai and
Treisman (2005) further demonstrate that under such conditions the governments of backward
14
regions will actually be more likely to adopt predatory local regulations, a claim which we find
plausible but bracket for the purposes of this study.
Are Indonesia’s regions similar enough to one another that all regions can feasibly
compete for the same productive resources? We argue that they are not. Geographical differences
are most obvious. Throughout history, proximity to key trade routes has been an important non-
competitive resource, and today, for example, provinces located near Singapore enjoy significant
locational advantages over other provinces in attracting investment in manufacturing. The city of
Batam (Kota Batam) in the province of Riau Islands, located less than ten miles from Singapore,
enjoys a series of business-friendly regulatory exemptions, including among others exemptions
on all import, export, and value-added taxes, that make it an attractive hub for manufacturers.
According to Batam Center (2009), “proximity to Singapore is one of the advantages so
investors will not feel isolated in Batam. Batam is developed to take benefit of the progress that
has been achieved by its neighbour.” While other cities in Indonesia might also be designated as
free trade and investment zones, none could replicate Batam’s close proximity to Singapore, and
hence none could enjoy the locational benefits that Batam enjoys. It is also worth noting that
Batam’s pro-business policies stances are the result not only of a cooperative local government
that works closely with industry groups (Batam Center 2009) but also required the approval of
Indonesia’s central government in Jakarta, which retains authority over trade and tax policies.
Central government regulations, for example, still forbid all trade from the Batam free trade zone
outside of five designated ports (“SBY kicks off Batam free trade zone,” Jakarta Post, January
20, 2009). While Kota Batam’s growth prospects under decentralization are quite high, it is not
realistic to believe that competitive pressures will force other cities and regencies to adopt
similar policies in order to recreate Kota Batam’s policies, no matter how successful they are.

15
Human capital endowments differ starkly as well, both across regions and within them.
Across provinces, adult literacy rates in 2005 ranged from a high of 98.87% in North Sulawesi to
a low of 71.58% in Papua (Statistics Indonesia 2009). Within the province of Central Java,
whose provincial literacy rate is slightly below the national average, local literacy rates range
from a high of 96.53% in Kota Salatiga to a low of 74.89% in the kabupaten of Sragen. While it
is certainly possible that governments in Salatiga and Sragen could each adopt investment-
friendly policies, it is unlikely that any sort of policy innovation in Sragen could entice firms in
need of a skilled workforce to relocate from Salatiga6. Development-enhancing policy reforms in
Sragen will not take place because of interjurisdictional competition, but rather in spite of its
absence.
The examples of interregional differences in geography and human capital are
illustrative, but there may be other ways in which regions are similar, meaning that decentralized
governance can still prompt competitive pressures in other domains. One way to check if, on
balance, decentralization has generated enough pressures to produce superior performance is to
examine how development outputs have changed across regions under decentralization.
Consistent with our focus on economic performance, we focus on gross regional domestic
product (GRDP) as our development output of interest. If decentralization has led to policy
convergence on pro-development policies, then due to the law of diminishing returns, regional
growth rates in GRDP should be negatively correlated with initial GRDP—the well-known
convergence hypothesis derived from the neoclassical growth model (see Barro 1999:8-12). If
heterogeneity matters in the way that we expect, such that there are fundamental differences
across regions (either in endowments or in policies) that have effects on development, then there
should be no relationship between initial GRDP and subsequent growth.

16
We adjudicate between these two possibilities using data on provincial GRDP since
decentralization. These data are imperfect for two reasons. First, they cover provincial GRDP
rather than district GRDP, and second, they only cover 2003-2007. We are unfortunately unable
to find comparable district-level GRDP data or comparable long-term provincial GRDP data, due
primarily to the proliferation of new districts and provinces since 1999. Nevertheless, the data
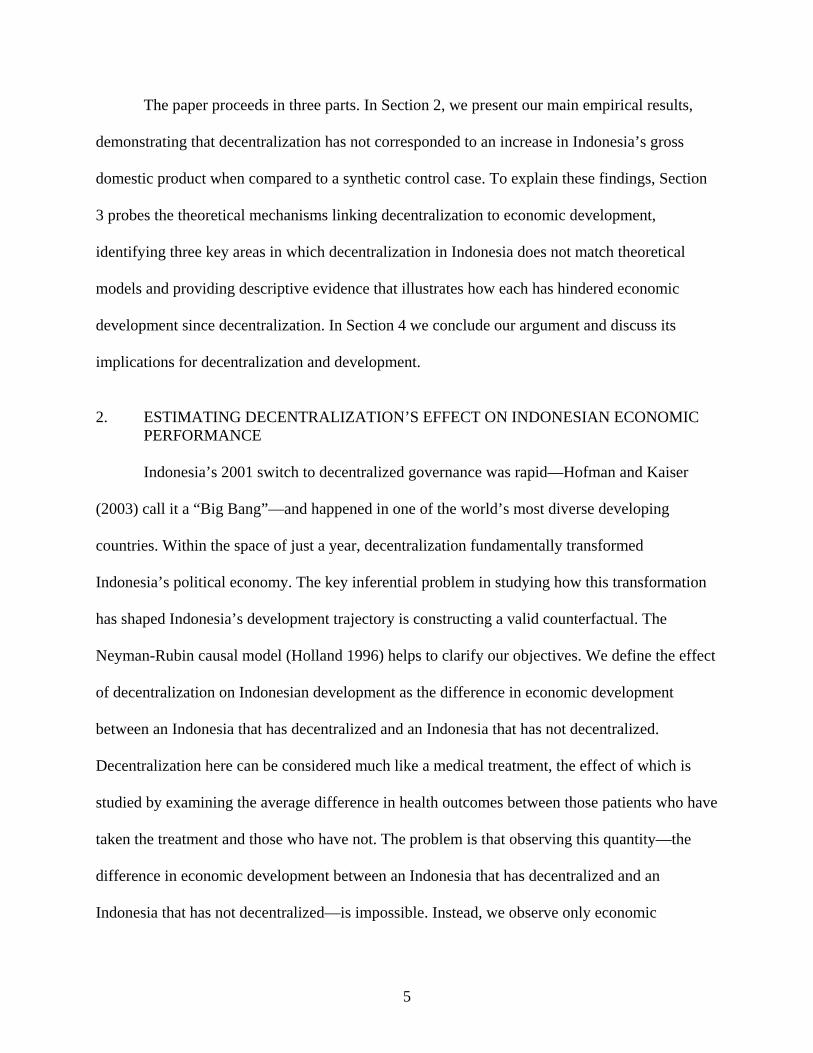
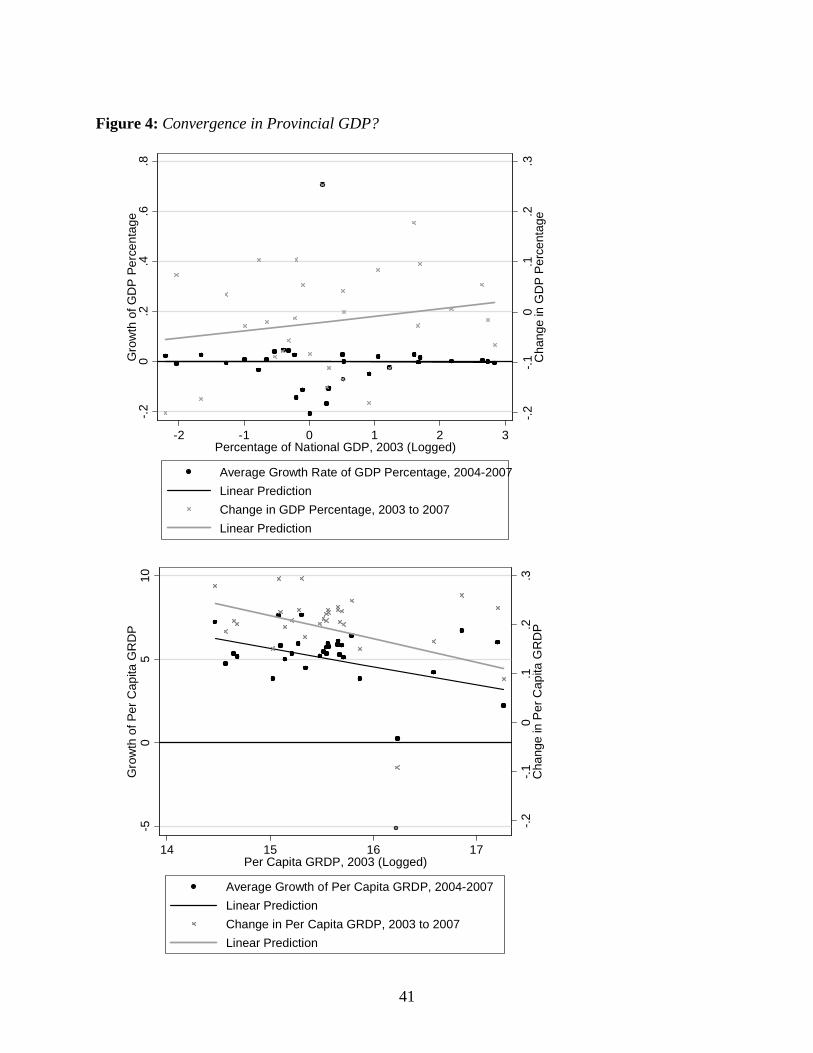
are revealing (see Figure 4).
*** Figure 4 about here *** We study both the growth of the relative contribution in each province to national GDP (top) and
the absolute growth of per capita GDP (bottom). The top figure clearly finds no negative
correlation between initial levels and subsequent changes in contributions to national GDP. The
bottom figure finds a negative correlation between initial GRDP and subsequent average growth
rates, but this correlation is not significant at conventional levels. This conclusion holds both
with and without the outliers, which correspond to the provinces of Nanggroe Aceh Darussalam
and Papua.7
We conclude from this exploration of regional heterogeneity that under the time period
for which directly comparable data are available—admittedly a short one—there is no evidence
of convergence across Indonesian regions. This finding is consistent with our view that
interjurisdictional heterogeneity hampers the ability of interjurisdictional competition to foster
improved economic outcomes, and these results complement existing work that shows that
confiscatory local taxes and charges increased prior 2001 (Lewis 2003). We of course are open
to the possibility that there is a conditional negative correlation between initial GRDP and
subsequent growth, one that emerges when we control for alternative determinants of growth
such as geography, resources, or human capital endowments. But this would be evidence that
17
heterogeneity across regions indeed matters in the way that we expect that it does, further
challenging the claim that simple competition creates convergence on development-enhancing
policies. It is important nevertheless to caution that our findings may change with more finely
detailed or longer-term data, and that we are unable to distinguish using these methods the
following three possibilities: (1) heterogeneity across districts means that interjurisdictional
competition does not induce development-enhancing policies (our explanation), (2)
interjurisdictional competition does produce good policies but their effects are yet to be
observed, and (3) interjurisdictional competition has produced good policies, but their effects are
only discernible from district-level data.
3.2. Factor Immobility
In the previous section, we questioned whether interjurisdictional competition is a logical
outcome of decentralized governance if regions are heterogeneous. But even if all jurisdictions in
Indonesia were sufficiently similar, so that even relatively poorly endowed jurisdictions could
compete with the best endowed jurisdictions, a second key assumption that underlies the
supposed benefits of interjurisdictional competition is that productive resources are mobile
across jurisdictional boundaries. This mobility can be either responsive anticipatory. An example
of responsive mobility is when workers vote with their feet by moving from one jurisdiction with
a bad, corrupt, or unresponsive local government to another jurisdiction with a better
government. An example of anticipatory mobility is when a firm choosing where to site a
production facility chooses among jurisdictions in search of the one with the best regulatory
environment. The assumption that factors are mobile across jurisdictional boundaries is central to
the idea that jurisdictions can compete with one another—they can compete, quite literally, only
if it is possible to draw productive resources (labor or capital) away from other jurisdictions.
18
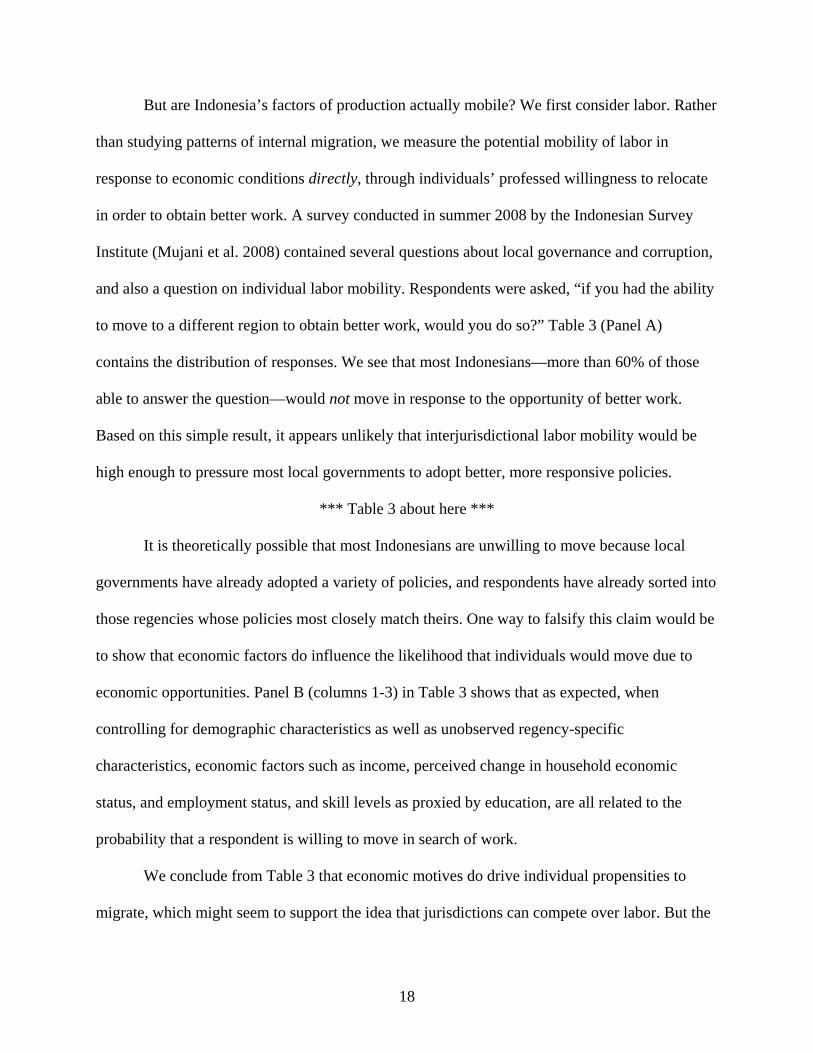
But are Indonesia’s factors of production actually mobile? We first consider labor. Rather
than studying patterns of internal migration, we measure the potential mobility of labor in
response to economic conditions directly, through individuals’ professed willingness to relocate
in order to obtain better work. A survey conducted in summer 2008 by the Indonesian Survey
Institute (Mujani et al. 2008) contained several questions about local governance and corruption,
and also a question on individual labor mobility. Respondents were asked, “if you had the ability
to move to a different region to obtain better work, would you do so?” Table 3 (Panel A)
contains the distribution of responses. We see that most Indonesians—more than 60% of those
able to answer the question—would not move in response to the opportunity of better work.
Based on this simple result, it appears unlikely that interjurisdictional labor mobility would be
high enough to pressure most local governments to adopt better, more responsive policies.
*** Table 3 about here *** It is theoretically possible that most Indonesians are unwilling to move because local
governments have already adopted a variety of policies, and respondents have already sorted into
those regencies whose policies most closely match theirs. One way to falsify this claim would be
to show that economic factors do influence the likelihood that individuals would move due to
economic opportunities. Panel B (columns 1-3) in Table 3 shows that as expected, when
controlling for demographic characteristics as well as unobserved regency-specific
characteristics, economic factors such as income, perceived change in household economic
status, and employment status, and skill levels as proxied by education, are all related to the
probability that a respondent is willing to move in search of work.
We conclude from Table 3 that economic motives do drive individual propensities to
migrate, which might seem to support the idea that jurisdictions can compete over labor. But the

19
logic of interjurisdictional labor mobility is not simply that individuals will move in search of
better employment opportunities. Rather, it is that they will do so in a way that disciplines
unresponsive governments. The survey described above asked respondents to rate both their
perceptions of local government corruption and of local governments’ efforts to eliminate
corruption. Columns 4-6 in Panel B test whether respondents who rate corruption as a major
problem in their regional government are more willing to move. We find no evidence that this is
the case. Columns 7-9 in Panel B test whether perceived government effort influences
respondents’ willingness to move. If Indonesians are willing to vote with their feet, we should
expect that favorable ratings of government anti-corruption efforts should be negatively
correlated with the propensity to move in search of work. What we find is the opposite: the better
respondents rate local governments’ anti-corruption efforts, the more likely they are to express a
willingness to move in search of work.
Together, these results call into question whether labor mobility is sufficient to force
local governments to compete with one another to offer good policies. Most tellingly,
interjurisdictional labor mobility appears low in Indonesia. But even given this, although
standard economic considerations do shape Indonesians’ willingness to move, we find no
evidence that what interjurisdictional labor mobility does exist conforms to the logic of
competing for labor by offering good policies.
Now consider the mobility of other productive assets in Indonesia. Some assets such as
investment capital are highly mobile across jurisdictions, but others—including mineral and
agricultural resources—are quite simply immobile. A financial services firm facing an
extortionary local government may simply move to another jurisdiction with a less extortionary
government, with relatively small costs. However, a mining company facing such an

20
extortionary government has little recourse aside from either acceding to that government’s
demands or ceasing operations. The same is true for a poor peasant. Both of these options will
have negative consequences for development.8 In all, the greater the contribution of such
immobile assets to national development, the more unlikely the logic of interjurisdictional
competition can discipline local governments.9
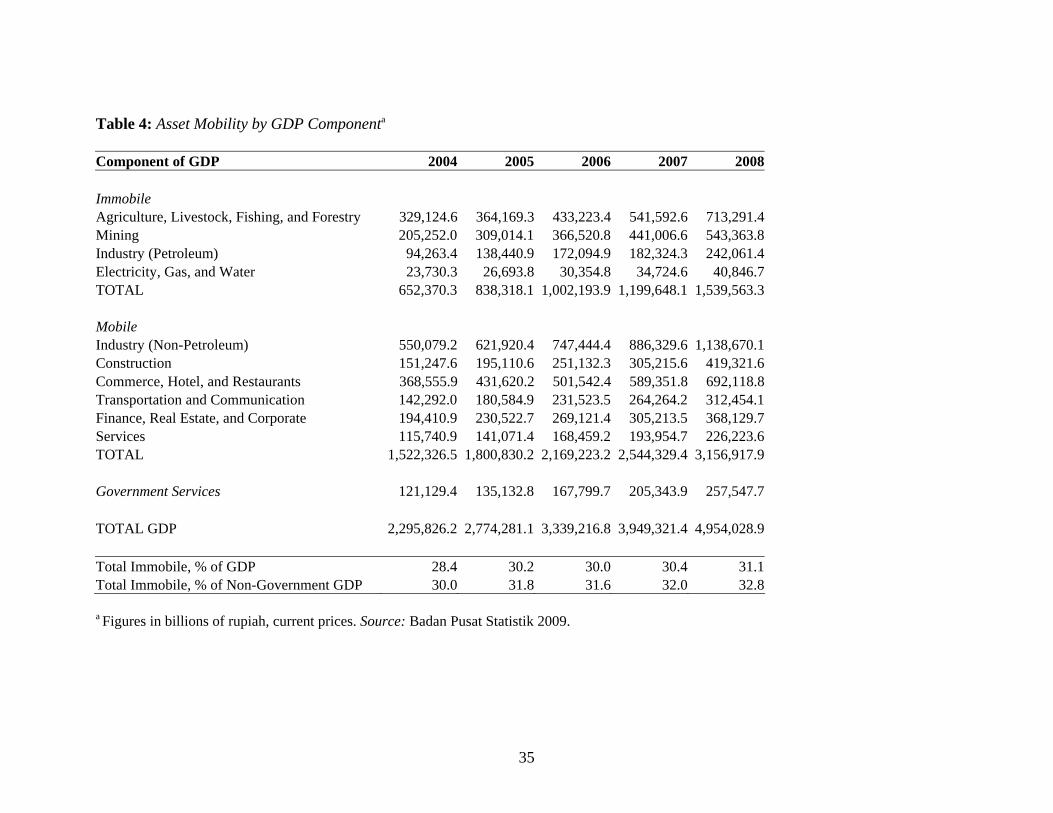
In Table 4 we provide a lower bound on the percentage of Indonesia’s national economic
output that is “immobile,” in the sense that it cannot plausibly move across borders in search of a
better regulatory or political environment, for the most recent data available.
*** Table 4 about here ***
We determine an economic activity to be “immobile” if it is location-specific, meaning that a
necessary input to that activity is on (or under) the land (or sea). Essentially, this means
agriculture, mining, and fuel and energy production; this is consistent with standard definitions
of the related concept of “asset specificity” (see e.g. Boix 2003:76-77). Obviously, these are
rough calculations, and in coding all other economic activities as “mobile” we assume
(impossibly) that it is costless to move any firm or factory. Even so, the lower bound of our
estimate is the productive assets underlying more than 30 percent of Indonesia’s private-sector
GDP are immobile. We see no evidence that this trend has declined over the short period of time
under consideration. While the majority of Indonesia’s GDP is still potentially mobile under this
definition, the fact that such a substantial portion of Indonesia’s economic output is comprised of
assets that are immobile calls into question the ability of decentralization (or any other political
innovation) to have forced local governments to compete over them. Other studies (e.g. Lewis
2003) have concluded that, in fact, many of the local taxes which have been levied since 2001
21
have been directed at such immobile assets as natural resources, and cannot be explained by local
fiscal needs.
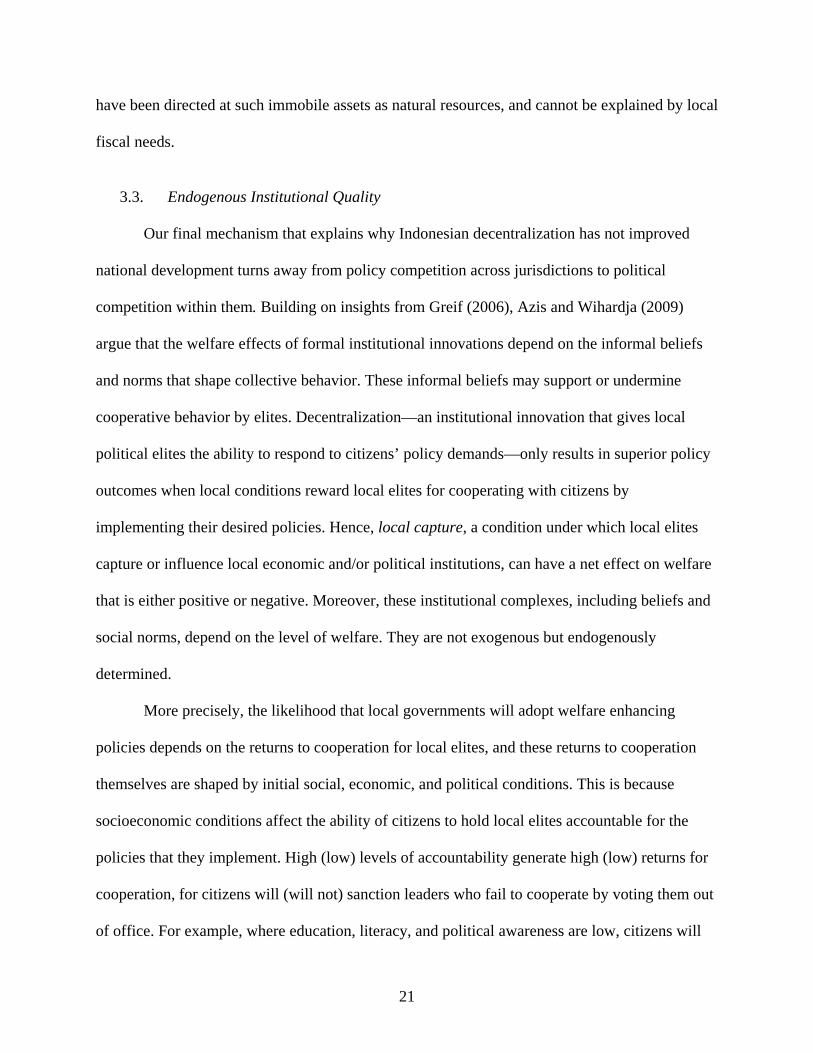
3.3. Endogenous Institutional Quality
Our final mechanism that explains why Indonesian decentralization has not improved
national development turns away from policy competition across jurisdictions to political
competition within them. Building on insights from Greif (2006), Azis and Wihardja (2009)
argue that the welfare effects of formal institutional innovations depend on the informal beliefs
and norms that shape collective behavior. These informal beliefs may support or undermine
cooperative behavior by elites. Decentralization—an institutional innovation that gives local
political elites the ability to respond to citizens’ policy demands—only results in superior policy
outcomes when local conditions reward local elites for cooperating with citizens by
implementing their desired policies. Hence, local capture, a condition under which local elites
capture or influence local economic and/or political institutions, can have a net effect on welfare
that is either positive or negative. Moreover, these institutional complexes, including beliefs and
social norms, depend on the level of welfare. They are not exogenous but endogenously
determined.
More precisely, the likelihood that local governments will adopt welfare enhancing
policies depends on the returns to cooperation for local elites, and these returns to cooperation
themselves are shaped by initial social, economic, and political conditions. This is because
socioeconomic conditions affect the ability of citizens to hold local elites accountable for the
policies that they implement. High (low) levels of accountability generate high (low) returns for
cooperation, for citizens will (will not) sanction leaders who fail to cooperate by voting them out
of office. For example, where education, literacy, and political awareness are low, citizens will

22
be less able to hold local elites accountable for the policies that they implement. In turn, elites
will be less likely to cooperate with local citizens by implementing policies that improve local
welfare, and instead will adopt distortionary policies that benefit themselves at the expense of the
community at large. The result is local capture of economic and/or political institutions by local
elites. In practice, this means the creation of raja kecil (little kings) who are unaccountable to
their citizens (Hofman and Kaiser 2003) and, due to decentralization, no longer constrained in
their confiscatory impulses by a strong central government either (Pepinsky 2008). Taken
together, this causal sequence implies that in regencies with relatively poor socioeconomic
conditions prior to decentralization, decentralization will result in welfare-corroding policies.
Where socioeconomic conditions are more propitious, decentralization has the precise oppose
effect, resulting in welfare-enhancing policies. These dynamics are self-reinforcing. Local
political institutions and policy outcomes co-evolve: local governments with favorable initial
conditions adopt good policies that further improve development and make subsequent good
policies more likely, whereas those with unfavorable initial conditions adopt bad policies that
further retard development and make subsequent bad policies more likely.
It is difficult to develop common metrics for the quality of institutions and
decisionmaking at the local level across all regencies. So to illustrate how initial conditions
shape local leaders’ behavior after decentralization, and to chart the policy consequences of their
decisions, we present results from qualitative field research in five Indonesian regencies. The
regencies were chosen to maximize variation in initial conditions, measured through indicators
such as literacy, poverty, and infant mortality rates, among others. A research team comprised of
one of us along with a member of the non-profit governance watchdog KPPOD (Komite
Pemantauan dan Pelaksanaan Otonomi Daerah, Regional Autonomy Watch) visited each of the

23
five districts in summer 2008. In each research site, the team interviewed high-ranking public
officials (including regents or mayors), political parties, opposition politicians, business
associations, NGOs, local media, academics, and poor families. The goal of these interviews was
to gauge the effectiveness and responsiveness of local leaders; the transparency of local
regulations, budgeting processes, and public procurement; and the availability and efficacy of
social programs. The team—in consultation with KPPOD—then scaled the results across these
domains to develop composite indicators of socioeconomic conditions, participation, local
leadership, and local capture. More detailed information about the data and methods for the field
study are available from Azis and Wihardja (2008).
If the quality of local institutions prior to decentralization is endogenously shaped by
socioeconomic conditions in the way that we expect, we should observe the following. First, in
regencies with comparatively bad initial socioeconomic conditions, we should observe low levels
of political participation by citizens. We measure this through participation in local development
planning meetings (Musyawarah Rencana Pembangunan, Development Planning Consultations),
freedom of information, and freedom of expression. Where initial conditions are better, we
should observe higher levels of political participation. Second, where political participation is
low (due to bad initial conditions), we should observe poor quality of leadership by local
political elites. We measure leadership quality through the existence of corruption (and local
elites’ efforts to eliminate corruption); the quality of joint public-private partnerships to provide
public goods like health care, infrastructure, and education; efforts to attract investment; and the
public- versus private-mindedness of local elites’ decisionmaking priorities. Third, where
political participation is low (again, due to bad initial conditions), we should observe also local
capture, where local elites have captured local economic institutions. We measure local capture
24
through the transparency of public procurement auctions, the transparency and efficacy of local
regulations for encouraging private enterprise, and the provision of social welfare programs to
needy or at-risk segments of the local population. Note that our measures of leadership quality
and local capture do not require that local elites adopt any particular type of policy to be rated as
“high quality,” nor do we require that they eschew any types of public-private partnerships or the
provision of social services. Instead, the measures of local leadership are based on indicators as
mentioned above.
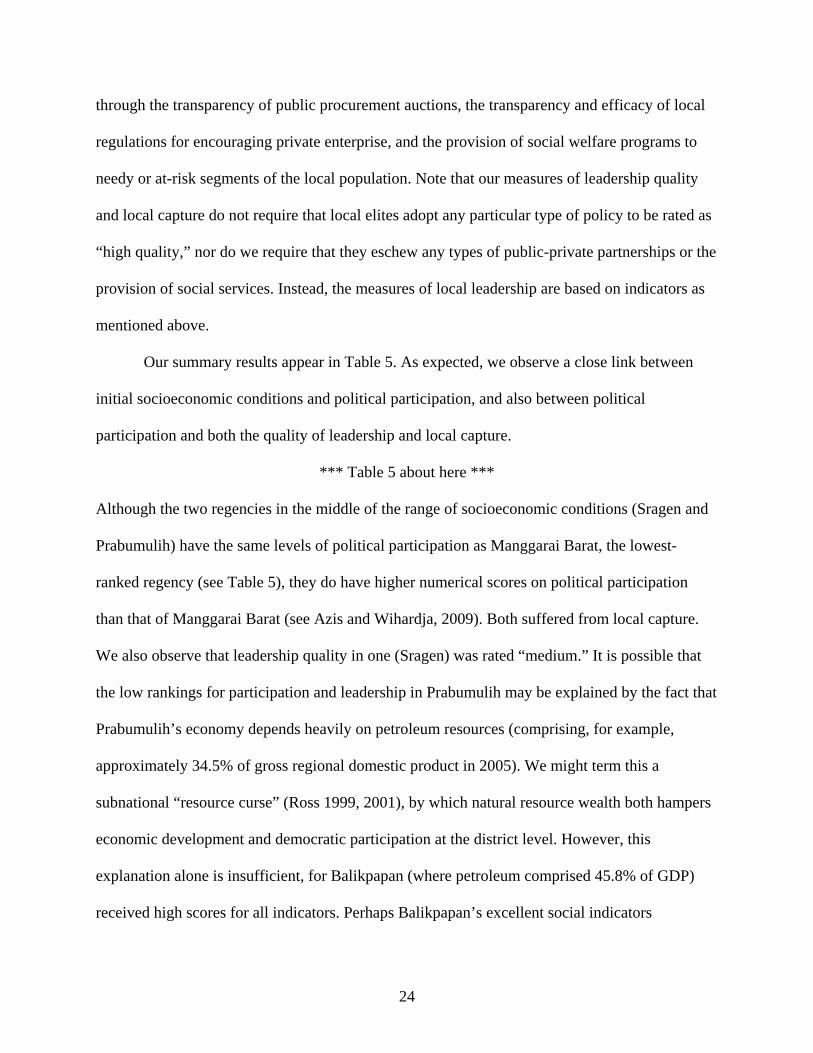
Our summary results appear in Table 5. As expected, we observe a close link between
initial socioeconomic conditions and political participation, and also between political
participation and both the quality of leadership and local capture.
*** Table 5 about here ***
Although the two regencies in the middle of the range of socioeconomic conditions (Sragen and
Prabumulih) have the same levels of political participation as Manggarai Barat, the lowest-
ranked regency (see Table 5), they do have higher numerical scores on political participation
than that of Manggarai Barat (see Azis and Wihardja, 2009). Both suffered from local capture.
We also observe that leadership quality in one (Sragen) was rated “medium.” It is possible that
the low rankings for participation and leadership in Prabumulih may be explained by the fact that
Prabumulih’s economy depends heavily on petroleum resources (comprising, for example,
approximately 34.5% of gross regional domestic product in 2005). We might term this a
subnational “resource curse” (Ross 1999, 2001), by which natural resource wealth both hampers
economic development and democratic participation at the district level. However, this
explanation alone is insufficient, for Balikpapan (where petroleum comprised 45.8% of GDP)
received high scores for all indicators. Perhaps Balikpapan’s excellent social indicators
25
(including the highest literacy rate and lowest poverty rate among the sample) explain that
regency’s good institutional quality given high mineral wealth. Alternatively, Balikpapan’s
petroleum income may come from surrounding districts that are rich in natural resources,
meaning that Balikpapan is itself not a district that is abundant in natural resources.
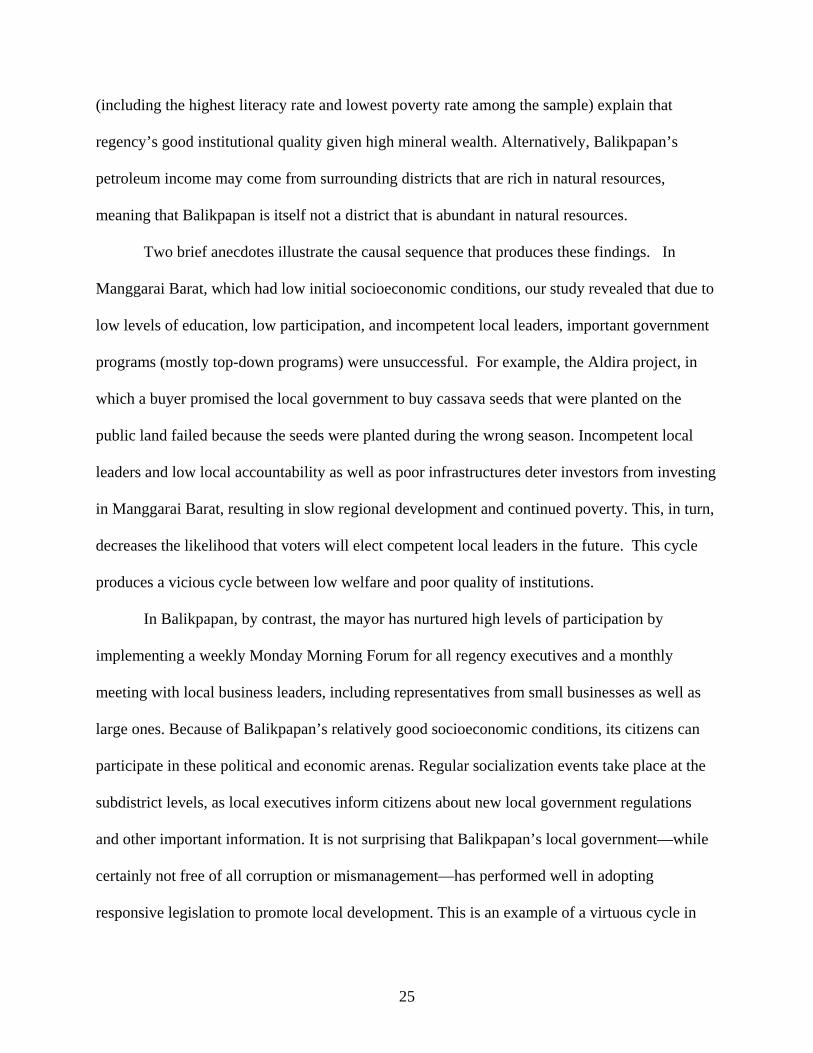
Two brief anecdotes illustrate the causal sequence that produces these findings. In
Manggarai Barat, which had low initial socioeconomic conditions, our study revealed that due to
low levels of education, low participation, and incompetent local leaders, important government
programs (mostly top-down programs) were unsuccessful. For example, the Aldira project, in
which a buyer promised the local government to buy cassava seeds that were planted on the
public land failed because the seeds were planted during the wrong season. Incompetent local
leaders and low local accountability as well as poor infrastructures deter investors from investing
in Manggarai Barat, resulting in slow regional development and continued poverty. This, in turn,
decreases the likelihood that voters will elect competent local leaders in the future. This cycle
produces a vicious cycle between low welfare and poor quality of institutions.
In Balikpapan, by contrast, the mayor has nurtured high levels of participation by
implementing a weekly Monday Morning Forum for all regency executives and a monthly
meeting with local business leaders, including representatives from small businesses as well as
large ones. Because of Balikpapan’s relatively good socioeconomic conditions, its citizens can
participate in these political and economic arenas. Regular socialization events take place at the
subdistrict levels, as local executives inform citizens about new local government regulations
and other important information. It is not surprising that Balikpapan’s local government—while
certainly not free of all corruption or mismanagement—has performed well in adopting
responsive legislation to promote local development. This is an example of a virtuous cycle in

26
which high welfare co-evolves with high quality institutions in the presence of propitious initial
socioeconomic conditions.
4. DISCUSSION AND CONCLUSION
In this paper we have studied the effects of Indonesia’s 2001 decentralization experiment
on its subsequent national economic development trajectory. Given that decentralization is seen
by international development agencies and many political economists as a promising
development tool, our estimates of its effects in Indonesia are disappointing. Using new
methodological techniques that help us to make explicit counterfactual statements of what we
estimate Indonesia’s development trajectory would have been without decentralization, we find
no evidence that decentralization has had any effect on Indonesian development between its
onset in 2001 and 2007, the most recent year for which data are available.
In discussing this null finding, we have drawn attention to two key mechanisms—
competition for productive resources across districts, and political competition within districts—
that must operate for decentralization to produce the positive economic outcomes held to be
attributable to it. Using a combination of methods, we argued that there are strong reasons to
suppose that these mechanisms do not function as expected in Indonesia. These findings are
clearly related to Treisman’s (2007) recent work on the theoretical case for political
decentralization, and confirm the challenges that any real decentralization policy will face.
For policymakers, our findings suggest that politicians and development specialists take
care in designing large scale policy interventions like decentralization. This is obvious in many
respects, and we are heartened that, for example, the World Bank has been so careful to monitor
Indonesian decentralization and so candid about its difficulties and challenges (see Hofman and
Kaiser 2003 for a frank discussion). But our research into the pathologies of Indonesian
27
decentralization suggests that in using economic performance considerations to justify
decentralizing, policymakers should consider just what assumptions must be true for
decentralization to yield superior economic outcomes. For decentralization to foster
development, a country must have relatively homogenous regions, highly mobile labor and
capital, and strong accountability for local leaders. Indonesia’s experience demonstrates the how
the absence of these three requirements can hamstring decentralization’s effectiveness.
In closing, we hasten to add that none of our findings imply that the opposite of
decentralization—centralization—is superior route to increased national economic performance.
We find no positive effect of decentralization on Indonesian development, but no negative effect
either. And we reiterate that there are many other reasons why we might find decentralized
governance in Indonesia to be normatively good that have nothing to do with national economic
performance. We accordingly hope that this study will complement others in evaluating the costs
and benefits, both material and non-material, of Indonesia’s decentralization policy.
NOTES 1 See Treisman (2007) for a review of these and other types of decentralization.
2 Some observers accordingly consider Indonesia to be fiscally decentralized since 2001, but it is
important to recall that district governments are still primarily funded through DAU. The
exception is resource rents, which accrue disproportionately to the regions that produce them.
However, this is was the case prior to 2001 as well.
3 For clarity, in this paper we refer to all second-tier governments as “regency” governments.
4 Abadie et al.’s distance metric of choice is )()(|||| 010101 WXXVWXXWXX V −′−=− , where
V weights the different components of X0 such as to minimize the difference between the
28
outcomes of the synthetic and actual cases prior to treatment. See Abadie et al. (2007:9-10) for
details.
5 Doing so leads us to omit Bangladesh, China, Malaysia, Papua New Guinea, and Vietnam,
leaving only five control cases.
6 This statement is made based on our heterogeneity hypothesis. Sragen’s growths of investment
had been relatively high in the past years, after the establishment of One-Stop-Service (see Azis
and Wihardja, 2009).
7 We exclude the provinces of South Sulawesi and West Sulawesi from this analysis, for the
former province of South Sulawesi split in 2005 to become these two provinces, and data from
prior to 2005 cannot distinguish the former and current South Sulawesi.
8 The company or the peasant may respond by lobbying for the removal of distortionary policies,
the outcome of which may (if successful) be welfare-improving, but still will represent a strictly
second-best outcome over a distortion-free regulatory environment (Bhagwati 1982:994-997).
9 This logic of holdup forms the basis of Vernon’s (1980) “obsolescing bargain” in extractive
industries, as well as Kobrin’s (1987) critique of its application to the manufacturing sector.
REFERENCES Abadie, Alberto, Alexis Diamond, & Jens Hainmueller. (2007). Synthetic control methods for
comparative case studies: Estimating the effect of California’s tobacco control program, NBER Working Paper No. 12831.
--- (2009). Synthetic control methods for comparative case studies: Estimating the effect of California’s tobacco control program. Journal of the American Statistical Association, forthcoming.
Abadie, Alberto, & Javier Gardeazabal. (2003). The economic costs of conflict: A case study of the Basque country. American Economic Review, 93(1): 112-132.
Azis, Iwan Jaya, & Maria M. Wihardja. (2008). Field survey in five districts in Indonesia on local capture and social welfare. Cornell University and KPPOD: internal report.

29
---. (2009). Theory of endogenous institutions and evidence from an in-depth field study in Indonesia. Working Paper, Department of City and Regional Planning, Cornell University.
Badan Pusat Statistik. (2009). Produk domestik bruto atas dasar harga berlaku menurut lapangan usaha (milyar rupiah). Jakarta: Badan Pusat Statistik, http://www.bps.go.id/tab_sub/view.php?tabel=1&daftar=1&id_subyek=11¬ab=1.
Barro, Robert J. (1999). Determinants of economic growth: A cross-country empirical study. Cambridge: The MIT Press.
Batam Center. (2009). Investing in Batam. http://www.batam-center.web.id/geninfo_investing.html.
Beck, Thorsten, George Clarke, Alberto Groff, Philip Keefer, & Patrick Walsh. (2001). New tools in comparative political economy: The database of political institutions. World Bank Economic Review, 15(1): 165-176.
Bhagwati, Jagdish N. (1982). Directly unproductive, profit-seeking (DUP) activities. Journal of Political Economy, 90(5): 988-1002.
Boix, Carles N. (2003). Democracy and redistribution. New York: Cambridge University Press.
Breuss, Fritz, & Markus Eller. Fiscal decentralization and economic growth: Is there really a link? CESifo DICE Report, 2(1): 3-9.
Brodjonegoro, Bambang. (2004). Three years of fiscal decentralization in Indonesia: Its impacts on regional economic development and fiscal sustainability. Paper presented at the International Symposium on Fiscal Decentralization in Asia Revisited, Hitotsubashi University, Tokyo.
Cai, Hongbin, & Daniel Treisman. (2005). Does competition for capital discipline governments? Decentralization, globalization, and public policy. American Economic Review, 95(3): 817-830.
Cheema, G. Shabbir, & Dennis A. Rondinelli (eds.) (1983). Decentralization and development: Policy implementation in developing countries. Beverly Hills: SAGE Publications.
Greif, Avner. (2006). Institutions and the path to the modern economy. New York: Cambridge University Press.
Heston, Alan, Robert Summers, & Bettina Aten. (2006). Penn world table, version 6.2. University of Pennsylvania: Center for International Comparisons of Production, Income and Prices, http://pwt.econ.upenn.edu/php_site/pwt_index.php.
Hofman, Bert, & Kai Kaiser. (2003). The making of the big bang and its aftermath: A political economy perspective. Paper presented at the conference Can Decentralization Help Rebuild Indonesia, Georgia State University, Atlanta.

30
Holland, Paul W. (1986). Statistics and causal inference. Journal of the American Statistical Association, 81(396): 945-960.
Indonesia. (1999). Undang-undang Republik Indonesia nomor 22 tahun 1999 tentang “pemerintahan daerah.”
Kaufmann, Daniel, Aart Kraay, & Massimo Mastruzzi. (2008). Governance matters VII: Aggregate and individual governance indicators for 1996-2007. World Bank Policy Research Working Paper No. 4654.
Keefer, Philip, & David Stasavage (2003). The limits of delegation: Veto players, central bank independence and the credibility of monetary policy. American Political Science Review, 97(3): 407-423.
Kobrin, Stephen J. (1987). Testing the bargaining hypothesis in the manufacturing sector in developing countries. International Organization, 41(4): 609-638.
Leblang, David. (2005). Is democracy incompatible with international economic stability? In Marc Uzan (Ed.), The future of the international monetary system (pp. 168-98). Cheltenham, UK: Edward Alger.
Lewis, Blane D. (2003). Tax and charge creation by regional governments under fiscal decentralization: estimates and explanations. Bulletin of Indonesian Economic Studies, 39(2): 177-192.
Marshall, Monty G., & Keith Jaggers. (2007). Polity IV project: Political regime characteristics and transitions, 1800-2007. George Mason University: Center for Global Policy, http://www.systemicpeace.org/inscr/p4manualv2007.pdf.
Montinola, Gabriella, Yingyi Qian, & Barry R. Weingast. (1995). Federalism, Chinese style: The political basis for economic success in China. World Politics, 48(1): 50-81.
Mujani, Saiful, R. William Liddle, & Thomas B. Pepinsky. (2008). Masalah sosial masyarakatan, Mei 2008. Jakarta: Lembaga Survei Indonesia.
Oates, Wallace E. (1993). Fiscal decentralization and economic development. National Tax Journal, 46(2): 237-243.
Pepinsky, Thomas B. (2008). Institutions, economic recovery, and macroeconomic vulnerability in Indonesia and Malaysia. In Andrew MacIntyre, T.J. Pempel, & John Ravenhill (Eds.), Crisis as catalyst: Asia’s dynamic political economy (pp. 231-250). Ithaca: Cornell University Press.
Persson, Torsten, & Guido Tabellini. 2003. The economic effects of constitutions. Cambridge, MA: The MIT Press.
Qian, Yingyi, & Gérard Roland. (1998). Federalism and the soft budget constraint. American Economic Review, 88(5): 1143-1162.

31
Roeder, Philip G. (2001). Ethnolinguistic fractionalization (ELF) indices, 1961 and 1985. University of California-San Diego, http://weber.ucsd.edu/~proeder/elf.htm.
Ross, Michael L. (1999). The political economy of the resource curse. World Politics, 51(2): 297-322.
---. (2001). Does oil hinder democracy? World Politics, 53(3): 325-361.
Seymour, Richard, & Sarah Turner. (2002). Otonomi daerah: Indonesia’s decentralization experiment. New Zealand Journal of Asian Studies, 4(2): 33-51.
Simandjuntak, Marsillam. (2003). Indonesia: Risks abound, a case for decentralization. Paper presented at the conference Can Decentralization Help Rebuild Indonesia, Georgia State University, Atlanta.
Statistics Indonesia. (2009). Tabel 3.1.1. Angka melek huruf penduduk umur 15 tahun ke atas menurut provinsi dan kab/kota. http://www.datastatistik-indonesia.com/.
Teorell, Jan, Nicholas Charron, Marcus Samanni, Sören Holmberg, & Bo Rothstein. 2009. The quality of government dataset, version 17June09. University of Gothenburg: The Quality of Government Institute, http://www.qog.pol.gu.se.
Treisman, Daniel. (2007). The architecture of government: Rethinking political decentralization. New York: Cambridge University Press.
Vernon, Raymond. (1980). The obsolescing bargain: A key factor in political risk. In Mark B. Winchester (Ed.), The international essays for business decision makers, volume 5 (pp. 281-287). Houston: Center for International Business.
Weingast, Barry R. (1995). The economic role of political institutions: Market-preserving federalism and economic development. Journal of Law, Economics and Organization, 11(1): 1-31.
World Bank. (2009). World Development Indicators. Washington, DC: The World Bank, http://go.worldbank.org/U0FSM7AQ40.
APPENDIX: See Table 6.

32
Table 1: Predictors of the Per Capita Gross Domestic Product (Logged)
Variable Definition Source CONSUMPTION SHARE OF GDP Consumption share of GDP Heston et al. (2006) GOVERNMENT SHARE OF GDP Government share of GDP Heston et al. (2006) INVESTMENT SHARE OF GDP Investment share of GDP Heston et al. (2006) EXPORTS AND IMPORTS / GDP Exports plus imports as a share of GDP Heston et al. (2006) ANNUAL INFLATION RATE Annual percentage change in implicit GDP deflator World Bank (2009) SPECULATIVE ATTACK, 1997-1998 1 if speculative attack, 0 otherwise, average for 1997 and 1998 Leblang (2005) LNGDPPC, 1990 Natural log of per capita real GDP, 1990 World Bank (2009) LNGDPPC, 1996 Natural log of per capita real GDP, 1996 World Bank (2009) LNGDPPC, 2000 Natural log of per capita real GDP, 2000 World Bank (2009) LN (POPULATION) Natural log of population World Bank (2009) URBANIZATION Percent urban population World Bank (2009) ETHNIC HETEROGENEITY Probability that two citizens are from different ethnic groups, 1985 Roeder (2001); Teorell (2009) CORRUPTION, 1998 Average of corruption scores, 1998 Kaufmann et al. (2008), Teorell (2009) ADULT LITERACY RATE, 1993 Adult literacy rate, 1993 or closest available year World Bank (2009) POLITICAL REGIME Polity IV democracy score – autocracy score Marshall and Jaggers (2007) REGIME DURABILITY Number of years since last change in political regime Marshall and Jaggers (2007) CHECKS Number of veto players Beck et al. (2001); Teorell (2009) FEDERALISM 1 if federal political structure, 0 otherwise, 1998a Persson and Tabellini (2003); Teorell (2009)
a Original source coded only democratic countries; here, non-democratic countries are coded as non-federal.

33
Table 2: Pre-Treatment Predictor Balance and Relative Contributions of Control Countries
Predictor Indonesia Model 1 Model 2 Model 3 Synthetic Control All Controlsa Synthetic Control All Controlsa Synthetic Control All Controlsa CONSUMPTION SHARE OF GDP 59.619 59.268 75.800 61.205 76.041 60.469 62.668 GOVERNMENT SHARE OF GDP 18.953 25.134 21.229 20.638 20.879 19.414 21.615 INVESTMENT SHARE OF GDP 17.131 21.464 11.424 20.581 11.271 17.128 16.476 EXPORTS AND IMPORTS / GDP 79.215 77.328 68.214 80.294 64.036 81.440 75.522 ANNUAL INFLATION RATE 16.326 14.905 103.884 17.204 110.616 9.912 8.674 SPECULATIVE ATTACK, 1997-1998 1.000 0.684 0.232 0.761 0.227 0.830 0.503 LNGDPPC, 1990 6.417 6.428 6.656 6.434 6.655 6.414 6.354 LNGDPPC, 1996 6.777 6.753 6.719 6.757 6.722 6.749 6.636 LNGDPPC, 2000 6.685 6.715 6.758 6.707 6.763 6.705 6.715 LN (POPULATION) 19.075 17.553 16.266 17.174 16.434 17.141 18.175 URBANIZATION 35.982 29.635 43.446 22.994 43.359 23.087 30.434 ETHNIC HETEROGENEITY 0.757 0.667 0.539 0.718 0.530 0.655 0.544 CORRUPTION, 1998 -1.146 -0.442 -0.453 -0.347 -0.459 -0.493 -0.363 ADULT LITERACY RATE, 1993 90.385 77.966 69.898 POLITICAL REGIME -4.455 4.285 1.950 REGIME DURABILITY 19.364 9.763 14.205 CHECKS 1.091 4.697 2.816 FEDERALISM 0.000 0.000 0.094 Relative Weight (W*)b Model 1 Model 2 Model 3 China 0.155 China 0.049 Pakistan 0.120 Colombia 0.066 Malawi 0.098 Papua New Guinea 0.347 Guinea-Bissau 0.159 Papua New Guinea 0.175 Thailand 0.313 India 0.116 Sierra Leone 0.029 Vietnam 0.220 Papua New Guinea 0.177 Thailand 0.488 Thailand 0.325 Uganda 0.159 South Africa 0.001 South Africa 0.002 Root Mean Squared Prediction Error .026 .029 .034
a Average of all control countries in each sample. b Weights for all countries not listed are zero.

34
Table 3: Labor Mobility PANEL A
Answer Number Percent Percent of Valid Yes 954 37.44 39.49 No 1,462 57.38 60.51
Don’t Know 132 5.18 --
Question: if you had the opportunity to move to a
different region to obtain better work, would you do so? TOTAL 2,548 100.00 100.00
PANEL Ba
Economic Factors Corruption Perception Anti-Corruption Efforts (1) (2) (3) (4) (5) (6) (7) (8) (9)
0.127*** 0.144*** 0.120*** 0.105*** 0.126*** 0.099*** 0.101*** 0.114*** 0.092*** EDUCATION LEVEL (0.027) (0.030) (0.026) (0.029) (0.033) (0.029) (0.029) (0.033) (0.028) -0.151** -0.153** -0.185*** IMPROVED HOUSEHOLD
ECONOMIC CONDITIONS (0.059) -- -- (0.064) -- -- (0.064)
-0.045** -0.049** -0.042* INCOME LEVEL -- (0.022) -- -- (0.023) -- (0.023)
0.756* 0.484 0.631 UNEMPLOYED -- -- (0.409) -- -- (0.463) -- -- (0.431) 0.004 0.024 0.015 PERCEPTIONS OF
CORRUPTION -- -- -- (0.070) (0.070) (0.070) -- -- --
0.167** 0.155** 0.152** EVIDENCE OF ANTI-CORRUPTION EFFORTS -- -- -- -- -- -- (0.075) (0.075) (0.075)
Pseudo-R2 0.06 0.06 0.06 0.05 0.04 0.04 0.05 0.05 0.05 N 1,899 1,878 1,881 1,537 1,518 1,521 1,562 1,542 1,546
Individual-Level Controlsb Yes Yes Yes Yes Yes Yes Yes Yes Yes Regency Fixed Effects Yes Yes Yes Yes Yes Yes Yes Yes Yes
a Dependent variable is willingness to move to a different region to obtain better work (see Panel A). “Don’t Know” coded as missing. Cells contain logistic regression coefficients and standard errors. *** p<0.01; ** p<0.05; * p<0.1; two tailed tests. Results obtained from Chamberlain’s conditional logistic regression, grouped by regency. b Controls include age, age squared, gender, marital status, number of children, and length of time living at the current location.
35
Table 4: Asset Mobility by GDP Componenta Component of GDP 2004 2005 2006 2007 2008 Immobile Agriculture, Livestock, Fishing, and Forestry 329,124.6 364,169.3 433,223.4 541,592.6 713,291.4Mining 205,252.0 309,014.1 366,520.8 441,006.6 543,363.8Industry (Petroleum) 94,263.4 138,440.9 172,094.9 182,324.3 242,061.4Electricity, Gas, and Water 23,730.3 26,693.8 30,354.8 34,724.6 40,846.7TOTAL 652,370.3 838,318.1 1,002,193.9 1,199,648.1 1,539,563.3 Mobile Industry (Non-Petroleum) 550,079.2 621,920.4 747,444.4 886,329.6 1,138,670.1Construction 151,247.6 195,110.6 251,132.3 305,215.6 419,321.6Commerce, Hotel, and Restaurants 368,555.9 431,620.2 501,542.4 589,351.8 692,118.8Transportation and Communication 142,292.0 180,584.9 231,523.5 264,264.2 312,454.1Finance, Real Estate, and Corporate 194,410.9 230,522.7 269,121.4 305,213.5 368,129.7Services 115,740.9 141,071.4 168,459.2 193,954.7 226,223.6TOTAL 1,522,326.5 1,800,830.2 2,169,223.2 2,544,329.4 3,156,917.9 Government Services 121,129.4 135,132.8 167,799.7 205,343.9 257,547.7 TOTAL GDP 2,295,826.2 2,774,281.1 3,339,216.8 3,949,321.4 4,954,028.9 Total Immobile, % of GDP 28.4 30.2 30.0 30.4 31.1Total Immobile, % of Non-Government GDP 30.0 31.8 31.6 32.0 32.8 a Figures in billions of rupiah, current prices. Source: Badan Pusat Statistik 2009.

36
Table 5: Initial Socioeconomic Conditions and Local Governance Indicatorsa
Kabupaten Province Socioeconomic Conditions Participation Local
Leadership Local
Capture Balikpapan East Kalimantan Good High Good No
Yogyakarta City Yogyakarta Good High Good No Prabumulih South Sumatra Medium Low Bad Yes
Sragen Central Java Medium Low Medium Yes Manggarai Barat East Nusa Tenggara Bad Low Bad Yes
a See text for methods and variable definitions.
37
Table 6: Population of Control Countries
Baseline Set of Predictors (Model 1)
Expanded Set of Predictors (Model 2)
Asia Only (Model 3)
Algeria Madagascar Algeria Malaysia Bangladesh Argentina Malawi Argentina Mali China
Bangladesh Malaysia Bangladesh Mauritania India Bolivia Mali Bolivia Mauritius Malaysia
Botswana Mauritania Brazil Mexico Pakistan Brazil Mauritius Bulgaria Morocco Papua New Guinea
Bulgaria Mexico Burkina Faso Mozambique Philippines Burkina Faso Morocco Burundi Nicaragua Sri Lanka
Burundi Mozambique Cameroon Pakistan Thailand Cameroon Nicaragua Central African Rep. Panama Vietnam
Central African Rep. Pakistan Chad Papua New Guinea Chad Panama Chile Paraguay Chile Papua New Guinea China Peru China Paraguay Colombia Philippines
Colombia Peru Comoros Poland Comoros Philippines Costa Rica Romania
Congo Rep. Poland D.R. Congo Rwanda Costa Rica Romania Ecuador Senegal D.R. Congo Rwanda Egypt Sierra Leone
Ecuador Senegal El Salvador Sri Lanka Egypt Sierra Leone Gabon Sudan
El Salvador Sri Lanka Ghana Swaziland Fiji Sudan Guatemala Tanzania
Gabon Swaziland Guinea Thailand Gambia Tanzania Honduras Togo Ghana Thailand India Tunisia
Guatemala Togo Ivory Coast Turkey Guinea Tunisia Jordan Uganda
Guinea-Bissau Turkey Kenya Uruguay Honduras Uganda Lesotho Venezuela
India Uruguay Madagascar Vietnam Ivory Coast Venezuela Malawi Zambia
Jordan Vietnam Kenya Zambia
Lesotho
38
Figure 1: Indonesia, Yearly Per Capita Real GDP Growth, 1991-2007
-15
-10
-50
510
15G
row
th R
ate
1991 1993 1995 1997 1999 2001 2003 2005 2007Year
Annual Growth RateAverage 1991-1997 (Pre-Decentralization)Average 2001-2007 (Post-Decentralization)
39
Figure 2: Per Capita GDP (logged), Indonesia and Synthetic Control Compared
6.4
6.6
6.8
7LN
GD
PPC
1990 1995 2000 2005Year
Indonesiasynthetic Indonesia
Model 16.
46.
66.
87
LNG
DP
PC
1990 1995 2000 2005Year
Indonesiasynthetic Indonesia
Model 2
6.4
6.6
6.8
7LN
GD
PPC
1990 1995 2000 2005Year
Indonesiasynthetic Indonesia
Model 3

40
Figure 3: Placebo Study Results
-.5-.2
50
.25
.5.7
5G
ap in
LN
GD
PPC
, Tre
ated
- S
ynth
etic
1990 1995 2000 2005Year
IndonesiaControls
Model 1-.5
-.25
0.2
5.5
.75
Gap
in L
NG
DP
PC, T
reat
ed -
Syn
thet
ic
1990 1995 2000 2005Year
IndonesiaControls
Model 2
-.5-.2
50
.25
.5.7
5G
ap in
LN
GD
PPC
, Tre
ated
- S
ynth
etic
1990 1995 2000 2005Year
IndonesiaControls
Model 3
41
Figure 4: Convergence in Provincial GDP?
-.2-.1
0.1
.2.3
Cha
nge
in G
DP
Per
cent
age
-.20
.2.4
.6.8
Gro
wth
of G
DP
Per
cent
age
-2 -1 0 1 2 3Percentage of National GDP, 2003 (Logged)
Average Growth Rate of GDP Percentage, 2004-2007Linear PredictionChange in GDP Percentage, 2003 to 2007Linear Prediction-.2
-.10
.1.2
.3C
hang
e in
Per
Cap
ita G
RD
P
-50
510
Gro
wth
of P
er C
apita
GR
DP
14 15 16 17Per Capita GRDP, 2003 (Logged)
Average Growth of Per Capita GRDP, 2004-2007Linear PredictionChange in Per Capita GRDP, 2003 to 2007Linear Prediction