Embed Size (px)
Citation preview
Decennial CensusDecennial CensusA Base for Community A Base for Community
AnalysisAnalysis
Grace YorkGrace York
University of MichiganUniversity of Michigan
October 2003October 2003

Survey of the United States Survey of the United States population every 10 yearspopulation every 10 years
Mandated by ConstitutionMandated by Constitution
Purpose: reapportionment Purpose: reapportionment of 435 seats in the House of of 435 seats in the House of RepresentativesRepresentatives
Census History Census History
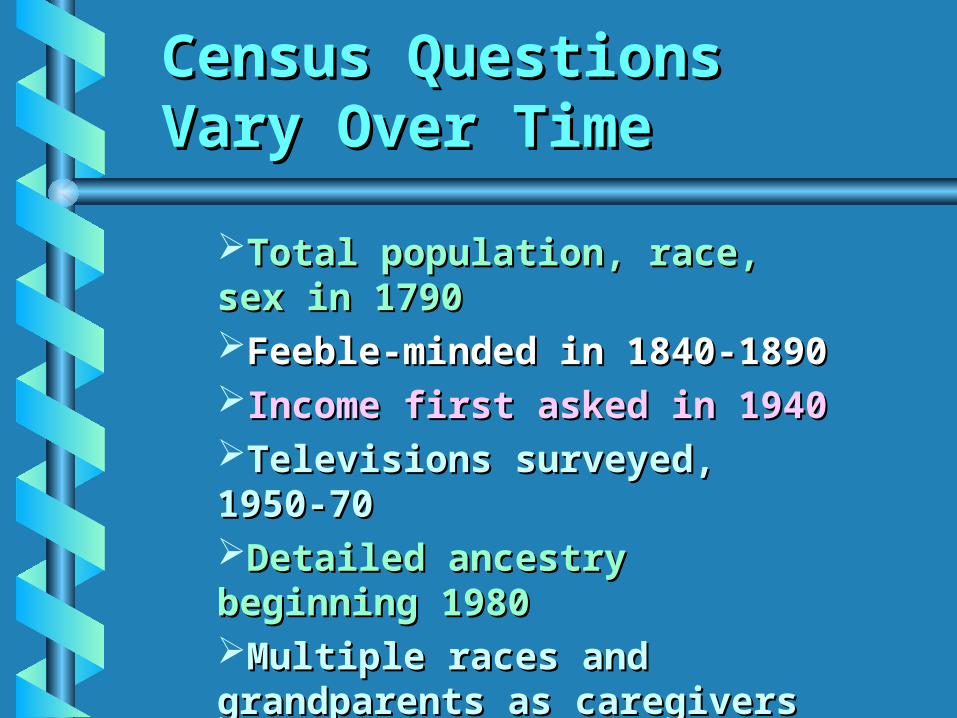
Total population, race, sex Total population, race, sex in 1790in 1790Feeble-minded in 1840-Feeble-minded in 1840-18901890Income first asked in 1940Income first asked in 1940Televisions surveyed, 1950-Televisions surveyed, 1950-7070Detailed ancestry Detailed ancestry beginning 1980beginning 1980Multiple races and Multiple races and grandparents as caregivers grandparents as caregivers in 2000in 2000
Census Questions Census Questions Vary Over Time Vary Over Time

Reflects changes in society
In 1990 and 2000 Congress wanted to reduce paperwork
Grid of questions, 1790-2000http://www.lib.umich.edu/govdocs/census2/censubj.pdf
Census Questions Census Questions Vary Over Time Vary Over Time
Public health professionals identify vulnerable populations for chronic disease
Urban planners identify zoning, housing, sewage, and transportation issues
Social workers conduct needs assessments for services to the elderly, poor, children
Practical Applications Practical Applications for Census Data for Census Data
Marketers target likely buyers
Politicians use the census to determine voting districts and to assess constituent interests
Environmentalists map the spread of toxic effluents and population densities
Practical Applications Practical Applications for Census Data for Census Data
Occupation by age, race, and sex for equal employment opportunity
Librarians base collection development policy on community characteristcs
Mayors use numbers to apply for federal grants.
Undercount costs money – the reason for lawsuitsRacial minorities and undocumented aliensShould missionaries be counted as U.S. residents
Practical Applications Practical Applications for Census Data for Census Data
Outline of Outline of PresentationPresentation
Census QuestionnaireCensus Questionnaire Census GeographyCensus Geography Reference MapsReference Maps Census DataCensus Data Thematic MappingThematic Mapping Historic DataHistoric Data

Reference ToolsReference Tools
Census ToolkitCensus Toolkithttp://www.lib.http://www.lib.umichumich..eduedu//govdocsgovdocs/census2//census2/centoolcentool..pdfpdf
Historic Census QuestionsHistoric Census Questionshttp://www.lib.http://www.lib.umichumich..eduedu//govdocsgovdocs/census2//census2/censubjcensubj..pdfpdf
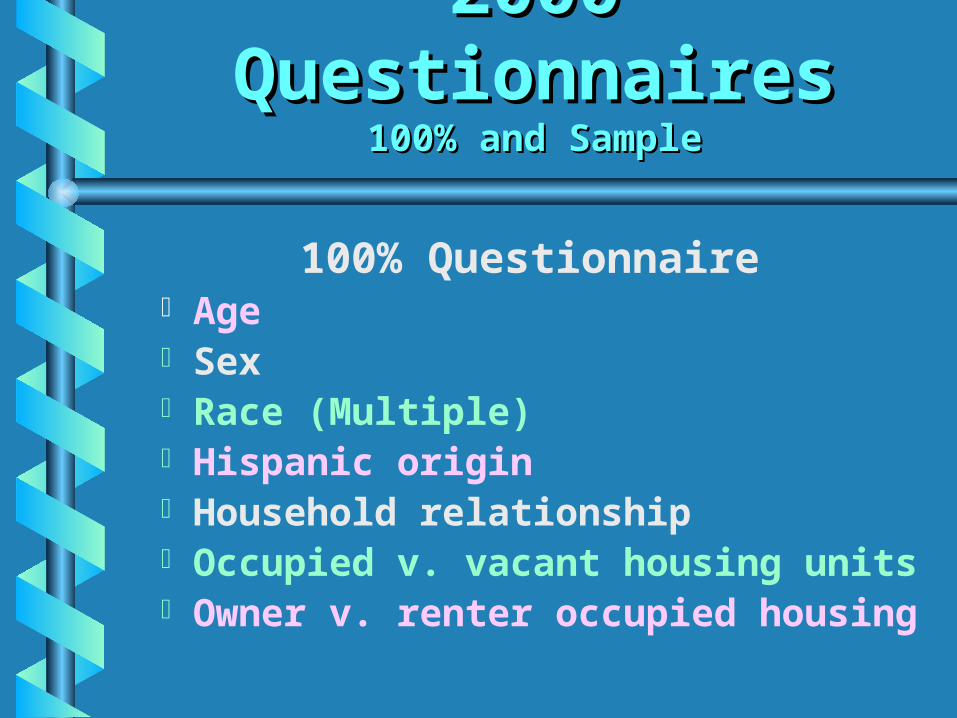
2000 2000 QuestionnairesQuestionnaires
100% and Sample100% and Sample
100% Questionnaire Age Sex Race (Multiple) Hispanic origin Household relationship Occupied v. vacant housing units Owner v. renter occupied
housing
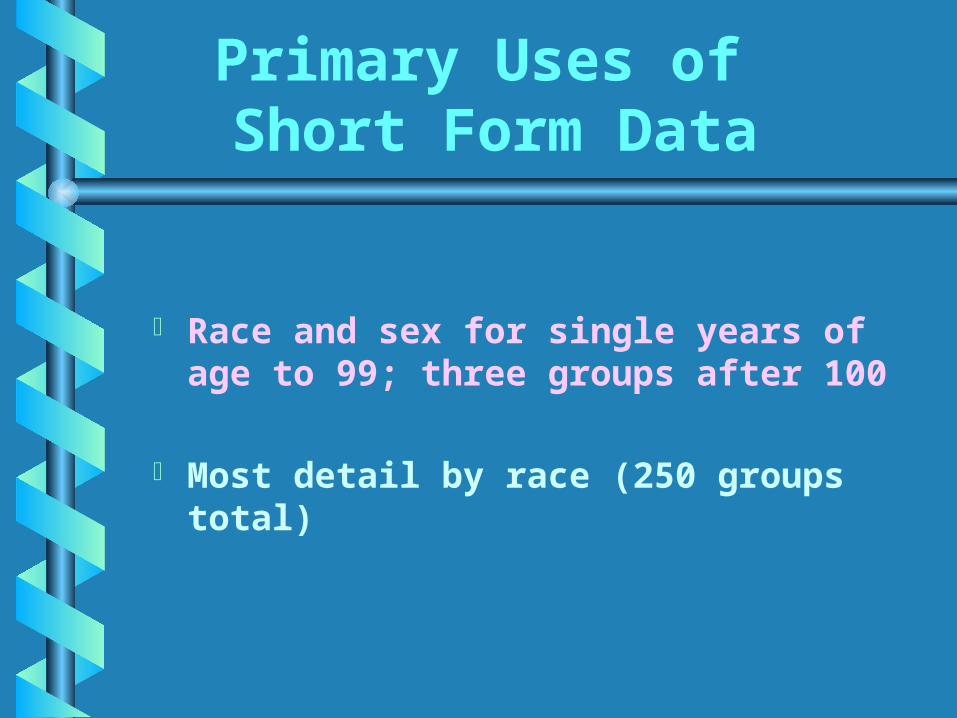
Primary Uses of Short Form Data
Race and sex for single years of age to 99; three groups after 100
Most detail by race (250 groups total)
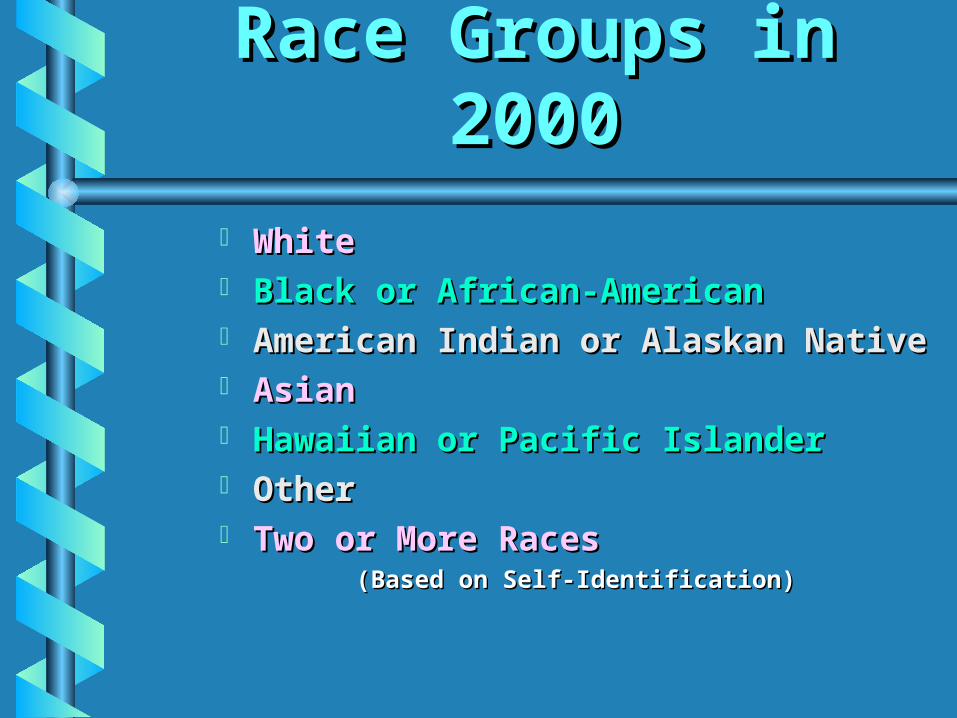
Race Groups in Race Groups in 20002000
WhiteWhite Black or African-AmericanBlack or African-American American Indian or Alaskan NativeAmerican Indian or Alaskan Native AsianAsian Hawaiian or Pacific IslanderHawaiian or Pacific Islander OtherOther Two or More RacesTwo or More Races
(Based on Self-Identification)(Based on Self-Identification)

Individual RacesIndividual Races
Some files break the 6 racial groups into 250 specific categories
Includes Chippewa Indians, Hmong, Pakistanis
Israelis, Arabs, Iranians and Afghanis are considered as white (broken out as ancestry in sample data)
Racial definitions appear at:
http://www.lib.umich.edu/govdocs/census2/sf3td/sf3tdg7.pdf
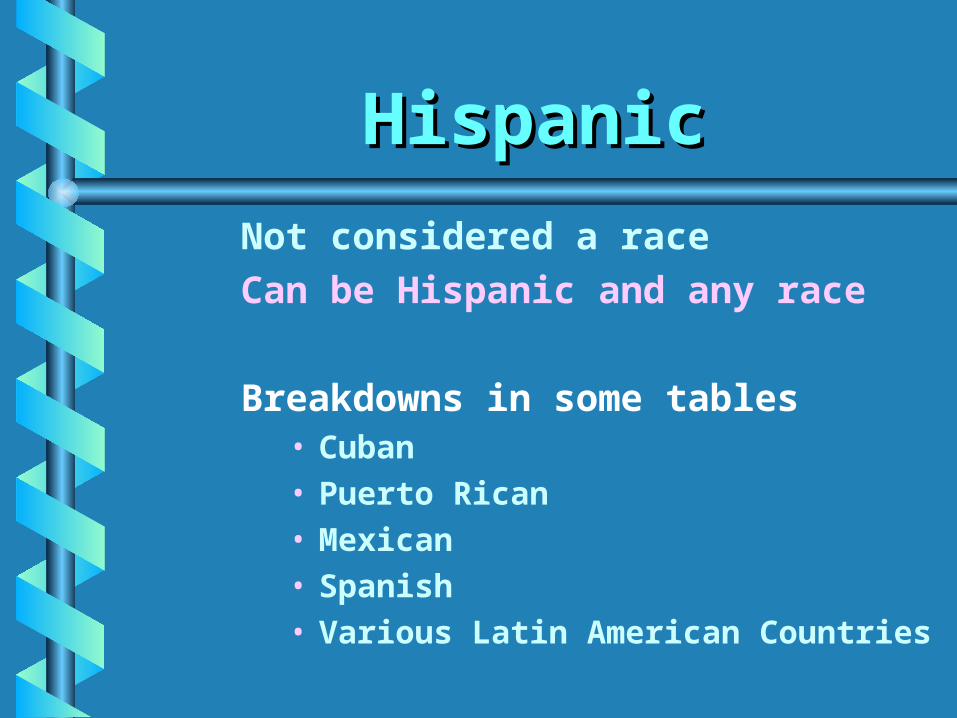
HispanicHispanic
Not considered a raceCan be Hispanic and any race
Breakdowns in some tables• Cuban• Puerto Rican• Mexican• Spanish• Various Latin American Countries

Calculating Calculating MinoritiesMinorities
Subtract White Non-Hispanic from White Alone Subtract White Non-Hispanic from White Alone to get White Hispanic; then add WH and to get White Hispanic; then add WH and WNH to other racesWNH to other races
OROR
Subtract White, Non-Hispanic from total Subtract White, Non-Hispanic from total
population to get total minority populationpopulation to get total minority population
Total Michigan 9,938444Total Michigan 9,938444
White Non-Hispanic -7,806,691White Non-Hispanic -7,806,691
Minority = 2,131,753Minority = 2,131,753

New Race Category in New Race Category in 20002000
Respondents could choose up to Respondents could choose up to SIX racial backgroundsSIX racial backgrounds
Typical mixed race is 2-3% of Typical mixed race is 2-3% of populationpopulation
Race data not necessarily Race data not necessarily comparable with previous comparable with previous censusescensuses

Household Household RelationshipsRelationships
Relationship to Relationship to HouseholderHouseholder
Spouse Child Stepchild Grandchild Brother/Sister Parent Non-relative Unmarried partner is separate
category
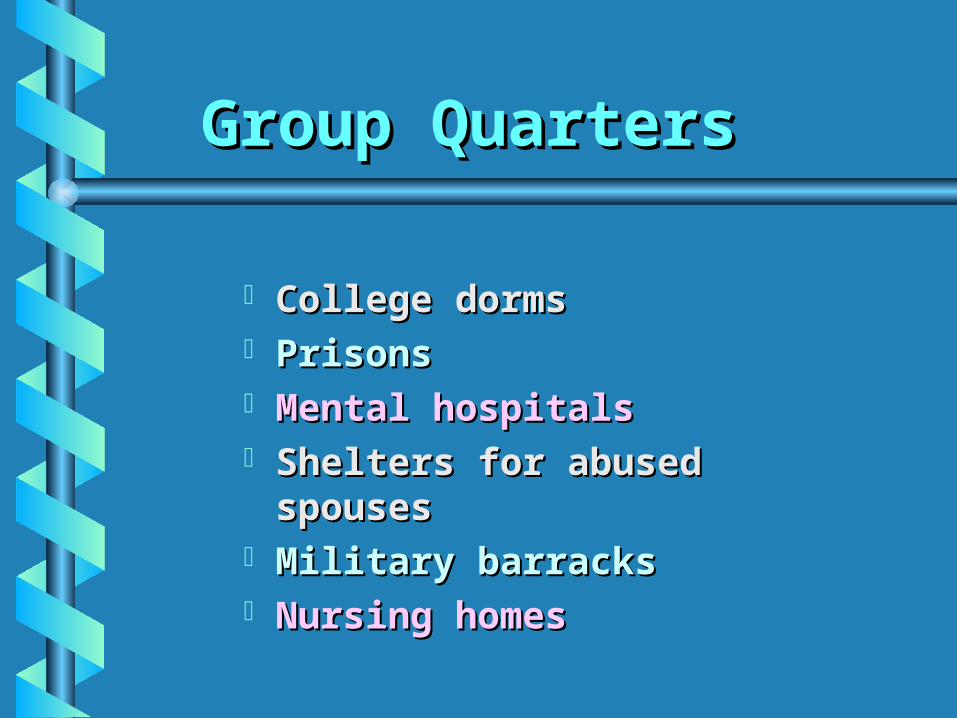
Group QuartersGroup Quarters
College dormsCollege dorms PrisonsPrisons Mental hospitalsMental hospitals Shelters for abused Shelters for abused
spousesspouses Military barracksMilitary barracks Nursing homesNursing homes

100% Questionnaire Data Reports
Pre-Tabulated Data
Summary File 1 – most age, race, sex data to the smallest geographies, block and block group
Summary File 2 – same data by 250 races to neighborhood (tract) level

2000 Sample 2000 Sample QuestionnaireQuestionnaire
(generally 1/6 of population)
Marital status, housing value and Marital status, housing value and rent rent (100% in 1990)(100% in 1990)
Grandparents as caregivers Grandparents as caregivers (new)(new)
AncestryAncestry LanguageLanguage Country of originCountry of origin School enrollment and School enrollment and
educational attainment (and educational attainment (and dropouts)dropouts)

2000 Sample 2000 Sample QuestionnaireQuestionnaire
EmploymentEmployment Industry and occupationIndustry and occupation Transportation to and place of Transportation to and place of
workwork Disability and mental illnessDisability and mental illness Veteran statusVeteran status Income and povertyIncome and poverty

Sample Data ProductsSample Data Products
Pre-Tabulated Data
Summary File 3 – socio-economic and housing characteristics to census tract or block group level
Summary File 4 – same data as Summary File 3 for 210 racial and 125 ethnic groups to tract level

Public Use Microdata Samples
(not on Factfinder)
Samples of the samples at 1% and 5% levels
Create your own tables using raw data
For 2000 currently requires statistical package such as SAS, SPSS, STATA
Larger geographies: states, metro-areas, PUMAS and super PUMAS
(contact JoAnn Dionne - [email protected] - about access and alternative software programs)

Special Tabulations (not on Factfinder)
School District Data File (Available)
Sample data for children, parents and families with school-age children for school districts
http://nces.ed.gov/surveys/sdds/index.asp
Equal Employment Opportunity File
(Fall 2003)
Sex and race for 472 occupational groups for places of 50,000+
http://www.census.gov/hhes/www/eeoindex.html
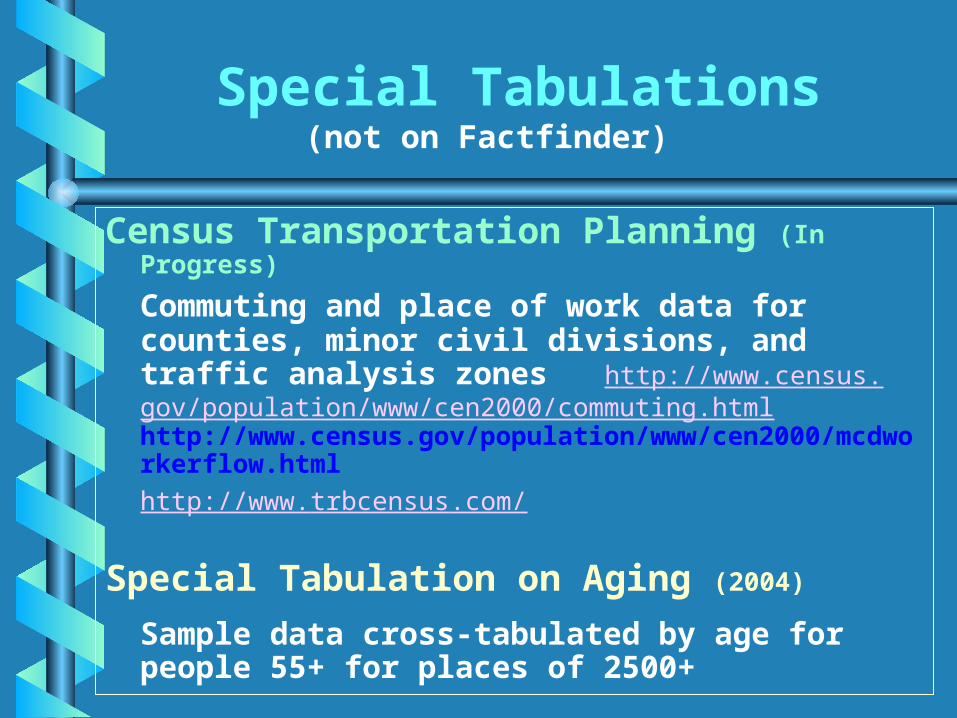
Special Tabulations(not on Factfinder)
Census Transportation Planning (In Progress)
Commuting and place of work data for counties, minor civil divisions, and traffic analysis zones http://www.census.gov/population/www/cen2000/commuting.htmlhttp://www.census.gov/population/www/cen2000/mcdworkerflow.html
http://www.trbcensus.com/
Special Tabulation on Aging (2004)
Sample data cross-tabulated by age for people 55+ for places of 2500+

Importance of 100% and Importance of 100% and Sample SurveysSample Surveys
100% and sample data on the same subject (e.g. race, age, total pop, housing) don’t always match
• Ann Arbor 100% = 114,024; Sample = 114,110• If one variable comes from sample data, try to
get all variables from sample data
Only 100% data used at block level• Sample data to only to tract or block group
level
Larger the area, the more detailed the subject variables

Census GeographyCensus Geography
Legal AreasLegal Areas
Nation State Counties Cities Townships Congressional
Districts School Districts

Census GeographyCensus Geography
Census-Designated AreasCensus-Designated Areas
Metropolitan Statistical Area Urbanized Area and Urban
Cluster Census Tract Block Group Block Zip Code Tabulation Area PUMAS/Super-PUMAS Traffic Analysis Zones

Census Geography Census Geography MapMap

Urban AreasUrban AreasUrbanized = Densely settled area, 50,000+
Urban Cluster = Densely settled area,
2500-50,000; can be outside metro area
South Central Michigan has a surprising number of urban clusters

Metropolitan Statistical Metropolitan Statistical AreaArea
•Central city of 50,000 or more •Its own county, and •Surrounding counties with heavy commuting patterns

Metropolitan Area Metropolitan Area DefinitionsDefinitions
Metropolitan Statistical AreaMetropolitan Statistical Area - - stand-alone metro areastand-alone metro area
Primary Metropolitan Statistical Primary Metropolitan Statistical AreaArea - - metro area which is component of metro area which is component of larger metropolitan arealarger metropolitan area
Consolidated Metropolitan Consolidated Metropolitan Statistical AreaStatistical Area - - two or more two or more contiguous metropolitan areascontiguous metropolitan areas

Detroit Consolidated Detroit Consolidated Metropolitan Statistical AreaMetropolitan Statistical Area
1990
Lapeer Livingston
Detroit PMSA Macomb
Monroe
Oakland
St. Clair
Wayne
Ann Arbor PMSA Washtenaw
2000
Lapeer Macomb
Detroit PMSA Monroe
Oakland
St. Clair
Wayne
Lenawee
Ann Arbor PMSA Livingston
Washtenaw
Flint PMSA Genesee
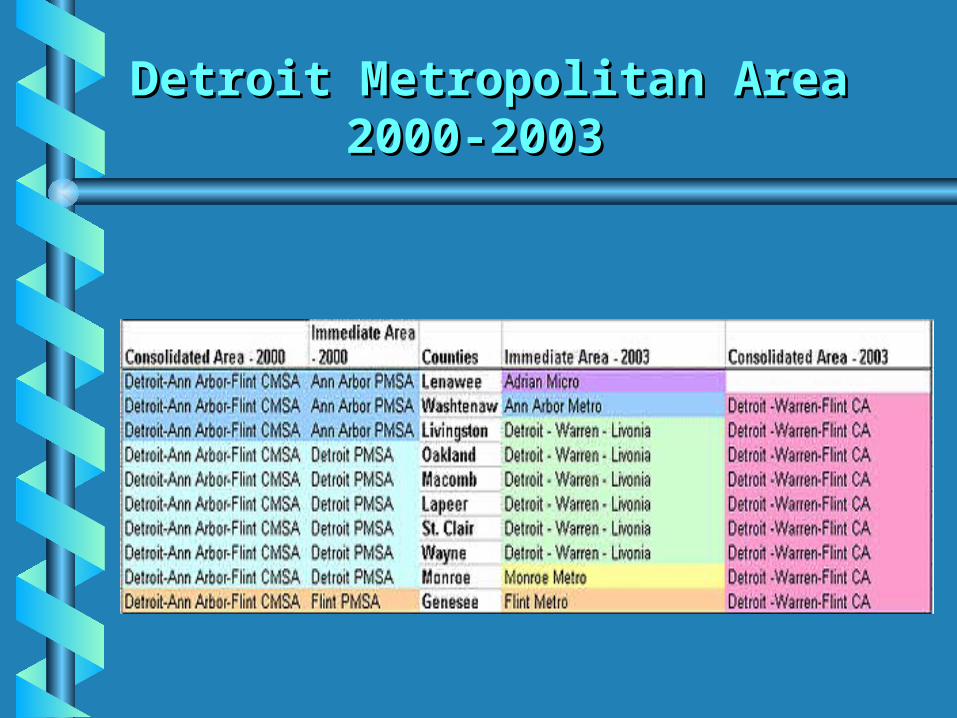
Detroit Metropolitan AreaDetroit Metropolitan Area2000-20032000-2003

Detroit Metropolitan AreaDetroit Metropolitan Area2000-20032000-2003
MSA DefinitionsMSA Definitions
This is very complicatedThis is very complicated
Just consult the Just consult the definitions when you definitions when you need them need them
http://www.census.gov/population/wwhttp://www.census.gov/population/www/estimates/w/estimates/
metrodefmetrodef.html.html

Census TractsCensus Tracts
Areas of about 4000 peopleAreas of about 4000 people Approximate neighborhoodsApproximate neighborhoods
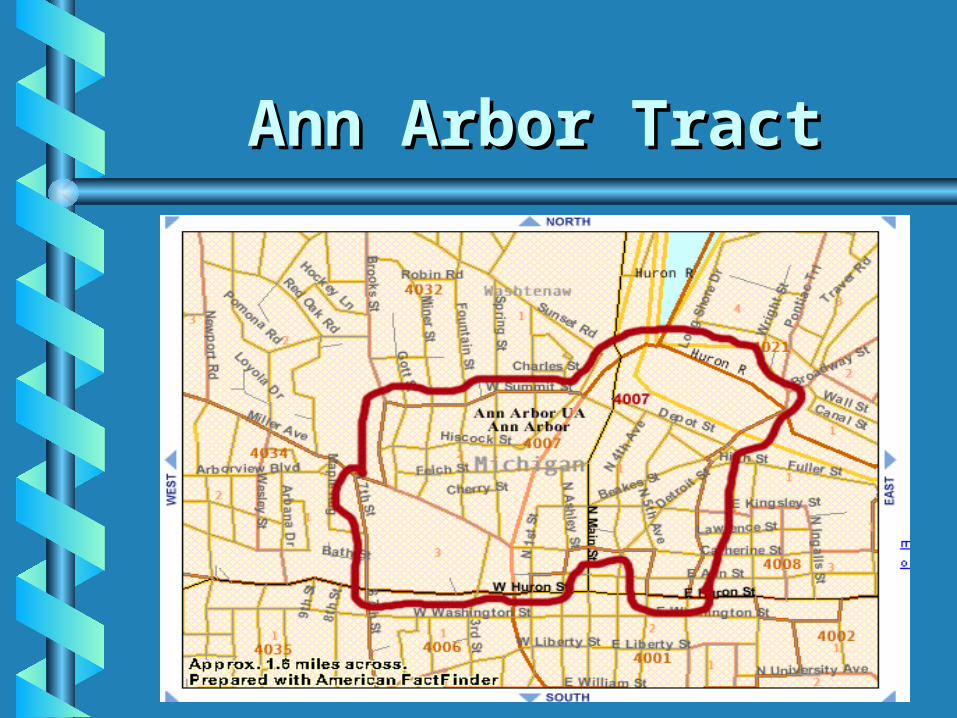
Ann Arbor TractAnn Arbor Tract
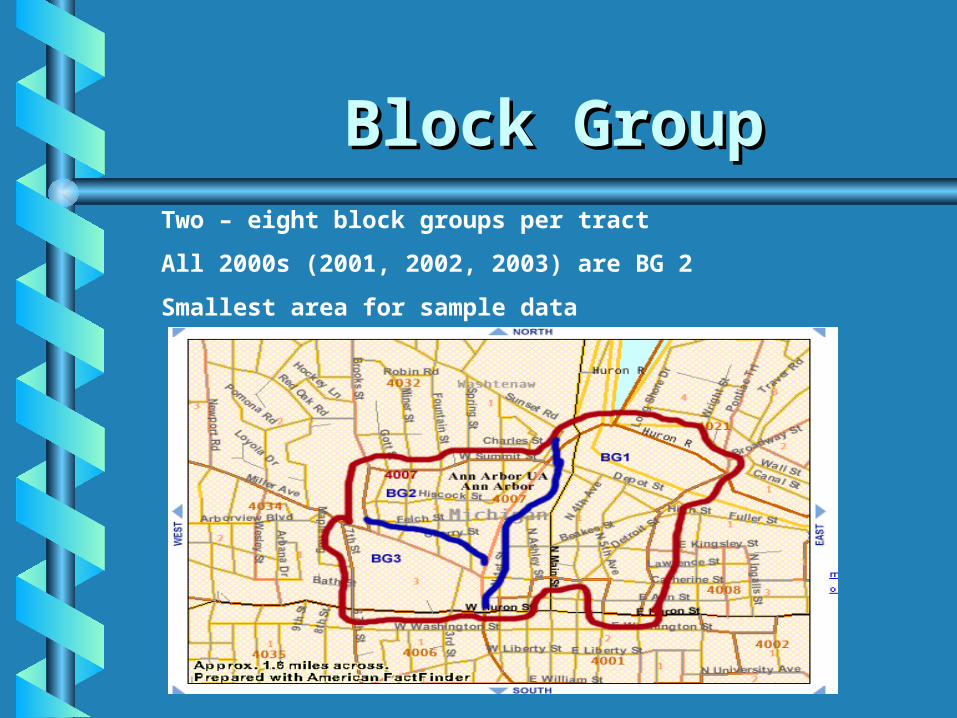
Block GroupBlock GroupTwo – eight block groups per tract
All 2000s (2001, 2002, 2003) are BG 2
Smallest area for sample data

BlocksBlocks
All blocks in 2000 have 4-digit All blocks in 2000 have 4-digit numbersnumbersSome 100% data but no sample Some 100% data but no sample datadata
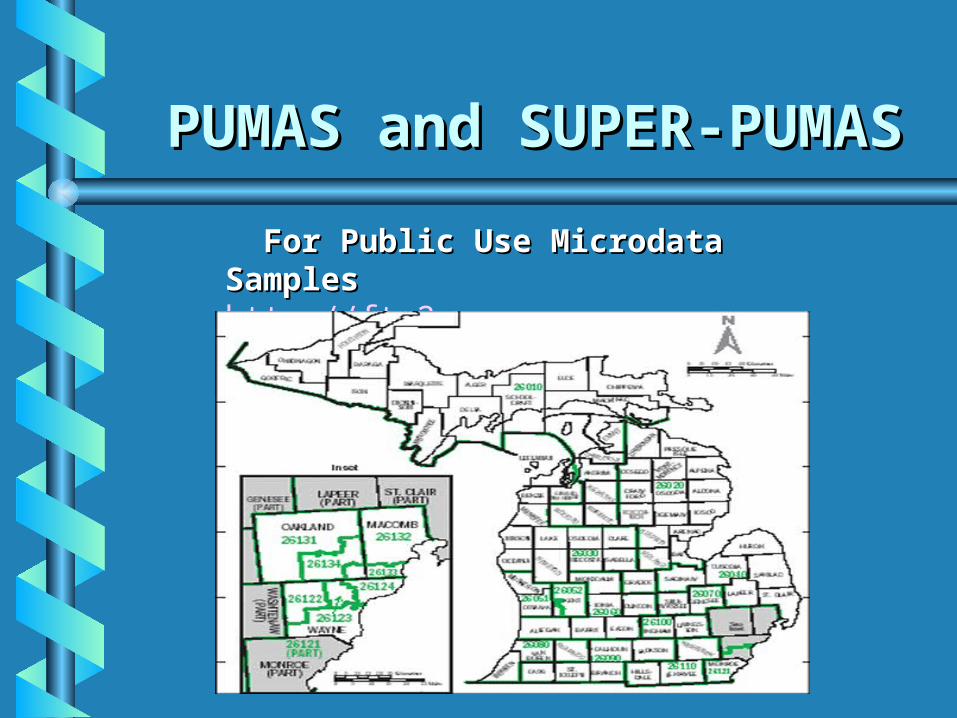
PUMAS and SUPER-PUMAS and SUPER-PUMASPUMAS
For Public Use Microdata For Public Use Microdata SamplesSampleshttp://ftp2.census.gov/geo/maps/puma/

PUMAS and SUPER-PUMAS and SUPER-PUMASPUMAS
American Factfinder Reference American Factfinder Reference MapsMaps
http://factfinder.census.gov/
Locating Census MapsLocating Census Maps
American FactfinderAmerican Factfinder• http://http://factfinderfactfinder.census.gov/.census.gov/
Census Bureau Web Site (PDF)Census Bureau Web Site (PDF)• http://ftp2.census.gov/http://ftp2.census.gov/plmapplmap//
Documents Center Paper CopiesDocuments Center Paper Copies• Tract maps for MichiganTract maps for Michigan• Block maps for Wayne and WashtenawBlock maps for Wayne and Washtenaw
Arcview GIS Program in Map LibraryArcview GIS Program in Map Library

Technical Technical DocumentationDocumentation
Geographic and subject definitionsGeographic and subject definitions Lists of tables and individual Lists of tables and individual
components in tablescomponents in tables Code lists (ancestry, race, occupation, Code lists (ancestry, race, occupation,
group quarters, Hispanic, industry, group quarters, Hispanic, industry, language, country)language, country)
Original questionnaireOriginal questionnaire
http://www.lib.http://www.lib.umichumich..eduedu//govdocsgovdocs/census2/sf1td.html/census2/sf1td.html http://www.lib.http://www.lib.umichumich..eduedu//govdocsgovdocs/census2/sf3td.html/census2/sf3td.html

Census Data Census Data FormatsFormats
20002000
FTPFTP Transfer all data for all geographies in a county Transfer all data for all geographies in a county
and manipulate with SAS or SPSSand manipulate with SAS or SPSS
http://ftp2.census.gov/plmap/http://ftp2.census.gov/plmap/
http://ftp2.census.gov/census_2000/http://ftp2.census.gov/census_2000/
American FactfinderAmerican Factfinder http://http://factfinderfactfinder.census.gov/.census.gov/
Prepared profilesPrepared profiles Data extraction to a spreadsheet,Data extraction to a spreadsheet, Reference and thematic mapsReference and thematic maps

Census Data Census Data FormatsFormats
20002000
Census Bureau CDs/DVDsCensus Bureau CDs/DVDsQuicker than American Factfinder for Quicker than American Factfinder for extracting very large data setsextracting very large data sets
Geolytics CD-ROMSGeolytics CD-ROMS Thematic mapping for all variables and Thematic mapping for all variables and
created variables; for 1970, 1980, 1990, created variables; for 1970, 1980, 1990, and 2000and 2000
Neighborhood Change Database (1970-Neighborhood Change Database (1970-2000) coming?2000) coming?
Maps can be imported into more Maps can be imported into more sophisticated programssophisticated programs
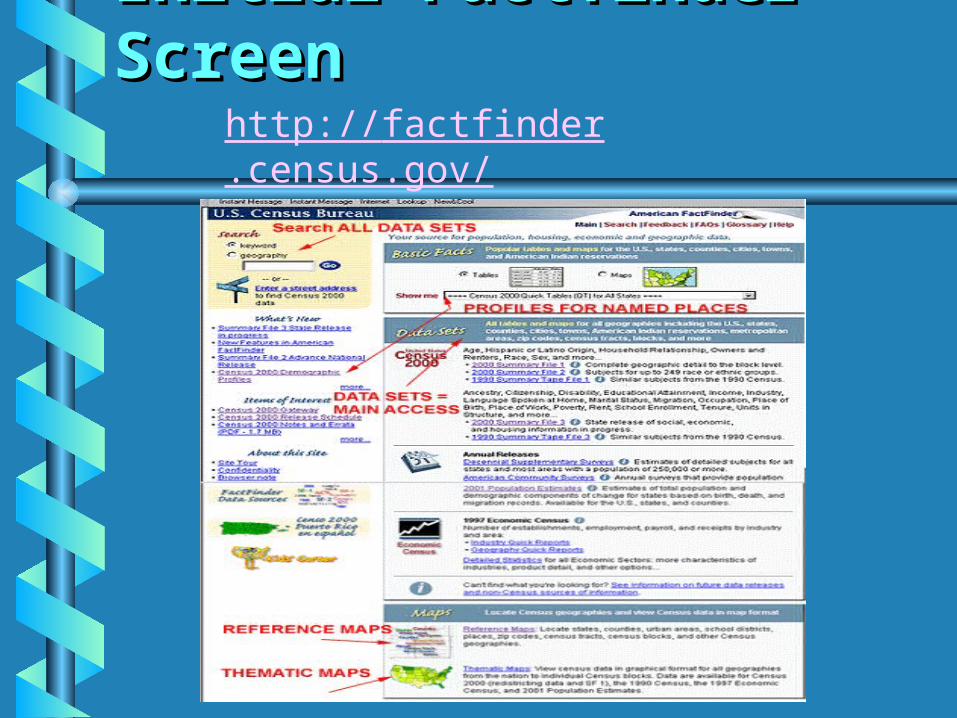
Initial Factfinder Initial Factfinder ScreenScreen
http://factfinder.census.gov/

http://factfinder.census.gov/
Brief profiles and geographic comparisons for Brief profiles and geographic comparisons for U.S., states, counties, and placesU.S., states, counties, and places
Basic FactsBasic Facts
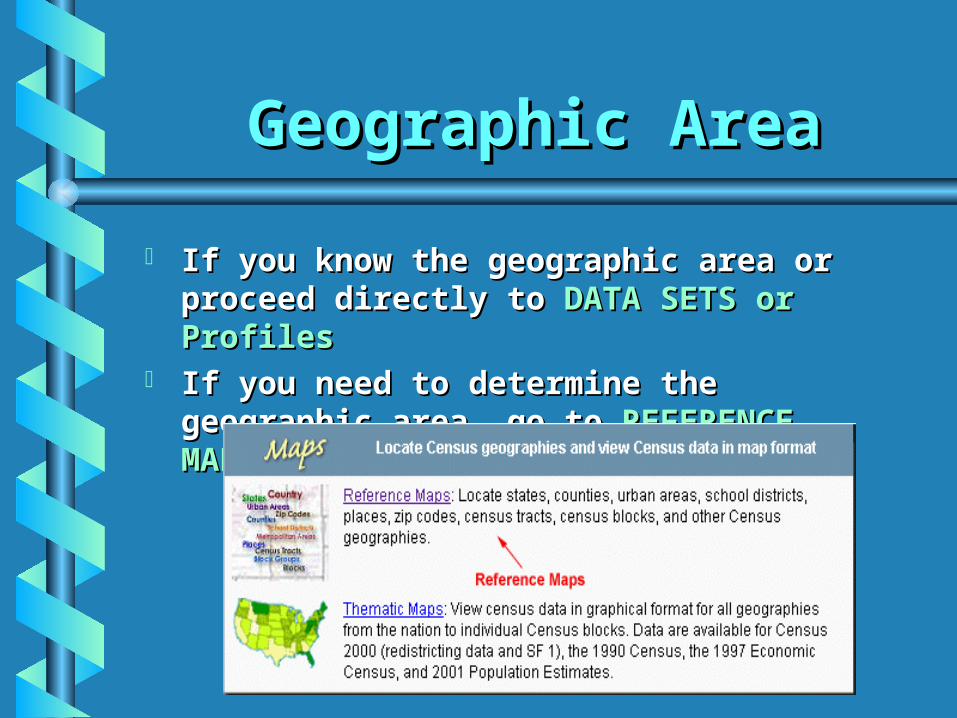
Geographic AreaGeographic Area
If you know the geographic area or If you know the geographic area or proceed directly toproceed directly to DATA SETS or DATA SETS or ProfilesProfiles
If you need to determine the If you need to determine the geographic area, go togeographic area, go to REFERENCE REFERENCE MAPSMAPS

REFERENCE MAPSREFERENCE MAPS
Internet Internet Explorer 5+ Explorer 5+ works best if works best if you want to you want to click and click and zoomzoom
Choose Choose BreadcrumbsBreadcrumbs//GeographyGeography forfor three three better better optionsoptions
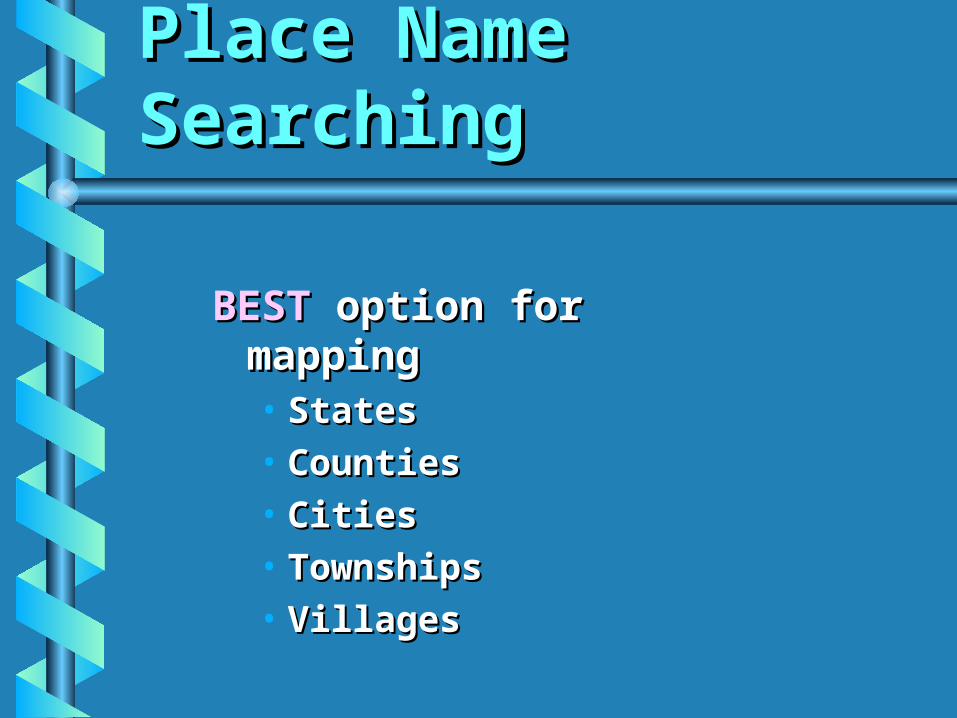
Place Name Place Name SearchingSearching
BESTBEST option for option for mappingmapping• StatesStates• CountiesCounties• CitiesCities• TownshipsTownships• VillagesVillages

Place Name Place Name SearchingSearching
1. Select Name Search2. Choose Year3. Type in Name and GO.4. Choose from Name Options and SHOW MAP.

Navigating the MapNavigating the Map
•Level 5 maps provide an overview of the tracts•Not all features show in this view•Use arrows to move map or click to zoom in

Block Group Block Group MapsMaps
•Block groups show up best at Level 3; tracts at level 4•Zoom to Level 2 for street names and block numbers•Write down tract, block group and block numbers you need for use with the Data Sets menu

Changing LegendChanging LegendWhen you can’t tell block group from tract boundaries, click on LEGEND to turn off block group boundaries and numbers

Updated MapUpdated Map
And, yes, Tract 4003 has unusually tortuous boundaries.

Address SearchingAddress Searching
Search for a known address to find its county, city, tract, block group, block number, and map

Address ResultsAddress Results
•ADDRESS SEARCHING gives you the tract, block group and
block number so you can retrieve data in Data Sets
•You can also choose to SHOW MAP

Address MapAddress Map

Downloading MapsDownloading Maps
Right-click on the map to download Right-click on the map to download it.it.
Maps can only be downloaded in GIF Maps can only be downloaded in GIF (picture) format(picture) format
For GIS purposes, you Arcview, For GIS purposes, you Arcview, ArcInfo, MapInfo, or Tiger Line Files.ArcInfo, MapInfo, or Tiger Line Files.

Data SetsData Sets
Once you’ve determined geography Once you’ve determined geography and used Basic Facts, go to and used Basic Facts, go to DATA DATA SETS SETS for the detailfor the detail

2000 and 1990 Census2000 and 1990 Census Most detailed demographic and housing data
Census Supplementary FileCensus Supplementary File Conducted at the same time as the Census to test of small area sampling techniques
American Community SurveyAmerican Community Survey Updates of sample data for counties and places of 65,000+
Data Sets Includes Five Data Sets Includes Five Types of FilesTypes of Files

Economic CensusEconomic Census Business payrolls and sales for all types of industries for the nation, states, counties, large cities and zip codes
Population EstimatesPopulation Estimates Annual state and county population estimates. Totals only - no race or age.
Data Sets Includes Five Data Sets Includes Five Types of FilesTypes of Files

Listing of Data SetsListing of Data Sets
The default display are files from the 2000 and 1990 Census
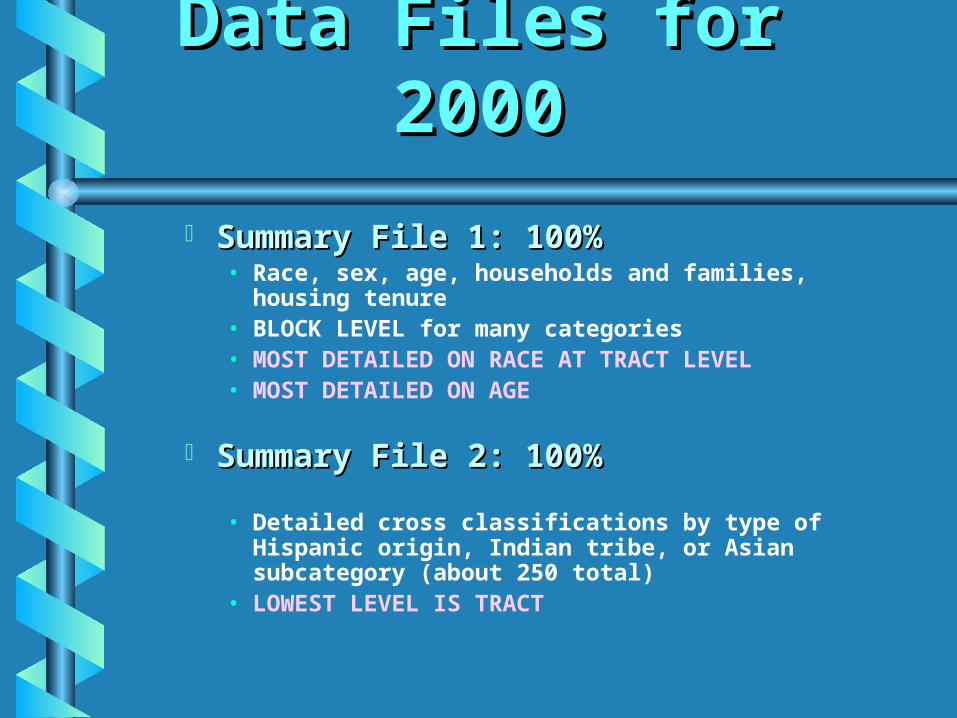
Data Files for 2000Data Files for 2000
Summary File 1: 100%Summary File 1: 100%• Race, sex, age, households and families,
housing tenure• BLOCK LEVEL for many categories• MOST DETAILED ON RACE AT TRACT LEVEL• MOST DETAILED ON AGE
Summary File 2: 100%Summary File 2: 100%
• Detailed cross classifications by type of Hispanic origin, Indian tribe, or Asian subcategory (about 250 total)
• LOWEST LEVEL IS TRACT

Data Files for 2000Data Files for 2000
Summary File 3: SampleSummary File 3: Sample• Income, language, ethnicity,
occupation, commuting, housing value and rent
• Housing value and rent in STF 1 in 1990• Ancestry only at tract level; in 1990
was available for block groups
Summary File 4: SampleSummary File 4: Sample • Detailed cross classifications by 350
races and ancestries• Lowest level is tract

Data Sets Option Data Sets Option BoxBox
Options box aligns with checked data set

Options for Data Options for Data SetSet
Detailed TablesDetailed Tables = = most data for most data for most placesmost places• Download one entire table at a time
Custom TablesCustom Tables = = may mix and may mix and match variables in several tables, match variables in several tables, then sort and filterthen sort and filter• If over 10 variables, use Detailed Tables
and manipulate with Excel
Options for Data Options for Data SetSet
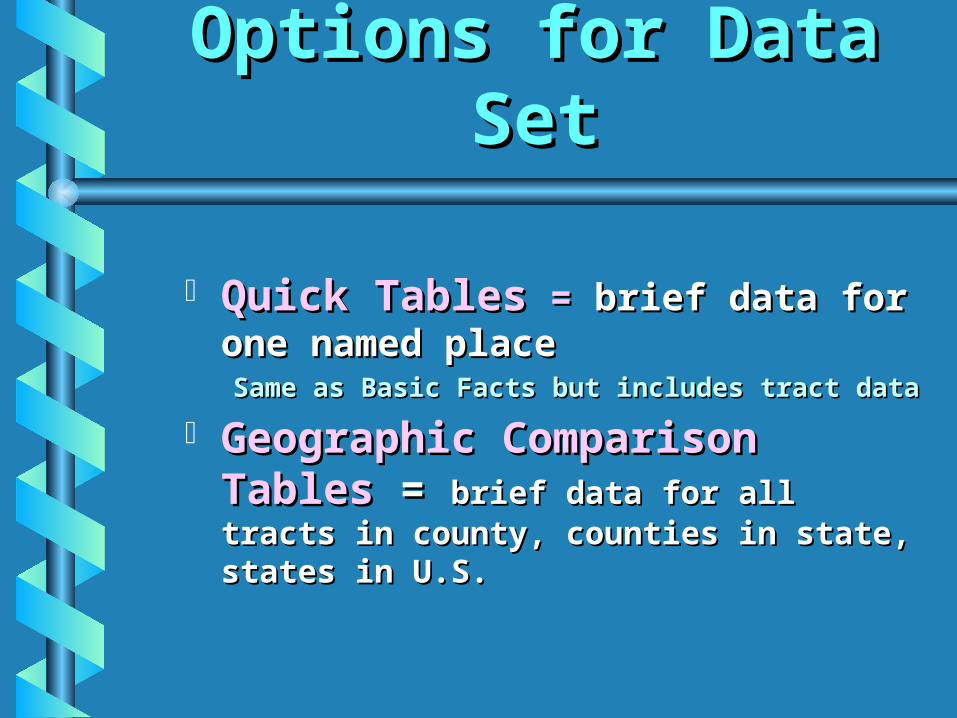
Quick TablesQuick Tables = = brief data for brief data for one named placeone named placeSame as Basic Facts but includes tract dataSame as Basic Facts but includes tract data
Geographic Comparison Geographic Comparison TablesTables = = brief data for all tracts in brief data for all tracts in county, counties in state, states in county, counties in state, states in U.S.U.S.

Options for Data Options for Data SetSet
Technical DocumentationTechnical Documentation = = definitions, lists of tables, definitions, lists of tables,
interpretation of codesinterpretation of codes Thematic MapsThematic Maps = = subject subject
mapsmaps

Summary File 1Summary File 1
Most data by age, race, sex, Most data by age, race, sex, households, group quarters down to households, group quarters down to block levelblock level

Detailed Tables Detailed Tables GeographyGeography
Default is LIST geography. Others include name Default is LIST geography. Others include name search, address search, and geography within search, address search, and geography within geography.geography.

Detailed Tables Detailed Tables GeographyGeography
You can chooseYou can choose • All states• All counties in a state• All tracts in a county • All 5 digit zip codes in a 3-digit zip
code• All block groups in a tract
• All blocks in a block group.• To choose all 5 digit zip codes or tracts in
state, block groups in city, use Geography within Geography
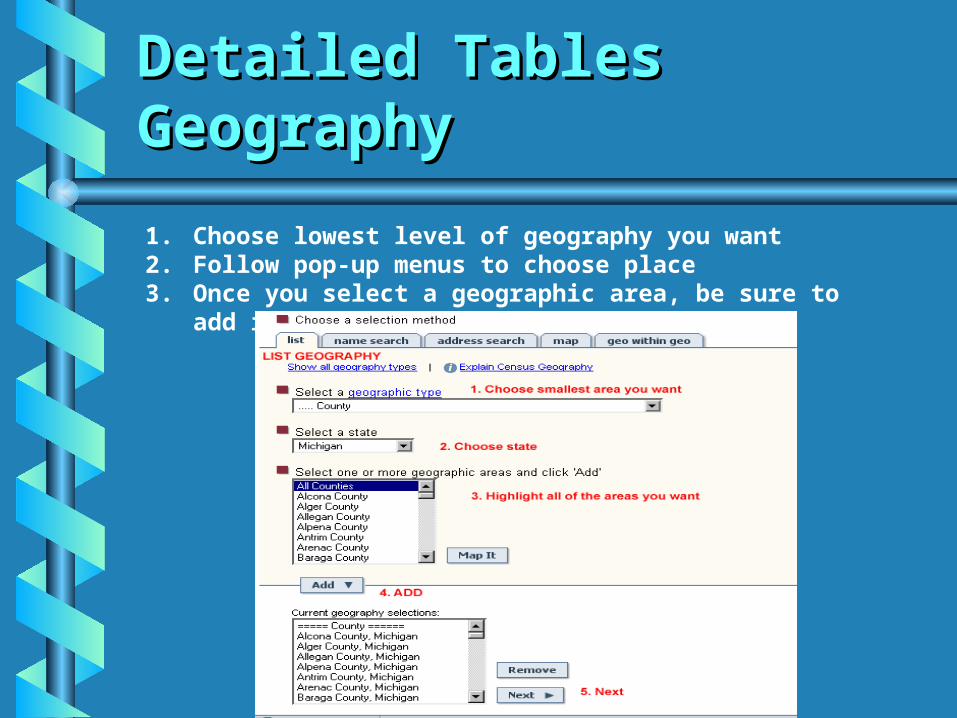
Detailed Tables Detailed Tables GeographyGeography
1. Choose lowest level of geography you want2. Follow pop-up menus to choose place3. Once you select a geographic area, be sure to
add it

The default for Detailed Tables is the List of All Tables.
List of Tables - SF1List of Tables - SF1http://http://factfinderfactfinder.census.gov/.census.gov/

Population (P) Tables Population (P) Tables by Subjectby Subject
RaceRace AgeAge Households by Age, Type, and Households by Age, Type, and
RelationshipRelationship Families and Family TypeFamilies and Family Type Group QuartersGroup Quarters Imputations of data when Imputations of data when
questionnaire not answeredquestionnaire not answered

Housing (H) Tables Housing (H) Tables Clustered by SubjectClustered by Subject
Housing Units (occupied and Housing Units (occupied and vacant)vacant)
Occupied Housing Units by race and Occupied Housing Units by race and household sizehousehold size
Owner/Renter Occupied by RaceOwner/Renter Occupied by Race Imputations of data when Imputations of data when
questionnaires not answeredquestionnaires not answered

PCT Tables Clustered PCT Tables Clustered by Subjectby Subject
• American Native Tribes• Asian Races (e.g. Asian Indian, Hmong)• Hawaiian and Pacific Islander Races• Hispanic Origin Details (e.g. Cuban)• Single years of age by race to 99; three
groups over 100• Unmarried partners• Nonrelatives by household type (foster
child, boarder) and race• Group quarters population by age,
race, sex and type (dorm, prison)

To preview a table, highlight it and click on What’s This?
List of Tables - SF1List of Tables - SF1http://http://factfinderfactfinder.census.gov/.census.gov/
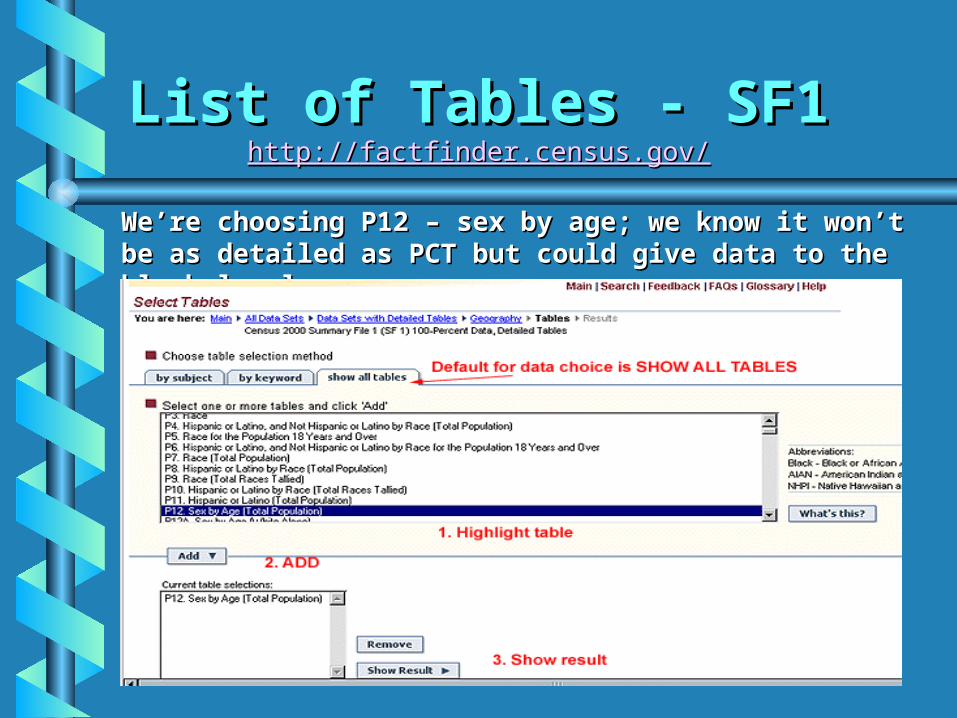
We’re choosing P12 – sex by age; we know it won’t We’re choosing P12 – sex by age; we know it won’t be as detailed as PCT but could give data to the be as detailed as PCT but could give data to the block levelblock level
List of Tables - SF1List of Tables - SF1http://http://factfinderfactfinder.census.gov/.census.gov/
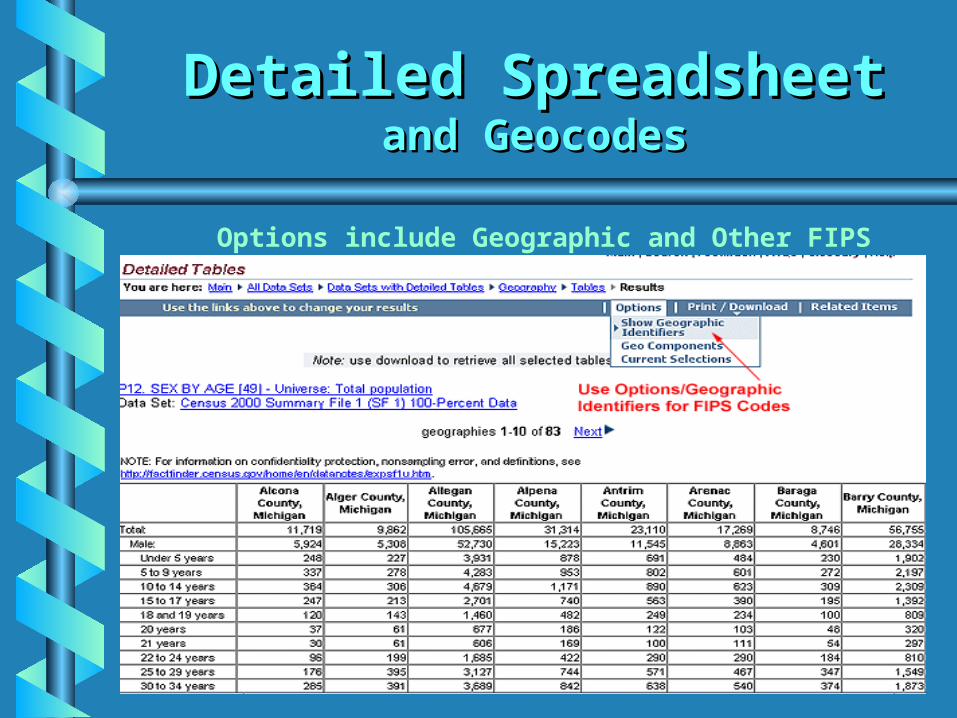
Detailed SpreadsheetDetailed Spreadsheetand Geocodesand Geocodes
Options include Geographic and Other FIPS Codes
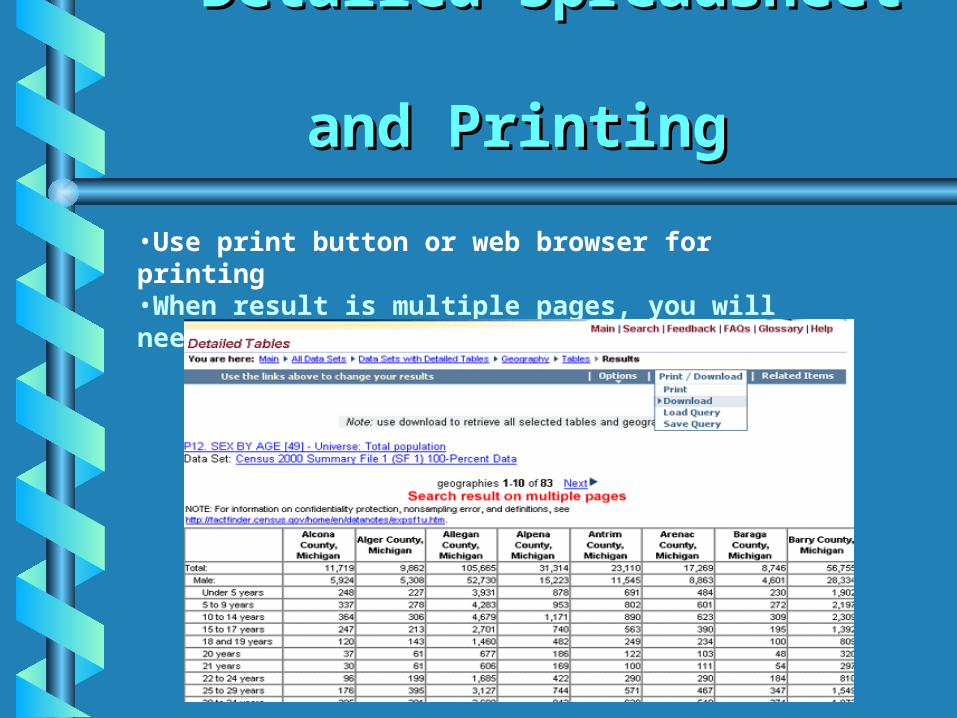
Detailed Spreadsheet Detailed Spreadsheet
and Printing and Printing
•Use print button or web browser for printing•When result is multiple pages, you will need to print each page individually

Detailed Spreadsheet Detailed Spreadsheet
and Downloading Optionsand Downloading Options
ALWAYS use Factfinder’s button for downloading data
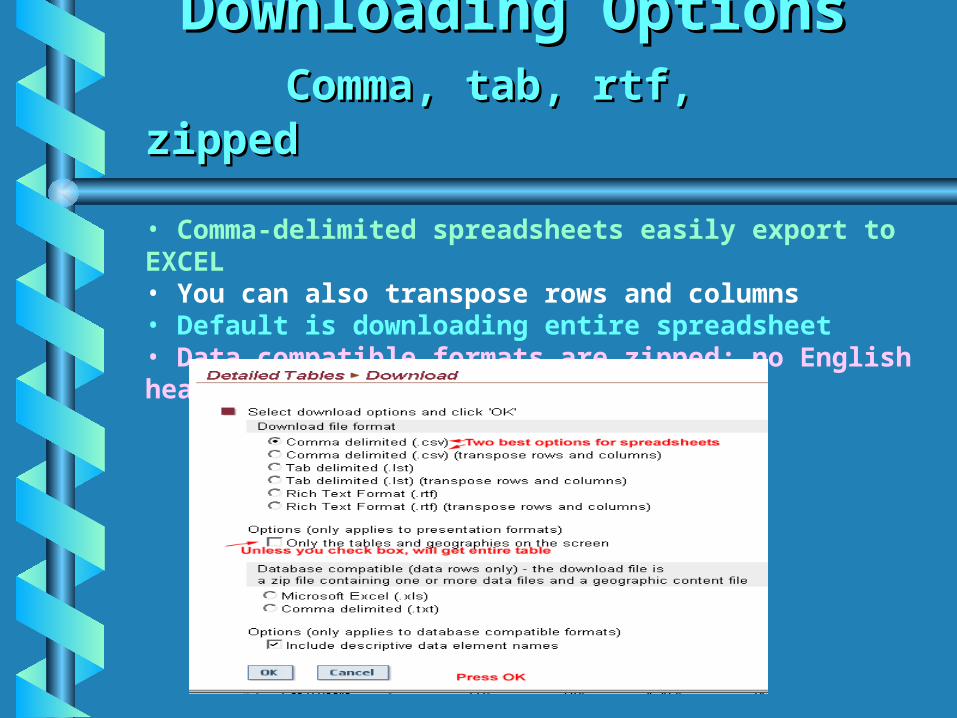
Downloading Downloading OptionsOptions Comma, tab, rtf, zippedComma, tab, rtf, zipped
• Comma-delimited spreadsheets easily export to EXCEL• You can also transpose rows and columns• Default is downloading entire spreadsheet• Data compatible formats are zipped; no English headers
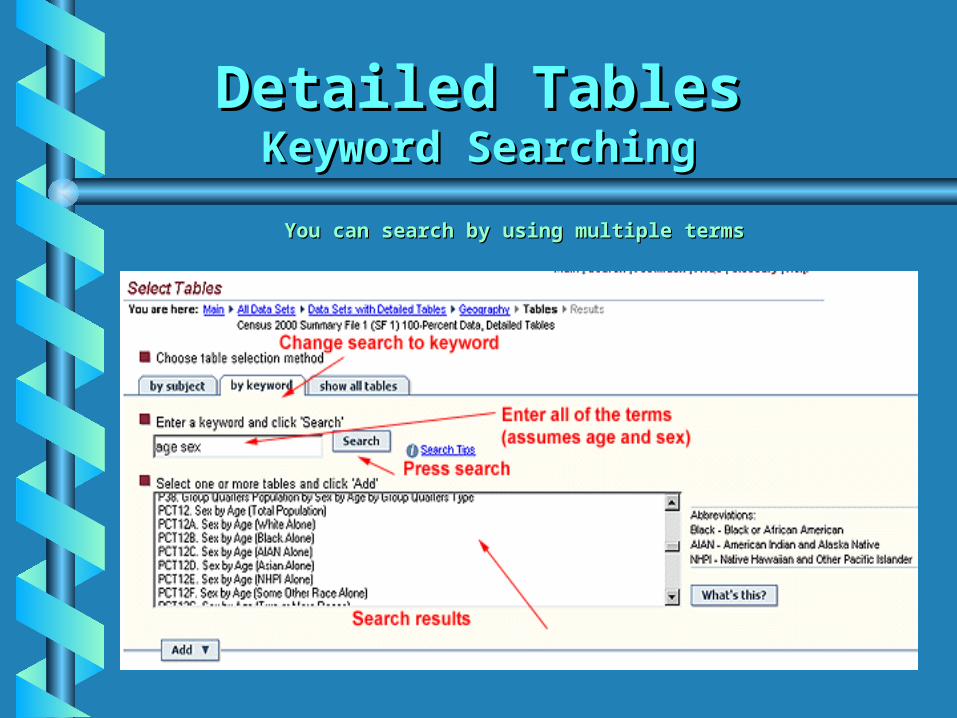
Detailed TablesDetailed TablesKeyword SearchingKeyword Searching
You can search by using multiple termsYou can search by using multiple terms

Keyword SearchingKeyword Searching
PCT Tables have single years of agePCT Tables have single years of age

Multiple Table Multiple Table SpreadsheetSpreadsheet
Although the spreadsheet has nine tables, they are Although the spreadsheet has nine tables, they are separate tablesseparate tables
You must combine them with a spreadsheet programYou must combine them with a spreadsheet program

Age, sex, households, families, and owner v. rented occupied housing units
State, counties, places, MSAs, and census tracts
For 250 races; e.g. single years of age by sex for the Pakistani population rather than the Asian population at large
Brief guide available at: http://www.lib.umich.edu/govdocs/census2/sf2.htm
Summary File 2Summary File 2http://http://factfinderfactfinder.census.gov/.census.gov/

2000 is the first time for this file on format other than magnetic tape
There are limits for racial data – must have 100 or more people of race in the geographic area
This file not in most GIS programs; data Must be downloaded and transferred
Summary File 2Summary File 2http://http://factfinderfactfinder.census.gov/.census.gov/

Summary File 3Summary File 3http://http://factfinderfactfinder.census.gov/.census.gov/
Most social and economic characteristics for the smallest geographic areas

Summary File 3-SubjectsSummary File 3-Subjectshttp://http://factfinderfactfinder.census.gov/.census.gov/
AncestryAncestry Education and school enrollmentEducation and school enrollment Commuting, occupation, industryCommuting, occupation, industry Income and povertyIncome and poverty Disability and veteran statusDisability and veteran status Housing value, rent, mortgagesHousing value, rent, mortgages
More breakdowns within categories More breakdowns within categories and racial cross-classifications than and racial cross-classifications than the Demographic Profilesthe Demographic Profiles

Geography Within Geography Within GeographyGeography
Default List ViewDefault List View
Choose one indentation down from the previous geography, e.g. tracts in county, 5-digit zip codes within a 3-digit zip code
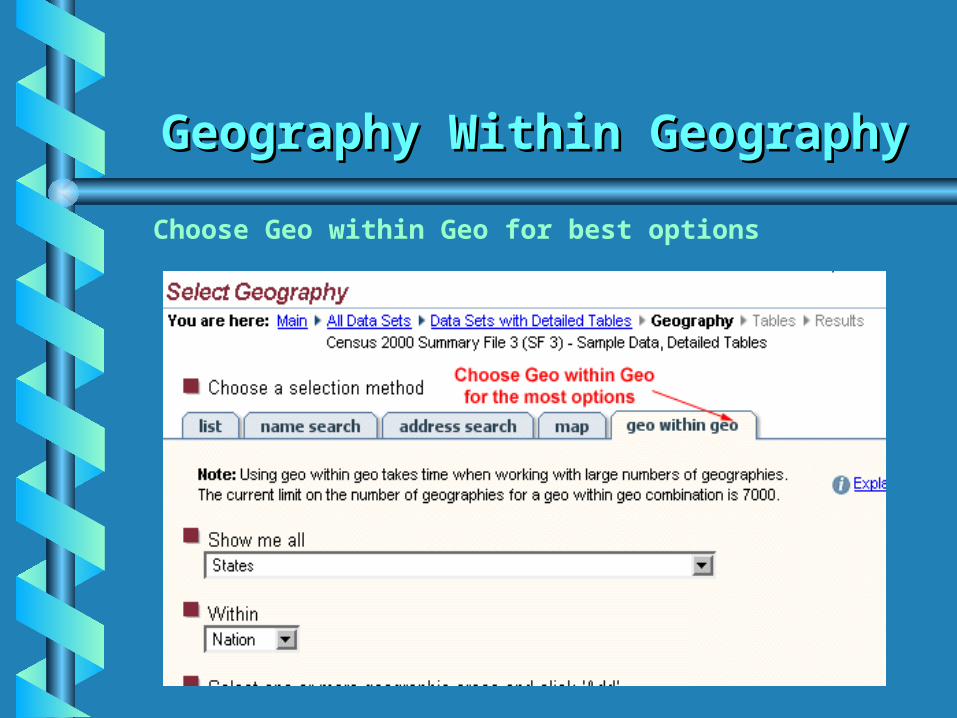
Geography Within Geography Within GeographyGeography
Choose Geo within Geo for best options

Geography Within Geography Within GeographyGeography
Choose the SMALLEST geography you want; then the LARGEST geography you want; then follow instructions

Summary File 3Summary File 3List of TablesList of Tables
http://http://factfinderfactfinder.census.gov/.census.gov/
P – Population Tables to Block Group Level
P1-93 Sample data for total populationP 94-144 ImputationsP 145-160 Sample data by race

Summary File 3Summary File 3List of TablesList of Tables
http://http://factfinderfactfinder.census..census.govgov//
H – Housing Tables to Block Group Level
H 1-98 Sample data for total populationH 99-121 Imputations
Note: no sample housing tables by race at the block group level

Summary File 3Summary File 3List of TablesList of Tables
http://http://factfinderfactfinder.census..census.govgov//
PCT – Population Tables to Tracts
PCT 1-76 – very detailed sample data broken down by race; includes ancestry as
separate categories but does not break other data down by ancestry
HCT – Housing Tables to TractsHCT 1-48 – very detailed housing sample
data broken down by race but not ancestry

Summary File 3Summary File 3Subject SearchSubject Search
Highlight a subject (e.g. commuting) and search Results include all tables where the subject is a variable Choose P30 and P31; Add; Show Table

Summary File 3Summary File 3http://http://factfinderfactfinder.census.gov/.census.gov/

Summary File 3Summary File 3AncestryAncestry
http://http://factfinderfactfinder.census.gov/.census.gov/
Primarily countries with which white and some black races identify
Tables PCT 16, 17, and 18 Options include first ancestry or only
ancestry, second ancestry (in dual report), and ancestries totaled (all first, second and only)
List of Ancestrieshttp://www.lib.umich.edu/govdocs/census2/sf3td/sf3tdg1.pdf

Summary File 3Summary File 3AncestryAncestry
http://http://factfinderfactfinder.census.gov/.census.gov/
Ancestry is another tract only variable
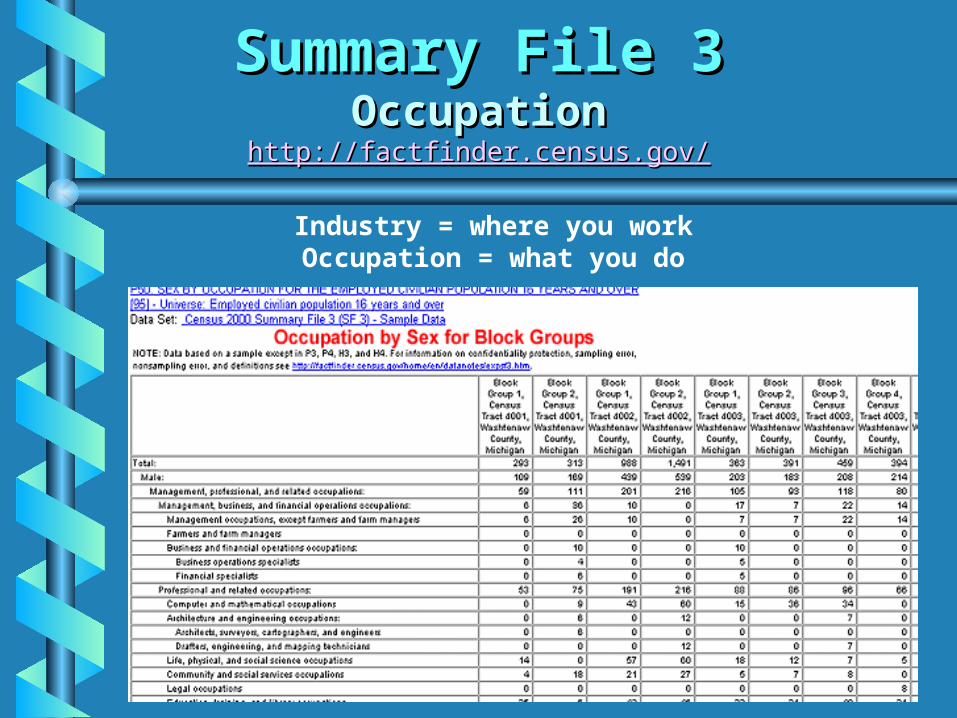
Summary File 3Summary File 3OccupationOccupation
http://http://factfinderfactfinder.census..census.govgov//
Industry = where you workOccupation = what you do
Summary File 3Summary File 3Educational AttainmentEducational Attainment
Population over 25 is countedPopulation over 25 is counted
Data is not cumulative; Data is not cumulative; Even though high school graduation rate may be 0%, people who completed bachelors or masters completed high school as well
Main table is P37Main table is P37
Table by race is P148Table by race is P148Many tables in this data set are split so racial breakdowns appear in a later number

Summary File 3Summary File 3Educational AttainmentEducational Attainment

Summary File 3Summary File 3DisabilityDisability
Disabilities count overall limitations, not individual diseases
• Sensory• Physical• Mental• Self-care• Go outside the home• Employment

Summary File 3Summary File 3DisabilityDisability

Summary File 3Summary File 3RentRent
Contract rent = amount paid to landlord
Gross rent = amount paid to landlord
AND amount for utilities

Summary File 3Summary File 3Labor ForceLabor Force
Labor Force = either have a job or are looking for a job
Not in Labor Force = don’t have job or want one (e.g. retiree)
Unemployed = in labor force but don’t have job

Summary File 3Summary File 3Labor ForceLabor Force
Summary File 3Summary File 3IncomeIncome
Income calculated for households (related, unrelated, single), families (related), and individuals
Income includes salaries, interest, social security, retirement, public assistance
Median means half earn below and half earn above
Aggregate means all of the income in that geographic area

Summary File 3Summary File 3IncomeIncome

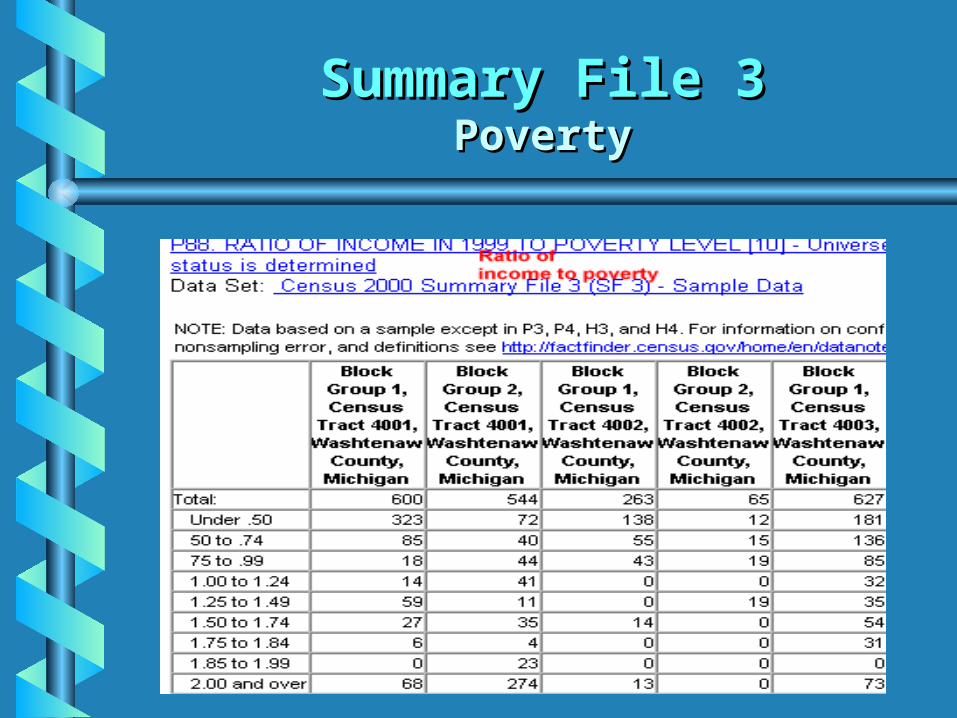
Summary File 3Summary File 3PovertyPoverty
Calculated variable based on income, size of family, and federal poverty guidelines
Poverty guidelines for 1999 appear at:
http://www.census.gov/http://www.census.gov/hheshhes/poverty//poverty/histpovhistpov/hstpov1.html/hstpov1.html
Example of ratio of income to povertyPoverty for one person in 1999 was $8501Under .50 = earned less than $4250
Earned 1.5 of poverty=$12751
Summary File 3Summary File 3PovertyPoverty

Summary File 4Summary File 4http://http://factfinderfactfinder.census.gov/.census.gov/
Sample data for 350 races and ancestries
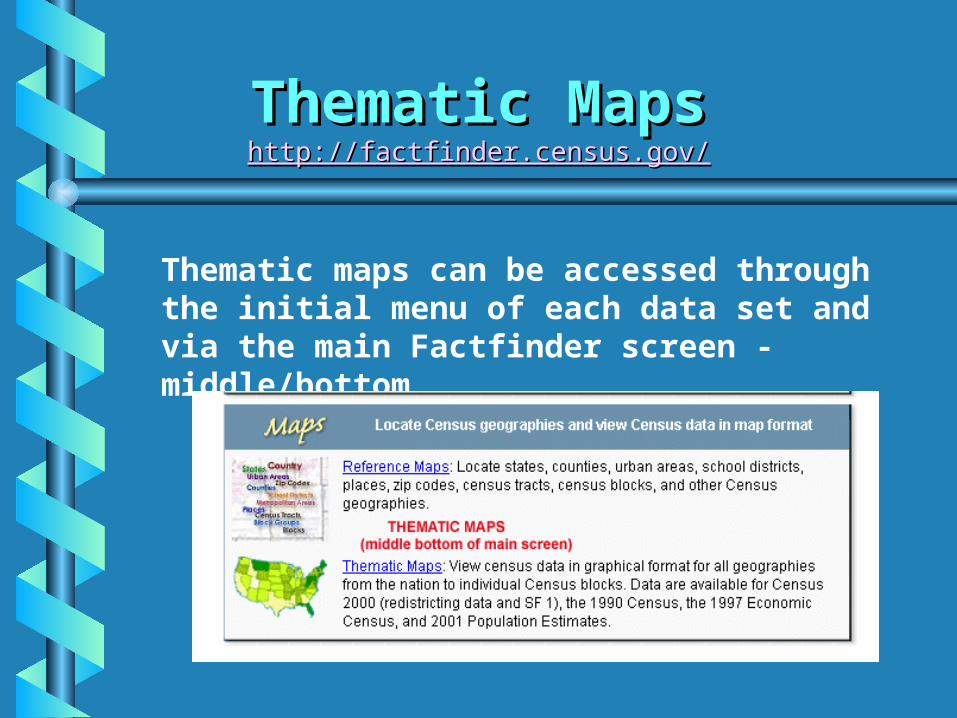
Thematic maps can be accessed through the initial menu of each data set and via the main Factfinder screen - middle/bottom
Thematic MapsThematic Mapshttp://http://factfinderfactfinder.census.gov/.census.gov/

Thematic MapsThematic MapsChanging Data SetChanging Data Set
Check the default data set to make sure Check the default data set to make sure it’s what you want. Change selection.it’s what you want. Change selection.

Thematic MapsThematic MapsNew Data SetNew Data Set
Pop-up menu changed from 2000 Pop-up menu changed from 2000 Summary File 1 to 2000 Summary File Summary File 1 to 2000 Summary File 3.3.

Thematic MapsThematic MapsChoosing New GeographyChoosing New Geography
You can choose a map through the List method, You can choose a map through the List method, using the HIGHEST LEVEL of geography you wantusing the HIGHEST LEVEL of geography you want
(e.g. Washtenaw County, Mich)(e.g. Washtenaw County, Mich)

Thematic MapsThematic MapsChoosing Theme (Subject)Choosing Theme (Subject)
You can choose a theme by subject, keyword, or list
Not all Census variables are represented
In this case, race appears in SF1 maps; ancestry in SF3 maps

Thematic MapsThematic MapsChanging Geographic DisplayChanging Geographic Display
The default for a county is county subdivisionThe default for a county is county subdivision This can be changed to census tract or BGThis can be changed to census tract or BG
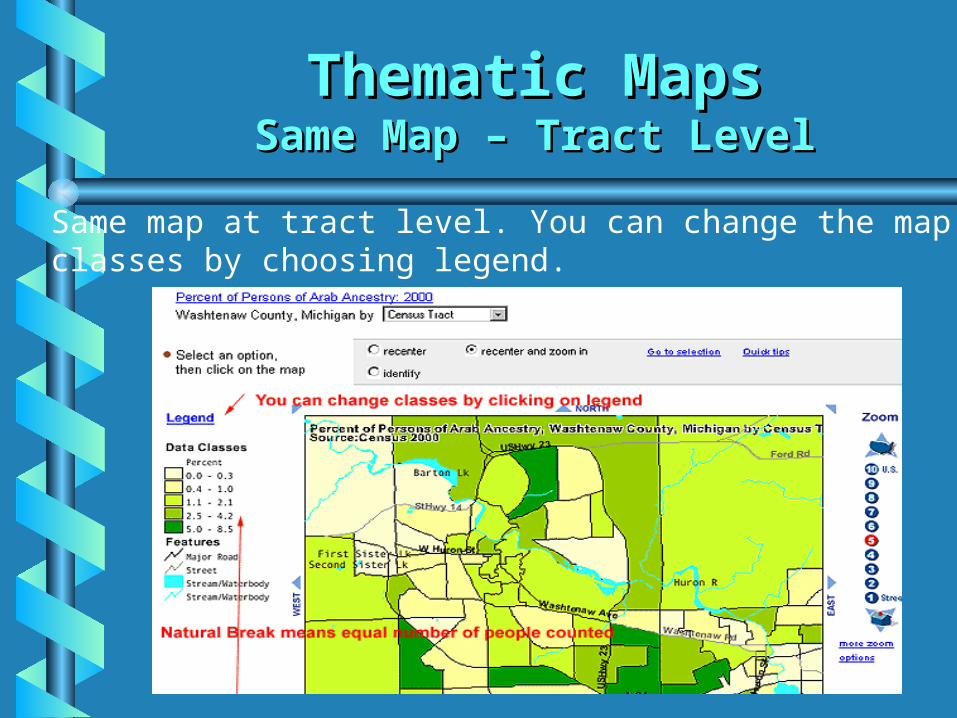
Thematic MapsThematic MapsSame Map – Tract LevelSame Map – Tract Level
Same map at tract level. You can change the map classes by choosing legend.

Thematic MapsThematic MapsSame Map – Tract LevelSame Map – Tract Level
Natural breaks = equal number of people counted
Equal interval means equal percent intervals

Thematic MapsThematic MapsSame Map – Tract LevelSame Map – Tract Level
This is probably more accurage. Click on legend to add geographic boundaries

Thematic MapsThematic MapsSame Map – Tract LevelSame Map – Tract Level
Click on legend to add geographic boundaries

Thematic MapsThematic MapsSame Map – Tract LevelSame Map – Tract Level
Same map with tract numbers

Thematic MapsThematic MapsSame Map – Tract LevelSame Map – Tract Level
Use identify button and click on map to obtain data

Thematic MapsThematic MapsLimitations of Factfinder MapsLimitations of Factfinder Maps
Only pre-selected variables; not entire data set
Maps download as gifs (pictures); they cannot be exported into another program
Maps can not be manipulated, e.g. showing layers
Geolytics and ARCVIEW are alternatives

American Factfinder American Factfinder AdvantagesAdvantages
http://factfinder.census.gov
SF1-4 data sets
Custom tables option to choose parts of one table or mix tables
Address search for all geographic codes of one street address
Reference and thematic maps provide street boundaries and multiple geographic layers
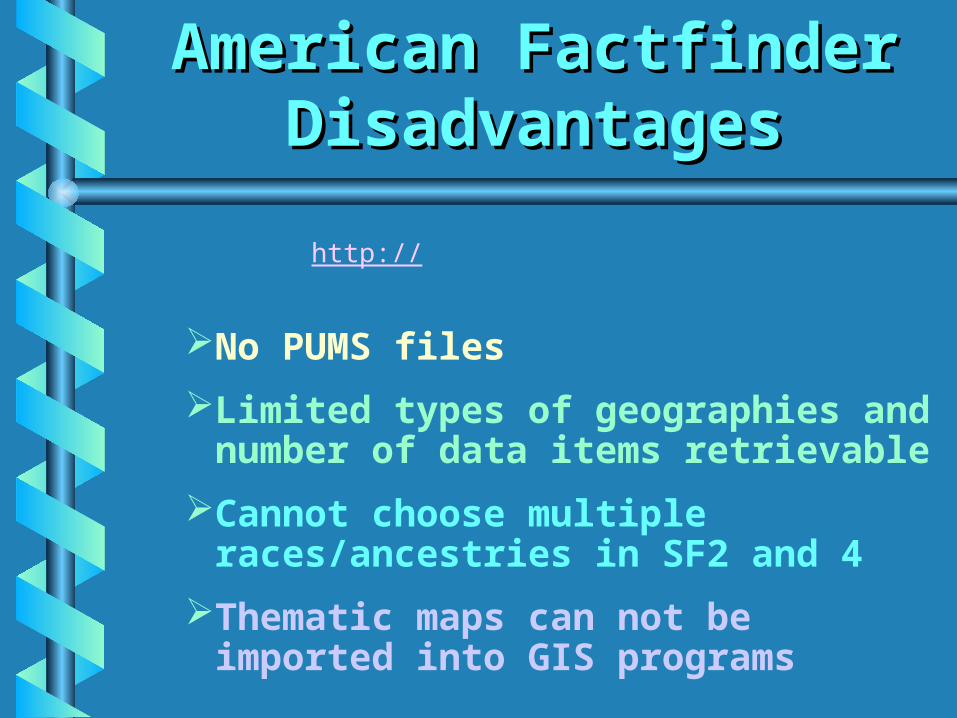
American Factfinder American Factfinder DisadvantagesDisadvantages
http://factfinder.census.gov
No PUMS files
Limited types of geographies and number of data items retrievable
Cannot choose multiple races/ancestries in SF2 and 4
Thematic maps can not be imported into GIS programs

CD/DVD Programs for CD/DVD Programs for Census 2000Census 2000
Two additional CD/DVD Two additional CD/DVD programs available in the programs available in the Documents CenterDocuments Center
• GO 2000 GO 2000 (Census Bureau)(Census Bureau)
• Census CD 2000 Census CD 2000 (Geolytics)(Geolytics)
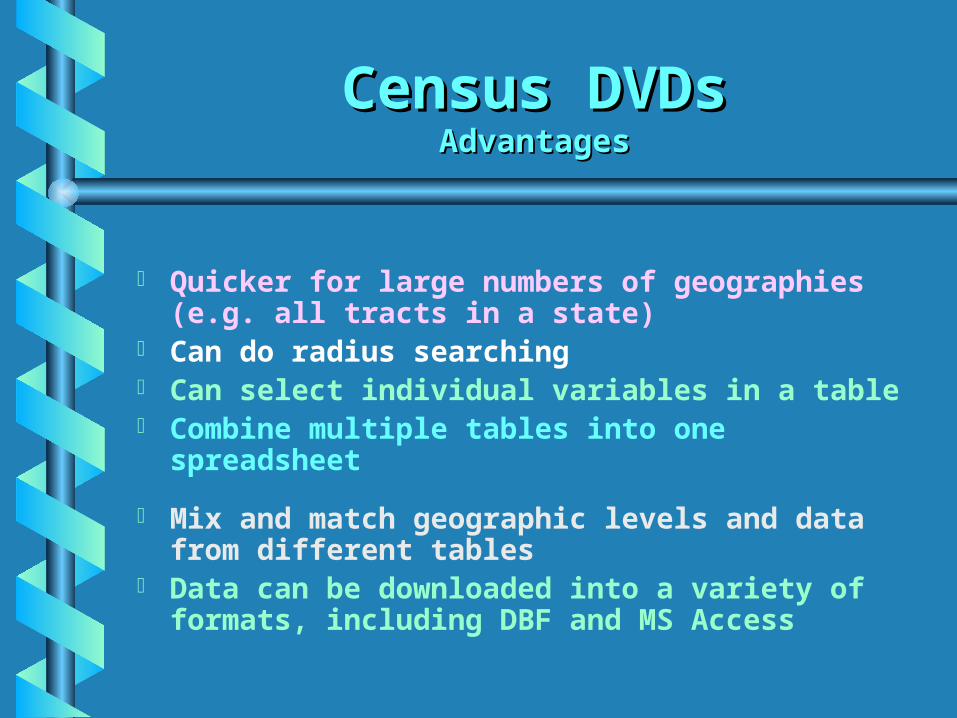
Census DVDsCensus DVDsAdvantagesAdvantages
Quicker for large numbers of geographies (e.g. all tracts in a state)
Can do radius searching Can select individual variables in a table Combine multiple tables into one
spreadsheet
Mix and match geographic levels and data from different tables
Data can be downloaded into a variety of formats, including DBF and MS Access

Census DVDsCensus DVDsDisadvantagesDisadvantages
No maps
Mathematical functions are laborious; use Excel instead
Not a substitute for ftp
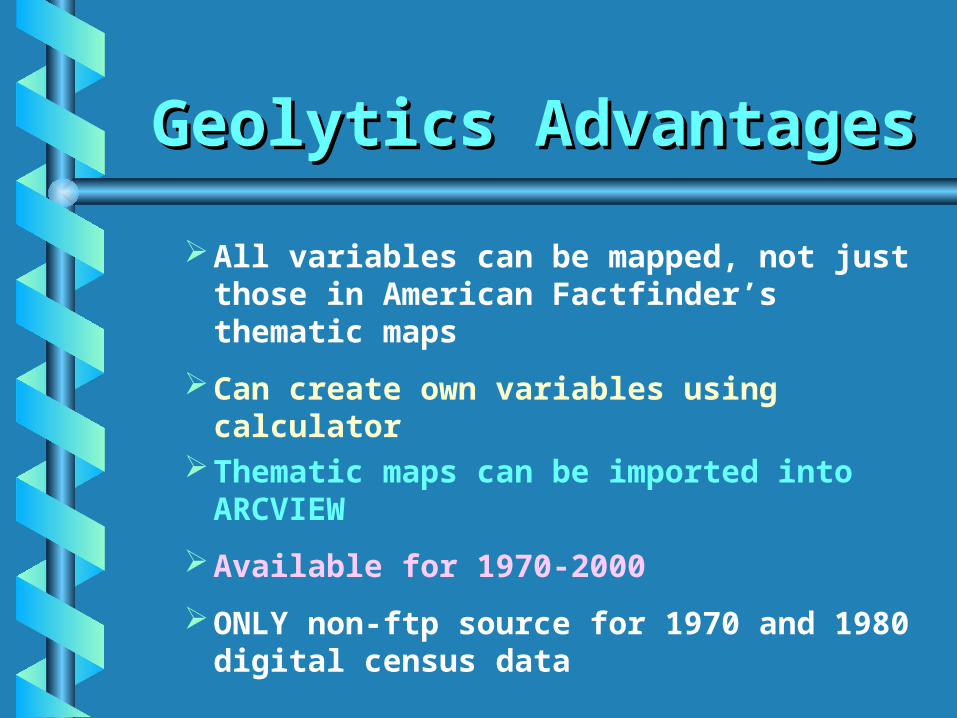
Geolytics AdvantagesGeolytics Advantages
All variables can be mapped, not just those in American Factfinder’s thematic maps
Can create own variables using calculator
Thematic maps can be imported into ARCVIEW
Available for 1970-2000
ONLY non-ftp source for 1970 and 1980 digital census data

Geolytics Geolytics DisadvantagesDisadvantages
No 100% data for 1990Limited number of geographic choices
(e.g. no tracts in a city, just county)
Maps do not show street boundaries
Retrieval options vary slightly between censuses
Neighborhood Change Database has been on order for 10 months

Geolytics CDs on Geolytics CDs on CampusCampus
CITRIX LAN• 1990 and 2000 Sample Data• http://www.lib.umich.edu/citrix/cens00.htmlhttp://www.lib.umich.edu/citrix/cens00.html• http://www.lib.umich.edu/citrix/census.htmlhttp://www.lib.umich.edu/citrix/census.html
Documents LAN
• 1970, 1980, 1990 and 2000 Sample Data• 2000 Redistricting Data (block)• 2000 100% Data (blocks and block groups)
Neighborhood Change (1970-2000) on order

Geolytics ExampleGeolytics ExampleName RequestName Request
Name file before you begin. In the Documents Center Name file before you begin. In the Documents Center use the X drive. On CITRIX, use your own drive.use the X drive. On CITRIX, use your own drive.
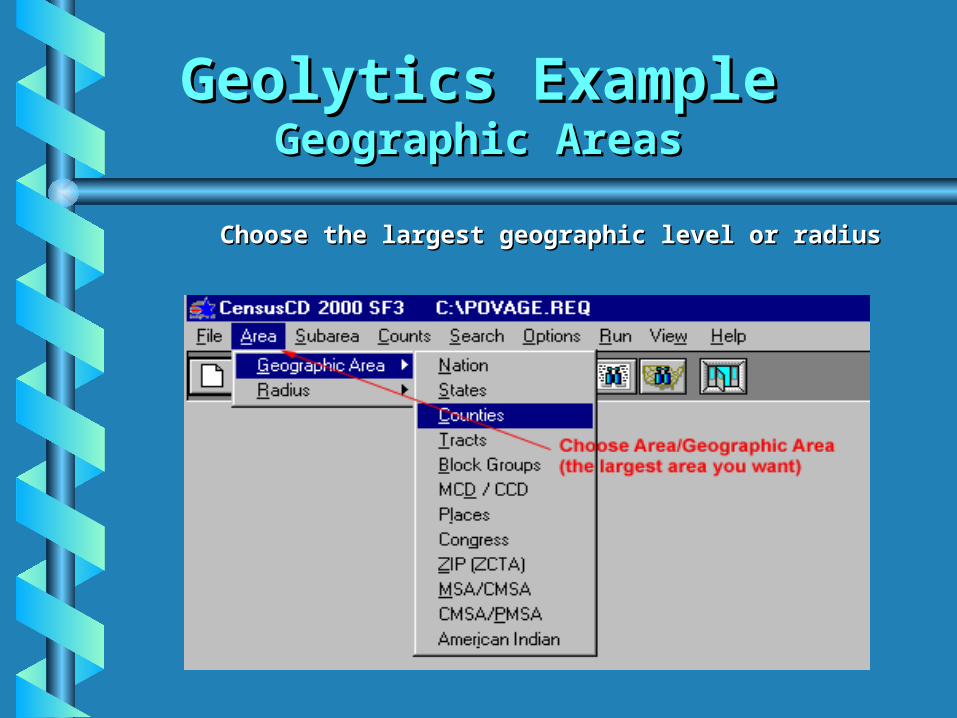
Geolytics ExampleGeolytics ExampleGeographic AreasGeographic Areas
Choose the largest geographic level or radiusChoose the largest geographic level or radius

Geolytics ExampleGeolytics ExampleGeographic AreasGeographic Areas
Choose state and area names

Geolytics ExampleGeolytics Example Subareas Subareas
Choose Subarea – in this case block groups in Wayne County, Michigan
Subareas vary with the main Area(Choices limited by comparison to Census DVD)

Geolytics ExampleGeolytics ExampleChoose Subjects or CountsChoose Subjects or Counts
Population 1 and Housing 1 to block group level
Population and Housing 2 to tract level

Geolytics ExampleGeolytics ExampleChoosing CountsChoosing Counts
You can choose multiple subjectsYou can choose multiple subjectsMove from top to bottom to right. Then click DONE.Move from top to bottom to right. Then click DONE.Example shows total population and number in poverty.Example shows total population and number in poverty.

Geolytics Example Geolytics Example Run QueryRun Query
Choose spreadsheet, data base, or map file.Choose spreadsheet, data base, or map file.

Geolytics Example Geolytics Example SpreadsheetSpreadsheet
Spreadsheet. It was automatically saved when you named your request file. Use Technical Documentation to interpret column headings. You could use FORMULA to create new column. Close this window before mapping.

Geolytics Example Geolytics Example MapMap
Map. Toggle variable to change map between variables.

Geolytics Example Geolytics Example Identifying Data in MapIdentifying Data in Map
You can click on area to view its data

Geolytics Example Geolytics Example Create Your Own VariableCreate Your Own Variable
Click on calculator. Divide people in poverty by total population and multiply by 100 to determine percent
in poverty.
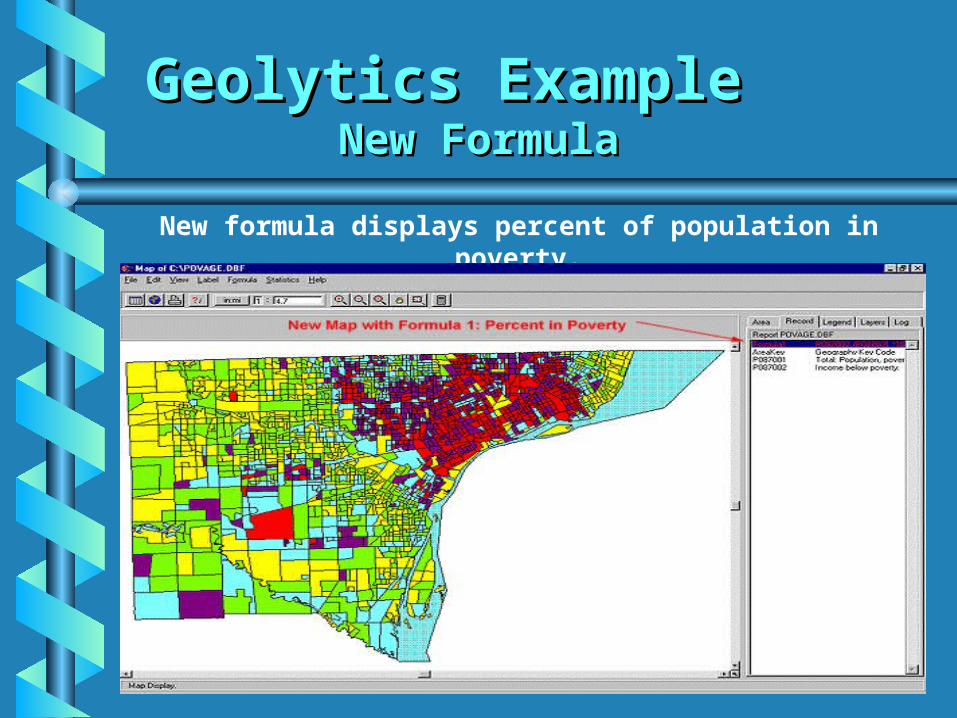
Geolytics Example Geolytics Example New FormulaNew Formula
New formula displays percent of population in poverty.

Geolytics Example Geolytics Example Map ClassesMap Classes
You can change the categories and classes on the right

Geolytics Example Geolytics Example Copying Files for ArcviewCopying Files for Arcview
Click on VIEW; then uncheck the WATER category

Geolytics Example Geolytics Example Copying Files for ArcviewCopying Files for Arcview
File – Export to copy your map for Arcview.
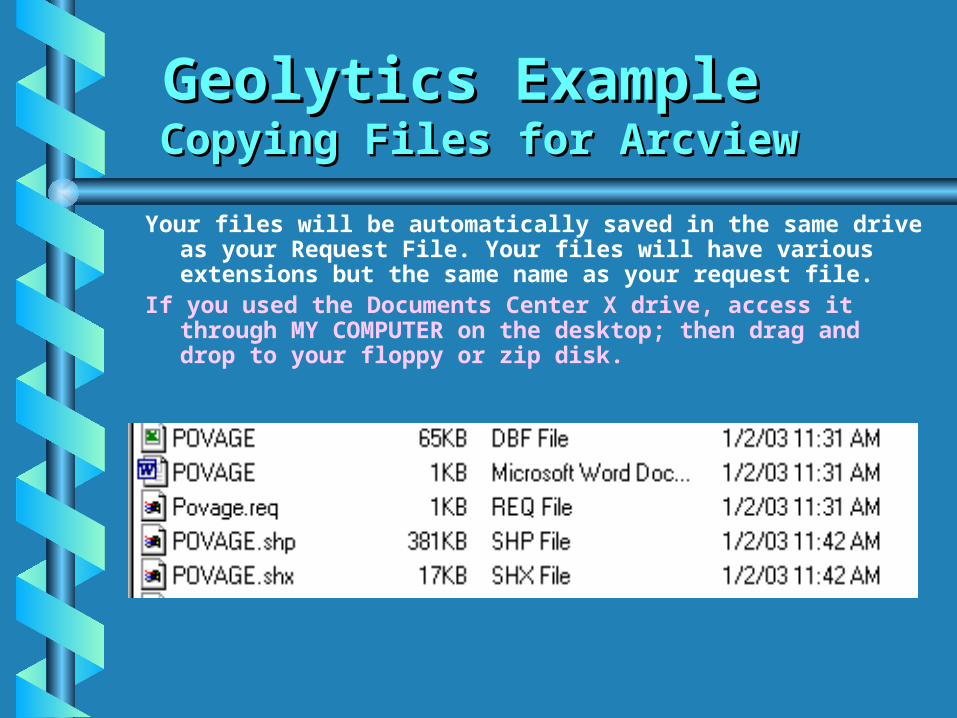
Geolytics Example Geolytics Example Copying Files for ArcviewCopying Files for Arcview
Your files will be automatically saved in the same drive as your Request File. Your files will have various extensions but the same name as your request file.
If you used the Documents Center X drive, access it through MY COMPUTER on the desktop; then drag and drop to your floppy or zip disk.

Converting Geographic Converting Geographic CodesCodes
Use the Mable Geocorr 2K Search Engine to relate five digit zip codes
to counties or census tracts
http://mcdc2.missouri.edu/websas/geocorr2k.html

Converting Geographic Converting Geographic CodesCodes

Converting Geographic Converting Geographic CodesCodes

Converting Geographic Converting Geographic CodesCodes

Converting Geographic Converting Geographic CodesCodes

Did the Census Bureau ask the question?How was the question asked?Is the geography the same?What formats are available?
Questions to Ask Questions to Ask Before Starting a Before Starting a Time SeriesTime Series
Reflects changes in society
In 1990 and 2000 Congress wanted to reduce paperwork
Grid of questions, 1790-2000http://www.lib.umich.edu/govdocs/census2/censubj.pdf
Census Questions Census Questions Vary Over Time Vary Over Time

Ancestry first asked in 1980Poverty was first determined in 1970Marital status and house value switched from 100% to sample questionnaire in 2000Dilapidated housing last measured in 1960
Census Questions Census Questions Vary Over Time Vary Over Time

Before 1980, Hispanic was called Spanish-originRaces in 1960 were white, Negro and otherMultiple races new in 2000Asian and Hawaiian in 2000 were same category in 1990
Census Racial Census Racial Definitions Vary Over Definitions Vary Over Time Time

Did 25 Ann Arborites and 122 Hawaiians take the subway to work in 2000?
“How did the person get to work LAST WEEK?”
How Was Question Asked?

Technical Documentation in 1990.
Printed Census Volumes through 1990.
Measuring Americahttp://www.census.gov/dmd/www/pdf/d02p.pdf
Questionnaires

Metropolitan Areas Change Detroit: 1970 - 3 counties
1980 - 6 counties 1990 - 7 counties 2000 - 6 counties
http://www.census.gov/population/www/estimates/metrodef.html
Is the Geography the Same?
Census Tracts, Block Groups, and Block Numbers Change
Census Tract equivalencies in paper tract reports through 1990
Relationship files, 1990-2000http://www.census.gov/geo/www/relate/rel_blk.htmlhttp://www.census.gov/geo/www/relate/rel_tract.html
Is the Geography the Same?
Different definitions or urban and urbanized area
Block group data on tape but not generally available until 1990
Census tracts limited to metro areas until 1990
Is the Geography the Same?
Primary vehicle through 1980 was PAPER
(Grad Stacks HA 201 .year with backup on microfiche/film in Documents)
1990 a combination of paper and CD; not all files on American Factfinder
No paper in 2000
1970-80 Geolytics are only good CDS for period
Census Formats
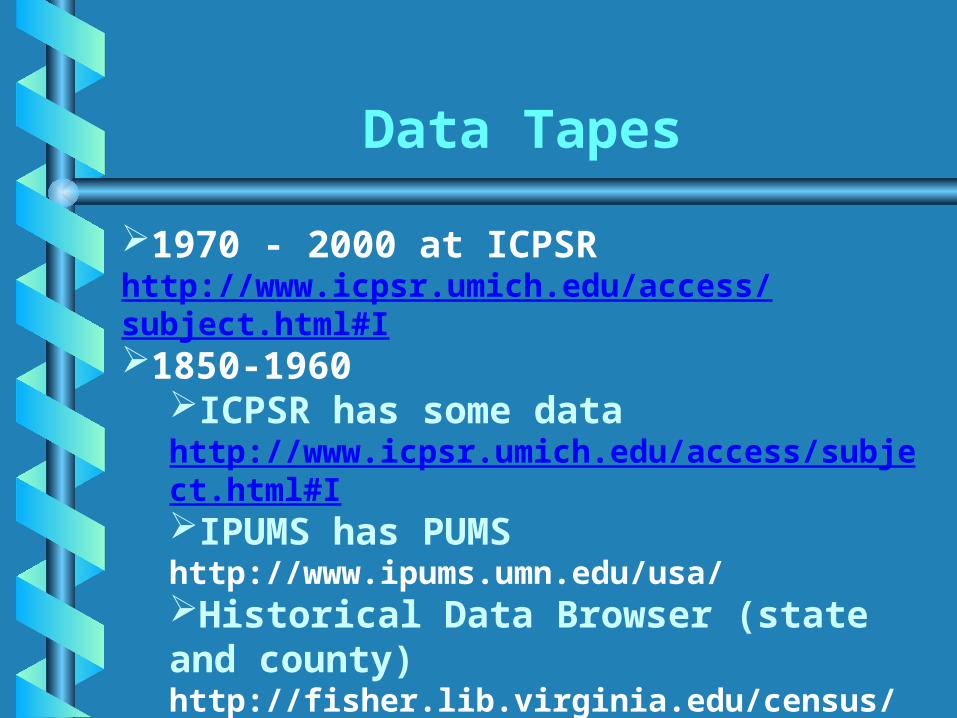
1970 - 2000 at ICPSRhttp://www.icpsr.umich.edu/access/subject.html#I1850-1960
ICPSR has some datahttp://www.icpsr.umich.edu/access/subject.html#IIPUMS has PUMShttp://www.ipums.umn.edu/usa/Historical Data Browser (state and county)http://fisher.lib.virginia.edu/census/
Data Tapes

Citing Census DataCiting Census Data
Census BureauCensus Bureauhttp://www.census.gov/main/www/http://www.census.gov/main/www/
citation.htmlcitation.html
APA Style - PurdueAPA Style - Purduehttp://owl.english.purdue.edu/handouts/http://owl.english.purdue.edu/handouts/
research/r_apa.htmlresearch/r_apa.html
Government Documents - Univ. of Government Documents - Univ. of MemphisMemphis
http://exlibris.memphis.edu/govpubs/http://exlibris.memphis.edu/govpubs/citeweb.htmciteweb.htm

Getting Census HelpGetting Census Help
Documents Center 203 Hatcher Library North, (734) 764-0410,
[email protected]://www.lib.umich.edu/govdocs/
Campus representative to the Census Bureau’s State Data Center program.
Assistance with American Factfinder, Census CD-ROMS.Paper tract maps of Michigan.
Referrals to other sources. Census 2000 web pagehttp://www.lib.umich.edu/govdocs/census2/
centool.pdf
Getting Census HelpGetting Census Help
Map Library 825 Hatcher Library South, (734) 764-0407
[email protected]://www.lib.umich.edu/maplib
Experts in ArcView for the creation of Census maps
Assistance in importing your own data to a Census map
Downloads of boundary files

Getting Census HelpGetting Census Help
Numeric Data Services 818 Hatcher Library North, (734) 615-7419
[email protected]://www.lib.umich.edu/nsds/
Assists users in locating and downloading untabulated statistical data for manipulation with programs such as SAS, SPSS
Referrals for data manipulation
Getting Census HelpGetting Census Help
Population Studies Center 311 Maynard Street, (734) 998-7153
[email protected]://www.psc.isr.umich.edu/dads/
Assists University of Michigan students and staff
Answers common problem and error questions with Census files
Handles common data manipulation questions with a variety of statistical packages