Embed Size (px)
Citation preview

&
ppic statewide survey
Californians Mark Baldassare
Dean Bonner
David Kordus
Lunna Lopes
supported with funding from
The James Irvine Foundation
CONTENTS
About the Survey 2
Press Release 3
State Election Policy Landscape 6
National Election Policy Landscape 15
Regional Map 22
Methodology 23
Questionnaire and Results 25
their government
D E C E M B E R 2 0 1 5

December 2015 Californians and Their Government 2
ABOUT THE SURVEY
The PPIC Statewide Survey provides policymakers, the media, and the public with objective, advocacy-free information on the perceptions, opinions, and public policy preferences of California residents. This is the 153rd PPIC Statewide Survey in a series that was inaugurated in April 1998 and has generated a database of responses from more than 318,000 Californians.
This is the 69th in the Californians and Their Government series. The survey is conducted periodically to examine the social, economic, and political trends that influence public policy preferences and ballot choices. Supported with funding from The James Irvine Foundation, the series seeks to inform decisionmakers, raise public awareness, and stimulate policy discussion and debate about important state and national issues.
This survey was conducted as the political campaigns for the 2016 elections continued to gather steam. In addition to selecting a new U.S. Senator, California voters are likely to see a number of initiatives on the state ballot. Issues such as marijuana legalization, the minimum wage, a state school bond, and extending the Proposition 30 tax increases are currently making their way through the state’s initiative process. In the wake of signing new state legislation, Governor Brown is attending the United Nations climate change conference in Paris. Looking forward to January, Governor Brown will release his budget for the new year. Nationally, the presidential primary campaigns are in full swing, with both parties holding primary debates. The 2016 presidential race has drawn attention to issues of income inequality, and debate continues on the impact of the Affordable Care Act and immigration reform. Notably, the terrorist attacks in Paris occurred during the interview period for this survey.
The survey presents the responses of 1,703 adult residents throughout California, interviewed in English or Spanish by landline or cell phone. It includes findings on the following topics:
State election policy landscape, including approval ratings of elected officials; overall outlook; income inequality; opinions on the state budget situation and taxes, including an extension of Proposition 30 taxes; attitudes toward global warming; views on the initiative process; views on health care policy; and perceptions of issues that are likely to be on the November 2016 ballot.
Federal election policy landsacape, including approval ratings of federal elected officials; satisfaction with the 2016 presidential candiates; views on the upcoming 2016 congressional elections; political party preferences on policy issues; favorability toward political parties; and attitudes toward voting and voter participation.
Time trends, national comparisons, and the extent to which Californians may differ in their perceptions, attitudes, and preferences regarding state and federal government based on political party affiliation, likelihood of voting, region of residence, race/ethnicity, and other demographics.
This report may be downloaded free of charge from our website (www.ppic.org). If you have questions about the survey, please contact [email protected]. Try our PPIC Statewide Survey interactive tools online at www.ppic.org/main/survAdvancedSearch.asp.
December 2015 Californians and Their Government 3
PPIC
Statewide
Survey
CONTACT
Linda Strean 415-291-4412
Serina Correa 415-291-4417
NEWS RELEASE
EMBARGOED: Do not publish or broadcast until 9:00 p.m. PST on Wednesday, December 2, 2015.
Para ver este comunicado de prensa en español, por favor visite nuestra página de internet: http://www.ppic.org/main/pressreleaseindex.asp
PPIC STATEWIDE SURVEY: CALIFORNIANS AND THEIR GOVERNMENT
Californians’ Concern about Climate Change Stands Out—in U.S., World FEW WORRY THAT STATE ACTIONS TO CURB WARMING THREATEN JOBS
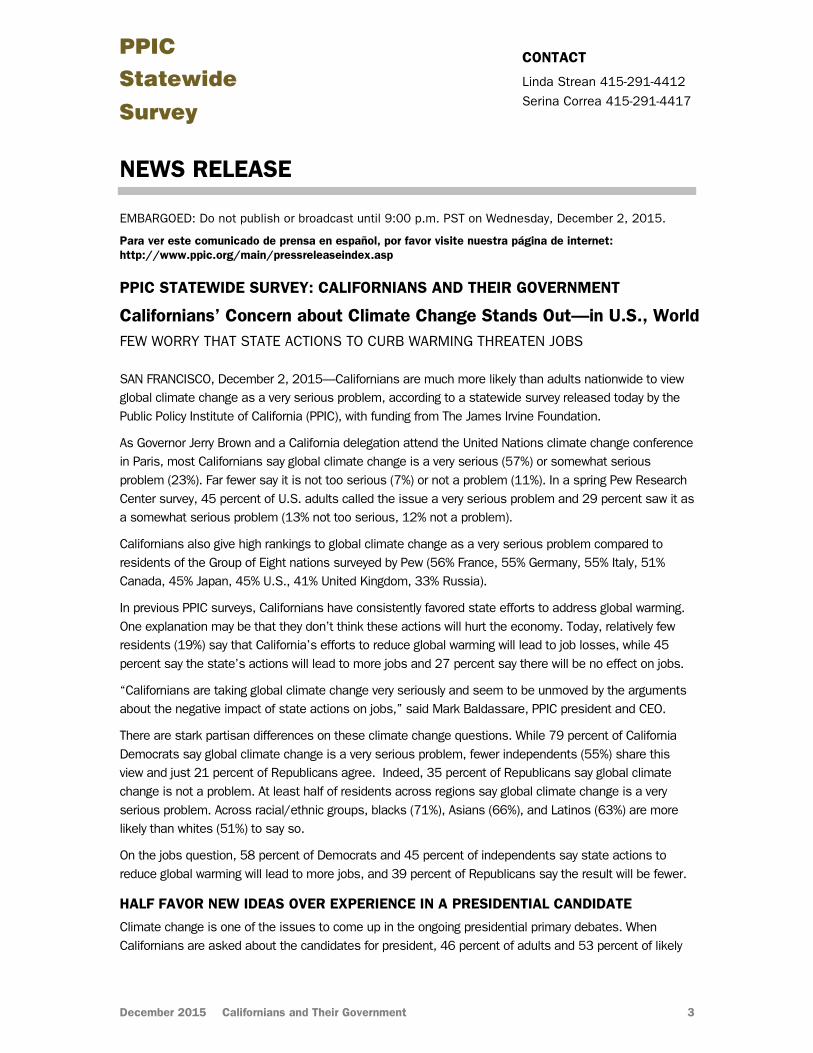
SAN FRANCISCO, December 2, 2015—Californians are much more likely than adults nationwide to view global climate change as a very serious problem, according to a statewide survey released today by the Public Policy Institute of California (PPIC), with funding from The James Irvine Foundation.
As Governor Jerry Brown and a California delegation attend the United Nations climate change conference in Paris, most Californians say global climate change is a very serious (57%) or somewhat serious problem (23%). Far fewer say it is not too serious (7%) or not a problem (11%). In a spring Pew Research Center survey, 45 percent of U.S. adults called the issue a very serious problem and 29 percent saw it as a somewhat serious problem (13% not too serious, 12% not a problem).
Californians also give high rankings to global climate change as a very serious problem compared to residents of the Group of Eight nations surveyed by Pew (56% France, 55% Germany, 55% Italy, 51% Canada, 45% Japan, 45% U.S., 41% United Kingdom, 33% Russia).
In previous PPIC surveys, Californians have consistently favored state efforts to address global warming. One explanation may be that they don’t think these actions will hurt the economy. Today, relatively few residents (19%) say that California’s efforts to reduce global warming will lead to job losses, while 45 percent say the state’s actions will lead to more jobs and 27 percent say there will be no effect on jobs.
“Californians are taking global climate change very seriously and seem to be unmoved by the arguments about the negative impact of state actions on jobs,” said Mark Baldassare, PPIC president and CEO.
There are stark partisan differences on these climate change questions. While 79 percent of California Democrats say global climate change is a very serious problem, fewer independents (55%) share this view and just 21 percent of Republicans agree. Indeed, 35 percent of Republicans say global climate change is not a problem. At least half of residents across regions say global climate change is a very serious problem. Across racial/ethnic groups, blacks (71%), Asians (66%), and Latinos (63%) are more likely than whites (51%) to say so.
On the jobs question, 58 percent of Democrats and 45 percent of independents say state actions to reduce global warming will lead to more jobs, and 39 percent of Republicans say the result will be fewer.
HALF FAVOR NEW IDEAS OVER EXPERIENCE IN A PRESIDENTIAL CANDIDATE
Climate change is one of the issues to come up in the ongoing presidential primary debates. When Californians are asked about the candidates for president, 46 percent of adults and 53 percent of likely

PPIC Statewide Survey
December 2015 Californians and Their Government 4
voters say they are satisfied with their choices. Republicans (58%) are slightly more likely than Democrats (51%) to be satisfied. A majority of independents (53%) are not satisfied (41% are satisfied).
Which attributes are more important in a presidential candidate? Half of Californians (51%) say that new ideas and a different approach are more important, while 41 percent say that experience and a proven track record are more important. Likely voters are divided, with 46 percent choosing new ideas and 44 percent choosing experience. A recent Pew Research Center poll found that 57 percent of adults nationwide say new ideas and a different approach are more important while 36 percent prioritize experience and a proven track record. There are notable partisan differences: 61 percent of Republicans and 54 percent of independents prefer new ideas, while 52 percent of Democrats prefer experience.
STRONG JOB APPROVAL RATINGS FOR BROWN, OBAMA
When asked to rate their elected leaders, 51 percent of adults and 54 percent of likely voters approve of Governor Brown’s job performance—similar to his rating after his reelection (54% adults, 57% likely voters in December 2014). The legislature’s approval rating is lower (41% adults, 38% likely voters).
President Obama’s job approval rating is 61 percent among all adults and 56 percent among likely voters. Congress fares far worse—26 percent among all adults and 14 percent among likely voters—in the survey, which was conducted after John Boehner resigned and Congressman Paul Ryan became Speaker of the House of Representatives.
“The high approval ratings of Governor Brown and President Obama set the tone for the 2016 election,” Baldassare said. “Many California likely voters are saying that in selecting a candidate, they value experience.”
When asked about upcoming congressional elections, Californians prefer that Congress be controlled by Democrats (52% adults, 49% likely voters) rather than by Republicans (32% adults, 36% likely voters).
Which party would do a better job handling key national issues? A majority of state residents (53%) say the Democrats would do a better job than the Republicans (31%) on health care. Californians also tend to think the Democrats would do a better job than Republicans on immigration (46% vs. 37%), the economy (45% vs. 41%), and the federal budget (44% vs. 38%).
Asked about their opinions of the major parties, 51 percent of adults have a favorable impression of the Democratic Party and 30 percent view the Republican Party favorably. Across racial/ethnic groups, half or more of Asians (52%), Latinos (64%), and blacks (69%) have a favorable impression of the Democratic Party, and solid majorities view the Republican Party unfavorably (61% Asians, 67% Latinos, 82% blacks). About half of whites have an unfavorable impression of both the Democratic (50%) and Republican (54%) parties. And 24 percent of residents view the Tea Party movement favorably.
WATER, DROUGHT IS TOP CONCERN—BUT JOBS, ECONOMY A CLOSE SECOND
As the state heads into an election year, Californians are most likely to name water and drought (27%) as the most important issue facing the state, followed closely by jobs and the economy (24%). State residents are less likely today to mention water and drought than they were in September (32%) and more likely to mention jobs and the economy (20%). Across regions, Orange/San Diego residents (34%) are the most likely to mention water and the drought, while Los Angeles residents are the most likely to mention jobs and the economy (29%). San Francisco Bay Area residents (16%) are the most likely to mention housing. Statewide, fewer than 10 percent of adults name any other issue.
“The issue of water and the drought seems to have peaked for the time being,” Baldassare said. “Concerns about the economy and housing costs are resurfacing.”

PPIC Statewide Survey
December 2015 Californians and Their Government 5
Half of residents (51%) and fewer likely voters (44%) say the state is generally going in the right direction. Asked for their views about the state’s economic direction, 48 percent of adults and 47 percent of likely voters say California will experience good economic times in the next 12 months.
HALF FAVOR HEALTH REFORM, SLIM MAJORITY WOULD COVER THE UNDOCUMENTED
The presidential race has also drawn attention to the issues of income inequality, health care reform, and immigration. The survey touches on these issues:
Income inequality. Most Californians (67%) say the state is divided into two economic groups, the haves and have-nots. Majorities across income groups, regions, age, education, and racial/ethnic groups hold this view. Asked to choose which of the two groups they are in, 40 percent of adults say they are in the haves and 44 percent say they are in the have-nots. About half of adults (51%) say the government should do more to make sure that all Californians have an equal opportunity to get ahead and 42 percent say that all Californians have an equal opportunity.
Health care reform. Half of Californians (51%) have a generally favorable opinion of the health reform law, the Affordable Care Act, while 42 percent view it unfavorably. Adults nationwide are more divided (42% favorable, 42% unfavorable), according to an October Kaiser Family Foundation survey.
Health care and undocumented immigrants. With California poised to extend health care coverage to some undocumented immigrant children, the PPIC survey asks about extending it to undocumented residents. A slim majority of Californians (54%) are in favor, while 42 percent are opposed. The findings are reversed for likely voters: 42 percent are in favor and 55 percent are opposed.
FEW SAY LEGALIZING MARIJUANA IS IMPORTANT
Most residents (65% adults, 62% likely voters) are satisfied with the way the initiative process is working. However, most (60% adults, 61% likely voters) agree that, in general, there are too many propositions on the state ballot. And more than half (55% adults, 66% likely voters) say special interests have a lot of control over the initiative process in the state. The survey asks about the importance of four potential ballot measures:
State bonds funding K–12 schools and community college facilities. Majorities (63% adults, 55% likely voters) view this as very important.
Increasing the state minimum wage. Most adults (57%) and about half of likely voters (49%) consider this very important.
Extending the Proposition 30 tax increases. Less than half of Californians (36% adults, 37% likely voters) say this is very important. In response to a separate question, 54 percent of adults and likely voters say they favor extending the tax increases.
Legalizing marijuana in California. Less than a third of residents (28% adults, 30% likely voters) consider this a very important issue. A plurality (32%) say it is not at all important.
REFORMS COULD LEAD TO INCREASED VOTER TURNOUT
Record-low voter turnout in the 2014 elections prompted renewed discussion of reforms to increase participation. A new law will provide automatic voter registration via the Department of Motor Vehicles. The survey finds that 71 percent of citizens who are not registered to vote say they are either very likely or somewhat likely to vote if they are automatically registered when using the DMV.
Under a proposed reform, each registered voter would automatically receive a mail ballot, which could be turned in by mail or in person. An overwhelming majority of registered voters who do not always vote (88%) say they are very or somewhat likely to vote if they automatically receive a ballot. Asked about the importance of their vote, 75 percent Californians agree with the statement that “voting gives people like me some say in what the government does.” Majorities across parties, age, education, and income groups agree. Among racial/ethnic groups, blacks (37%) are most likely to disagree with the statement.

December 2015 Californians and their Government 6
STATE ELECTION POLICY LANDSCAPE
KEY FINDINGS
Half of Californians approve of Governor Brown’s job performance. Forty-one percent approve of how the California Legislature is handling its job. (page 7)
Californians name water and the economy as the most important issues in the state. Half of residents say the state is heading in the right direction. (page 8)
Two in three Californians say the state is divided into haves and have-nots. Forty percent of residents say they are in the haves. (page 9)
Less than half of residents (45%) say the state budget situation is a big problem. Just over half of adults and likely voters favor extending the Proposition 30 tax increases. (page 10)
Californians are more likely than adults nationwide to say that global climate change is a very serious problem. A plurality (45%) say that there will be more jobs around the state if California does things to address global warming. (page 11)
Half of adults have a favorable view of the health care reform law, while 42 percent have an unfavorable view. Slightly more than half of Californians favor providing health care coverage to undocumented immigrants. (page 12)
More than six in 10 adults and likely voters are satisfied with the state’s initiative process. Yet majorities of adults and likely voters say special interests have a lot of control over the process. (page 13)
Fewer than three in 10 Californians say legalizing marijuana is very important, while a majority (63%) say the state bonds for schools are very important. (page 14)
51
41
0
20
40
60
80
Dec 11 Dec 12 Dec 13 Dec 14 Dec 15
Per
cent
all
adul
ts
Governor Brown
California Legislature
Approval Ratings of State Elected Officials
5861
53 5255
0
20
40
60
80
CentralValley
SF BayArea
LosAngeles
Orange/San
Diego
InlandEmpire
Per
cent
Support for Extending Proposition 30 Taxes
57
45
0
20
40
60
80
Californians Adults nationwide*
Per
cent
Perception of Global Climate Change as a Very Serious Problem
*Pew Research Center, spring 2015

PPIC Statewide Survey
December 2015 Californians and their Government 7
APPROVAL RATINGS OF STATE ELECTED OFFICIALS
Fifty-one percent of adults and 54 percent of likely voters approve of the way Jerry Brown is handling his job as California’s governor. The governor’s approval rating was similar in September (52% adults, 55% likely voters) and last December, after his reelection (54% adults, 57% likely voters). Today, approval is far higher among Democrats (71%) than among independents (52%) and Republicans (27%). Approval is higher in the San Francisco Bay Area (62%) than in other regions. Majorities of blacks (64%), Latinos (54%), and Asians (52%), along with 48 percent of whites, approve of the governor’s job performance.
“Overall, do you approve or disapprove of the way that Jerry Brown is handling his job as governor of California?”
Approve Disapprove Don't know
All adults 51% 29% 20%
All likely voters 54 35 11
Party
Democrats 71 14 15
Republicans 27 61 11
Independents 52 34 15
Region
Central Valley 40 40 20
San Francisco Bay Area 62 19 19
Los Angeles 55 26 19
Orange/San Diego 52 28 20
Inland Empire 44 36 20
Forty-one percent of adults and 38 percent of likely voters approve of the way the California Legislature is handling its job. Approval of the legislature was at 45 percent among adults and 39 percent among likely voters in September, and was similar to our current findings in last December’s survey (41% adults, 39% likely voters). Democrats (52%) are more likely than independents (34%) and Republicans (18%) to approve of the legislature today. Across regions, Los Angeles (46%) and San Francisco Bay Area residents (44%) are more likely than others to approve of the legislature. The legislature’s approval rating is higher among Asians (51%), blacks (51%), and Latinos (47%) than among whites (34%).
“Overall, do you approve or disapprove of the way that the California Legislature is handling its job?”
Approve Disapprove Don't know
All adults 41% 40% 19%
All likely voters 38 48 14
Party
Democrats 52 30 18
Republicans 18 73 9
Independents 34 48 17
Region
Central Valley 35 44 21
San Francisco Bay Area 44 36 20
Los Angeles 46 38 16
Orange/San Diego 40 40 20
Inland Empire 39 47 14

PPIC Statewide Survey
December 2015 Californians and their Government 8
OVERALL MOOD
Californians name water and the drought (27%) and jobs and the economy (24%) as the most important issues facing the state. Water and the drought (32%) was mentioned more often than jobs and the economy (20%) in September, while jobs and the economy (29%) led water and the drought (23%) last December. Across regions, Orange/San Diego residents (34%) are the most likely to mention water and the drought, while Los Angeles residents are the most likely to mention jobs and the economy (29%). Democrats and independents (30% each) are more likely than Republicans (16%) to mention water and the drought while partisan groups make similar mention of jobs and the economy (24% Democrats, 20% Republicans, 24% independents). Residents in the San Francisco Bay Area are the most likely to mention housing as the most important issue. Statewide, less than one in 10 adults name other issues—such as immigration, the state budget, education and schools, and housing—as the most important issue.
“Thinking about the state as a whole, what do you think is the most important issue facing people in California today?”
Top five issues mentioned
All adults Region Likely
voters Central Valley
San Francisco Bay Area
Los Angeles
Orange/ San Diego
Inland Empire
Water, drought 27% 25% 28% 23% 34% 20% 27%
Jobs, economy 24 24 17 29 24 22 21
Immigration, illegal immigration 6 7 5 6 5 10 8
Housing costs, housing availability 5 1 16 4 3 2 4
State budget, deficit, state spending 5 3 3 4 6 7 6
When it comes to the state of the state, 51 percent of Californians and 44 percent of likely voters say things in California are going in the right direction. Positive perceptions were similar in September (48% adults, 43% likely voters) and last December (50% adults, 47% likely voters). Today, Democrats (64%) are more likely to have positive views than independents (39%) and Republicans (19%). Across regions, Los Angeles residents (60%) are the most likely to have positive views of the state. Younger adults are more likely to say things are going in the right direction (67% age 18 to 34, 45% age 35 to 54, 40% age 55 and older).
“Do you think things in California are generally going in the right direction or the wrong direction?”
All adults
Region Likely voters Central
Valley San Francisco
Bay Area Los
Angeles Orange/
San Diego Inland Empire
Right direction 51% 39% 53% 60% 54% 41% 44%
Wrong direction 43 55 39 33 43 55 50
Don't know 6 6 8 8 4 3 6
Similarly, 48 percent of Californians and 47 percent of likely voters think that the state will experience good economic times in the next 12 months. Optimistic views of the economy were similar in September (48% adults, 46% likely voters) and last December (52% adults, 51% likely voters). Today, Democrats (60%) are much more likely than independents (42%) and Republicans (28%) to expect good times. Optimism is higher in the San Francisco Bay Area (55%), Orange/San Diego (55%), and Los Angeles (54%) than in the Inland Empire (44%) and the Central Valley (38%). A majority of those with annual household incomes of $80,000 or more (54%) expect that California will experience good economic times in the next 12 months, while fewer than half of Californians with incomes under $40,000 (46%) say the same.

PPIC Statewide Survey
December 2015 Californians and their Government 9
INCOME INEQUALITY IN CALIFORNIA
Sixty-seven percent of Californians say that the state is divided into two economic groups, the haves and have-nots. Last December, a similar 68 percent said the state was divided this way. Today, solid majorities across income groups (68% under $40,000, 62% $40,000 to under $80,000, 69% $80,000 or more) and renters (71%) and homeowners (63%) hold this view. Majorities across the state’s regions, age, education, and racial/ethnic groups hold this view of California. Democrats (74%) and independents (70%) are much more likely than Republicans (52%) to say that the state is divided into haves and have nots.
“Some people think that California is divided into economic groups, the haves and have-nots, while others think it is not divided that way. Do you think that California is divided into
haves and have-nots, or do you think that California is not divided that way?”
All adults
Household income Race/Ethnicity
Under $40,000
$40,000 to under $80,000
$80,000 or more
Asians Blacks Latinos Whites
Divided into haves and have-nots
67% 68% 62% 69% 66% 83% 67% 65%
Not divided this way
29 28 32 28 28 11 30 31
Don’t know 5 4 7 4 6 5 3 5
When asked to choose which of two economic groups they are in, 40 percent of Californians say they are in the “haves.” The same share (40%) said they were in this group last December. Today, those with incomes under $40,000 (24%) are far less likely than those with higher incomes (45% $40,000 to under $80,000, 65% $80,000 or more) to say they are in the haves. Across racial/ethnic groups, blacks (22%) and Latinos (24%) are less likely than Asians (49%) and whites (52%) to say they are in the haves. Homeowners (48%) are more likely than renters (33%) and college graduates (56%) are more likely than those with less education (45% some college, 25% high school or less) to say they are in the haves. Across regions, San Francisco Bay Area residents (54%) are the most likely to say they are in the haves (43% Orange/San Diego, 39% Inland Empire, 33% Central Valley, 33% Los Angeles). Republicans (56%) are more likely than Democrats (44%) or independents (36%) to say they are in the haves.
“If you had to choose, which of these groups are you in—the haves or have-nots?”
All adults
Household income Race/Ethnicity
Under $40,000
$40,000 to under $80,000
$80,000 or more
Asians Blacks Latinos Whites
Haves 40% 24% 45% 65% 49% 22% 24% 52%
Have-nots 44 63 37 19 33 69 62 31
Neither (volunteered)
12 10 12 12 9 8 11 14
Don’t know 5 3 6 5 9 1 4 4
Fifty-one percent of adults say the government should do more to make sure that all Californians have an equal opportunity to get ahead, while 41 percent say that all Californians have an equal opportunity to get ahead. Last December, a similar 52 percent said the government should do more. Today, Democrats (63%) are more likely than independents (48%) and far more likely than Republicans (28%) to say the government should do more. Across racial/ethnic groups, blacks (63%) and Latinos (57%) are more likely than whites (48%) and Asians (43%) to say the government should do more. The perception that the government should do more to make sure that all Californians have an equal opportunity to get ahead is more common among renters (58%) than homeowners (45%), among adults younger than age 55 (55%), and among those with a household income under $40,000 (62%).

PPIC Statewide Survey
December 2015 Californians and their Government 10
STATE SPENDING AND TAXES
Forty-five percent of California adults and half of likely voters (50%) say that the state budget situation is a big problem today. Negative perceptions of the state budget were at 51 percent for adults and 55 percent for likely voters last December. In May 2010, the perception that the budget is a big problem reached a record high of 81 percent. Today, Republicans (74%) are much more likely than independents (48%) and Democrats (43%) to say the state budget situation is a big problem. The perception that the budget is a big problem is lower in the San Francisco Bay Area (36%) than in other regions of the state.
“Next, do you think the state budget situation in California—that is, the balance between government spending and revenues—is a big problem, somewhat of a problem,
or not a problem for the people of California today?”
All adults
Party Likely voters
Dem Rep Ind
Big problem 45% 43% 74% 48% 50%
Somewhat of a problem 36 42 20 38 35
Not a problem 11 11 4 9 10
Don't know 8 5 3 5 6
Fewer than half of adults (48%) and likely voters (45%) say they would rather pay higher taxes and have a state government that provides more services. Last December, the preference for higher taxes and more services was similar (50% adults, 45% likely voters). Today, Democrats (66%) are more likely than independents (41%) and Republicans (19%) to hold this view. The preference for higher taxes and more services is less common among older, college-educated, and more-affluent Californians.
“In general, which of the following statements do you agree with more—I’d rather pay higher taxes and have a state government that provides more services,
or I’d rather pay lower taxes and have a state government that provides fewer services?”
All adults
Party Likely voters
Dem Rep Ind
Higher taxes and more services
48% 66% 19% 41% 45%
Lower taxes and fewer services
45 27 77 52 48
Don't know 7 7 4 6 7
Fifty-four percent of Californians and likely voters are in favor of extending the Proposition 30 tax increases passed in November 2012. Results were similar in September (55% adults, 49% likely voters) and last December (53% adults, 52% likely voters). Currently, Democrats (69%) are far more likely than independents (48%) and Republicans (24%) to be in favor. Majorities across regions are in favor, while support declines with age (65% age 18 to 34, 55% age 35 to 54, 44% age 55 and older).
“As you may know, voters passed Proposition 30 in November 2012. It increased taxes on earnings over $250,000 for seven years and sales taxes by one quarter cent for four years,
to fund schools and guarantee public safety realignment funding. Do you favor or oppose extending the Proposition 30 tax increases which are set to fully expire in 2018?”
All adults
Party Likely voters
Dem Rep Ind
Favor 54% 69% 24% 48% 54%
Oppose 38 25 71 46 41
Don't know 7 6 6 5 5
PPIC Statewide Survey
December 2015 Californians and their Government 11
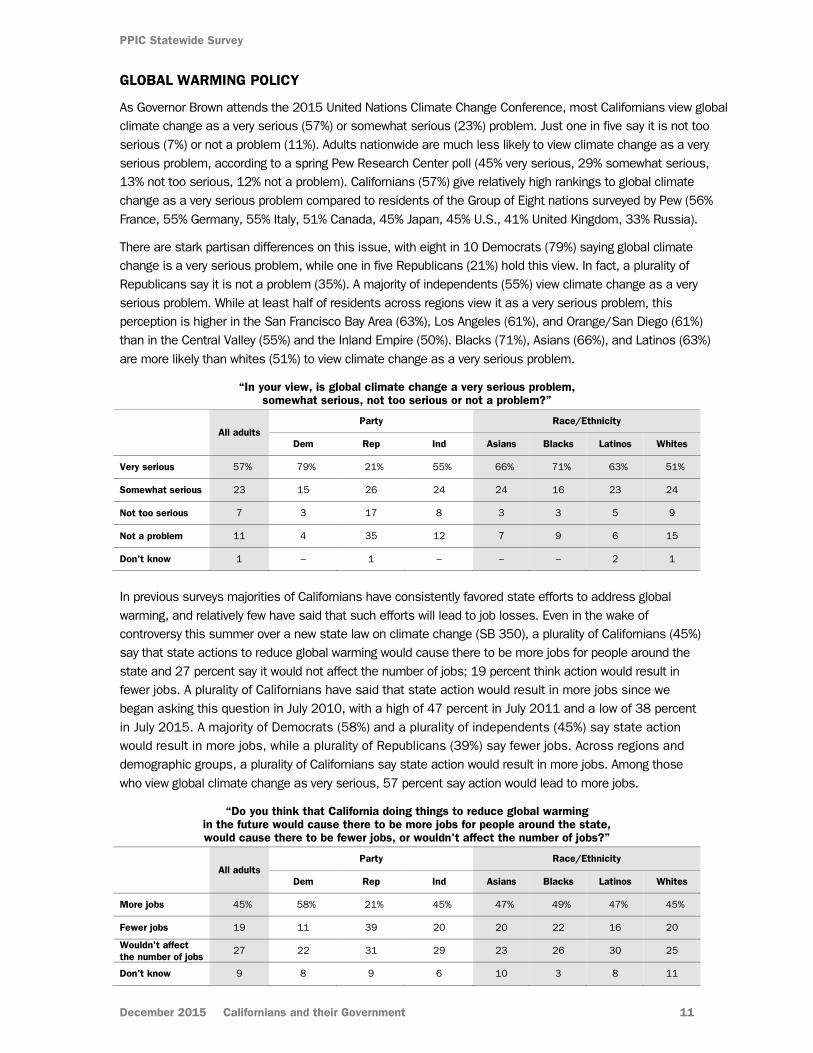
GLOBAL WARMING POLICY
As Governor Brown attends the 2015 United Nations Climate Change Conference, most Californians view global climate change as a very serious (57%) or somewhat serious (23%) problem. Just one in five say it is not too serious (7%) or not a problem (11%). Adults nationwide are much less likely to view climate change as a very serious problem, according to a spring Pew Research Center poll (45% very serious, 29% somewhat serious, 13% not too serious, 12% not a problem). Californians (57%) give relatively high rankings to global climate change as a very serious problem compared to residents of the Group of Eight nations surveyed by Pew (56% France, 55% Germany, 55% Italy, 51% Canada, 45% Japan, 45% U.S., 41% United Kingdom, 33% Russia).
There are stark partisan differences on this issue, with eight in 10 Democrats (79%) saying global climate change is a very serious problem, while one in five Republicans (21%) hold this view. In fact, a plurality of Republicans say it is not a problem (35%). A majority of independents (55%) view climate change as a very serious problem. While at least half of residents across regions view it as a very serious problem, this perception is higher in the San Francisco Bay Area (63%), Los Angeles (61%), and Orange/San Diego (61%) than in the Central Valley (55%) and the Inland Empire (50%). Blacks (71%), Asians (66%), and Latinos (63%) are more likely than whites (51%) to view climate change as a very serious problem.
“In your view, is global climate change a very serious problem, somewhat serious, not too serious or not a problem?”
All adults
Party Race/Ethnicity
Dem Rep Ind Asians Blacks Latinos Whites
Very serious 57% 79% 21% 55% 66% 71% 63% 51%
Somewhat serious 23 15 26 24 24 16 23 24
Not too serious 7 3 17 8 3 3 5 9
Not a problem 11 4 35 12 7 9 6 15
Don't know 1 – 1 – – – 2 1
In previous surveys majorities of Californians have consistently favored state efforts to address global warming, and relatively few have said that such efforts will lead to job losses. Even in the wake of controversy this summer over a new state law on climate change (SB 350), a plurality of Californians (45%) say that state actions to reduce global warming would cause there to be more jobs for people around the state and 27 percent say it would not affect the number of jobs; 19 percent think action would result in fewer jobs. A plurality of Californians have said that state action would result in more jobs since we began asking this question in July 2010, with a high of 47 percent in July 2011 and a low of 38 percent in July 2015. A majority of Democrats (58%) and a plurality of independents (45%) say state action would result in more jobs, while a plurality of Republicans (39%) say fewer jobs. Across regions and demographic groups, a plurality of Californians say state action would result in more jobs. Among those who view global climate change as very serious, 57 percent say action would lead to more jobs.
“Do you think that California doing things to reduce global warming in the future would cause there to be more jobs for people around the state, would cause there to be fewer jobs, or wouldn't affect the number of jobs?”
All adults
Party Race/Ethnicity
Dem Rep Ind Asians Blacks Latinos Whites
More jobs 45% 58% 21% 45% 47% 49% 47% 45%
Fewer jobs 19 11 39 20 20 22 16 20
Wouldn't affect the number of jobs
27 22 31 29 23 26 30 25
Don't know 9 8 9 6 10 3 8 11

PPIC Statewide Survey
December 2015 Californians and their Government 12
HEALTH CARE POLICY
In June, the United States Supreme Court preserved the Affordable Care Act with a much anticipated ruling. Today, about half of Californians (51%) have a generally favorable opinion of the health care law, while four in 10 (42%) have a generally unfavorable opinion. Opinions of the law were similar in January (51% favorable, 41% unfavorable) and March (52% favorable, 42% unfavorable), while fewer than half viewed the law favorably in seven surveys from December 2013 to December 2014. Adults nationwide are more divided (42% favorable, 42% unfavorable), according to an October Kaiser Family Foundation survey.
Partisans view the law much differently, with two in three Democrats (66%) viewing it favorably, while eight in 10 Republicans (80%) view it unfavorably. Independents offer a more divided opinion. There are also stark differences among those who have health insurance and those who do not. About half of those with health insurance (53%) have a favorable opinion of the law, while six in 10 of those who do not have insurance (60%) view it unfavorably. About six in 10 blacks (62%), Latinos (59%), and Asians (58%) view the law favorably, while whites are divided (44% favorable, 49% unfavorable). Residents in the San Francisco Bay Area (61%) are the most likely to have favorable opinions, followed by those in Los Angeles (52%), Orange/San Diego (52%), the Central Valley (45%), and the Inland Empire (41%).
“As you may know, a health reform bill was signed into law in 2010. Given what you know about the health reform law, do you have a generally favorable or generally unfavorable opinion of it?”
All adults
Party Have health insurance
Do not have health
insurance Dem Rep Ind
Generally favorable 51% 66% 17% 50% 53% 37%
Generally unfavorable 42 29 80 43 39 60
Don't know 8 6 4 7 8 3
In May 2016, California will extend health care coverage to some low-income undocumented immigrant children. There are also proposals to further extend coverage, possibly to include undocumented adults. How do Californians view health care coverage for undocumented immigrants? A slim majority of Californians (54%) are in favor, while four in 10 are opposed (42%). Among likely voters the findings are reversed (42% favor, 55% opposed).
A majority of Democrats (63%) favor this idea, while a majority of independents (55%) and Republicans (87%) are opposed. Latinos (85%) are far more likely than Asians (53%), blacks (44%), and whites (33%) to be in favor. Support is far higher among noncitizens (88%) than among either naturalized citizens (63%) or U.S.-born residents (41%). Los Angeles (65%) residents are the most likely to favor this proposal, followed by those in the San Francisco Bay Area (54%), the Inland Empire (50%), Orange/San Diego (48%), and the Central Valley (45%). Support decreases as age and income levels increase.
“Do you favor or oppose providing health care coverage for undocumented immigrants in California?”
All adults
Party Race/Ethnicity
Dem Rep Ind Asians Blacks Latinos Whites
Favor 54% 63% 11% 41% 53% 44% 85% 33%
Oppose 42 32 87 55 42 51 13 64
Don't know 3 4 2 4 5 5 2 3

PPIC Statewide Survey
December 2015 Californians and their Government 13
INITIATIVE PROCESS
Today, a majority of Californians are satisfied with the way the initiative process is working in California. Two in three adults (65%) and six in 10 likely voters (62%) are satisfied, although just 11 percent in either group say they are very satisfied. In periodic surveys dating back to 2000, a majority of Californians have expressed satisfaction. Notably, there is bipartisan agreement on the initiative process.
While majorities are satisfied with the initiative process, many Californians (60%) and likely voters (61%) agree with the statement that in general there are too many propositions on the state ballot. In May 2013—six months after 11 statewide measures appeared on the November ballot—about seven in 10 Californians (70%) and likely voters (67%) thought there were too many initiatives on the ballot.
Today, partisans agree that in general there are too many initiatives on the ballot. Republicans (41%) are much more likely than Democrats or independents (28% each) to strongly agree. Majorities across regions and demographic groups think there are too many propositions on the state ballot.
“Please say if you strongly agree, somewhat agree, somewhat disagree, or strongly disagree with the following statement—in general, there are too many propositions on the state ballot.”
All adults
Party Likely voters
Dem Rep Ind
Strongly agree 27% 28% 41% 28% 33%
Somewhat agree 33 35 24 37 28
Somewhat disagree 22 23 24 24 26
Strongly disagree 9 9 6 9 8
Don't know 9 5 5 3 4
More than half of Californians (55%) and two in three likely voters (66%) think that special interests have a lot of control over the initiative process in California. A majority of Californians have held this view in six previous surveys since January 2001. Here too there is partisan agreement, with majorities across parties saying that special interests exert a lot of control. At least half of Californians across regions hold this view. Whites (60%) are the most likely racial/ethnic group to say special interests have a lot of control, followed by blacks (55%), Latinos (51%), and Asians (44%). The share of adults saying special interests have a lot of control increases as age and income increase. Californians who are very satisfied with the initiative process are far less likely than those who are not satisfied to say that special interests have a lot of control (40% to 75%).
“Overall, how much would you say that the initiative process in California today is controlled by special interests?”
All adults
Party Likely voters
Dem Rep Ind
A lot 55% 60% 68% 59% 66%
Some 33 32 25 37 28
Not at all 6 4 3 1 3
Don’t know 6 5 4 3 4

PPIC Statewide Survey
December 2015 Californians and their Government 14
BALLOT ISSUES
It appears that 2016 will be a busy year for the initiative process, with some high profile propositions working their way to the ballot. When asked about the importance of four potential ballot measures, about six in 10 Californians consider state bonds funding K–12 schools and community college facilities (63%) and increasing the state minimum wage (57%) to be very important. Fewer consider the issues of extending the Proposition 30 tax increases (36%) and legalizing marijuana in California (28%) very important. In fact, a plurality of Californians view legalizing marijuana as not at all important (32%).
“Next, several issues may be decided by California voters on the November 2016 ballot. Please tell me if each of the following issues is very important, somewhat important,
not too important, or not at all important to you. How about…?”
All adults State bonds funding K–12 schools and community college
facilities Increasing the state
minimum wage
Extending the Proposition 30 tax
increases which are set to expire in 2018
Legalizing marijuana in
California
Very important 63% 57% 36% 28%
Somewhat important 25 23 38 21
Not too important 5 9 12 18
Not at all important 6 11 11 32
Don't know 2 1 3 1
The share of Californians who view state bonds for schools and community colleges as very important is higher among Democrats (73%) and independents (57%) than among Republicans (37%). At least half across regions and demographic groups—except among whites (49%)—view these bonds as very important. When it comes to increasing the state minimum wage, Democrats (66%) are much more likely than independents (46%) or Republicans (32%) to view it as very important. While fewer than half across parties view extending the Proposition 30 tax increases as very important, Democrats (43%) and independents (39%) are much more likely than Republicans (26%) to hold this view. Across regions and demographic groups, the view that extending Proposition 30 taxes is very important eclipses 40 percent only among San Francisco Bay Area residents (42%) and Latinos (44%). Fewer than one in three across parties, regions, and demographic groups consider legalizing marijuana very important.
Percent saying issue is very important
State bonds funding K–12 schools and community college
facilities Increasing the state
minimum wage
Extending the Proposition 30 tax
increases which are set to expire in 2018
Legalizing marijuana in
California
All adults 63% 57% 36% 28%
All likely voters 55 49 37 30
Party
Democrats 73 66 43 31
Republicans 37 32 26 27
Independents 57 46 39 31
Age
18–34 70 63 35 26
35–54 68 59 37 28
55 and older 50 51 36 30
Race/ Ethnicity
Asians 60 57 33 23
Blacks 73 76 37 31
Latinos 78 68 44 22
Whites 49 46 30 30

15
NATIONAL ELECTION POLICY LANDSCAPE
KEY FINDINGS
Six in ten Californians approve of President Obama’s job performance. One in four approve of Congress. (page 16)
As many Californians say they are satisfied with their choices for president as say they are not satisfied. Among registered voters, Republicans are more likely than Democrats to be satisfied and independents are least likely. (page 17)
About half of California adults and likely voters would prefer a U.S. Congress controlled by Democrats while about a third would prefer a Congress controlled by Republicans. (page 18)
Pluralities of Californians say the Democrats could do a better job than the Republicans handling the economy, the federal budget, immigration, and health care. (page 19)
About half of Californians have a favorable impression of the Democratic Party and three in 10 have a favorable impression of the Republican Party. One in four view the Tea Party movement favorably. (page 20)
A majority of Californians say that the Republican and Democratic parties do such a poor job that a third party is needed, including majorities of Democrats, Republicans, and independents. (page 20)
Almost half of citizens not registered to vote say they would be very likely to vote if they were automatically registered at the DMV to do so. Nearly seven in 10 registered voters who don’t always vote say they very likely would vote if they automatically received a mail ballot. (page 21)
52
6964
43
26
14
23
39
0
20
40
60
80
Asians Blacks Latinos Whites
Per
cent
Democratic Party
Republican Party
Favorable Opinion of Major Parties
4136
5157
0
20
40
60
80
California Adults Adults Nationwide*
Per
cent
all
adul
ts
Experience and a proven record
New ideas and a different approach
Which Is More Important to You in a Presidential Candidate?
*Pew Research Center, 0ctober 2015
61
26
0
20
40
60
80
Dec 11 Dec 12 Dec 13 Dec 14 Dec 15
Per
cent
all
adul
ts
President Obama
U.S. Congress
Approval Ratings of Federal Elected Officials

PPIC Statewide Survey
16
APPROVAL RATINGS FOR FEDERAL ELECTED OFFICIALS
Today, 61 percent of California adults and 56 percent of likely voters approve of the way Barack Obama is handling his job as president. The president’s current approval ratings are similar to those in our September survey (60% adults, 53% likely voters) and higher than in our December 2013 poll (51% adults, 48% likely voters). There are stark partisan differences, with 86 percent of Democrats approving of the way President Obama is handling his job and 84 percent of Republicans disapproving. Half of independents (52%) approve of the president while 45 percent disapprove. There are also notable differences across regions. Residents of the San Francisco Bay Area (71%) and Los Angeles (70%) are the most likely to approve of the president, while those in the Central Valley are the least likely to approve (49%). More than seven in 10 blacks (83%), Asians (76%), and Latinos (72%), approve of the way the president is handling his job, while about half of whites (48%) do so. Californians age 18 to 34 (72%) are far more likely to approve of President Obama than are Californians age 55 or older (49%). Majorities across education and income groups approve of the president. In a November CBS/New York Times poll, 45 percent of adults nationwide approved of the way President Obama is handling his job while 48 percent disapproved.
“Overall, do you approve or disapprove of the way that Barack Obama is handling his job as president of the United States?”
Approve Disapprove Don't know
All adults 61% 36% 3%
All likely voters 56 43 2
Party
Democrats 86 13 1
Republicans 15 84 1
Independents 52 45 3
Region
Central Valley 49 48 3
San Francisco Bay Area 71 24 4
Los Angeles 70 28 2
Orange/San Diego 58 39 3
Inland Empire 52 45 4
Following John Boehner’s resignation and Congressman Paul Ryan’s ascension to Speaker of the House, how do Californians view the U.S. Congress? Twenty-six percent of California adults and 14 percent of likely voters approve of the way Congress is handling its job. Approval of Congress was slightly higher among adults in our September survey (32% adults, 17% likely voters). Today, approval is low across parties, with fewer than one in four Democrats (22%), Republicans (18%), and independents (15%) expressing approval. Regionally, residents in Los Angeles (31%) are the most likely to approve of Congress while those in the San Francisco Bay Area (21%) are the least likely to do so. In a Gallup national poll in November, 11 percent of adults approved of Congress while 86 percent disapproved.
“Overall, do you approve or disapprove of the way the U.S. Congress is handling its job?”
All adults
Party Likely voters
Dem Rep Ind
Approve 26% 22% 18% 15% 14%
Disapprove 67 72 78 80 81
Don’t know 7 6 4 5 5

PPIC Statewide Survey
17
PRESIDENTIAL ELECTION
As the Republican and Democratic parties hold their primary debates, how satisfied are Californians with their choices in the presidential election? Today, 46 percent of California adults and 53 percent of likely voters say they are satisfied with their choices of candidates. Republicans (58%) are slightly more likely than Democrats (51%) to say they are satisfied with their choices. Four in 10 independents (41%) say they are satisfied with their choices while a majority say they are not satisfied (53%). Across racial/ethnic groups, whites (51%) are the most likely to be satisfied with their choices, followed by Asians (46%), Latinos (43%), and blacks (40%). Californians with an annual household income of $40,000 or more (51%) are somewhat more likely than those with a lower income (40%) to say they are satisfied with their choices in the election. Notably, among Californians who have a favorable view of the Tea Party movement, six in 10 say they are satisfied with their choices of candidates. Today, satisfaction among likely voters is slightly lower than in December 2007, when 61 percent of likely voters said they were satisfied with their choices of candidates in the presidential primary election.
“In general, would you say you are satisfied or not satisfied with your choices of candidates in the election for U.S. President in 2016?”
All adults
Party Likely voters
Dem Rep Ind
Satisfied 46% 51% 58% 41% 53%
Not satisfied 46 45 36 53 42
Both (volunteered) 2 1 2 1 1
Don't know 6 4 4 5 3
When asked which attributes are more important in a presidential candidate, half of Californians say new ideas and a different approach, while 41 percent say experience and a proven record. Likely voters are divided, with 46 percent preferring new ideas and a different approach and 44 percent preferring experience and a proven record. A recent Pew Research Center poll found that 57 percent of adults nationwide say new ideas and a different approach are more important while 36 percent prefer experience and a proven record.
There are notable partisan differences in these views, with a majority of Republicans (61%) and independents (54%) preferring new ideas and a majority of Democrats (52%) saying experience. Majorities of Californians age 18 to 34 (54%) and age 35 to 54 (52%) say that new ideas and a different approach are more important while Californians age 55 or older are divided (46% new ideas, 47% experience).
“Which of the following is more important to you in a presidential candidate —experience and a proven record or new ideas and a different approach?”
All adults
Party Likely voters
Dem Rep Ind
Experience and a proven record
41% 52% 34% 38% 44%
New ideas and a different approach
51 39 61 54 46
Both (volunteered) 6 7 3 6 9
Don't know 2 2 2 3 2

PPIC Statewide Survey
18
CONGRESSIONAL ELECTIONS
When asked about next year’s congressional elections, Californians prefer a Congress controlled by Democrats (52%) over a Congress controlled by Republicans (32%). Findings were similar in December 2013 (50% Democratic, 32% Republican). Today, findings among likely voters (49% Democratic, 36% Republican) are similar to those of adults overall. Partisan loyalties are evident, with 83 percent of Democrats and 87 percent of Republicans preferring their own party to control Congress. Independents are divided, with 40 percent preferring Democratic control while 34 percent prefer Republican control. Notably, 17 percent of independents volunteered the response that neither party should have control. Across racial/ethnic groups, solid majorities of blacks (76%) and Latinos (64%) and a slight majority of Asians (53%) prefer a Congress controlled by Democrats; whites are divided (41% each). Californians with an annual household income under $80,000 (57%) are more likely than those with an income of $80,000 or more (44%) to prefer a Congress controlled by Democrats. In an October NBC News/Wall Street Journal poll of registered voters nationwide, 45 percent preferred Republican control and 45 percent preferred Democratic control.
“What is your preference for the outcome of next year's congressional elections: a Congress controlled by Republicans or a Congress controlled by Democrats?”
All adults
Party Likely voters
Dem Rep Ind
Controlled by Republicans 32% 8% 87% 34% 36%
Controlled by Democrats 52 83 4 40 49
Neither (volunteered) 8 5 5 17 10
Don't know 9 4 3 9 5
With the 2016 presidential and congressional election campaigns well underway, do Californians prefer that one party control the White House and the other control Congress or do they prefer that one party control both the executive and legislative branches of the federal government? Four in 10 Californians (42%) say it does not matter too much one way or the other. Three in 10 (31%) prefer that a president’s party control Congress while two in 10 (20%) prefer that one party control each branch. Californians held similar views in January 2015 and in December 2013. Today, a plurality of likely voters (37%) says that it is better for a president’s party to control Congress. Across parties, four in 10 Democrats prefer a united government (40%) while pluralities of independents (44%) and Republicans (39%) say it does not matter too much. Notably, across age groups, Californians age 18 to 34 (50%) are more likely than Californians 35 or older (38%) to say it doesn’t matter too much if the executive and legislative branches are controlled by the same party. A similar question in a September Gallup poll found that 33 percent of adults nationwide prefer the White House and Congress to be controlled by the same party, 24 percent prefer that they be controlled by different parties, and 38 percent said that it makes no difference.
“Generally, what’s the better situation: that a president’s political party also has a controlling majority in Congress, or that one party controls the White House while
the other party controls the Congress, or don’t you think it matters too much one way or the other?”
All adults
Party Likely voters
Dem Rep Ind
President's party controls Congress
31% 40% 30% 27% 37%
One party controls each 20 16 26 24 22
Don't think it matters too much
42 35 39 44 35
Don't know 7 10 5 6 7

PPIC Statewide Survey
19
POLITICAL PARTY PREFERENCES
In advance of next year’s elections, how do Californians rate the parties on key national issues? We asked Californians which party could do a better job of handling health care, immigration, the economy, and the federal budget.
On health care, a majority (53%) of Californians say the Democrats could do a better job than the Republicans. Fewer Californians named the Democratic Party in December 2013 (45%). Today, strong majorities of Democrats (81%) and Republicans (76%) favor their own party on health care, and a plurality of independents (46%) favor the Democrats. Across racial/ethnic groups, majorities of blacks (85%), Asians (64%), and Latinos (57%) say the Democrats could do a better job, as do a plurality of whites (45%). The Democrats are also favored across age, education, and income groups on health care. Finally, majorities of Californians with (53%) and without (57%) health insurance favor the Democrats on health care.
A plurality of Californians say that the Democratic Party could do a better job than the Republican Party on immigration (46% Democrats, 37% Republicans). Results were similar in December 2013 (44% Democrats, 33% Republicans). Today, strong majorities of Republicans (76%) and Democrats (71%) favor their own party, though one in four Democrats (23%) say Republicans could do a better job on immigration. Independents are slightly more likely to favor the Republicans over the Democrats (44% to 37%). Across regions, Los Angeles (55%) and San Francisco (48%) residents are more likely to favor the Democrats on immigration; opinion is split in the other regions. Across racial/ethnic groups, whites (49%) are more likely to say the Republicans could do a better job, while half or more of Asians (49%), Latinos (61%), and blacks (62%) prefer the Democrats.
“Which party could do a better job of handling…?”
Health care Immigration The economy The federal budget
Democratic Party 53% 46% 45% 44%
Republican Party 31 37 41 38
Both equally (volunteered)
3 3 4 4
Neither (volunteered) 5 6 4 6
Don't know 7 7 6 8
On the economy, 45 percent say Democrats could do a better job, and 41 percent say the Republicans could. Responses were similar in December 2013 (40% Democrats, 39% Republicans). On the federal budget today, Democrats hold a slight advantage (44% Democrats, 38% Republicans); the parties were rated more evenly in December 2013 (39% Democrats, 38% Republicans). Today, strong majorities of registered Republicans and Democrats favor their own party on the economy and the federal budget, but two in 10 Democrats say Republicans would do a better job on each issue (18% economy, 20% federal budget). Among independents, half say the Republicans could do a better job (47% economy, 49% federal budget) and one in three say the Democrats could (34% economy, 32% federal budget). Across racial/ethnic groups, whites are more likely to favor the Republicans on the economy and federal budget, while Asians, Latinos, and blacks are more likely to favor the Democrats. Older Californians, those with more education, and those with higher incomes are more likely to favor the Republicans.
Likely voters have similar preferences to all adults on health care (54% Democrats, 34% Republicans) and the economy (46% Democrats, 42% Republicans) while they are more closely divided on the federal budget (44% Democrats, 41% Republicans) and on immigration (44% Democrats, 44% Republicans).

PPIC Statewide Survey
20
POLITICAL PARTY FAVORABILITY
As we approach the election year, what are Californians’ attitudes toward the two major parties? Among all adults, half (51%) have a favorable impression of the Democratic Party, and 30 percent have a favorable impression of the Republican Party. Likely voters are more inclined to view the Democratic Party favorably (47%) than to view the Republican Party favorably (33%). Today’s party favorability is similar to our findings in October 2014 (46% Democrats, 29% Republicans) and December 2013 (52% Democrats, 33% Republicans). Statewide, 43 percent of California voters are registered as Democrats, 28 percent as Republicans, 5 percent in other parties, and 24 percent as independents (i.e., no party preference), according to the most recent report from the California Secretary of State.
Among registered Democrats, three in four (76%) view their party favorably, while two in 10 (19%) view it unfavorably. Among registered Republicans, three in four (74%) view their party favorably, while one in four (23%) view it unfavorably. Registered independents are more likely to view the Democratic Party favorably (41%) than to view the Republican Party favorably (25%). Half of independents (50%) view the Democratic Party unfavorably, and six in 10 (60%) view the Republican Party unfavorably. Across racial/ethnic groups, half or more of Asians (52%), Latinos (64%), and blacks (69%) have a favorable impression of the Democratic Party, and solid majorities of each have an unfavorable impression of the Republican Party (61% Asian, 67% Latino, 82% black). About half of whites have an unfavorable impression of both the Democratic Party (50%) and the Republican Party (54%).
Majorities of Californians (53%) and likely voters (57%) have an unfavorable impression of the political movement known as the Tea Party; about one in four adults (24%) and likely voters (28%) have a favorable impression. Around one in four Californians have viewed the Tea Party favorably since we began asking about it in 2010. Today, half of Republicans (53%) have a favorable impression of the Tea Party, as do one in ten Democrats (12%) and one in four independents (26%).
“Do you have a favorable or an unfavorable impression of the…?”
Democratic Party Republican Party Political movement known as the Tea Party
Favorable 51% 30% 24%
Unfavorable 40 61 53
Don't know 9 9 24
A majority of Californians (57%) say that the Republican and Democratic parties do such a poor job that a third major party is needed. About as many said the same in October 2014 (58%), but previously, fewer Californians thought a third party was needed (49% December 2013, 51% March 2013, 48% October 2012). Today, two in three registered independents (66%) think a third party is needed, as do majorities of registered Republicans (57%) and Democrats (56%). Majorities across age, education, and income groups say that a third party is needed. A September Gallup Poll found that 60 percent of adults nationwide think the major parties do such a poor job that a third party is needed.
“In your view, do the Republican and Democratic parties do an adequate job representing the American people, or do they do such a poor job that a third major party is needed?”
All adults
Party Likely voters
Dem Rep Ind
Adequate job 33% 34% 34% 22% 31%
Third party is needed 57 56 57 66 58
Don't know 10 10 9 12 10

PPIC Statewide Survey
21
VOTER PARTICIPATION
Record-low numbers of Californians turned out to vote in the 2014 primary and general elections, prompting discussion of reforms aimed at increasing voter participation. Governor Brown recently signed a bill that will provide for automatic voter registration via the California Department of Motor Vehicles. We found that seven in 10 citizens who are not registered to vote say they are either very likely (44%) or somewhat likely (27%) to vote if they are automatically registered when using the DMV.
Another proposed reform would have every registered voter automatically receive a mail ballot, which could be returned at new local voting centers or by mail. Nearly nine in 10 registered voters who do not always vote say they are either very likely (66%) or somewhat likely (22%) to vote if they automatically receive a mail ballot. Strong majorities across parties say they are very likely to vote (72% Democrats, 67% independents, 65% Republicans). Californians with higher incomes are more likely than those with lower incomes, and those with more education are more likely than those with less education to say they would be very likely to vote if they automatically received a mail ballot. Solid majorities of Latinos (60%) and whites (69%), along with majorities of Californians in all age groups, say they would be very likely to vote if mailed a ballot. Those who express a great deal or fair amount of interest in politics (72%) are more likely than those with only a little or no interest in politics (57%) to say they would be very likely to vote. Today, among registered adults who vote, three in ten say they vote by mail (29%), half say they vote in person (50%), and two in ten say it depends on the election (20%).
“There are many reasons people aren’t able to vote. How likely is it that you will vote in elections if you are automatically mailed a ballot which you could return by mail or at a local voting center? Are you very
likely, somewhat likely, not too likely, or not at all likely to vote in elections?”
Registered voters who do not always vote only
Registered voters
Party Age
Dem Rep Ind 18–34 35–54 55+
Very likely 66% 72% 65% 67% 62% 69% 68%
Somewhat likely 22 17 20 28 28 19 17
Not too likely 4 4 4 1 5 4 4
Not at all likely 4 6 3 4 – 6 8
Don't know 3 1 7 – 4 2 2
Three in four Californians (75%) agree with the statement that “voting gives people like me some say in what the government does.” At least seven in 10 agree across parties and age, education, and income groups. Across racial/ethnic groups, blacks are most likely to disagree with the statement that “voting gives people like me some say in what the government does” (37%). Among all Californians, those who say they have no interest in politics are more likely to disagree (32%) than those who say they have a great deal of interest in politics (17%).
“Please tell me if you completely agree, mostly agree, mostly disagree, or completely disagree with the following statement: Voting gives people like me some say in what the government does.”
All adults
Race/Ethnicity Likely voters
Asians Blacks Latinos Whites
Completely agree 31% 23% 19% 45% 25% 32%
Mostly agree 44 56 42 35 49 47
Mostly disagree 13 12 21 7 17 12
Completely disagree 9 7 16 10 8 8
Don't know 2 3 2 3 2 1

December 2015 Californians and Their Government 22
REGIONAL MAP

December 2015 Californians and Their Government 23
METHODOLOGY
The PPIC Statewide Survey is directed by Mark Baldassare, president and CEO and survey director at the Public Policy Institute of California, with assistance from survey research associates David Kordus and Lunna Lopes, co–project managers for this survey, and associate survey director Dean Bonner. The Californians and Their Government series is supported with funding from The James Irvine Foundation. The PPIC Statewide Survey invites input, comments, and suggestions from policy and public opinion experts and from its own advisory committee, but survey methods, questions, and content are determined solely by PPIC’s survey team.
Findings in this report are based on a survey of 1,703 California adult residents, including 1,020 interviewed on landline telephones and 683 interviewed on cell phones. Interviews took an average of 20 minutes to complete. Interviewing took place on weekend days and weekday nights from November 8–17, 2015.
Landline interviews were conducted using a computer-generated random sample of telephone numbers that ensured that both listed and unlisted numbers were called. All landline telephone exchanges in California were eligible for selection, and the sample telephone numbers were called as many as six times to increase the likelihood of reaching eligible households. Once a household was reached, an adult respondent (age 18 or older) was randomly chosen for interviewing using the “last birthday method” to avoid biases in age and gender.
Cell phone interviews were conducted using a computer-generated random sample of cell phone numbers. All cell phone numbers with California area codes were eligible for selection, and the sample telephone numbers were called as many as eight times to increase the likelihood of reaching an eligible respondent. Once a cell phone user was reached, it was verified that this person was age 18 or older, a resident of California, and in a safe place to continue the survey (e.g., not driving).
Cell phone respondents were offered a small reimbursement to help defray the cost of the call. Cell phone interviews were conducted with adults who have cell phone service only and with those who have both cell phone and landline service in the household.
Live landline and cell phone interviews were conducted by Abt SRBI, Inc., in English and Spanish, according to respondents’ preferences. Accent on Languages, Inc., translated new survey questions into Spanish, with assistance from Renatta DeFever.
Abt SRBI uses the U.S. Census Bureau’s 2011–2013 American Community Survey’s (ACS) Public Use Microdata Series for California (with regional coding information from the University of Minnesota’s Integrated Public Use Microdata Series for California) to compare certain demographic characteristics of the survey sample—region, age, gender, race/ethnicity, and education—with the characteristics of California’s adult population. The survey sample was closely comparable to the ACS figures. To estimate landline and cell phone service in California, Abt SRBI used 2013 state-level estimates released by the National Center for Health Statistics—which used data from the National Health Interview Survey (NHIS) and the ACS—and 2014 estimates for the West Census Region in the latest NHIS report. The estimates for California were then compared against landline and cell phone service reported in this survey. We also used voter registration data from the California Secretary of State to compare the party registration of registered voters in our sample to party registration statewide. The landline and cell phone samples were then integrated using a frame integration weight, while sample balancing adjusted for differences across regional, age, gender, race/ethnicity, education, telephone service, and party registration groups.

PPIC Statewide Survey
December 2015 Californians and Their Government 24
The sampling error, taking design effects from weighting into consideration, is ±3.7 percent at the 95 percent confidence level for the total unweighted sample of 1,703 adults. This means that 95 times out of 100, the results will be within 3.7 percentage points of what they would be if all adults in California were interviewed. The sampling error for unweighted subgroups is larger: for the 1,409 registered voters, the sampling error is ±4.0 percent; for the 1,115 likely voters, it is ±4.4 percent. Sampling error is only one type of error to which surveys are subject. Results may also be affected by factors such as question wording, question order, and survey timing.
We present results for five geographic regions, accounting for approximately 90 percent of the state population. “Central Valley” includes Butte, Colusa, El Dorado, Fresno, Glenn, Kern, Kings, Madera, Merced, Placer, Sacramento, San Joaquin, Shasta, Stanislaus, Sutter, Tehama, Tulare, Yolo, and Yuba Counties. “San Francisco Bay Area” includes Alameda, Contra Costa, Marin, Napa, San Francisco, San Mateo, Santa Clara, Solano, and Sonoma Counties. “Los Angeles” refers to Los Angeles County, “Inland Empire” refers to Riverside and San Bernardino Counties, and “Orange/San Diego” refers to Orange and San Diego Counties. Residents of other geographic areas are included in the results reported for all adults, registered voters, and likely voters, but sample sizes for these less populous areas are not large enough to report separately.
We present specific results for non-Hispanic whites, who account for 43 percent of the state’s adult population, and also for Latinos, who account for about a third of the state’s adult population and constitute one of the fastest-growing voter groups. We also present results for non-Hispanic Asians, who make up about 15 percent of the state’s adult population, and non-Hispanic blacks, who comprise about 6 percent. Results for other racial/ethnic groups—such as Native Americans—are included in the results reported for all adults, registered voters, and likely voters, but sample sizes are not large enough for separate analysis. We compare the opinions of those who report they are registered Democrats, registered Republicans, and decline-to-state or independent voters; the results for those who say they are registered to vote in other parties are not large enough for separate analysis. We also analyze the responses of likely voters—so designated per their responses to voter registration survey questions, previous election participation, and current interest in politics.
The percentages presented in the report tables and in the questionnaire may not add to 100 due to rounding.
We compare current PPIC Statewide Survey results to those in our earlier surveys and to those in national surveys by CBS/New York Times, Gallup, Pew Research Center, and NBC News/Wall Street Journal. Additional details about our methodology can be found at www.ppic.org/content /other/SurveyMethodology.pdf and are available upon request through [email protected].

December 2015 Californians and Their Government 25
QUESTIONNAIRE AND RESULTS
CALIFORNIANS AND THEIR GOVERNMENT
November 8–17, 2015 1,703 California Adult Residents: English, Spanish
MARGIN OF ERROR ±3.7% AT 95% CONFIDENCE LEVEL FOR TOTAL SAMPLE PERCENTAGES MAY NOT ADD TO 100 DUE TO ROUNDING
1. First, thinking about the state as a whole, what do you think is the most important issue facing people in California today?
[code, don’t read]
27% water, drought 24 jobs, economy 6 immigration, illegal immigration 5 housing costs, availability 5 state budget, deficit, taxes 4 education, schools, teachers 3 crime, gangs, drugs 3 environment, pollution, global
warming 3 infrastructure 2 government in general 2 health care, health insurance 2 homelessness 2 poverty 6 other (specify) 6 don’t know
2. Overall, do you approve or disapprove of the way that Jerry Brown is handling his job as governor of California?
51% approve 29 disapprove 20 don’t know
3. Overall, do you approve or disapprove of the way that the California Legislature is handling its job?
41% approve 40 disapprove 19 don’t know
4. Do you think things in California are generally going in the right direction or the wrong direction?
51% right direction 43 wrong direction 6 don’t know
5. Turning to economic conditions in California, do you think that during the next 12 months we will have good times financially or bad times?
48% good times 41 bad times 11 don’t know
Changing topics,
6. Some people think that California is divided into economic groups, the haves and have- nots, while others think it is not divided that way. Do you think that California is divided into haves and have-nots, or do you think that California is not divided that way?
67% divided into haves and have-nots 29 not divided that way 5 don’t know
7. If you had to choose, which of these groups are you in— the haves or have-nots?
40% haves 44 have-nots 12 neither (volunteered)
5 don’t know

PPIC Statewide Survey
December 2015 Californians and Their Government 26
8. Do you think that in California today [rotate]
(1) all people have an equal opportunity to get ahead, [or that] (2) the government should do more to make sure that all Californians have an equal opportunity to get ahead.
42% people have equal opportunity 51 government should do more 2 both (volunteered) 3 neither (volunteered) 2 don’t know
9. Next, do you think the state budget situation in California—that is, the balance between government spending and revenues—is a big problem, somewhat of a problem, or not a problem for the people of California today?
45% big problem 36 somewhat of a problem 11 not a problem 8 don’t know
10. In general, which of the following statements do you agree with more—[rotate] (1) I’d rather pay higher taxes and have a state government that provides more services, [or]
(2) I’d rather pay lower taxes and have a state government that provides fewer services?
48% higher taxes and more services 45 lower taxes and fewer services 7 don’t know
11. As you may know, voters passed Proposition 30 in November 2012. It increased taxes on earnings over $250,000 for seven years and sales taxes by one quarter cent for four years, to fund schools and guarantee public safety realignment funding. Do you favor or oppose extending the Proposition 30 tax increases which are set to fully expire in 2018?
54% favor 36 oppose 7 don’t know
On another topic, California uses the direct initiative process, which enables voters to bypass the legislature and have issues put on the ballot—as state propositions—for voter approval or rejection.
12.Generally speaking, would you say you are very satisfied, somewhat satisfied, or not satisfied with the way the initiative process is working in California today?
11% very satisfied 54 somewhat satisfied 26 not satisfied 8 don’t know
[rotate questions 13 and 14]
13.Please say if you strongly agree, somewhat agree, somewhat disagree, or strongly disagree with the following statement—in general, there are too many propositions on the state ballot.
27% strongly agree 33 somewhat agree 22 somewhat disagree 9 strongly disagree 9 don’t know
14. Overall, how much would you say that the initiative process in California today is controlled by special interests—a lot, some, or not at all?
55% a lot 33 some 6 not at all 6 don’t know
Next, several issues may be decided by California voters on the November 2016 ballot. Please tell me if each of the following issues is very important, somewhat important, not too important, or not at all important to you.
[rotate questions 15 to 18]
15. How about legalizing marijuana in California?
28% very important 21 somewhat important 18 not too important 32 not at all important 1 don’t know

PPIC Statewide Survey
December 2015 Californians and Their Government 27
16. How about increasing the state minimum wage?
57% very important 23 somewhat important 9 not too important 11 not at all important 1 don’t know
17. How about state bonds funding K–12 schools and community college facilities?
63% very important 25 somewhat important 5 not too important 6 not at all important 2 don’t know
18. How about extending the Proposition 30 tax increases which are set to expire in 2018?
36% very important 38 somewhat important 12 not too important 11 not at all important 3 don’t know
Changing topics,
19. Overall, do you approve or disapprove of the way that Barack Obama is handling his job as president of the United States?
61% approve 36 disapprove 3 don’t know
20. Overall, do you approve or disapprove of the way the U.S. Congress is handling its job?
26% approve 67 disapprove 7 don’t know
Changing topics,
21. As you may know, a health reform bill was signed into law in 2010. Given what you know about the health reform law, do you have a [rotate] (1) [generally favorable] [or] (2) [generally unfavorable] opinion of it?
51% generally favorable 42 generally unfavorable 8 don’t know
22. Do you favor or oppose providing health care coverage for undocumented immigrants in California?
54% favor 42 oppose 3 don’t know
On another topic,
23. In your view, is global climate change a very serious problem, somewhat serious, not too serious or not a problem?
57% very serious 23 somewhat serious 7 not too serious 11 not a problem 1 don’t know
24. Do you think that California doing things to reduce global warming in the future would cause there to be more jobs for people around the state, would cause there to be fewer jobs, or wouldn’t affect the number of jobs for people around the state?
45% more jobs 19 fewer jobs 27 wouldn’t affect the number of jobs 9 don’t know
Next,
25. In general, would you say you are satisfied or not satisfied with your choices of candidates in the election for U.S. President in 2016?
46% satisfied 46 not satisfied 2 both (volunteered)
6 don’t know
26. Which of the following is more important to you in a presidential candidate—[rotate] (1) experience and a proven record [or] (2) new ideas and a different approach?
41% experience and a proven record 51 new ideas and a different approach 6 both (volunteered) 2 don’t know

PPIC Statewide Survey
December 2015 Californians and Their Government 28
26a. People have different ideas about the qualifications they want when they vote for candidates for statewide office, such as governor or U.S. senator. Which of these is most important to you? [rotate 1 and 2] (1) that the candidate has experience in elected office, [or] (2) that the candidate has experience running a business?
53% experience in elected office 39 experience running a business 5 both (volunteered) 3 don’t know
27. What is your preference for the outcome of next year's congressional elections: [rotate] a Congress controlled by Republicans [or] a Congress controlled by Democrats?
32% controlled by Republicans 52 controlled by Democrats 8 neither (volunteered)
9 don’t know
28. Generally, what’s the better situation: that a president’s political party also has a controlling majority in Congress, or that one party controls the White House while the other party controls the Congress, or don’t you think it matters too much one way or the other?
31% president’s party controls Congress 20 one party controls each 42 don’t think it matters too much 7 don’t know
[rotate questions 29 and 30]
29. Do you have a favorable or an unfavorable impression of the Democratic Party?
51% favorable 40 unfavorable 9 don’t know
30. Do you have a favorable or an unfavorable impression of the Republican Party?
30% favorable 61 unfavorable 9 don’t know
30a. Do you have a favorable or unfavorable impression of the political movement known as the Tea Party?
24% favorable 53 unfavorable 24 don’t know
31. In your view, do the Republican and Democratic parties do an adequate job representing the American people, or do they do such a poor job that a third major party is needed?
33% adequate job 57 third party is needed 10 don’t know
Next, please tell me if you think the [rotate] (1) Republican Party [or] the (2) Democratic Party could do a better job of handling each of these national issues. First,
[rotate questions 32 to 35]
32. Which party could do a better job of handling health care?
31% Republican Party 53 Democratic Party 3 both equally (volunteered) 5 neither (volunteered) 7 don’t know
33. Which party could do a better job of handling the economy?
41% Republican Party 45 Democratic Party 4 both equally (volunteered) 4 neither (volunteered) 6 don’t know
34. Which party could do a better job of handling the federal budget?
38% Republican Party 44 Democratic Party 4 both equally (volunteered) 6 neither (volunteered) 8 don’t know

PPIC Statewide Survey
December 2015 Californians and Their Government 29
35. Which party could do a better job of handling immigration?
37% Republican Party 46 Democratic Party 3 both equally (volunteered) 6 neither (volunteered) 7 don’t know
On another topic,
36. Please tell me if you completely agree, mostly agree, mostly disagree or completely disagree with the following statement: Voting gives people like me some say in what the government does.
31% completely agree 44 mostly agree 13 mostly disagree 9 completely disagree 2 don’t know
37. Next, some people are registered to vote and others are not. Are you absolutely certain that you are registered to vote in California?
67% yes [ask q37a] 33 no [skip to q38b]
37a. Are you registered as a Democrat, a Republican, another party, or are you registered as a decline-to-state or independent voter?
43% Democrat [ask q38] 27 Republican [ask q38a] 5 another party (specify) [skip to q40] 24 independent [ask q38b]
38. Would you call yourself a strong Democrat or not a very strong Democrat?
51% strong 48 not very strong 1 don’t know
[skip to q40]
38a. Would you call yourself a strong Republican or not a very strong Republican?
47% strong 52 not very strong 1 don’t know
[skip to q40]
38b. Do you think of yourself as closer to the Republican Party or Democratic Party?
27% Republican Party 50 Democratic Party 17 neither (volunteered)
5 don’t know
39. [among citizens who are not registered]
There are many reasons people aren’t able to vote. How likely is it that you will vote in elections if you are automatically registered to vote when you use the California Department of Motor Vehicles (DMV)? Are you very likely, somewhat likely, not too likely, or not at all likely to vote in elections?
44% very likely 27 somewhat likely 12 not too likely 16 not at all likely 1 don’t know
40. Next, would you consider yourself to be politically: [read list, rotate order top to bottom]
13% very liberal 20 somewhat liberal 31 middle-of-the-road 20 somewhat conservative 14 very conservative 2 don’t know

PPIC Statewide Survey
December 2015 Californians and Their Government 30
41. Generally speaking, how much interest would you say you have in politics—a great deal, a fair amount, only a little, or none?
22% great deal 39 fair amount 30 only a little 9 none – don’t know
42a.[among registered voters who say they vote]
When you vote, do you vote in person, by mail, or does it depend on the election?
49% in person 26 by mail 24 it depends on the election 1 don’t know
43. [among registered voters who say they do not
always vote] There are many reasons people aren’t able to vote. How likely is it that you will vote in elections if you are automatically mailed a ballot which you could return by mail or at a local voting center? Are you very likely, somewhat likely, not too likely, or not at all likely to vote in elections?
66% very likely 22 somewhat likely 4 not too likely 4 not at all likely 3 don’t know
[d1–d15: demographic questions]

PPIC STATEWIDE SURVEY ADVISORY COMMITTEE
Ruben Barrales President and CEO GROW Elect
Angela Blackwell Founder and CEO PolicyLink
Mollyann Brodie Senior Vice President Kaiser Family Foundation
Bruce E. Cain Director Bill Lane Center for the American West Stanford University
Jon Cohen Vice President of Survey Research SurveyMonkey
Joshua J. Dyck Co-Director Center for Public Opinion University of Massachusetts, Lowell
Russell Hancock President and CEO Joint Venture Silicon Valley Network
Sherry Bebitch Jeffe Senior Scholar School of Policy, Planning, and Development University of Southern California
Robert Lapsley President California Business Roundtable
Carol S. Larson President and CEO The David and Lucile Packard Foundation
Donna Lucas Chief Executive Officer Lucas Public Affairs
Lisa Pitney Vice President, Government Relations The Walt Disney Company
Robert K. Ross, M.D. President and CEO The California Endowment
Most Reverend Jaime Soto Bishop of Sacramento Roman Catholic Diocese of Sacramento
Carol Whiteside President Emeritus Great Valley Center
The PPIC Statewide Survey Advisory Committee is a diverse group of experts who provide advice on survey issues.
However, survey methods, questions, content, and timing are determined solely by PPIC.

PPIC BOARD OF DIRECTORS
Donna Lucas, Chair Chief Executive Officer Lucas Public Affairs
Mark Baldassare President and CEO Public Policy Institute of California
Ruben Barrales President and CEO GROW Elect
María Blanco Executive Director Undocumented Student Legal Services Center University of California Office of the President
Louise Henry Bryson Chair Emerita, Board of Trustees J. Paul Getty Trust
A. Marisa Chun Partner McDermott Will & Emery LLP
Phil Isenberg Vice Chair Delta Stewardship Council
Mas Masumoto Author and Farmer
Steven A. Merksamer Senior Partner Nielsen, Merksamer, Parrinello, Gross & Leoni, LLP
Gerald L. Parsky Chairman Aurora Capital Group
Kim Polese Chairman ClearStreet, Inc.
Gaddi H. Vasquez Senior Vice President, Government Affairs Edison International Southern California Edison

The Public Policy Institute of California is dedicated to informing and improving public policy in California through independent, objective, nonpartisan research on major economic, social, and political issues. The institute’s goal is to raise public awareness and to give elected representatives and other decision makers a more informed basis for developing policies and programs.
The institute’s research focuses on the underlying forces shaping California’s future, cutting across a wide range of public policy concerns, including economic development, education, environment and resources, governance, population, public finance, and social and health policy.
PPIC is a public charity. It does not take or support positions on any ballot measures or on any local, state, or federal legislation, nor does it endorse, support, or oppose any political parties or candidates for public office. PPIC was established in 1994 with an endowment from William R. Hewlett.
Mark Baldassare is President and CEO of PPIC. Donna Lucas is Chair of the Board of Directors.
Short sections of text, not to exceed three paragraphs, may be quoted without written permission provided that full attribution is given to the source and the copyright notice below is included. Copyright © 2015 Public Policy Institute of California All rights reserved. San Francisco, CA PUBLIC POLICY INSTITUTE OF CALIFORNIA 500 Washington Street, Suite 600 San Francisco, California 94111 phone: 415.291.4400 fax: 415.291.4401
PPIC SACRAMENTO CENTER Senator Office Building 1121 L Street, Suite 801 Sacramento, California 95814 phone: 916.440.1120 fax: 916.440.1121
www.ppic.org [email protected]