Embed Size (px)
Citation preview

B1WD-3299-01ENZ0(00)March 2014
Windows(64)
FUJITSU SoftwareNetCOBOL V11.0
Debugging Guide

PrefaceNetCOBOL allows you to create, execute, and debug COBOL programs. This manual describes the debugging functions available.
Audience
This manual is for people who develop COBOL programs using NetCOBOL. It assumes users possess basic knowledge of COBOL andare familiar with the appropriate Windows platform.
How this Manual is Organized
This manual consists of the following chapters and appendices:
Chapter Contents
Chapter 1 Introduction to Debugging with NetCOBOL An overview of the various debugging functions.
Chapter 2 NetCOBOL Debugging Functions Details of using COBOL debugging functions.
How to Use This Manual
Check the features listed in the introduction and determine which debugging features you wish to use. Select the chapter that detailsthose features.
Conventions Used in this Manual
This manual uses the following typographic conventions.
Example of Convention Description
setup Characters you enter appear in bold.
Program-name Underlined text indicates a placeholder forinformation you supply.
ENTER Small capital letters are used for the name of keysand key sequences such as ENTER and CTRL+R. Aplus sign (+) indicates a combination of keys.
... Ellipsis indicates the item immediately proceedingcan be specified repeatedly.
Edit, Literal Names of pull-down menus and options appearwith the initial letter capitalized.
[def] Indicates that the enclosed item may be omitted.
{ABC|DEF} Indicates that one of the enclosed items delimitedby | is to be selected.
CHECK
WITH PASCAL LINKAGE
ALL
PARAGRAPH-ID
COBOL
ALL
Commands, statements, clauses, and options youenter or select appear in uppercase. Programsection names, and some proper names alsoappear in uppercase. Defaults are underlined.
PROCEDURE DIVISION:
ADD 1 TO POW-FONTSIZE OF LABEL1.
IF POW-FONTSIZE OF LABEL1 > 70 THEN
This font is used for examples of program code.
- i -

Example of Convention Description
MOVE 1 TOW POW-FONTSIZE OF LABEL1.
END-IF.
The sheet acts as an application creation form. Italics are occasionally used for emphasis.
Refer to "Setting Environment Variables" in the "NetCOBOLUser's Guide".
References to other publications or sections withinpublications are in quotation marks.
Product Names
Product Name Abbreviation
Microsoft® Windows Server® 2012 R2 Datacenter
Microsoft® Windows Server® 2012 R2 Standard
Microsoft® Windows Server® 2012 R2 Essentials
Microsoft® Windows Server® 2012 R2 Foundation
Windows Server 2012 R2
Microsoft® Windows Server® 2012 Datacenter
Microsoft® Windows Server® 2012 Standard
Microsoft® Windows Server® 2012 Essentials
Microsoft® Windows Server® 2012 Foundation
Windows Server 2012
Microsoft® Windows Server® 2008 R2 Foundation
Microsoft® Windows Server® 2008 R2 Standard
Microsoft® Windows Server® 2008 R2 Enterprise
Microsoft® Windows Server® 2008 R2 Datacenter
Windows Server 2008 R2
Windows® 8.1
Windows® 8.1 Pro
Windows® 8.1 Enterprise
Windows 8.1(x64)
Windows® 8
Windows® 8 Pro
Windows® 8 Enterprise
Windows 8(x64)
Windows® 7 Home Premium
Windows® 7 Professional
Windows® 7 Enterprise
Windows® 7 Ultimate
Windows 7(x64)
Microsoft(R) Visual C++(R) development system Visual C++
Microsoft(R)Visual Basic(R) programming system Visual Basic
Oracle Solaris Solaris
- In this manual, when all the following products are indicates, it is written as "Windows" or "Windows(x64)".
- Windows Server 2012 R2
- Windows Server 2012
- Windows Server 2008 R2
- Windows 8.1(x64)
- ii -

- Windows 8(x64)
- Windows 7(x64)
Product Differences
The following products are not supported in the US English language version, or other English language versions, of this product, butmay be mentioned in this manual:
- BS*NET
- IDCM
- MeFt/NET
- MeFt/NET-SV
- PowerAIM
- RDB/7000 Server for Windows NT
- SequeLink
- MeFt/Web
- Print Walker/OVL option
- System Walker/List Works
Trademarks
- NetCOBOL is a trademark or registered trademark of Fujitsu Limited or its subsidiaries in the United States or other countries orin both.
- Microsoft, Windows, Windows Server, Windows Vista, Visual Basic and Visual C++ are trademarks or registered trademarks ofMicrosoft Corporation in the United States and/or other countries.
- Oracle and Java are registered trademarks of Oracle and/or its affiliates. Other names may be trademarks of their respectiveowners. Oracle Solaris might be described as Solaris, Solaris Operating System, or Solaris OS.
- Other product names are trademarks or registered trademarks of each company. Trademark indications are omitted for somesystem and product names described in this manual.
- The permission of the Microsoft Corporation has been obtained for the use of screen images.
Acknowledgments
The language specifications of COBOL are based on the original specifications developed by the work of the Conference on DataSystems Languages (CODASYL). The specifications described in this manual are also derived from the original. The following passagesare quoted at the request of CODASYL.
"COBOL is an industry language and is not the property of any company or group of companies, or of any organization or group oforganizations. No warranty, expressed or implied, is made by the COBOL Committee as to the accuracy and functioning of theprogramming system and language. Moreover, no responsibility is assumed by the committee, in connection therewith.
"The authors of the following copyrighted material have authorized the use of this material in part in the COBOL specifications. Suchauthorization extends to the use of the original specifications in other COBOL specifications:
- FLOW-MATIC (Trademark of Sperry Rand Corporation), Processing for the UNIVAC I and II, Data Automation Systems, copyrighted1958, 1959, by Sperry Rand Corporation.
- IBM Commercial Translator, Form No. F28-8013, copyrighted 1959 by International Business Machines Corporation.
- FACT, DSI 27A5260-2760, copyrighted 1960 by Minneapolis-Honeywell."
The object-oriented language specification for COBOL is based on the Forth COBOL International Standards resulting from the effortsof the ISO/IEC JTC1/SC22/WG4 and NCITS J4 Technology Committees. We would like to express our special thanks to those committeesfor their efforts and dedication.
- iii -

Export Regulation
Exportation/release of this document may require necessary procedures in accordance with the regulations of the Foreign Exchangeand Foreign Trade Control Law of Japan and/or US export control laws.
The contents of this manual may be revised without prior notice. No part of this document may be reproduced or transmitted in anyform or by any means, electronic or mechanical, for any purpose, without the express written permission of Fujitsu Limited.
March 2014
Copyright 2010-2014 FUJITSU LIMITED
- iv -

ContentsChapter 1 Introduction to Debugging with NetCOBOL......................................................................................................................... 1
1.1 Debugging with NetCOBOL........................................................................................................................................................ 11.2 Features of the COBOL Debugging Functions.............................................................................................................................1
1.2.1 TRACE..................................................................................................................................................................................11.2.2 CHECK................................................................................................................................................................................. 11.2.3 COUNT.................................................................................................................................................................................21.2.4 Memory Check.................................................................................................................................................................... 21.2.5 COBOL Error Report............................................................................................................................................................. 21.2.6 Compiler Listings and Debugging tool................................................................................................................................ 2
Chapter 2 NetCOBOL Debugging Functions......................................................................................................................................... 32.1 Outline of the Debugging Functions.......................................................................................................................................... 3
2.1.1 Statement Number............................................................................................................................................................. 52.2 Using the CHECK Function..........................................................................................................................................................5
2.2.1 Flow of Debugging..............................................................................................................................................................62.2.2 Output Message..................................................................................................................................................................62.2.3 Examples of Using the CHECK Function...............................................................................................................................72.2.4 Notes................................................................................................................................................................................ 11
2.3 Using the TRACE Function........................................................................................................................................................ 112.3.1 Flow of Debugging............................................................................................................................................................112.3.2 Trace Information............................................................................................................................................................. 122.3.3 Notes................................................................................................................................................................................ 14
2.4 Using the COUNT function........................................................................................................................................................162.4.1 Flow of Debugging............................................................................................................................................................162.4.2 Count Information.............................................................................................................................................................162.4.3 Debugging Programs with the COUNT Function................................................................................................................ 192.4.4 Notes................................................................................................................................................................................ 20
2.5 Using the Memory Check Function...........................................................................................................................................202.5.1 Flow of Debugging............................................................................................................................................................202.5.2 Output Message................................................................................................................................................................212.5.3 Identifying programs........................................................................................................................................................ 222.5.4 Notes................................................................................................................................................................................ 22
2.6 Using the COBOL Error Report.................................................................................................................................................. 222.6.1 COBOL Error Report overview............................................................................................................................................ 222.6.2 Resources used by the COBOL Error Report........................................................................................................................23
2.6.2.1 Programs....................................................................................................................................................................232.6.2.2 Relationships between compiler and linkage options and output information.......................................................... 232.6.2.3 Compiling and linking programs................................................................................................................................ 252.6.2.4 Location of the Debugging Information File and the Program Database File.............................................................26
2.6.3 Starting the COBOL Error Report........................................................................................................................................262.6.3.1 How to start the COBOL Error Report.......................................................................................................................... 262.6.3.2 Start parameter..........................................................................................................................................................26
2.6.4 Diagnostic Report............................................................................................................................................................. 282.6.4.1 Diagnostic report output destination......................................................................................................................... 282.6.4.2 Diagnostic report output information.........................................................................................................................29
2.6.5 Dump................................................................................................................................................................................352.6.5.1 What is dump?........................................................................................................................................................... 352.6.5.2 Dump output destination...........................................................................................................................................362.6.5.3 Managing the number of dump files..........................................................................................................................36
2.6.6 Notes................................................................................................................................................................................ 372.7 Debugging Using Compiler Listings and Debugging Tools.......................................................................................................38
- v -

2.7.1 Flow of Debugging............................................................................................................................................................382.7.2 Source Program Listing..................................................................................................................................................... 412.7.3 Object Program Listing..................................................................................................................................................... 422.7.4 Listings Relating to Data Areas......................................................................................................................................... 43
2.7.4.1 Data Map Listing........................................................................................................................................................442.7.4.2 Program Control Information Listing.......................................................................................................................... 472.7.4.3 Section Size Listing.....................................................................................................................................................50
2.7.5 Locating Errors(Program database file)............................................................................................................................ 502.7.6 Locating Errors (Link Map file)..........................................................................................................................................552.7.7 Researching Data Values...................................................................................................................................................582.7.8 Referencing calling source data at abnormal end and identifying the call location.......................................................... 62
Index................................................................................................................................................................................................. 65
- vi -

Chapter 1 Introduction to Debugging with NetCOBOLThe introduction gives you an overview of the debugging options available with NetCOBOL.
1.1 Debugging with NetCOBOLNetCOBOL provides debugging aids:
- NetCOBOL Studio debugging functions
- COBOL Debug Functions
The debugging function of NetCOBOL Studio is a full featured, interactive debugger that provides a rich set of functions to help youlocate bugs and analyze the behavior of your programs. It works on the executable code, in EXE or DLL format, so you are seeing thesame code execute that will be run when the applications are used in production. Working with the executable code also means thatmixed language debugging is straightforward. For more information on using the NetCOBOL Studio debugging function , refer to"NetCOBOL Studio User's Guide".
The COBOL debug functions include tracing of executed statements and checking for subscripts and modifiers going out of range, aswell as the ability to count executed statements. With these functions, you can determine the exact points at which abnormaltermination occurs and prevent programs from writing to memory outside their allotted range.
1.2 Features of the COBOL Debugging FunctionsThere are COBOL debugging functions as follows:
- TRACE
- CHECK
- COUNT
- Memory Check
- COBOL Error Report
- Compiler Listings and Debugging tool
These functions can be very useful in trapping problems that are difficult to reproduce in production situations.
1.2.1 TRACETRACE records the following information at program execution time:
- Results of executed statements
- Line number and position within line, of the statement causing abnormal termination.
- Program name being executed.
- Messages output during execution.
TRACE lets you check where abnormal termination is happening and the path taken to reach that point.
TRACE is enabled by specifying an option at compile time and providing specific details in environment variables at run time.
1.2.2 CHECKCHECK is also a compile time option. When set, the COBOL runtime system checks the following items:
- The subscript and the index boundaries, and reference modification
- Numeric data exceptions and divide-by-zero errors
- Parameters for calling a method
- 1 -

- Program calling conventions
A message is output when one of these items goes out of range.
A count can be specified so that the message is only displayed after a certain number of occurrences.
1.2.3 COUNTCOUNT records the following information at program execution time:
- The execution count for each statement written in a source program sequentially, along with the percentage of this executioncount to the total execution count for all the statements.
- The execution count by verb, along with the percentage of this execution count vs. the total execution count for all the statements.
COUNT lets you check all the routes the program has followed during execution.
1.2.4 Memory CheckWhen Memory Check is enabled by specifying environment variables, the COBOL runtime system checks the specified area. If the areahas been destroyed, the following information is output:
- Name of the program or method for which area destruction was detected
- Location where destruction was detected (procedure division start or end)
- Addresses of the destroyed area
Memory Check lets you check the program that destroyed the runtime system area.
1.2.5 COBOL Error ReportThe COBOL Error Report outputs diagnostic information for the following problems:
- Application errors
- Runtime messages of U-level
COBOL Error Report check lets you check which error has occurred and in which statement.
1.2.6 Compiler Listings and Debugging toolPrograms are debugged using the translation list and debugging tool.
- Retrieves the statement that the application terminated abnormally.
- Identifies the data that was referenced when the application terminated abnormally.
- 2 -

Chapter 2 NetCOBOL Debugging FunctionsThis chapter provides instructions on using the NetCOBOL debugging functions.
Outline of the debugging functions:
- Using the CHECK Function
- Using the TRACE Function
- Using the COUNT Function
- Using the Memory Check Function
- Using the COBOL Error Report
- Debugging Using Compiler Listings and Debugging Tool
2.1 Outline of the Debugging FunctionsSix types of debugging functions are available for COBOL:
- Tracing executed COBOL statements (TRACE function)
- Checking the referencing of an incorrect area, data exceptions, and parameters (CHECK function)
- Reporting the execution count for each statement sequentially, as well as by verb, along with percentage of these counts (COUNTfunction).
- Checking the runtime system area (Memory Check function)
- Generating diagnostic reports and dump on application errors and runtime messages (COBOL Error Report).
- Specific of the statement that terminated abnormally and data reference(debugging using an compilation listing and debuggingtool)
To use the debugging function, specify the compiler option for each desired debugging function at the compilation of the COBOLprogram, and specify the environment to operate the debugging function at the execution of the program. Table 2.1 Outline of the debugging functions and compiler options
Function Name Outline Compiler Option
CHECK function The following items are checked.
- Whether the subscript or the index addresses an area outside of the range of atable when that table is referenced
- Whether the reference modified exceeds the data length at referencemodification
- Whether the contents of the object word are correct when the data containingthe OCCURS DEPENDING ON clause is referenced
- Whether the numeric item contains a value of the type that is specified by theattribute.
- Whether the divisor in division is not zero.
- Whether, in an invoked method, the number of parameters and attributes fora calling method match those for a called method.
- Whether, in an invoked program, the calling conventions of a calling programmatch those of a called program.
- Whether, the number of parameters and length of the CALL statements matchthose of a called program.
CHECK
- 3 -

Function Name Outline Compiler Option
Purpose
- To prevent an operation error of the program due to a memory reference error
- To prevent erroneous numbers from causing a program to behave unexpectedly
- To prevent invalid parameters from causing a program to behave unexpectedly
TRACE function The following types of information are output:
- Tracing result of executed statements
- Line number and verb number of the statement that was executed at abnormaltermination
- Program name that contains the statements that were executed and programattribute information
- Message output during execution
Purpose
- To ascertain at which statement abnormal termination occurred
- To ascertain the path of the statements that were executed up to abnormaltermination
- To check the message output during execution
TRACE
COUNT function This function reports:
- The execution count for each statement in your program, sequentially, alongwith the percentage of this execution count vs. the total execution count for allthe statements.
- The execution count by verb that appears in your program, along with thepercentage of this count vs. the total execution count for all the statements.
Purpose
- To identify all the routes the program have followed during execution
- To improve the efficiency of your program
COUNT
Memory checkfunction
The following items are checked.
- The runtime system area is checked when the program and method proceduredivisions start and end. If the area has been destroyed, the followinginformation is output.
- Name of the program or method for which area destruction was detected
- Location where destruction was detected (procedure division start or end)
- Addresses of the destroyed area
Purpose
- To identify the program that destroyed the runtime system area.
-
COBOL ErrorReport
This function reports the following information :
- Error type (Exception code or runtime message)
- Problem location (Module name, program name, source file name, line number)
- Calling path
- System information
TEST
- 4 -

Function Name Outline Compiler Option
- Environment variable
- Runtime environment information
- Process list
- Module list
- Thread information
Moreover, the dump is output.
Purpose
- To identify which error has occurred and in which statement
- To identify the calling path for the programs run until errors occurred
- To identify the status of applications or the computer in effect when errorsoccurred
DebuggingUsing CompilerListings andDebugging Tool
The following compiler listings are output:
- Object program listing
- Data map listing
- Source program listing
Purpose
- To determine at which statement the abnormal termination occurred
- To identify the data that was referenced when the program terminatedabnormally
LIST
-P
SOURCE
COPY
MAP
Note
You cannot use the TRACE and COUNT functions at the same time.
2.1.1 Statement NumberA statement number described in the subsequent explanation indicates the following expression:
line-number
Refer to "SOURCE(Whether a source program listing should be output)" in the "NetCOBOL User's Guide".
line-number
When compiler option NUMBER is selected, the format is "[COPY-qualification-value-]user-line-number" and when NONUMBER isselected, the format is "[COPY-qualification-value-]sequence-number-in-file."
The sequence number in the file is the value assigned in ascending order by the compiler, starting from "1" as the first line in thefile and incrementing by 1 for each line.
2.2 Using the CHECK FunctionThe CHECK function checks the following items. If the function detects an abnormality, it writes a message and terminates abnormally.Therefore, program operation errors can be prevented.
- Subscripts, indexes and reference modification outside their range
- Numeric data exceptions and zero divisor check
- 5 -

- Parameters for calling a method
- Internal program call parameters
- External program call parameters
This section describes how to use the CHECK function.
2.2.1 Flow of DebuggingThe following section shows the flow of debugging operation when using the CHECK function.
Figure 2.1 Flow of debugging with CHECK function
2.2.2 Output MessageIf the CHECK function checks and detects an abnormality, it will generate a message. This message is usually output to the messagebox.
While the messages that are generated by the CHECK function normally have the severity code E, the severity code changes to U whenthe message output count equals a predetermined value. (For more information about severity codes, refer to "NetCOBOL Messages".)
The CHECK(PRM) internal program call parameter produces a diagnostic message at compilation if it determines an error in the callingstructure parameters, but it does not check the number of times specified (n,PRM) for runtime message output.
- 6 -

Message Output Count
Specify a message count in compiler option CHECK at compile time. If one run unit contains two or more COBOL programs whichhad the CHECK option specified, the number of messages specified with the compile option for the program that is activated firstwill be used. The message count can be changed at execution time by using execution time option c.
The following CHECK functions can be suppressed by specifying an execution time option. Plurals can be specified.
- noc : Suppress all of the CHECK functions
- nocb : Suppress CHECK(BOUND)
- noci : Suppress CHECK(ICONF)
- nocn : Suppress CHECK(NUMERIC)
- nocp : Suppress CHECK(PRM)
Program execution continues until the message count reaches the specified count. Refer to "Format of Runtime Options" in the"NetCOBOL User's Guide" for more information.
2.2.3 Examples of Using the CHECK Function
Checking Reference Modification
Program A
000000 @OPTIONS CHECK(BOUND)
:
000500 77 data-1 PIC X(12).
000600 77 data-2 PIC X(12).
000700 77 length-to-be-referenced PIC 9(4) BINARY.
:
001100 MOVE 10 TO length-to-be-referenced.
001200 MOVE data-1 (1:length-to-be-referenced) TO data-2 (4:length-to-be-referenced).
:
The following message is written for data-2 when the MOVE statement on line 1200 is executed:
JMP0821I-E/U [PID:xxxxxxxx TID:xxxxxxxx] REFERENCE MODIFIER IS OUT OF RANGE. PGM=A. LINE=1200.1.
OPD=data-2.
Checking Subscripts and Indexes
Program A
000000 @OPTIONS CHECK(BOUND)
:
000500 77 subscript PIC S9(4).
000600 01 dtable.
000700 02 table-1 OCCURS 10 TIMES INDEXED BY index-1.
000800 03 element-1 PIC X(5).
:
001100 MOVE 15 TO subscript.
001200 ADD 1 TO element-1(subscript).
001300 SET index-1 TO 0.
001400 SUBTRACT 1 FROM element-1(index-1).
:
When the ADD/SUBTRACT statement is executed, the following message is written:
JMP0820I-E/U [PID:xxxxxxxx TID:xxxxxxxx] SUBSCRIPT/INDEX IS OUT OF RANGE. PGM=A. LINE=1200.
OPD=element-1
JMP0820I-E/U [PID:xxxxxxxx TID:xxxxxxxx] SUBSCRIPT/INDEX IS OUT OF RANGE. PGM=A. LINE=1400.
OPD=element-1
- 7 -

Checking Target Words of the OCCURS DEPENDING ON Clause
Program A
000000 @OPTIONS CHECK(BOUND)
:
000050 77 subscript PIC S9(4).
000060 77 cnt PIC S9(4).
000070 01 dtable.
000080 02 table-1 OCCURS 1 TO 10 TIMES DEPENDING ON cnt.
000090 03 element-1 PIC X(5).
:
000110 MOVE 5 TO subscript.
000120 MOVE 25 TO cnt.
000130 MOVE "ABCDE" TO element-1(subscript).
:
The following message is written for the count:
JMP0822I-E/U [PID:xxxxxxxx TID:xxxxxxxx] ODO OBJECT VALUE IS OUT OF RANGE. PGM=A. LINE=120.
OPD=element-1. ODO=cnt.
Checking Numeric Data Exceptions
Program A
000000 @OPTIONS CHECK(NUMERIC)
:
000050 01 CHAR PIC X(4) VALUE "ABCD".
000060 01 EXTERNAL-DECIMAL REDEFINES CHAR PIC S9(4).
000070 01 NUM PIC S9(4).
:
000150 MOVE EXTERNAL-DECIMAL TO NUM.
:
For EXTERNAL-DECIMAL, the following message will appear.
JMP08281-E/U [PID:xxxxxxxx TID:xxxxxxxx] INVALID VALUE SPECIFIED. PGM=A. LINE=150. OPD= EXTERNAL-
DECIMAL
Checking a zero divisor
Program A
000000 @OPTIONS CHECK(NUMERIC)
:
000060 01 DIVIDEND PIC S9(8) BINARY VALUE 1234.
000070 01 DIVISOR PIC S9(4) BINARY VALUE 0.
000080 01 RESULT PIC S9(4) BINARY VALUE 0.
:
000150 COMPUTE RESULT = DIVIDEND / DIVISOR.
:
For the DIVISOR, the following message will appear.
JMP08291-E/U [PID:xxxxxxxx TID:xxxxxxxx] DIVIDED BY ZERO. PGM=A. LINE=150. OPD= DIVISOR
Checking parameters for calling a method
Program A
000000 @OPTIONS CHECK(ICONF)
000010 PROGRAM-ID. A.
:
- 8 -

000030 01 PRM-01 PIC X(9).
000040 01 0BJ-U USAGE IS OBJECT REFERENCE.
:
000060 SET OBJ-U TO B.
000070 INVOKE OBJ-U "C" USING BY REFERENCE PRM-01.
Class B/Method C
000010 CLASS-ID. B.
:
000030 FACTORY.
000040 PROCEDURE DIVISION.
:
000060 METHOD-ID.C.
:
000080 LINKAGE SECTION.
000090 01 PRM-01 PIC 9(9) PACKED-DECIMAL.
000100 PROCEDURE DIVISION USING PRM-01.
:
The following message is written when the INVOKE statement of program A is executed:
JMP08101-E/U [PID:xxxxxxxx TID:xxxxxxxx] FAILURE IN USING PARAMETER OF THE 'C' METHOD. PARAMETER=1.
PGM=A LINE=70.
Internal program call parameter investigation
Program A
000001 @OPTIONS CHECK(PRM)
000002 PROGRAM-ID. A.
000003 ENVIRONMENT DIVISION.
000004 CONFIGURATION SECTION.
000005 REPOSITORY.
000006 CLASS CLASS1.
000007 DATA DIVISION.
000008 WORKING-STORAGE SECTION.
000009 01 P1 PIC X(20).
000010 01 P2 PIC X(10).
000011 01 P3 USAGE OBJECT REFERENCE CLASS1.
000012 PROCEDURE DIVISION.
000013 CALL "SUB1" USING P1 P2 *> JMN3333I-S
000014 CALL "SUB2" *> JMN3414I-S
000015 CALL "SUB1" USING P1 RETURNING P2 *> JMN3508I-S
000016 CALL "SUB1" USING P2 *> JMN3335I-S
000017 CALL "SUB3" USING P3 *> JMN3334I-S
000018 EXIT PROGRAM.
000019*
000020 PROGRAM-ID. SUB1.
000021 DATA DIVISION.
000022 LINKAGE SECTION.
000023 01 L1 PIC X(20).
000024 PROCEDURE DIVISION USING L1.
000025 END PROGRAM SUB1.
000026*
000027 PROGRAM-ID. SUB2.
000028 DATA DIVISION.
000029 LINKAGE SECTION.
000030 01 RET PIC X(10).
000031 PROCEDURE DIVISION RETURNING RET.
000032 END PROGRAM SUB2.
000033*
000034 PROGRAM-ID. SUB3.
000035 DATA DIVISION.
- 9 -

000036 LINKAGE SECTION.
000037 01 L-OR1 USAGE OBJECT REFERENCE.
000038 PROCEDURE DIVISION USING L-OR1.
000039 END PROGRAM SUB3.
000040 END PROGRAM A.
When you compile program A, the following diagnostic message is output at the time of compilation.
** DIAGNOSTIC MESSAGE ** (A)
13: JMN3333I-S THE NUMBER OF PARAMETERSPECIFIED IN USING PHRASE OF CALL STATEMENT MUST BE THE SAME
NUMBER OF PARAMETER SPECIFIED IN USING PHRASE OF PROCEDURE DIVISION.
14: JMN3414I-S RETURNING ITEM MUST BE SPECIFIED FOR CALL STATEMENT WHICH CALLS 'SUB2'. THERE IS
RETURNING SPECIFICATION IN PROCEDURE DIVISION OF PROGRAM 'SUB2'.
15: JMN3508I-S RETURNING ITEM MUST NOT BE SPECIFIED FOR CALL STATEMENT WHICH CALLS 'SUB1'. THERE IS
NOT RETURNING SPECIFICATION IN PROCEDURE DIVISION OF PROGRAM 'SUB1'.
16: JMN3335I-S THE LENGTH OF PARAMETER 'P2' SPECIFIED IN USING PHRASE OR RETURNING PHRASE OF CALL
STATEMENT MUST BE THE SAME LENGTH OF PARAMETER 'L1' SPECIFIED IN PROCEDURE DIVISION USING PHRASE OR
RETURNING PHRASE OF PROGRAM 'SUB1'.
17: JMN3334I-S THE TYPE OF PARAMETER 'P3' SPECIFIED IN USING PHRASE OR RETURNING PHRASE OF CALL
STATEMENT MUST BE THE SAME TYPE OF PARAMETER 'L-OR1' SPECIFIED IN PROCEDURE DIVISION USING PHRASE OR
RETURNING PHRASE OF PROGRAM 'SUB3'.
STATISTICS: HIGHEST SEVERITY CODE=S, PROGRAM UNIT=1
External program call parameter investigation
In a program invocation, an error in passing parameters causes a program malfunction because the program refers to or updates anunexpected data item or area.
When a COBOL program compiled by specifying a CHECK(PRM) compile option calls another COBOL program compiled in the sameway, a message is output if the lengths of each of the parameters do not match.
000010 @OPTIONS CHECK(PRM)
000020 IDENTIFICATION DIVISION.
000030 PROGRAM-ID. A.
000040 DATA DIVISION.
000050 WORKING-STORAGE SECTION.
000060 01 USE-PRM01 PIC 9(04).
000070 01 USE-PRM02 PIC 9(04).
000080 01 RET-PRM01 PIC 9(04).
000090 PROCEDURE DIVISION.
000100 CALL 'B' USING USE-PRM01 USE-PRM02
000110 RETURNING RET-PRM01.
000120 END PROGRAM A.
000000 @OPTIONS CHECK(PRM)
000010 IDENTIFICATION DIVISION.
000020 PROGRAM-ID. B.
000030 DATA DIVISION.
000070 LINKAGE SECTION.
000080 01 USE-PRM01 PIC 9(08).
000090 01 USE-PRM02 PIC 9(04).
000100 01 RET-PRM01 PIC 9(04).
000120 PROCEDURE DIVISION USING USE-PRM01 USE-PRM02
000130 RETURNING RET-PRM01.
000140 END PROGRAM B.
When the CALL statement in program A is executed, the following message is output:
JMP0812I-E/U [PID:xxxxxxxx TID:xxxxxxxx] FAILURE IN 'USING 1ST PARAMETER' OF CALL STATEMENT. PGM=A.
LINE=10.
- 10 -

2.2.4 NotesYou should consider the following things when using the CHECK function.
- Always use the CHECK function and correct abnormalities based on the detected information. If a detected abnormality is notcorrected, serious trouble that can be difficult to detect, such as memory destruction, can occur at execution. The results ofexecuting applications for which detected abnormalities have not been corrected will be unpredictable. Execution can be continued after an abnormality is detected by specifying a message output count, however, operation afterdetection of an abnormality cannot be guaranteed.
- The CHECK function performs processing other than the processing described in the COBOL program such as checking data.Therefore, the program size increases and execution speed deteriorates when the CHECK function is used.
- Use the CHECK function during debugging only. When debugging is completed, recompile the program with compiler optionNOCHECK specified.
- In arithmetic statements with an ON SIZE ERROR or NOT ON SIZE ERROR phrase, CHECK(NUMERIC) does not check for a zero divisoras the COBOL code already handles that situation.
- If zero-divisor checking is performed, the program terminates abnormally, regardless of the specification of the message outputcount.
- CHECK(PRM) does not investigate CALL statements that specify identifiers as program names.
- CHECK(PRM) does not perform an investigation when an internal program is called by a CALL statement in which the programname is specified in an identifier.
- Both of the calling and called programs must be compiled with the CHECK(PRM) option in order to check parameters for callingexternal programs. A parameter check is not exercised if a program calls a program written in another language or is called by aprogram written in another language.
- In a CHECK(PRM) investigation for calling an external program an error is not always found if the difference in the number ofcalling and called parameters is more than 3.
- In the checks performed when CHECK(PRM) is specified, the parameter length of a variable-length item is the maximum length,not the length at the time of execution. Therefore, for a variable-length item, a message may be output even if the parameterlengths actually match.
- If a calling or called program does not specify a RETURNING phrase, the PROGRAM-STATUS is passed implicitly. Therefore theCHECK(PRM) checks will find a 8-byte RETURNING parameter in these situations where the RETURNING phrase is omitted.
- The CHECK function is effective only in programs that specify the CHECK option. When two or more programs are linked, onlyspecify the CHECK option in the programs that you want to target.
2.3 Using the TRACE FunctionThe TRACE function outputs trace information for the COBOL statements that have been executed up to program abnormal termination.
This section describes how to use the TRACE function.
2.3.1 Flow of DebuggingThe following section shows the flow of debugging operation when using the TRACE function:
- 11 -

Figure 2.2 Flow of debugging with TRACE function
2.3.2 Trace InformationThe TRACE function writes the statement numbers of COBOL statements that were executed, up to abnormal termination, as traceinformation.
Number of Trace Information Items
When compiler option TRACE is specified without specifying the number of information items at compile time, up to 200 traceinformation items are produced.
If one run unit contains two or more COBOL programs which had the TRACE option specified, the number specified with the TRACEoption for the program that is activated first will be used.
To change the number of trace items to be generated, use the execution-time option r. The TRACE function can be suppressed byspecifying execution time option nor. Refer to "Format of Runtime Options" in the "NetCOBOL User's Guide" for more information.
Note
Zero cannot be specified for the number of trace information items.
- 12 -

Trace Information Storage Destination
Trace information is stored in files specified in the environment variable information @CBR_TRACE_FILE. Refer to "@CBR_TRACE_FILE(Specify the trace information output file)" in the "NetCOBOL User's Guide".
If the environment variable information @CBR_TRACE_FILE is not specified, trace information is stored in files named after theexecutable file with the extensions TRC and TRO.
The trace information is always stored in a file with the extension TRC. When the number of stored information items reaches thespecified count at compilation or execution, the contents of the file with the extension TRC are converted to a file with the extensionTRO.
Examples of trace information storage file names that are assumed when the environment variable information @CBR_TRACE_FILEis specified and when it is not specified are provided below.
Example
If C:\PROG1.TRC is specified in the environment variable information @CBR_TRACE_FILE
- Trace information storage destination (current information): C:\PROG1.TRC
- Trace information storage destination (information on the previous generation): C:\PROG1.TRO
If the environment variable information @CBR_TRACE_FILE is not specified
- Executable program storage destination: C:\PROG2.EXE
- Trace information storage destination (current information): C:\PROG2.TRC
- Trace information storage destination (information on the previous generation): C:\PROG2.TRO
Output Format of Trace Information
The output format of trace information is shown below.
NetCOBOL DEBUG INFORMATION DATE 2007-07-04 TIME 11:39:22
PID=00000123 (1)
TRACE INFORMATION
(2) (3) (4) (5) (6)
1 External-program-name [Internal-program-name] Compilation-date TID=00000099
2 (7) 1100.1 TID=00000099
3 1200.1 TID=00000099
4 1300.1 TID=00000099
5 (8) 1300.2 (9) (5)
6 Class-name [Method-name] Compilation-date TID=00000099
7 2100.1 TID=00000099
8 2200.1 TID=00000099
9 JMPnnnnI-x xxxxxxxxx xx xxxxxxxxx. (10)
10 THE INTERRUPTION WAS OCCURRED.PID=00000123,... (11)
11 EXIT-THREAD TID=00000099 (12)
:
- [1] Process ID (hexadecimal notation): The process identification number assigned by the operating system when the programwas run.
- [2] Trace information sequence number (decimal notation): The value is incremented whenever trace information output isdisplayed. Since trace information is overwritten to two files alternately, this value indicates the sequence number of theinformation from the start of the program.
- [3] External program name: An external program name is output.
- [4] Internal program name: The name is the output when an internal program executes. This information is not displayed forexternal programs.
- [5] Compilation date: When an external program executes, the compilation date and time of the program are output.
- 13 -

- [6] Thread ID (hexadecimal notation): The thread identification number assigned by the operating system when the programwas run.
- [7] Statement or procedure-name/paragraph-name that was executed: The statement number of the statement, procedure name,or paragraph name that was executed is the output.
- [8] Class-name: A class-name is listed here. If an inheriting method is executed, the class-name of the parent that has definedthe procedures for the method will be listed.
- [9] Method-name: method-name is listed.
- [10] Execution-time message: If messages are generated by the runtime system during execution of the program, those messageswill be shown here.
- [11] Exception report message: This message is generated when an exception (such as a reference to an illegal address) hasbeen reported by the operating system. The message is not generated when the program has ended normally or when a U-levelerror has occurred.
- [12] Thread end report message: This message is generated when the program terminates normally and the thread has ended.
Trace Information File
The trace information file of each process is output. In order to prevent overwriting the results of each run with trace, change thename of the trace output file each time you execute the same program.
When the trace information file name of each process is changed, the environment variable information @CBR_TRACE_PROCESS_MODEis specified.
Refer to "@CBR_TRACE_PROCESS_MODE (Unique file name foe each Trace file output)" in the "NetCOBOL User's Guide" for the detail.
An example of the file name when @CBR_TRACE_PROCESS_MODE is specified is shown below.
Example
When the environment variable information @CBR_TRACE_PROCESS_MODE is specified
Executable file name:SAMPLE.EXE
Process-ID:00000EC4
Execution date:12/1/2010
Execution time:10:48:50
The newest trace information file name is :
SAMPLE-00000EC4_20100112_104850.TRC
The older trace information file name is :
SAMPLE-00000EC4_20100112_104850.TRO
2.3.3 NotesThis section provides you with some notes/suggestions you should take into account when you use the TRACE function.
Trace information can be collected only for COBOL programs compiled with compiler option TRACE specified.
- 14 -

Figure 2.3 Collecting TRACE information
- The TRACE function performs processing other than the processing described in the COBOL program, such as collection of traceinformation. Therefore, the program size increases and the execution speed deteriorates when the TRACE function is used.
- Use the TRACE function during debugging only. When debugging is completed, recompile the program with compiler optionNOTRACE specified.
- The number of trace information items cannot be set to 0.
- When the TRACE function is selected, trace information is generated regardless of whether the program terminated normally orabnormally.
- When a program is executed again while a trace information file exists, the contents of the original trace information file will belost.
- When a trace information file is no longer needed, delete the file.
- No exception report message may be generated when the TRACE function is used in conjunction with the debugging function ofNetCOBOL Studio.
- No information is included in a trace information file that identifies a prototype-declared method.
- In referencing the statement number of a method, reference the class name and the method name to determine whether themethod has been separated by a prototype declaration. With a separated method, the statement number is expressed by theline number of the source file of the separated method, not by the line number of the class definition source file.
- A trace information file is output for each executable file processed. Information cannot be output from two or more processes to the same file at the same time- this will produce an output error atexecution time.In order to prevent overwriting the results of each run with trace, change the name of the trace output file each time you executethe same program.
- 15 -

2.4 Using the COUNT functionThe COUNT function provides the ability to report the execution count for each statement written in a source program sequentially,along with the percentage of one count vs. another for all the statements. In addition, it shows the count by verb along with itspercentage. The COUNT function enables the user to know exactly how many times each statement is executed and helps to optimizeprograms.
2.4.1 Flow of DebuggingThe following section shows the flow of debugging operation when using the COUNT function.
Figure 2.4 Flow of debugging with COUNT function
2.4.2 Count InformationWhen the compile option COUNT is enabled, the data will be written to a file specified in the environment variable name SYSCOUNT.
Output Format of Count Information
The output format of count information is shown below:
[1]
NetCOBOL COUNT INFORMATION(END OF RUN UNIT) DATE 2007-07-04 TIME 20:45:21
PID:00000123 TID:00000099
[2]
STATEMENT EXECUTION COUNT PROGRAM-NAME : COUNT-PROGRAM
- 16 -

[3] [5] [6]
STATEMENT [4] EXECUTION PERCENTAGE
NUMBER PROCEDURE-NAME/VERB-ID COUNT (%)
------------- --------------------------- ----------------- -----------
15 PROCEDURE DIVISION COUNT-PROGRAM
17 DISPLAY 1 14.2857
19 CALL 1 14.2857
21 DISPLAY 1 14.2857
23 STOP RUN 1 14.2857
31 PROCEDURE DIVISION INTERNAL-PROGRAM
33 DISPLAY 1 14.2857
35 INVOKE 1 14.2857
37 EXIT PROGRAM 1 14.2857
------------- --------------------------- ----------------- -----------
7
[7]
VERB EXECUTION COUNT PROGRAM-NAME : COUNT-PROGRAM
[11] [13]
[8] [9] [10] PERCENTAGE [12] PERCENTAGE
VERB-ID ACTIVE VERB TOTAL VERB (%) EXECUTION COUNT (%)
------------ -------- ---------- -------- ------------------ --------
CALL 1 1 100.0000 1 25.0000
DISPLAY 2 2 100.0000 2 50.0000
STOP RUN 1 1 100.0000 1 25.0000
------------ -------- ---------- -------- ------------------ --------
4 4 100.0000 4
[7]
VERB EXECUTION COUNT PROGRAM-NAME : COUNT-PROGRAM
(INTERNAL-PROGRAM)
[11] [13]
[8] [9] [10] PERCENTAGE [12] PERCENTAGE
VERB-ID ACTIVE VERB TOTAL VERB (%) EXECUTION COUNT (%)
------------ -------- ---------- -------- ------------------ --------
DISPLAY 1 1 100.0000 1 33.3333
EXIT PROGRAM 1 1 100.0000 1 33.3333
INVOKE 1 1 100.0000 1 33.3333
------------ -------- ---------- -------- ------------------ --------
3 3 100.0000 3
[14]
PROGRAM EXECUTION COUNT PROGRAM-NAME : COUNT-PROGRAM
[18] [20]
[15] [16] [17] PERCENTAGE [19] PERCENTAGE
PROGRAM NAME ACTIVE VERB TOTAL VERB (%) EXECUTION COUNT (%)
----------- ---------- ----------- --------- --------------- ----------
COUNT-PROGRAM 4 4 100.0000 4 57.1429
INTERNAL 3 3 100.0000 3 42.8571
----------- ---------- ----------- --------- --------------- ----------
7 7 100.0000 7
[1]
NetCOBOL COUNT INFORMATION(END OF RUN UNIT) DATE 2007-07-04 TIME 20:45:21
PID=00000123 TID=00000099
[2]
STATEMENT EXECUTION COUNT CLASS-NAME : COUNT-CLASS
[3] [5] [6]
STATEMENT [4] EXECUTION PERCENTAGE
NUMBER PROCEDURE-NAME/VERB-ID COUNT (%)
------------- --------------------------- ----------------- -----------
15 PROCEDURE DIVISION COUNT-METHOD
16 DISPLAY 1 50.0000
37 EXIT PROGRAM 1 50.0000
------------- --------------------------- ----------------- -----------
2
[7]
- 17 -

VERB EXECUTION COUNT CLASS-NAME : COUNT-CLASS
METHOD-NAME : COUNT-METHOD
[11] [13]
[8] [9] [10] PERCENTAGE [12] PERCENTAGE
VERB-ID ACTIVE VERB TOTAL VERB (%) EXECUTION COUNT (%)
------------ -------- ---------- -------- ------------------ --------
DISPLAY 1 1 100.0000 1 50.0000
END METHOD 1 1 100.0000 1 50.0000
------------ -------- ---------- -------- ------------------ --------
2 2 100.0000 2
[14]
VERB EXECUTION COUNT CLASS-NAME : COUNT-CLASS
[18] [20]
[15] [16] [17] PERCENTAGE [19] PERCENTAGE
VERB-ID ACTIVE VERB TOTAL VERB (%) EXECUTION COUNT (%)
------------ -------- ---------- -------- ------------------ --------
COUNT METHOD 2 2 100.0000 2 100.0000
------------ -------- ---------- -------- ------------------ --------
2 2 100.0000 2
[21]
PROGRAM/CLASS/PROTOTYPE METHOD EXECUTION COUNT
[22] [25] [27]
PROGRAM/CLASS [23] [24] PERCENTAGE [26] PERCENTAGE
/METHOD-NAME ACTIVE VERB TOTAL VERB (%) EXECUTION COUNT (%)
------------ ----------- ---------- ---------- ---------------- ---------
COUNT PROGRAM 7 7 100.0000 7 100.0000
COUNT CLASS 2 2 100.0000 2 100.0000
------------ ----------- ---------- ---------- ---------------- ---------
9 9 100.000 9
- [1] Indicates that this is an output file for the COUNT function. In the parentheses, the stage when this report is generated willbe denoted. There are four stages when this report could be generated:
- END OF RUN UNIT
Upon completion of a COBOL run unit (i.e., at the time a STOP RUN statement or an EXIT PROGRAM statement of a mainprogram is executed), a report is produced.
- ABNORMAL END
When the program ends abnormally, a report is produced.
- END OF INITIAL PROGRAM
Upon completion of a program that has the INITIAL attribute, a report is produced. Upon completion of the internal program,however, no report will be produced.
- CANCEL PROGRAM
When a program that has the compile option COUNT enabled is canceled by a CANCEL statement, a report is produced. Uponcompletion of an internal program, however, no report will be produced.
- [2] The execution counts of source program images are listed here. Execution counts are shown by compilation unit of a sourceprogram. If a compilation unit is a program, PROGRAM-NAME shows an external program-name. In case of a class, CLASS-NAMEshows a class-name. In case of a method, CLASS-NAME shows a class-name and METHOD-NAME shows a method-name.
- [3] Statement-numbers appear in the following format:
[COPY qualifying value-] line number
If one line contains two or more statements, the same line number will be assigned to the second and succeeding statements.
- [4] Procedure names and statements are shown here. At the top of the procedure division, "PROCEDURE DIVISION" is followed bya program-name or method-name.
- [5] Statement execution counts are shown here. At the end, the total of those execution counts is calculated.
- 18 -

- [6] Percentage of the execution count for one specific statement vs. all executed statements.
- [7] Execution counts by verb are listed here. Verb execution counts are shown by program unit or method unit. For programshaving internal programs or for classes having two or more methods, therefore, two or more listings of execution counts by verbwill appear. PROGRAM-NAME denotes a program-name in the following format:
PROGRAM-NAME: program-name
[(called internal program)]
- [8] Lists verbs in alphabetical order. Verbs to be listed here are those coded in the corresponding programs.
- [9] The number of imperatives actually executed among those written in the source program.
- [10] The total number of the verbs of that type found in the source program.
- [11] Percentage of those verbs actually executed vs. the total, using the following formula: [9] / [10] * 100.
- [12] Execution counts for each verb. At the bottom, the total of those execution counts is indicated.
- [13] Percentage of the execution count for a specific verb vs. that for all, using the following formula: each verb's execution count/total execution count * 100.
- [14] Execution counts by program or by method are listed here. This list is generated when a class or program has an internalprogram.
- [15] Program- or method-names in the order listed in the source program.
- [16] The number of verbs actually executed among those found in the source program.
- [17] The total number of verbs of that type found in the source program.
- [18] Percentage of actually executed verbs vs. the total number of verbs of that type, using the following formula: [16] / [17] *100.
- [19] Verb execution counts by program or method. At the bottom, the total of those execution counts is indicated.
- [20] For each program or method, the percentage of actually executed verbs vs. the total number of the verbs of that type, usingthe following formula: verb execution count for each program (or method)/total verb execution counts for all programs (ormethods) * 100.
- [21] Verb execution counts by source program (compilation unit) are listed here. If one run unit has two or more source programs(or compilation units), the above-mentioned data repeatedly appear for each of such programs.
- [22] Names of external programs, classes, and prototype methods.
- [23] Refer to [16].
- [24] Refer to [17].
- [25] Refer to [18].
- [26] Verb execution counts for each compilation unit. At the end, the total of those counts is indicated.
- [27] Percentage of the verb execution counts for each compilation unit vs. that for all the compilation units. This is obtained bycalculating the following: verb execution count for each compilation unit / verb execution count for all the compilation units *100.
2.4.3 Debugging Programs with the COUNT FunctionYou can utilize the COUNT function to debug your program for the following purposes:
- To check all the routes the program follows:
The listings generated by the COUNT function shows how many times statements were actually executed. This information allowsyou to check all the possible routes your program would follow.
- 19 -

- To improve the efficiency of your program
The listings generated by the COUNT function shows the percentage of execution counts for each statement and the percentageof verb execution counts by program unit. This enables you to identify frequently used portions of your program. Optimizing theseportions will allow you to improve the efficiency of your program.
2.4.4 NotesThis section provides you with some notes/suggestions you should take into account when you use the COUNT function.
- The COUNT function performs tasks not described by COBOL statements, such as gathering COUNT information. When this functionis used, it will increase your program in size and slow down its executing speed. Therefore, it is recommended to use this only fordebugging activities. Debugged programs should be recompiled with the compile option NOCOUNT specified.
- If a file is produced due to the abnormal termination of a program, the statement that has caused it will be included in the report.
- If a CANCEL statement is executed, COUNT information for the program to be canceled will be written. If the canceled programcalls another program, COUNT information for the latter program will be shown under the calling program.
- You should specify the SYSCOUNT environment variable to define an output file name.
- When an application called from a different language program terminates abnormally , the COUNT information might not beoutput.
- COUNT information is output to the output file specified for environment variable SYSCOUNT. It cannot be output from two or moreprocesses to the same file at the same time - this will produce an output error at execution time. Change the output file name ofeach process when you execute two or more processes at the same time.
2.5 Using the Memory Check FunctionThe memory check function is used to diagnose memory area destruction when a COBOL application is executed. The memory checkfunction checks the runtime system area at the start and end of the procedure division of a COBOL application. If the following runtimemessages are output or event occurs, the area may have been destroyed. Therefore, use the memory check function to check for thecause of memory destruction.
- JMP0009I-U INSUFFICIENT STORAGE AVAILABLE. (*1)
- JMP0010I-U LIBRARY WORK AREA IS BROKEN.
- An application error occurred (access violation).
*1 : This message can also be output even when virtual memory is not insufficient. Refer to "Virtual memory shortages" in the"NetCOBOL User's Guide".
When using the memory check function, specify environment variable information @CBR_MEMORY_CHECK=MODE1.
Refer to "@CBR_MEMORY_CHECK (Specify the inspection using the memory check function)" in the "NetCOBOL User's Guide".
2.5.1 Flow of DebuggingThe following section shows the flow of debugging operation when using the memory check function.
- 20 -

Figure 2.5 Flow of debugging with memory check function
2.5.2 Output MessageThe memory check function outputs the following messages when area destruction is detected. The messages are usually output tothe message box.
The following describes the messages of the memory check function:
When area destruction is detected at the start of a procedure division of a program or method
JMP0071I-U
[PID:xxxxxxxx TID:xxxxxxxx] LIBRARY WORK AREA DESTRUCTION WAS DETECTED. START PGM=program-nameBRKADR=leading-address-of-destroyed-area
If area destruction is detected for a method, PGM=program-name will be replaced by CLASS=class-name METHOD=method-name.
When area destruction is detected at the end of a procedure division of a program or method
JMP0071I-U
- 21 -

[PID:xxxxxxxx TID:xxxxxxxx] LIBRARY WORK AREA DESTRUCTION WAS DETECTED . END PGM=program-nameBRKADR=leading-address-of-destroyed-area
If area destruction is detected for a method, PGM=program-name will be replaced by CLASS=class-name METHOD=method-name.
2.5.3 Identifying programsThe following shows how to identify programs that caused area destruction.
Assume that an area destruction message is output for the following call relationship:
The memory check function checks the runtime system area at the start and end of the procedure division of a program. In thisexample, area destruction is not detected by the check at the start of the procedure division of COBOL program A or by the check atthe start of the procedure division of COBOL program B. Area destruction is detected by the check at the start of the procedure divisionof COBOL program C. Accordingly, area destruction occurred before invoking COBOL program C after the check at the start of theprocedure division of COBOL program B.
2.5.4 NotesThe memory check function checks the runtime system area at the start and end of the procedure division of a program. As a result,the execution speed will be slower. When debugging ends, disable the memory check function (environment variable information@CBR_MEMORY_CHECK).
2.6 Using the COBOL Error ReportThis section explains the outline and the usage of COBOL Error Report.
2.6.1 COBOL Error Report overviewThe COBOL Error Report outputs diagnostic information for the following problems:
- Application errors
- Runtime messages of U-level
The COBOL Error Report outputs error information such as the location where the error occurred, program calling relationship, andapplication state. The COBOL Error Report uses COBOL language-level information such as the program name and line number tooutput the error information.
The COBOL Error Report outputs Dump for the following problems:
- Application errors except a stack overflow exception (0xC00000FD)
- 22 -

- Runtime messages of U-level
- JMP0009I-U
- JMP0010I-U
- JMP0370I-U
The COBOL Error Report can also be used for troubleshooting when the application error or runtime messages occurred when operating.
The COBOL Error Report has the following features:
- The COBOL Error Report works directly on operational modules without having to reconfigure the application to use it.
- COBOL Language level information can be output by using the debugging information file and program database file.
2.6.2 Resources used by the COBOL Error ReportThis section focuses on the programs and resources the COBOL Error Report uses to generate diagnostic reports.
2.6.2.1 ProgramsFor application errors and runtime messages of U-level errors, the COBOL Error Report is enabled while the COBOL runtime environmentis open. Hence, the COBOL Error Report works on the following kinds of programs:
- COBOL programs
- Non-COBOL programs linked with a COBOL program
2.6.2.2 Relationships between compiler and linkage options and output informationThere are no special constraints on creating programs to be the object of the COBOL Error Report. The COBOL Error Report will generatea diagnostic report on any program as long as it is a COBOL program. The coverage of information in the diagnostic report, however,varies with each combination of compiler and linkage options specified. A summary of the correspondence between the possiblecombinations of compiler and linkage options and output information in the diagnostic report is given in "Table 2.2 Relationshipsbetween COBOL programs and output information". Table 2.2 Relationships between COBOL programs and output information
Step Details [1] [2] [3] [4] [5] [6]
Compiling Specification of the TEST option No No Yes Yes Yes Yes
Linkage Specification of the /DEBUG options No Yes No No Yes Yes
Execution Availability of a debugging informationfile
No No Yes No No Yes
Availability of a program database file No Yes No No Yes Yes
Diagnostics Information level Export name +Offset
Yes Yes Yes Yes Yes Yes
Symbol name +Offset
No Yes No No Yes Yes
Program name +Line number
No No No No No Yes
For details about export and symbol names, refer to "Export relative position" and "Symbol relative position" of "2.6.4.2 Diagnosticreport output information".
The level of information output to the diagnostic report is determined by the compilation, linkage, and run conditions.
For example, if no option is specified at compilation and linkage (conditions of column [1]), information of the "Export name + Offset"level will be output to the diagnostic report.
If COBOL language-level information such as the program name and line number is output to the diagnostic report, statements thatcause problems can be easily identified. Therefore, it is recommended that options be specified at compilation and linkage and that
- 23 -

applications be executed where the COBOL Error Report can access the debugging information file and the program databasefile(conditions of column [6]).
When the COBOL Error Report can output information to the language-level, items of information are generated in the form of thefollowing examples.
Example
Output example: In case of [6] in "Table 2.2 Relationships between COBOL programs and output information"
Module File : D:\APL\SAMPDLL2.dll
Section Relative Position : .text+0000025D
Export Relative Position : SAMPDLL2+00000229
Symbol Relative Position : SAMPDLL2+0000025D
Compilation Information : ASCII, SINGLE THREAD, NOOPTIMIZE
External Program/Class : SAMPDLL2
Source File : SAMPDLL2.cob
Source Line : 35
The COBOL Error Report will not generate language-level information when it examines the following kinds of programs but will stillgenerate the export and symbol names and their offsets from the beginning:
- A program in which neither a compiler option nor a linkage option is specified
- When the COBOL Error Report cannot read the debugging information file and the program database file at execution time evenif you specify both the compiler option and the linkage option
The export name, the symbol name, and the offset from each head are generated in the form of the following examples.
Example
Output example: Only the export name and the offset (In case of [1][3][4] in "Table 2.2 Relationships between COBOL programs andoutput information")
Module File : D:\APL\SAMPDLL2.dll
Section Relative Position : .text+0000025D
Export Relative Position : SAMPDLL2+00000229
Output example: Symbol name and offset (In case of [2][5] in "Table 2.2 Relationships between COBOL programs and outputinformation")
Module File : D:\APL\SAMPDLL2.dll
Section Relative Position : .text+0000025D
Export Relative Position : SAMPDLL2+00000229
Symbol Relative Position : SAMPDLL2+0000025D
Since export and symbol names each represent a compilation unit, they can easily be identified without needing language-levelinformation output at execution time.
At this level, an object program listing is required to locate problems. The object program listing is created when the compiler optionsLIST and PRINT are specified at compilation. Refer to "LIST (Determines whether to output the object program listings)" and "-P(Compiler listing file name)" in the "NetCOBOL User's Guide".
An example of an object program listing is shown below. A summary method of locating problems from export and symbol namerelative offsets is described below.
ADDR OBJECT CODE LABEL INSTRUCTION
BEGINNING OF SAMPDLL2
BEGINNING OF SAMPDLL2
BEGINNING OF ENTRY POINT CODE
[1] -> 000000000000 3100
- 24 -

000000000002 0800
000000000004 53414D50444C4C32
"SAMPDLL2"
00000000000C 08
00000000000D 4E6574434F424F4C
"NetCOBOL"
000000000015 07
000000000016 5631302E322E30
"V10.2.0"
00000000001D 3230313030323231
"20100221"
000000000025 3133303631343030
"13061400"
00000000002D 2B30303030
000000000032 30313031
000000000036 CCCC
GLB.1
SAMPDLL2:
[2] -> 000000000038 48894C2408 mov qword ptr [rsp+0x08],rcx
00000000003D 4889542410 mov qword ptr [rsp+0x10],rdx
000000000042 4C89442418 mov qword ptr [rsp+0x18],r8
000000000047 4C894C2420 mov qword ptr [rsp+0x20],r9
00000000004C 55 push rbp
00000000004D 4889E5 mov rbp,rsp
Omitted
A symbol name + offset 0 are located at [1] in the list above. Symbol name relative offsets, therefore, match the output offsets in theobject program listing. Given a symbol name relative offset and an object program listing, problems can be easily located.
An export name + offset 0 are located at [2] in the list. Knowledge of the differences between [1] and [2] is essential to locatingproblems from an object program listing on the basis of export name relative offsets. In this example, an export name relative offsetplus 38 (hexadecimal) matches the offset in the object program listing.
2.6.2.3 Compiling and linking programsTo allow the COBOL Error Report to generate language-level information, it is necessary to specify an option when compiling andlinking programs.
The compiler options that are specified at program compile time are described below.
(Use of the compiler Visual C++ is assumed for this example, for non-COBOL programs.)
COBOL programs: TEST
C/C++ programs: There is no compiler option to specify for the COBOL Error Report
Specify the compiler option TEST to compile COBOL source programs. If TEST is specified, the compiler generates information in theobject file for use by the COBOL Error Report and creates a debugging information file at the same time. The debugging informationfile is named after the COBOL source file name with its extension changed to SVD.
The compiler option OPTIMIZE may be specified together with the compiler option TEST to direct optimization. The debugginginformation file created when both TEST and OPTIMIZE are specified is smaller than that created when only TEST is specified, becausethe amount of information written to the debugging information file is limited by both compiler options TEST and OPTIMIZE.
Note
The debugging information file created by having the compiler option OPTIMIZE specified cannot be used with the debugger ofNetCOBOL Studio.
The linkage options specified at program linkage time are shown below.
/DEBUG
- 25 -

Specify the linkage options /DEBUG to link object files of COBOL and non-COBOL programs. When this option is specified, the linkerdirects the information generated by the compiler in the object file to a Program database file.
2.6.2.4 Location of the Debugging Information File and the Program Database FileTo allow the COBOL Error Report to generate the language-level information, it is necessary to store the debugging information fileand the Program database file in the same folder as an executable file and the dynamic link library.
Store the debugging information file and the Program database file in the operation machine together with an executable file andthe dynamic link library when you use the COBOL Error Report by operating environment. When the debugging information file andthe Program database file do not exist, the COBOL Error Report outputs the assembler-level information composed of export name,symbol name and offset. Refer to "2.6.2.2 Relationships between compiler and linkage options and output information" for outputinformation on the COBOL Error Report.
2.6.3 Starting the COBOL Error Report
2.6.3.1 How to start the COBOL Error ReportWhen an application error or U-level runtime message occurs, the COBOL Error Report detects the error and starts automatically.
Environment variable @CBR_JUSTINTIME_DEBUG can be used to control starting of the COBOL Error Report. When@CBR_JUSTINTIME_DEBUG has not been set, the COBOL Error Report will be started as the default. Refer to "@CBR_JUSTINTIME_DEBUG(Specify inspection using the COBOL Error Report at abnormal termination)" in the "NetCOBOL User's Guide".
2.6.3.2 Start parameterThe format of the start parameters is shown below. In the example below, the COBOL Error Report is directed to change the outputfolder of the report file and report event occurrence to an event log file.
Example
@CBR_JUSTINTIME_DEBUG=ALLERR, SNAP -r c:\log -l
Table 2.3 Start parameters
Specification format Description
-d { YES | NO } Specifies whether to output the dump.
- YES : Output the dump.
- NO : Do not output the dump.
If this parameter is omitted, the defaults is YES.
-i {0 | 1 | 2} Specifies the output contents.
- 2 : Output the environment variable information, initial file name and the contents of variousinformation files.
- 1 : Output the environment variable information and initial file name.
- 0 : Do not output the environment variable information or initial file name.
Omitting this start parameter defaults to 2.
-o folder-name Specifies the output destination folder for the dump file as either an absolute path or a relative path.
Specify an existing folder. (*)
A relative path specifies a folder relative to where the executable file exists.
If the specified folder does not exist and output is not possible, the dump file is output to the standardoutput destination folder.
- 26 -

Specification format Description
If this start parameter is omitted, the dump file is output to the standard output destination folder.
Refer to "2.6.5.2 Dump output destination" for information concerning the standard outputdestination folder.
-r folder-name Specifies the output destination folder for the diagnostic report file as either an absolute path or arelative path.
Specify an existing folder. (*)
A relative path locates the diagnostic report file output destination folder relative to the folder inwhich the executable file exists.
If the specified output destination folder does not exist and output is not possible, the diagnosticreport file is output to the standard output destination folder.
Similarly, if this start parameter is omitted, the diagnostic report file is output to the standard outputdestination folder.
Refer to "2.6.4.1 Diagnostic report output destination" for information concerning the standardoutput destination folder.
-l [computer-name] Specifies that the occurrence of each application error or runtime message be written to an eventlog. If a computer name is specified, the occurrence is written to the event log of the specifiedcomputer.
If a computer name is not specified, the occurrence is written to the event log of the computer wherethe problem occurred.
-s output-unit-count Specifies the size for outputting to the stack dump as the output unit count (1 unit: 1024 bytes).
Specify a value greater than 0 for the output unit count.
- 0: Output all stack contents.
- 1 or greater: Output stack contents having a size of the specified value ´ 1024 bytes.
Omitting this start parameter defaults to 2.
* : The following access authority to Everyone group is necessary for the folder.
- Modify
- Read & execute
- List folder contents
- Read
- Write
Note
- Start parameters are handled the same way whether they are preceded with a hyphen (-) or slash (/).
- The parameter name that follows the first character of an initial name is case-insensitive.
- Spaces may or may not intervene between a parameter name and the operand.
- When two or more start parameters are specified, they must be separated from one another by at least one blank.
- When a folder name appearing in a parameter contains a blank, the folder name must be enclosed with quotation marks (").When a folder name begins with a hyphen (-), it must also be enclosed with quotation marks (").
- 27 -

Information
If the start parameters -l is omitted, the occurrence of an application error or a runtime message will be reported to the computer onwhich the problem occurred via the message box.
2.6.4 Diagnostic Report
2.6.4.1 Diagnostic report output destinationThe COBOL Error Report writes diagnostic information to a report file.
The report file name is "Applicaton-name_ProcessID_Error-occurrence-time" with the extension LOG.
Example
Application name : TESTPGM.EXE
Process ID : 2D8
Error occurrence time : 2009.07.10 15:04:26
Diagnostic report file name : TESTPGM_2D8_20090710-150426.LOG
The standard output destination for diagnostic reports is \Fujitsu\NetCOBOL\COBSNAP under the user common application data folder(the folder on each computer where application-specific data is stored).
Generally the diagnostic reports output destination is created using the following names:
C:\ProgramData\Fujitsu\NetCOBOL\COBSNAP
To change the output destination folder, specify the "-r" start parameter. Refer to "2.6.3.2 Start parameter" for details of startparameters.
Note
The user common application data folder is usually a read-only folder. The following access authority to the Everyone group is necessaryfor the folder that outputs the diagnostic report.
- Modify
- Read & execute
- List folder contents
- Read
- Write
The COBOL Error Report writes the occurrence of each event to the message box and to the application event log file.
In the message box, a message indicating the event occurrence and a message inquiring whether to open the diagnostics report areoutput. Clicking the [Yes] button in the message box opens the diagnostics report.
Note
If the application is operated as a background service, the diagnostic report cannot be opened from the message box.
Each event log is designated by NetCOBOL SNAP x64 as a source name, a message number as an event ID, a severity code as a type,and a message body as an explanation. The severity codes of the COBOL Error Report messages and the event log types are associatedas shown below to accommodate differences in level classifications between the system and the COBOL Error Report.
- 28 -

Table 2.4 Correspondence between the severity codes of COBOL Error Report messages and event log typesSeverity code Event log type
I (INFORMATION) INFORMATION
W (WARNING) WARNING
E (ERROR)
U (UNRECOVERABLE) ERROR
The event occurrence report is directed by default to the message box. Use the start parameter -l to change the destination. For detailsabout the start parameters, refer to "2.6.3.2 Start parameter".
If diagnostic report output fails, for example, due to inadequate disk space, an error message is issued to the event output destination.
Note
Many services do not perform I-O from screens. If event logs are used under a service that does not perform I-O from screens, specifythe "-l" start parameter and specify the event log as the event notification destination.
2.6.4.2 Diagnostic report output informationThe COBOL Error Report generates the following items of information in a diagnostic report:
Summary
A summary of the diagnostic information
- Event detected
A diagnostic report always begins with the following line:
The application error occurred:
or
The COBOL runtime message occurred:
- Application
The application name (absolute path name format) and process ID (hexadecimal)
- Exception number
When an application error occurs, an exception code (hexadecimal) and exception name are generated. For details about theexception code and exception name, refer to "Table 2.5 Exception codes and exception names". When a runtime message occurs,its body is generated.
- Generation time
The date and time when the error occurred is generated.
- Generation module
The name of the module in which the error occurred (absolute path name), its creation time, and file size are generated.
Detail
The location at which the error occurred is generated.
- Thread ID
The thread ID (hexadecimal) of the thread in which the error occurred
- Register
A listing of the register values (hexadecimal) in effect when the error occurred
- 29 -

- Stack commit
The state of the stack (all in hexadecimal) when the error occurred
- Commit size
Allocated stack size (Commit size = top address - base address)
- Top address
Highest-order address of stack
- Base address
Lowest-order address of allocated stack
- Instruction
The machine language codes (hexadecimal) 16 bytes before and after the error location
- Module file
The name, in absolute path format, of the module in which the error occurred
- Section relative position
The relative location (hexadecimal) of the module from the beginning of the .text section
- Export relative position
If the module has export information, the export name having its address closest to the error location and the relative value(hexadecimal) from the beginning of the export name are generated.
The export name of a COBOL program is shown below:
External program : External program name
ENTRY : Entry name
Class : _class name_FACTORY
Method : __class name_method name@###, or
__class name__ENTRY_method name@###
Method (PROPERTY): __class name__GET_method name@###,
__class name__SET_method name@###,
__class name__ENTRY__GET_method name@###, or
__class name__ENTRY__SET_method name@###
The export name of a non-COBOL program is shown below:
Function: Function name or function name@###
The "###" of "@###" following the method name or function name is a decimal value representing the parameter byte count.
When no symbol name or program name is generated, the compilation unit can be identified from the export name if an exportname has been defined for each compilation unit.
- Symbol relative position
If the program database file exists, the symbol name and the relative value (hexadecimal) from the beginning of the symbolname are generated.
The symbol name of a COBOL program is a compilation unit name. The compilation unit names of COBOL programs are shownbelow.
External program : External program name
Class : Class name
Method : Class name_method name
Method (PROPERTY): Class name_GET_method name , or
class name_SET_method name
- 30 -

- Compilation information
For a COBOL program, the information at program compilation is generated. For a non-COBOL program, this information is notgenerated.
- Code system (ASCII or Unicode)
- Object format (single thread or multithread)
- Optimization (OPTIMIZE or NOOPTIMIZE)
- Program name
For a COBOL program, the external program name or class name and the internal program name or method name are generated.For a non-COBOL program, the function name is generated.
- Source file
For a COBOL program, the name of the source file of the program that caused the error is generated. For a non-COBOL program,this information is not generated.
- Source line
For a COBOL program, the line number of the statement that caused the error is generated. For a non-COBOL program, thisinformation is not generated.
- Supplementary information
In a COBOL program, if an error is located in a statement in a declarative section procedure, the source statement branching tothe declarative section is listed; if not, no supplementary information is generated.
- Call stack
The calling path up to the program that caused the error is generated. If there is no debugging information file, the caller of theinternal program is not generated.
System information
General system information about the computer is generated.
- Computer name
- User name
- Windows version
- Version number
- Service pack
Command line
The command character string in effect when the application was run
Environment variable
The environment variable setting in effect when the application was run
Execution environment information
The items of COBOL execution environment information that are generated are listed below. If an initial file does not exist, "NONE"is generated in the place of the initial file name and the program name. If an initial file exists and the program is running in multithreadmode, "NONE" is generated in the place of the program name.
- Runtime system
The version and module type of COBOL runtime system.
- Runtime mode
The information at execution of the runtime system
- 31 -

- Code system (ASCII or Unicode)
- Operating mode (single thread or multithread)
- Program name
The main program of COBOL recognized by the runtime system (corresponds to the section name in the initial file)
- .CBR file
The name (absolute path name) and contents of the runtime initial file referenced by the runtime system
- Various information files
The names (absolute path name) and contents of the following information files
- Entry information file
- Logical destination definition file
- ODBC information file
- Print information file
Task list
A listing of the process IDs (hexadecimal) and application names of the tasks running on the system
Module list
A listing of each module loaded by the application, including the file name, version information, and creation time. Lists are generatedin the order in which the modules were loaded.
Stack summary
The summarized stack information is generated as follows: (No internal program stack information is generated.)
- Frame pointer
Leading address (hexadecimal) of the stack frame of the called program
- Return address
Return address (hexadecimal) of the called program
- Parameter
Parameters (hexadecimal) passed to the called program
- Module file name and program name
Module file name and program name of the called program
Stack dump
The contents of the stack when the error occurred are listed using hexadecimal and ASCII notation
Thread information
The items of information listed below are generated with regard to the threads other than the thread in which the error occurred.
- Thread ID
- Register
- Stack commit
- Module file
- Section relative position
- Export relative position
- 32 -

- Symbol relative position
- Compilation information
- Program name
- Source file
- Source line
- Call stack
- Stack summary
- Stack dump
The exception codes defined in the system and the exception names for the exception codes that are included in the diagnostic reportare listed in "Table 2.5 Exception codes and exception names". Table 2.5 Exception codes and exception names
Code Exception name
Explanation
C0000005 EXCEPTION_ACCESS_VIOLATION
The program attempted to read or write to a virtual address, but the program did not have theappropriate access authority.
C0000006 EXCEPTION_IN_PAGE_ERROR
The system failed to load a nonexistent page as the program attempted to access it.
C0000017 EXCEPTION_NO_MEMORY
It failed in the allocation of the memory because of memory shortage or the heap destruction.
C000001D EXCEPTION_ILLEGAL_INSTRUCTION
The program attempted to execute an instruction undefined in the processor.
C0000025 EXCEPTION_NONCOUNTINUABLE_EXCEPTION
The program attempted to rerun in the wake of an irrecoverable exception.
C0000026 EXCEPTION_INVALID_DISPOSITION
An exception handler returned an invalid array to the exception dispatcher.
C000008C EXCEPTION_ARRAY_BOUNDS_EXCEEDED
An attempt by the program to access an array out of bounds was detected by the hardware.
C000008D EXCEPTION_FLT_DENORMAL_OPERAND
One of the operands of a floating-point arithmetic calculation is abnormal. This value is too lowto be represented as a standard floating-point value.
C000008E EXCEPTON_FLT_DIVIDE_BY_ZERO
The program attempted to divide a given floating-point value by a floating-point value of 0.
C000008F EXCEPTION_FLT_INEXACT_RESULT
The result of a floating-point arithmetic calculation cannot be accurately represented as adecimal.
C0000090 EXCEPTION_FLT_INVALID_OPERATION
This exception represents a floating-point exception other than the one defined in this table.
C0000091 EXCEPTION_FLT_OVERFLOW
- 33 -

Code Exception name
Explanation
The value of the exponent part of a floating-point arithmetic calculation exceeds the upper limitof the corresponding type.
C0000092 EXCEPTION_FLT_STACK_CHECK
A stack overflow or underflow resulted from a floating-point arithmetic calculation.
C0000093 EXCEPTION_FLT_UNDERFLOW
The value of the exponent part of a floating-point arithmetic calculation exceeds the lower limitof the corresponding type.
C0000094 EXCEPTION_INT_DIVIDE_BY_ZERO
The program attempted to divide an integer by 0.
C0000095 EXCEPTION_INT_OVERFLOW
The most significant bit of an integer calculation overflowed.
C0000096 EXCEPTION_PRIV_INSTRUCTION
The program attempted to execute an instruction but the calculation is not supported in thecurrent machine mode.
C00000FD EXCEPTION_STACK_OVERFLOW
A stack overflow occurred.
Common application errors in COBOL applications are access violation errors (EXCEPTION_ACCESS_VIOLATION) and zero division errors(EXCEPTION_INT_DIVIDE_BY_ZERO). The following are the possible causes of access violation errors:
- Subscript or index values are outside the scope.
- Reference modification pointer values are outside the scope.
- The calling conventions or number of parameters between calling and called programs did not match.
The CHECK function can be used to easily detect these errors. If an error occurs, use the CHECK function to check. Refer to "2.2 Usingthe CHECK Function".
The output format of the source file names and line numbers of COBOL programs varies depending on the specification of the compileroptions NUMBER and OPTIMIZE. The relationships between the compiler options and output formats are summarized in "Table 2.6Compiler options and output formats". Table 2.6 Compiler options and output formats
Output object NOOPTIMIZE option OPTIMIZE option
NUMBER/NONUMBER options NUMBER option NONUMBER option
Source filename
Source file File name only
Library file File name only Not generated File name only
Path of libraryreading
The file name of the library fileread, the file name of thesource file, and the linenumbers in the source file aregenerated up to the end of thecalling path (*3).
Not generated (sourcefile name generated).(*4)
The file name of the library fileread and that of the source fileare output, but not the sourceline numbers (*5).
Linenumbers
In the entry code(*1)
IN ENTRY-CODE
- 34 -

Output object NOOPTIMIZE option OPTIMIZE option
NUMBER/NONUMBER options NUMBER option NONUMBER option
In the exit code(*2)
IN EXIT-CODE
Statement File-relative-line-number [in-line-sequence-number]
[COPY-qualification-value-]editor-line-number(NUMBER)(*6)
File-relative-line-number
[Supplementation with term]
- *1
"In the entry code" means the range of the entry code of the program from the position PROLOGUEAD: +4 (hexadecimal) to ENDOF PROGRAM INITIALIZE ROUTINE in the object program listing.
- *2
"In the exit code" means the range of the exit code of the program from the position BEGINNING OF GOBACK COMMON ROUTINEto END OF GOBACK COMMON ROUTINE in the object program listing.
[Output Sample]
- *3
Source File: CPY2.cbl <- CPY1.cbl <- SRC.cob
Source Line: 86 <- 55 <- 127
- *4
Source File: SRC.cob
Source Line: 2-8600 (NUMBER)
- *5
Source File: CPY2.cbl <- SRC.cob
Source Line: 86
- *6
An identifier (NUMBER) placed right after a line number identifies the line number as an editor line number or as a file relativeline number.
Source Line: 95100 (NUMBER)
2.6.5 Dump
2.6.5.1 What is dump?A dump records the memory contents when an error occurs. This information is a valuable resource for investigating the cause of theerror.
The COBOL Error Report outputs the memory contents to a dump file when specific application errors and U level runtime messagesare issued.
To suppress dump output, specify "-d NO" in the start parameters.
Information
Without dump information the time required to identify the causes of errors maybe increased, and problems may become long-term.It is recommended that dump output be enabled.
- 35 -

Dumps are read in by WinDbg (debug tool provided by Microsoft) and other debuggers and consequently can be used duringdebugging. Refer to the WinDbg help for information on using WinDbg.
2.6.5.2 Dump output destinationThe dump file name is "Application-name_ProcessID_Error-occurrence-time_COBSNAP" with the extension "DMP".
Example
Application name : TESTPGM.EXE
Process ID : 2D8
Error occurrence time : 2009.07.10 15:04:26
Dump file name : TESTPGM_2D8_20090710-150426_COBSNAP.DMP
The standard output destination for dumps is \Fujitsu\NetCOBOL\COBSNAP under the user common application data folder (the folderon each computer where application-specific data is stored).
Generally the dump output destination is created using the following names:
C:\ProgramData\Fujitsu\NetCOBOL\COBSNAP
To change the output destination folder, specify the "-o" start parameter. Refer to "Table 2.3 Start parameters" for details of startparameters.
Note
- The user common application data folder is normally a read-only folder. However, the dump standard output destination folderis generated as a folder that has the following access permissions set for the Everyone group:
- Modify
- Read & execute
- List folder contents
- Read
- Write
- Any user who can access the computer can reference the dump standard output destination folder. Depending on the applicationspecifications and its operation, the dump may contain personal information or confidential data. Thoroughly investigate theoperational safety of the dump output destination folder from the perspective of security and data protection. If necessary, specifythe "-o" start parameter and change the dump output destination folder. If dump output is not required, specify "-d NO" to suppressdump output.Refer to "Table 2.3 Start parameters" for details of start parameters.
- The size of each dump file can be extremely large. Therefore, specify a drive folder that is guaranteed to have plenty of space asthe dump output destination.
- In the following cases, the dump file might not be output.
- The COBOL program terminated abnormally while the system was loading.
- The COBOL program was linked to the other languages and it terminated abnormally.
2.6.5.3 Managing the number of dump filesThe upper limit for the number of dump files created by the COBOL Error Report is 10 per folder.
When the COBOL Error Report creates a dump file if there already are 10 files in the folder, it deletes the file with the oldest date.
- 36 -

2.6.6 NotesThis section presents notes on using the COBOL Error Report.
- In addition to the COBOL Error Report, the following functions launch automatically when application errors occur:
- Visual C++ Just-in-Time Debugger
- Windows Error Reports
Even though these functions are preprogrammed to launch on occurrence of application errors, the COBOL Error Report will launchif its startup is specified.
- The COBOL Error Report cannot be used while an application is being debugged using the debugging function of NetCOBOL Studio,or Visual C++ debugger or is being executed on Systemwalker.
- The COBOL Error Report will not be launched if the application itself handles application errors by using an exception handler forstructured exception handling. This applies to, for example, applications linked to non-COBOL programs that have an exceptionhandler and applications called from server programs such as a Web server that has an exception handler.
- The COBOL Error Report will not be launched from the system successfully if a stack overflow exception (0xC00000FD) occurs. Ifdiagnostic information about the error is desired, refer to followings:
- Windows Error Reports
- Statements in a program compiled with the compiler option OPTIMIZE specified may be moved or deleted by the compiler. Hence,inaccurate line numbers may be generated.
- If the following error message is output in the diagnostic report, the description method of the source file is incorrect.
"Outputting the language image information for this program failed because the information on
program '$1' in the debugging information file '$2' contains an error."
- $1: Program name
- $2: Debugging information file name
To solve this problem, check the following and change the source file. If the problem is not solved, contact technical support.
- When the program includes the library text that contains the following by the COPY statement
- Whole program definition (From IDENTIFICATION DIVISION to END PROGRAM)
- Whole factory definition (From IDENTIFICATION DIVISION to END FACTORY)
- Whole object definition (From IDENTIFICATION DIVISION to END OBJECT)
- Whole method definition (From IDENTIFICATION DIVISION to END METHOD)
It evades by describing the statements described in the above-mentioned library text directly in the program that includesthe library text.
- When the last line in the library text to describe, and to include the COPY statement into procedure part is out-of-line PERFORMstatement
It evades by describing the CONTINUE statement etc. at the end of the library text.
- When the COPY statement is described in procedure part, and neither the COPY statement the last line of procedure part northe END PROGARM statement are described
It evades by describing the END PROGARM statement in the program that describes the COPY statement.
- When the out-of-line PERFORM statement just behind the out-of-line PERFORM statement the last line in the library text todescribe, and to include the COPY statement into procedure part, and the COPY statement
It evades by describing the CONTINUE statement etc. just behind the end and the COPY statement of the library text.
- 37 -

- When the initial line of the COPY statement just behind the EXIT statement or the EXIT PROGRAM statement and the EXITMETHOD statement, and the taken library text describes the COPY statement in procedure part, and is section-name orparagraph-names
Section-name or paragraph-name is not an initial line of the library text, and is evaded by describing it in the program thattakes the library text.
2.7 Debugging Using Compiler Listings and Debugging ToolsThis section explains how to debug using the compiler listings and debugging tools below after an abnormal termination.
Compiler listings
- Object program listing, Source program listing
For determining the location of the error.
- Data Map Listing
For referencing data content at the time of the abnormal termination.
Debugging tools
- WinDbg (Debugging Tools for Windows - native x64)
This is a debug tool provided by Microsoft.
Debugging Tools for Windows - native x64 is information published on the Microsoft home page.
- Windows Error Reports
Crash dumps are collected by the system WER function.
Other files
- Either of the following files output when linking
- Program database file (.PDB) (When /DEBUG option is specified, output it.)
- Link MAP file (.MAP) (When /MAP option is specified, output it.)
- Clash dump
- Crash dump made by WER (Windows Error Report) function.
2.7.1 Flow of DebuggingThe flow of using compiler listings and debugging tools to locate an error is shown below.
- 38 -

Figure 2.6 Flow of debugging using an Object Program Listing
* : It is recommended that NONUMBER (default value) be made effective when the OBOL source is translated. The followingexplanations assume and describe the case where NONUMBER is effectively translated.
A file relationship diagram is shown below.
- 39 -

Figure 2.7 A file relationship diagram
Note
- Please refer to the section "2.6.5 Dump" for the method of outputting the crash dump.
- The data that can be referred when terminating abnormally is data used in the method that programs or terminates abnormallyterminate abnormally, and data of caller. The data of the program and the method that doesn't appear to "Call Stack" of WinDdbgcannot be referred to.
- Data might not be able to be referred to correctly for the program or the method from which OPTIMIZE of the assembler optionis effectively translated because no storage of the execution result in the area and the statement might be moved and be deletedby optimization.
- Because data might be stored in the register to confirm data, the knowledge of the assembler is necessary. The knowledge of theassembler is debugged and it is possible to debug it by machine instruction by using, and outputting Object Program Listingwhen translating. Please refer to the section "2.7.3 Object Program Listing" for the form of Object Program Listing.
- 40 -

- Inner program is not correctly output to "Call Stack". Please reproduce the same situation by using the debugging function ofNetCOBOL Studio when you want to output a correct call relation.
2.7.2 Source Program ListingWhen the compile option SOURCE is specified, a source program listing is generated in the compiler list file. In addition, when thecompiler option COPY is specified, library text fetched by the COPY statement is generated in the source program listing.
Source program listing output format
The output format of the source program listing is shown below.
LINE SEQNO A B
[1] [2]
1 000100 IDENTIFICATION DIVISION.
2 000200 PROGRAM-ID. A.
3 000300*
4 000400 DATA DIVISION.
5 000500 WORKING-STORAGE SECTION.
6 000600 COPY A1.
1-1 C 000600 77 answer PIC 9(2).
1-2 C 000700 77 divisor PIC 9(2).
1-3 C 000800 77 dividend PIC 9(2).
7 000900*
8 001000 PROCEDURE DIVISION.
9 001100*
10 001200 MOVE 10 TO dividend.
11 001300 MOVE 0 TO divisor.
12 001400*
13 001500 COMPUTE answer = dividend / divisor.
14 001600*
15 001700 EXIT PROGRAM.
16 001800 END PROGRAM A.
- [1] Line number
Line numbers are displayed in either of the following formats:
1. If the compiler option NUMBER is enabled
[COPY-qualification-value-]user-line-number
- COPY-qualification-value
The identification number that is assigned to the library text included in the source program or to a line having asequence number not in ascending order. COPY-qualification-value is assigned to COPY instructions or sequencenumbers not in ascending order in single unit steps beginning with 1.
- User-line-number
The value of the sequence number area in the source program. If a non-numeric character is included in the sequencenumber area, the sequence number of the line is changed to the immediately preceding, valid sequence number plus1. When the same sequence number appears in sequence, it is accepted without assuming it is invalid.
2. If the compiler option NONUMBER is enabled
[COPY-qualification-value-]source-file-relative-number
- COPY-qualification-value
The identification number that is assigned to the library text included in the source program. COPY-qualification-valueis assigned to COPY instructions in single unit steps beginning with 1.
- 41 -

- source-file-relative-number
The compiler assigns line numbers as source-file-relative-number in ascending order in single unit steps beginningwith 1. Source-file-relative-number is also assigned to source files included with a COPY instruction in single unit stepsbeginning with 1, with "C" inserted between the line number and the source program to designate an inclusion of asource file.
- [2] Source program itself.
2.7.3 Object Program ListingWhen the compile option LIST is specified, an object program listing is generated in the compiler list file.
If the compiler option NOOPTIMIZE is enabled (default)
[1] [2] [3]
ADDRESS OBJECT CODE LABEL INSTRUCTION
GLB.9 [4]
--- 10 --- [5] MOVE [6]
0000000003E0 66C783E40100003130 mov word ptr [rbx+0x000001E4],0x3031 dividend
--- 11 --- MOVE
0000000003E9 66C783E20100003030 mov word ptr [rbx+0x000001E2],0x3030 divisor
--- 13 --- COMPUTE
0000000003F2 0FB693E5010000 movzx edx,byte ptr [rbx+0x000001E5] dividend +1
0000000003F9 440FB683E4010000 movzx r8d,byte ptr [rbx+0x000001E4] dividend
000000000401 4183E00F and r8d,0x0F
000000000405 4F8D0480 lea r8,[r8+r8*4]
000000000409 83E20F and edx,0x0F
00000000040C 4E8D3C42 lea r15,[rdx+r8*2]
000000000410 0FB693E3010000 movzx edx,byte ptr [rbx+0x000001E3] divisor +1
000000000417 440FB683E2010000 movzx r8d,byte ptr [rbx+0x000001E2] divisor
00000000041F 4183E00F and r8d,0x0F
000000000423 4F8D0480 lea r8,[r8+r8*4]
000000000427 83E20F and edx,0x0F
00000000042A 4E8D3442 lea r14,[rdx+r8*2]
00000000042E 4C89F8 mov rax,r15
000000000431 4899 cqo
000000000433 49F7FE idiv r14
000000000436 4989C5 mov r13,rax
000000000439 49C7C764000000 mov r15,0x00000064
000000000440 4C89E8 mov rax,r13
000000000443 4C89EA mov rdx,r13
000000000446 4C89E9 mov rcx,r13
000000000449 48F7D9 neg rcx
00000000044C 4983FD00 cmp r13,0x00
000000000450 480F4CC1 cmovnge rax,rcx
000000000454 4C39F8 cmp rax,r15
000000000457 7C08 jl 0x000000000461 GLB.10
000000000459 4C89E8 mov rax,r13
00000000045C 4899 cqo
00000000045E 49F7FF idiv r15
GLB.10
000000000461 4989D4 mov r12,rdx
000000000464 664489A42496000000 mov word ptr [rsp+0x00000096],r12w TRLP+0
00000000046D 480FBF842496000000 movsx rax,word ptr [rsp+0x00000096] TRLP+0
000000000476 4989C2 mov r10,rax
000000000479 49C1FA3F sar r10,0x3F
00000000047D 4983FA00 cmp r10,0x00
000000000481 790A jns 0x00000000048D GLB.11
000000000483 49F7DA neg r10
000000000486 48F7D8 neg rax
000000000489 4983DA00 sbb r10,0x00
- 42 -
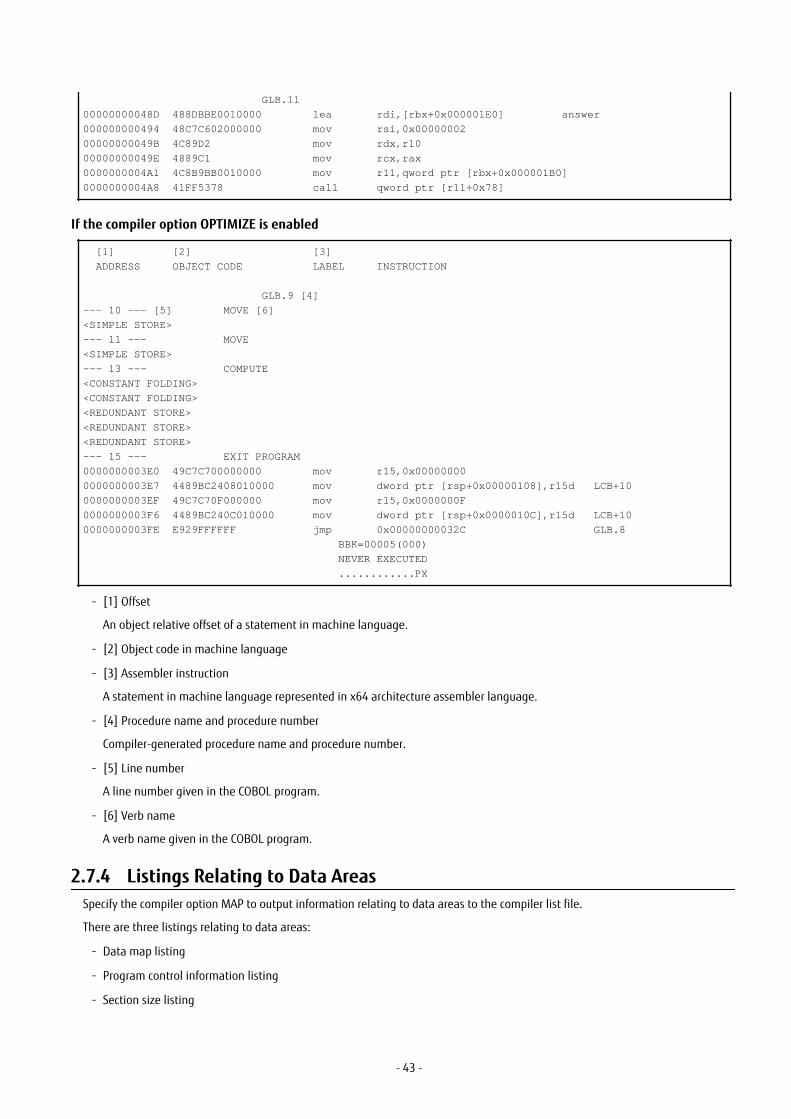
GLB.11
00000000048D 488DBBE0010000 lea rdi,[rbx+0x000001E0] answer
000000000494 48C7C602000000 mov rsi,0x00000002
00000000049B 4C89D2 mov rdx,r10
00000000049E 4889C1 mov rcx,rax
0000000004A1 4C8B9BB0010000 mov r11,qword ptr [rbx+0x000001B0]
0000000004A8 41FF5378 call qword ptr [r11+0x78]
If the compiler option OPTIMIZE is enabled
[1] [2] [3]
ADDRESS OBJECT CODE LABEL INSTRUCTION
GLB.9 [4]
--- 10 --- [5] MOVE [6]
<SIMPLE STORE>
--- 11 --- MOVE
<SIMPLE STORE>
--- 13 --- COMPUTE
<CONSTANT FOLDING>
<CONSTANT FOLDING>
<REDUNDANT STORE>
<REDUNDANT STORE>
<REDUNDANT STORE>
--- 15 --- EXIT PROGRAM
0000000003E0 49C7C700000000 mov r15,0x00000000
0000000003E7 4489BC2408010000 mov dword ptr [rsp+0x00000108],r15d LCB+10
0000000003EF 49C7C70F000000 mov r15,0x0000000F
0000000003F6 4489BC240C010000 mov dword ptr [rsp+0x0000010C],r15d LCB+10
0000000003FE E929FFFFFF jmp 0x00000000032C GLB.8
BBK=00005(000)
NEVER EXECUTED
............PX
- [1] Offset
An object relative offset of a statement in machine language.
- [2] Object code in machine language
- [3] Assembler instruction
A statement in machine language represented in x64 architecture assembler language.
- [4] Procedure name and procedure number
Compiler-generated procedure name and procedure number.
- [5] Line number
A line number given in the COBOL program.
- [6] Verb name
A verb name given in the COBOL program.
2.7.4 Listings Relating to Data AreasSpecify the compiler option MAP to output information relating to data areas to the compiler list file.
There are three listings relating to data areas:
- Data map listing
- Program control information listing
- Section size listing
- 43 -

2.7.4.1 Data Map Listing
Format of Data Map Listing
[1] [2] [3] [4] [5] [6] [7] [8] [9] [12]
LINE ADDR OFFSET REC-OFFSET LVL NAME LENGTH ATTRIBUTE BASE DIM ENCODING
[10]**MAIN**
15 heap+00000240 FD OUTFILE LSAM BHG.000000
16 [heap+000001F8]+00000000 0 01 prt-rec 60 ALPHANUM BVA.000003 SJIS
18 heap+000003C0 0 77 answer 8 EXT-DEC BHG.000000
19 heap+000003C8 0 77 divisor 4 EXT-DEC BHG.000000
21 heap+00000040 0 01 CSTART 8 ALPHANUM BCO.000000 SJIS
22 heap-00000048 0 01 CEND 8 ALPHANUM BCO.000000 SJIS
23 heap-00000050 0 01 CRES 8 ALPHANUM BCO.000000 SJIS
25 [heap+000001E8]+00000000 0 01 dividend 2 EXT-DEC BVA.000001
[11]**SUB1**
48 [heap+000001F0]+00000000 0 01 disp 8 EXT-DEC BVA.000002
The data map listing provides data area allocation information and data attribute information for data defined in the source program'sDATA DIVISION (the WORKING-STORAGE SECTION, FILE SECTION, CONSTANT SECTION, LINKAGE SECTION, and REPORT SECTION).
The elements of the data map listing shown above are:
- [1] LINE
1. Displays the line number in the following format:
When the compiler option NUMBER is specified:
[COPY qualification value-] user-line-number
2. When the compiler option NONUMBER is specified:
For details on the COPY qualification value, user-line-number, and relative-line-number see "2.7.2 Source ProgramListing".
[COPY qualification value-] relative-line-number in source file
- [2] ADDR, OFFSET
The address displays the data item area allocated in the object program in the following format:
Section name + Relative address
Section name
Displays one of the following:
- rdat (.rodata)
- data (.data)
- stac (stack)
- heap (heap)
- hea2 (heap)
Relative address
Provides the relative address from the base address of the section.
If the section contains a pointer to the actual location of the data, then the location of the pointer is contained in squarebrackets ( [ ] ) followed by the offset of the actual data from the address contained in the pointer.
The method for referencing the data area depends on whether or not a pointer is involved:
- 44 -

1. If there is no pointer e.g. DATA1 has "heap+00000060" in the ADDR column:
Indicates that the data area DATA1 exists at the location 0x60 from the heap base address.
2. If a pointer is indicated e.g. DATA2 shows "[heap+0000007C]+0000000C" in the ADDR column:
An address is stored at the location 0x7C from the heap base address (in the example, this address is 000210e8). Thedata area DATA2 exists at the location 0x0C from this address (in the example, this is the location 0x000210e8+0x0c).
- [3] REC-OFFSET
Displays the offset in the record as a decimal number.
- [4] LVL
Displays the level number defined in the source program.
- [5] NAME
Displays the data name defined in the source program. This name is truncated at 30 bytes. The data name is displayed in uppercaseletters when the compiler option ALPHAL is specified.
- [6] LENGTH
Displays the length of data items as a decimal number.
Not displayed for file names.
- [7] ATTRIBUTE
Displays data attributes. These attributes and their meaning are listed in the Table below. Table 2.7 Meanings of displayed data attribute abbreviations
Displayed Data Attribute Meaning
GROUP-F Fixed-length group item
GROUP-V Variable-length group item
ALPHA Alphabetic
ALPHANUM Alphanumeric
AN-EDIT Alphanumeric edited
NUM-EDIT Numeric edited
- 45 -

Displayed Data Attribute Meaning
INDEX-DATA Index data
EXT-DEC Display decimal
INT-DEC Packed decimal
FLOAT-L Double-precision internal floating-point
FLOAT-S Single-precision internal floating-point
EXT-FLOAT External floating point
BINARY Binary
COMP-5 Binary
INT-BINARY int type binary data
INDEX-NAME Index name
INT-BOOLE Internal Boolean
EXT-BOOLE External Boolean
NATIONAL National
NAT-EDIT National edited
OBJ-REF Object reference
POINTER Pointer data
For file description entries, file types and access modes are abbreviated as in Table below: Table 2.8 Meanings of displayed file types/access mode abbreviations
Displayed Abbreviation Meaning
SSAM Sequential file, sequential access
LSAM Line sequential file, sequential access
RSAM Relative file, sequential access
RRAM Relative file, random access
RDAM Relative file, dynamic access
ISAM Indexed file, sequential access
IRAM Indexed file, random access
IDAM Indexed file, dynamic access
PSAM Presentation file, sequential access
- [8] BASE
Displays the base register and base position allocated to the data item.
- [9] DIM
Displays the number of dimensions of subscripting or indexing.
- [10] and [11] Program name
Displays the program name used as a delimiter in an internal program.
Note that, in a class definition, the delimiters for definitions are displayed as follows:
**Class name**
** FACTORY **
- 46 -

** OBJECT **
** MET (Method name)**
- [12] Encoding form
Displays the encoding forms of the following data items:
- ALPHANUM (Alphanumeric)
- AN-EDIT (Alphanumeric edited)
- NATIONAL (National)
- NAT-EDIT (National edited)
Displays the encoding forms using the following symbols:
- SJIS : Shift JIS
- UTF8 : UTF-8
- UTF16LE : UTF-16 little endian
- UTF16BE : UTF-16 big endian
- UTF32LE : UTF-32 little endian
- UTF32BE : UTF-32 big endian
2.7.4.2 Program Control Information Listing
Format of Program Control Information Listing
ADDR FIELD-NAME LENGTH
** GWA **
* GCB *
data+00000000 GCB FIXED AREA 8
* GMB *
data+00000008 GMB POINTERS AREA 376
data+00000008 VNAL 136
........ VNAS 0
data+00000090 VNAO 240
........ FARA 0
........ METHOD ADDRESS AREA 0
........ BEA 0
........ BEAD / BEAR 0
........ FMBE 0
........ GMB CONTROL BLOCKS AREA 0
........ STRONG TYPE AREA 0
........ FAI AREA 0
........ ATTR INFO FIXED AREA 0
........ REUSE INFO TABLE 0
........ METHOD TABLE 0
........ INTERFACE TABLE 0
........ METHOD COPY TABLE 0
........ IAI AREA 0
........ ATTR INFO FIXED AREA 0
........ REUSE INFO TABLE 0
........ METHOD TABLE 0
........ INTARFACE TABLE 0
........ METHOD COPY TABLE 0
........ INVOKE PARM INFO 0
........ AS MODIFY INFO 0
** COA **
* CCB *
- 47 -

rdat+00000000 CCB FIXED AREA 4
........ STANDARD CONSTANT AREA 0
* CMB *
........ CMB POINTERS AREA 0
........ BEAI 0
........ BVAI 0
........ IPA 0
rdat+00000010 LITERAL AREA 40
rdat+00000040 CONSTANT SECTION DATA 24
rdat+00000058 CMB CONTROL BLOCKS AREA 816
rdat+00000058 FMB2 224
........ FMBI 0
........ SMB1 0
........ SMB2 0
........ EDT 0
........ EFT 0
rdat+00000138 FMB2 ADD-PRM LIST 16
........ ERROR PROCEDURE 0
........ ALPHABETIC NAME 0
........ CLASS NAME 0
........ CLASS TEST TABLE 0
........ TRANS-TABLE PROTO 0
........ CIPB 0
........ DOG TABLE 0
........ EXTERNAL DATA NAME 0
........ NATIONAL-MSG F-NAM 0
........ FLOW BLOCK INFO 0
........ SQL AREA 0
........ SPECIAL REGISTERS 0
rdat+00000148 EPA CONTROL AREA 576
........ SCREEN CONTROL AREA 0
........ EXCEPTION PROC LIST 0
........ SQL INIT INFO 0
........ OLE PARM INFO 0
........ CALL PARM INFO 0
........ CALL PARM ADD INFO 0
........ UWA RECORD INFO 0
........ UWA INFO 0
........ UWA RECORD LIST 0
........ RECORD INFO 0
........ CALL PARM ADDRESS LIST 0
........ FCM FMB1 OFFSET LIST 0
........ FCM OBJ-REF OFFSET LIST 0
........ ICM FMB1 OFFSET LIST 0
........ ICM OBJ-REF OFFSET LIST 0
........ MCM AREA / OBJ-REF LIST 0
........ CFOR OFFSET LIST 0
........ CLASS NAME INFO 0
........ AS MODIFY / PARAM INFO 0
........ METHOD NAME INFO 0
........ INIT TABLE 0
** HGWA **
* HGCB *
heap+00000000 HGCB FIXED AREA 72
* HGMB *
heap+00000048 LIA FIXED AREA 256
........ IWA1 AREA 0
........ LINAGE COUNTER 0
........ OTHER AREA 0
........ ALTINX 0
- 48 -

........ PCT 0
heap+00000148 LCB AREA 160
heap+000001E8 HGMB POINTERS AREA 88
........ VPA 0
........ PSA 0
heap+000001E8 BVA 24
........ BEA 0
........ FMBE 0
heap+00000200 CONTROL ADDRESS TABLE 64
........ MUTEX HANDLE AREA 0
heap+00000240 HGMB CONTROL BLOCK AREA 384
heap+00000240 FMB1 384
........ SMB0 0
........ SPECIAL REGISTERS 0
........ S-A LIST 0
........ DPA 0
........ SQL CONTROL AREA 0
........ DMA 0
........ SCREEN CONTROL AREA 0
........ METHOD INIT INFO 0
........ CFOR 0
* HGWS *
heap+000003C0 DATA AREA 12
** STK **
* SCB *
stac+00000000 ABIA 72
stac+00000050 SCB FIXED AREA 112
stac+000000C0 TL 1ST AREA 32
stac+000000E0 LCB AREA 144
stac+00000170 SGM POINTERS AREA 8
........ VPA 0
........ PSA 0
........ BVA 0
stac+00000170 BHG 8
........ BOD 0
stac+00000178 LIA VARIABLE AREA 160
........ SOR AREA 0
........ TSG AREA 0
........ TRG AREA 0
........ SGM CONTROL BLOCKS AREA 0
........ FMB1 0
........ SMB0 0
........ SPECIAL REGISTER 0
........ MIA 0
........ SQL CONTROL AREA 0
stac+00000218 IWA3 AREA 56
........ ALTINX 0
........ USESAVE 0
stac+00000218 ENTSAVE 8
........ PCT 0
........ CONTENT 0
........ USEOSAVE 0
stac+00000220 RTNADDR 16
........ RTNAREA 0
........ LINAGE COUNTER 0
........ OTHER AREA 0
stac+00000230 PARM 32
........ CALL PARM INFO 0
........ DATA AREA 0
stac+00000250 TL 2ND AREA 32
........ PRESERVED REGISTER 0
- 49 -
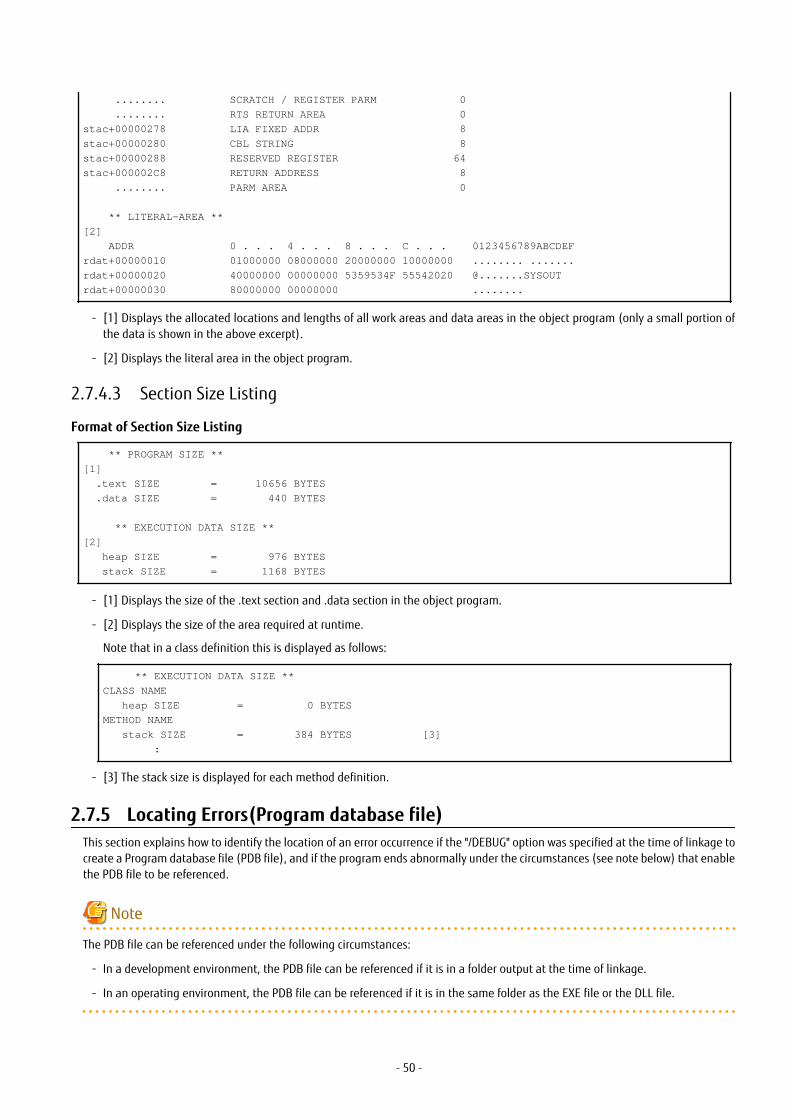
........ SCRATCH / REGISTER PARM 0
........ RTS RETURN AREA 0
stac+00000278 LIA FIXED ADDR 8
stac+00000280 CBL STRING 8
stac+00000288 RESERVED REGISTER 64
stac+000002C8 RETURN ADDRESS 8
........ PARM AREA 0
** LITERAL-AREA **
[2]
ADDR 0 . . . 4 . . . 8 . . . C . . . 0123456789ABCDEF
rdat+00000010 01000000 08000000 20000000 10000000 ........ .......
rdat+00000020 40000000 00000000 5359534F 55542020 @.......SYSOUT
rdat+00000030 80000000 00000000 ........
- [1] Displays the allocated locations and lengths of all work areas and data areas in the object program (only a small portion ofthe data is shown in the above excerpt).
- [2] Displays the literal area in the object program.
2.7.4.3 Section Size Listing
Format of Section Size Listing
** PROGRAM SIZE **
[1]
.text SIZE = 10656 BYTES
.data SIZE = 440 BYTES
** EXECUTION DATA SIZE **
[2]
heap SIZE = 976 BYTES
stack SIZE = 1168 BYTES
- [1] Displays the size of the .text section and .data section in the object program.
- [2] Displays the size of the area required at runtime.
Note that in a class definition this is displayed as follows:
** EXECUTION DATA SIZE **
CLASS NAME
heap SIZE = 0 BYTES
METHOD NAME
stack SIZE = 384 BYTES [3]
:
- [3] The stack size is displayed for each method definition.
2.7.5 Locating Errors(Program database file)This section explains how to identify the location of an error occurrence if the "/DEBUG" option was specified at the time of linkage tocreate a Program database file (PDB file), and if the program ends abnormally under the circumstances (see note below) that enablethe PDB file to be referenced.
Note
The PDB file can be referenced under the following circumstances:
- In a development environment, the PDB file can be referenced if it is in a folder output at the time of linkage.
- In an operating environment, the PDB file can be referenced if it is in the same folder as the EXE file or the DLL file.
- 50 -

[LISTDBG.COB]
000010 IDENTIFICATION DIVISION.
000020 PROGRAM-ID. LISTDBG.
000030*
000040 DATA DIVISION.
000050 WORKING-STORAGE SECTION.
000060 01 culc.
000070 02 dividend PIC 9(2).
000080 02 divisor PIC 9(2).
000090 01 answer PIC 9(2).
000100 PROCEDURE DIVISION.
000120 MOVE 2 TO dividend.
000130*
000140 CALL "DIVPROC" USING culc RETURNING answer.
000150*
000160 DISPLAY "answer =" answer.
000170 EXIT PROGRAM.
000180 END PROGRAM LISTDBG.
[DIVPROC.COB]
000010 IDENTIFICATION DIVISION.
000020 PROGRAM-ID. DIVPROC.
000030*
000040 DATA DIVISION.
000050 WORKING-STORAGE SECTION.
000060 LINKAGE SECTION.
000070 01 Al.
000080 02 dividend PIC 9(2).
000090 02 divisor PIC 9(2).
000100 01 answer PIC 9(2).
000110*
000120 PROCEDURE DIVISION USING Al RETURNING answer.
000130*
000140 MOVE 0 TO answer.
000150 COMPUTE answer = dividend / divisor.
000160*
000190 EXIT PROGRAM.
000200 END PROGRAM DIVPROC.
- Files
- Clash Dump
- Compiler listing specifying compiler option SOURCE, COPY and LIST
- Program Database file (.PDB)
- Debugging Tools
- WinDbg (Debugging Tools for Windows - native x64)
1. Use the following methods to check whether a crash dump relates to the investigation target:
- Check the crash dump filename.
The file name used for a crash dump collected by the Windows error report function is the name of the application thatcrashed. Check whether the crash dump filename is the name of the application being investigated.
- Check the time of issue.
Check whether the crash dump update date and time is the time that the application ended abnormally.
- 51 -

2. Open the crash dump from WinDbg and identify the location of and the reason for the exception occurrence.
- Start WinDbg.
- From the WinDbg "File" menu, select "Open Crash Dump..." and open the investigation target crash dump.
[WinDbg output]
Loading Dump File [C:\werdump\LISTDBG.exe.3584.dmp]
User Mini Dump File with Full Memory: Only application data is available
Symbol search path is: *** Invalid ***
****************************************************************************
* Symbol loading may be unreliable without a symbol search path. *
* Use .symfix to have the debugger choose a symbol path. *
* After setting your symbol path, use .reload to refresh symbol locations. *
****************************************************************************
Executable search path is:
Windows Server 2008/Windows Vista SP1 Version 6001 (Service Pack 1) MP (2 procs) Free x64
Product: Server, suite: Enterprise TerminalServer
Machine Name:
Debug session time: Fri Dec 5 17:46:58.000 2008 (GMT+9)
System Uptime: 10 days 7:46:11.034
Process Uptime: 0 days 0:00:03.000
......................................
*** ERROR: Symbol file could not be found. Defaulted to export symbols for ntdll.dll -
This dump file has an exception of interest stored in it.
The stored exception information can be accessed via .ecxr.
(e00.f34): Integer divide-by-zero - code c0000094 (first/second chance not ...) ... [1]
*** WARNING: Unable to verify checksum for LISTDBG.exe
LISTDBG!DIVPROC+0x431: ... [3]
00000001`40001b29 49f7fc idiv rax,r12 ... [2]
[1] provides the reason the exception was issued: "Integer divide-by-zero - code c0000094" (zero divisor).
[2] provides the position of the exception occurrence:"00000001`40001b29", the "idiv rax,r12" instruction.
"idiv rax,r12" is an instruction that performs signed division. The rdx:rax register contents are divided by the r12 register contents,the quotient is set in rax, and the remainder is set in rdx.
Use the r command to check the register contents.
[r command output]
0:000> r
rax=0000000000000002 rbx=00000000030354e0 rcx=0000000003035628
rdx=0000000000000000 rsi=0000000000000000 rdi=000000000012fbf0
rip=0000000140001b29 rsp=000000000012f9f0 rbp=000000000012fc60
r8 =0000000140024670 r9=00000000030354e0 r10=0000000000000a90
r11=000000000012fb2a r12=0000000000000000 r13=0000000000000002
r14=000000014001d1a0 r15=0000000003035240
iopl=0 nv up ei pl zr na po nc
cs=0033 ss=002b ds=002b es=002b fs=0053 gs=002b efl=00010244
LISTDBG!DIVPROC+0x431:
00000001`40001b29 49f7fc idiv rax,r12
The above output indicates that "rdx:rax=00000000000000002" was divided by "r12=0000000000000000" but, since r12 is 0,a zero divisor exception was issued.
3. Identify the COBOL source line position.
The position in the COBOL source where the error occurred, is indicated by [3], "LISTDBG!DIVPROC+0x431".
The output format for the information at [3] is "module name!symbol name + offset". This information in this example is asfollows:
- 52 -

Module name : "LISTDBG"
Symbol name : "DIVPROC"
Offset from Symbol : 0x431
The extension is deleted from the module name. Use the lm command to check the extension.
[lm command output]
0:000> lm v m LISTDBG
start end module name
00000001`40000000 00000001`40025000 LISTDBG C(private pdb symbols)
C:\Work\tel\LISTDBG.pdb
Loaded symbol image file: LISTDBG.exe
Image path: C:\Work\tel\LISTDBG.exe ... [4]
Image name: LISTDBG.exe ... [5]
Timestamp: Fri Dec 05 17:46:44 2008 (4938EA74)
CheckSum: 00000000
ImageSize: 00025000
File version: 0.0.0.0
Product version: 0.0.0.0
File flags: 0 (Mask 0)
File OS: 0 Unknown Base
File type: 0.0 Unknown
File date: 00000000.00000000
Translations: 0000.04b0 0000.04e4 0409.04b0 0409.04e4
Check the file extension at [4], Image path, or [5], Image name. In this example,"LISTDBG.exe". is shown.
The symbol is formed by combining the COBOL source "PROGRAM-ID", the "CLASS-ID", and the "METHOD-ID". This is output asthe label name in the object program list.
The two files LISTDBG.cob and DIVPROC.cob are used to create "LISTDBG.exe". For "LISTDBG!DIVPROC+0x431", obtain the position"0x431" from the Object Program Listing (DIVPROC.LST) of the DIVPROC.cob that contains the symbol "DIVPROC".
[Object Program Listing(DIVPROC.LST)]
BEGINNING OF DIVPROC
BEGINNING OF ENTRY POINT CODE
000000000000 3000
000000000002 0700
000000000004 44495650524F43
"DIVPROC"
00000000000B 08
00000000000C 4E6574434F424F4C
"NetCOBOL"
000000000014 07
000000000015 5631302E322E30
"V10.2.0"
00000000001C 3230313030323231
"20100221"
000000000024 3137343132303030
"17412000"
00000000002C 2B30303030
000000000031 30313031
000000000035 CCCCCC
GLB.1
DIVPROC: ... [6]
000000000038 48894C2408 mov qword ptr [rsp+0x08],rcx ... [7]
00000000003D 4889542410 mov qword ptr [rsp+0x10],rdx
000000000042 4C89442418 mov qword ptr [rsp+0x18],r8
000000000047 4C894C2420 mov qword ptr [rsp+0x20],r9
00000000004C 55 push rbp
00000000004D 4889E5 mov rbp,rsp
000000000050 57 push rdi
000000000051 56 push rsi
- 53 -

000000000052 53 push rbx
000000000053 4154 push r12
000000000055 4155 push r13
000000000057 4156 push r14
000000000059 4157 push r15
00000000005B 4881EC38020000 sub rsp,0x00000238
000000000062 488DBC24E0000000 lea rdi,[rsp+0x000000E0]
00000000006A 48C7C124000000 mov rcx,0x00000024
000000000071 48C7C000000000 mov rax,0x00000000
000000000078 FC cld
000000000079 F348AB rep stosq
00000000007C 488B4510 mov rax,qword ptr [rbp+0x10]
000000000080 48898424E0010000 mov qword ptr [rsp+0x000001E0],rax
000000000088 48B8A203000000000000 mov rax,0x00000000000003A2 PROCEDURE_ENTRY
000000000092 48898424D8010000 mov qword ptr [rsp+0x000001D8],rax
00000000009A E9B9000000 jmp 000000000158 GLB.2
END OF ENTRY POINT CODE :
In the DIVPROC.cob Object Program Listing (DIVPROC.LST), search for "DIVPROC" to obtain the output position [6]. From the lineaddress of the next line of that symbol, obtain the offset position of that symbol, "000000000038" (hexadecimal number), at[7].
Add the address number (offset) obtained above to the offset value from the symbol, "0x431", to obtain the offset value withinthe list.
0x38+0x431 = 0x469
In the DIVPROC.cob Object Program Listing(DIVPROC.LST), search for address number "0x469 ".
[Object Program Listing(DIVPROC.LST)]
--- 14 --- MOVE
0000000003FE 66C78424F00100003030 mov word ptr [rsp+0x000001F0],0x3030 answer
--- 15 --- COMPUTE ... [9]
000000000408 4C8BBB98010000 mov r15,qword ptr [rbx+0x00000198] BVA.1
00000000040F 410FB65701 movzx edx,byte ptr [r15+0x01] dividened+1
000000000414 490FB607 movzx rax,byte ptr [r15] dividend
000000000418 4883E00F and rax,0x0F
00000000041C 488D0480 lea rax,[rax+rax*4]
000000000420 4883E20F and rdx,0x0F
000000000424 488D0442 lea rax,[rdx+rax*2]
000000000428 66898424C6000000 mov word ptr [rsp+0x000000C6],ax TRLP+0
000000000430 410FB65703 movzx edx,byte ptr [r15+0x03] divisor+1
000000000435 490FB64702 movzx rax,byte ptr [r15+0x02] divisor
00000000043A 4883E00F and rax,0x0F
00000000043E 488D0480 lea rax,[rax+rax*4]
000000000442 4883E20F and rdx,0x0F
000000000446 488D0442 lea rax,[rdx+rax*2]
00000000044A 66898424D6000000 mov word ptr [rsp+0x000000D6],ax TRLP+0
000000000452 4C0FBFAC24C6000000 movsx r13,word ptr [rsp+0x000000C6] TRLP+0
00000000045B 4C0FBFA424D6000000 movsx r12,word ptr [rsp+0x000000D6] TRLP+0
000000000464 4C89E8 mov rax,r13
000000000467 4899 cqo
000000000469 49F7FC idiv r12 ... [8]
00000000046C 4989C6 mov r14,rax
00000000046F 4C8B9BA8010000 mov r11,qword ptr [rbx+0x000001A8] BCO.0
000000000476 4D8B6310 mov r12,qword ptr [r11+0x10] #
00000000047A 4C89F0 mov rax,r14
00000000047D 4C89F2 mov rdx,r14
000000000480 4C89F1 mov rcx,r14
000000000483 48F7D9 neg rcx
000000000486 4983FE00 cmp r14,0x00
00000000048A 480F4CC1 cmovnge rax,rcx
00000000048E 4C39E0 cmp rax,r12
- 54 -

000000000491 7C08 jl 00000000049B GLB.11
000000000493 4C89F0 mov rax,r14
000000000496 4899 cqo
000000000498 49F7FC idiv r12
GLB.11
00000000049B 4989D5 mov r13,rdx
00000000049E 664489AC24C6000000 mov word ptr [rsp+0x000000C6],r13w TRLP+0
0000000004A7 480FBF8424C6000000 movsx rax,word ptr [rsp+0x000000C6] TRLP+0
0000000004B0 4889C6 mov rsi,rax
0000000004B3 48C1FE3F sar rsi,0x3F
0000000004B7 4883FE00 cmp rsi,0x00
0000000004BB 790A jns 0000000004C7 GLB.12
0000000004BD 48F7DE neg rsi
0000000004C0 48F7D8 neg rax
0000000004C3 4883DE00 sbb rsi,0x00
GLB.12
0000000004C7 488D8C24F0010000 lea rcx,[rsp+0x000001F0] answer
0000000004CF 48C7C202000000 mov rdx,0x00000002
0000000004D6 4989F0 mov r8,rsi
0000000004D9 4989C1 mov r9,rax
0000000004DC 488BBBB8010000 mov rdi,qword ptr [rbx+0x000001B8]
0000000004E3 FF5778 call qword ptr [rdi+0x78]
The instruction at address "000000000469 " (the instruction at [8]) is "idiv r12", which matches the instruction obtained at [2].Thus, the position of the instruction that ended abnormally can be identified as this one.
Search upwards from this instruction, looking for a line starting with the "--- nnn --- " format. In this example, "--- 15 --- COMPUTE" is found ([9]).
The part corresponding to the "nnn", that is "15", corresponds to the COBOL source line number.
In the DIVPROC.LST source program list, refer to the position at line number "15" ([10]).
[Source Program List(DIVPROC.LST)]
1 000010 IDENTIFICATION DIVISION.
2 000020 PROGRAM-ID. DIVPROC.
3 000030*
4 000040 DATA DIVISION.
5 000050 WORKING-STORAGE SECTION.
6 000060 LINKAGE SECTION.
7 000070 01 Al.
8 000080 02 dividend PIC 9(2).
9 000090 02 divisor PIC 9(2).
10 000100 01 answer PIC 9(2).
11 000110*
12 000120 PROCEDURE DIVISION USING Al RETURNING answer.
13 000130*
14 000140 MOVE 0 TO answer.
15 000150 COMPUTE answer = dividend / divisor. ... [10]
16 000160*
17 000170 EXIT PROGRAM.
18 000180 END PROGRAM DIVPROC.
This identifies that the abnormal end occurred at the COMPUTE statement in the 15th line.
2.7.6 Locating Errors (Link Map file)This section explains how to identify the location where an error occurred if "/MAP" was specified at linkage to create a Link Map File,and if a program ended abnormally when it is impossible to reference the PDB file.
- Files
- Clash Dump
- 55 -

- Compiler listing specifying compiler option SOURCE, COPY and LIST
- Link Map file (.MAP)
- Debugging Tools
- WinDbg (Debugging Tools for Windows - native x64)
The example used here is the same as in "2.7.5 Locating Errors(Program database file)".
A crash dump is collected when a file is executed if the file was created with "/MAP", rather than "/DEBUG", specified at the time oflinkage.
Procedures 1. and 2. below are the same as in "2.7.5 Locating Errors(Program database file)".
1. Check whether the crash dump relates to the investigation target.
2. Use the crash dump to identify the location of and the reason for the exception occurrence.
3. Identify the COBOL source line position.
The method for obtaining the COBOL source line position from the crash dump and the Link Map Listing is explained below.
a. Obtain the COBOL source line position from the WinDbg address information.
[Results output at WinDbg start]
Loading Dump File [C:\werdump\LISTDBG.exe.3048.dmp]
User Mini Dump File with Full Memory: Only application data is available
Symbol search path is: *** Invalid ***
****************************************************************************
* Symbol loading may be unreliable without a symbol search path. *
* Use .symfix to have the debugger choose a symbol path. *
* After setting your symbol path, use .reload to refresh symbol locations. *
****************************************************************************
Executable search path is:
Windows Server 2008/Windows Vista SP1 Version 6001 (Service Pack 1) MP (2 procs) Free x64
Product: Server, suite: Enterprise TerminalServer
Machine Name:
Debug session time: Mon Dec 8 09:25:24.000 2008 (GMT+9)
System Uptime: 12 days 23:24:36.422
Process Uptime: 0 days 0:00:03.000
......................................
*** ERROR: Symbol file could not be found. Defaulted to export symbols for ntdll.dll -
This dump file has an exception of interest stored in it.
The stored exception information can be accessed via .ecxr.
(be8.504): Integer divide-by-zero - code c0000094 (first/second chance not available)
*** WARNING: Unable to verify checksum for LISTDBG.exe
*** ERROR: Symbol file could not be found. Defaulted to export symbols for LISTDBG.exe -
LISTDBG!DIVPROC+0x431:
00000001`400019a9 49f7fc idiv rax,r12 ... [1]
This provides the abnormal end position of "00000001`400019a9 " ([1]).
b. In order to identify the module held at the address "00000001`400019a9 " at [1], use the lm command to output a modulelist.
[lm command output results]
0:000> lm
start end module name
00000000`00020000 00000000`00030000 F4AGLANP (deferred)
00000000`00190000 00000000`001c5000 F4AGSQL (deferred)
00000000`001d0000 00000000`00203000 F4AGAESV (deferred)
00000000`00210000 00000000`00249000 F4AGEFNC (deferred)
00000000`006e0000 00000000`00754000 F4AGIO (deferred)
00000000`00760000 00000000`007a4000 F4AGFRM (deferred)
- 56 -

00000000`007b0000 00000000`00841000 F4AGLPIO (deferred)
00000000`00850000 00000000`008b1000 F4AGDBG (deferred)
00000000`008c0000 00000000`00904000 F4AGPRIO (deferred)
00000000`00910000 00000000`0098b000 F4AGSCRN (deferred)
00000000`00990000 00000000`00a11000 F4AGOLER (deferred)
00000000`00a20000 00000000`00a69000 F4AGOLES (deferred)
00000000`00a70000 00000000`00abd000 F4AGARMV (deferred)
00000000`00e40000 00000000`00e50000 F4AGFC64 (deferred)
00000000`10000000 00000000`10005000 F4AGOVLD (deferred)
00000000`77130000 00000000`7725b000 kernel32 (deferred)
00000000`77260000 00000000`7732d000 user32 (deferred)
00000000`77330000 00000000`774b0000 ntdll (export symbols) ntdll.dll
00000001`40000000 00000001`40010000 LISTDBG C (export symbols) LISTDBG.exe ... [2]
00000001`80000000 00000001`800ea000 F4AGPRCT (deferred)
000007fe`f9680000 000007fe`f96d8000 winspool (deferred)
000007fe`faf40000 000007fe`fafe0000 comctl32 (deferred)
000007fe`fc180000 000007fe`fc379000 comctl32_7fefc180000 (deferred)
000007fe`fca70000 000007fe`fca7b000 version (deferred)
000007fe`fda80000 000007fe`fdc58000 ole32 (deferred)
000007fe`fdc60000 000007fe`fdc77000 imagehlp (deferred)
000007fe`fdc80000 000007f 0x140000000 =e`fdce3000 gdi32 (deferred)
000007fe`fdde0000 000007fe`fdee1000 msctf (deferred)
000007fe`fdef0000 000007fe`fdf7c000 comdlg32 (deferred)
000007fe`fdf80000 000007fe`fdfad000 imm32 (deferred)
000007fe`fe0b0000 000007fe`fe0bd000 lpk (deferred)
000007fe`fe0c0000 000007fe`fe133000 shlwapi (deferred)
000007fe`fe1a0000 000007fe`fe23c000 msvcrt (deferred)
000007fe`fe240000 000007fe`fee92000 shell32 (deferred)
000007fe`ff080000 000007fe`ff1bf000 rpcrt4 (deferred)
000007fe`ff340000 000007fe`ff413000 oleaut32 (deferred)
000007fe`ff480000 000007fe`ff588000 advapi32 (deferred)
000007fe`ff590000 000007fe`ff62a000 usp10 (deferred)
Since the "00000001`400019a9" at [1] is included in "00000001`40000000 00000001`40010000 LISTDBG C (export symbols)LISTDBG.exe" at [2], we can identify that the abnormal end is in the "LISTDBG.exe" module.
c. The Link Map Listing created at the time of linkage using the "/MAP" specification can be used to identify the relevant part ofthe module.
[Link Map Listing(LISTDBG.MAP)]
LISTDBG
Timestamp is 493c694d (Mon Dec 08 09:24:45 2008)
Preferred load address is 0000000140000000 ... [3]
Start Length Name Class
0001:00000000 000060f2H .text CODE
...
0005:00000000 000005d8H .rodata DATA
Address Publics by Value Rva+Base Lib:Object
0000:00000000 ___safe_se_handler_count 0000000000000000 <absolute>
0000:00000000 ___safe_se_handler_table 0000000000000000 <absolute>
0000:00000000 __ImageBase 0000000140000000 <linker-defined>
0001:00000000 main 0000000140001000 f LISTDBG.obj
0001:00000050 LISTDBG 0000000140001050 f LISTDBG.obj
0001:00000578 DIVPROC 0000000140001578 f DIVPROC.obj ... [4]
0001:00000a50 JMP1PLAN 0000000140001a50 f f4agcimp:F4AGPRCT.dll
...
Check whether the module loading address "00000001`40000000" at [2] is the same as the address at [3], "Preferred loadaddress is 0000000140000000".
- If module loading address at [2] and the address at [3] are the same
Compare the address "00000001`400019a9" at [1] as is with the "Rva+Base" value and find the closest address that issmaller than the address at [1].
- 57 -

In this example, this is:
[4]"0001:00000580 DIVPROC 0000000140001580 f DIVPROC.obj"
Then, use the following calculation to obtain the symbol relative offset.
0x1400019a9 - 0x140001578 = 0x431
The above results give the following information:
Module : "LISTDBG.exe"
Symbol : "DIVPROC"
Offset from Symbol: 0x431
- If module loading address at [2] and the address at [3] are different
Calculate the relative offset of each.
First, obtain the relative offset of the abnormal end position.
0x1400019a9 - 0x1400000000 = 0x19a9
Then obtain the relative offsets of the symbol of each.
main 0x140001000 - 0x140000000 = 0x1000
LISTDBG 0x140001050 - 0x140000000 = 0x1050
DIVPROC 0x140001578 - 0x140000000 = 0x1578 ... [5]
JMP1PLAN 0x140001a50 - 0x140000000 = 0x1a50
:
Within the information shown above, find the offset that is closest to and smaller than the offset obtained at 1-.
In this example, this is:
[5]"DIVPROC 0x140001578 - 0x1400000000 = 0x1578"
Then, use the following calculation to obtain the symbol relative offset.
0x19a9 - 0x1578 = 0x431
The above results give the following information:
Module : "LISTDBG.exe"
Symbol : "DIVPROC"
Offset from Symbol: 0x431
Subsequent tasks are the same as in "2.7.5 Locating Errors(Program database file)".
2.7.7 Researching Data ValuesIf the abnormal end location is a COBOL program or method, use the following to reference that program or method data:
- Files
- Clash Dump
- Compiler listing specifying compiler option SOURCE, COPY and MAP
- Debugging Tools
- WinDbg (Debugging Tools for Windows - native x64)
Note
The data that can be referenced is the data used by the program or method that ended abnormally and the calling source data. Thedata of programs and methods that do not appear in the "Call Stack" cannot be referenced.
- 58 -

Data Area
There are four basic data areas:
- Stack data
- Heap data
- .data
- .rdata
The following data areas are used at the method definition.
- .rodata
- Heap data that object data or factory data uses
Data Area name Mark(*) Meanings
Stack data stac The stack data area stores data entered in the working-storage section of methoddefinitions, and work data and management data for compiler generation.
These areas can be used only during program or method execution.
The size can be specified (changed) using the LINK.EXE option (/STACK).
These areas extend from high (large) addresses to low (small) addresses.
The "rsp" register manages the boundaries of used areas and unused areas.
The "rsp" register is referenced as standard when COBOL procedures are executed.
Heap data heap The heap data area stores data entered in the working-storage section of programdefinitions, and work data and management data for compiler generation.
The "rbx" register is referenced as standard when COBOL procedures are executed.
.data data The .data area is the read-enabled and write-enabled data area. This area storeswork data and management data for compiler generation.
.rdata rdat The .rdata area is the read-specific data area. This area stores data entered in theconstants section, and read-specific data for compiler generation and other datathat does not change during procedure execution.
.rodata - The .rodata area stores common read-only data in object definitions or factorydefinitions.
Heap data thatobject data orfactory data uses
hea2 This area stores common data in object definitions or factory definitions.
* : This notation is used in the "address" part explained in the Data Map Listing output format described in "2.7.4 Listings Relating toData Areas".
Use the following method to obtain the start of each of the data areas:
1. Start WinDbg.
2. From the WinDbg "File" menu, select "Open Crash Dump..." and open the investigation target crash dump.
3. Prepare the Compile Listing that is output by specifying the MAP compile option and refer to "2.7.4.2 Program ControlInformation Listing".
[Program Control Information Listing(DIVPROC.LST)]
...
** HGWA **
* HGCB *
- 59 -

heap+00000000 HGCB FIXED AREA 72
* HGMB *
heap+00000048 LIA FIXED AREA 256
........ IWA1 AREA 0
........ LINAGE COUNTER 0
........ OTHER AREA 0
........ ALTINX 0
........ PCT 0
heap+00000148 LCB AREA 80
heap+00000198 HGMB POINTERS AREA 72
........ VPA 0
........ PSA 0
heap+00000198 BVA 8
........ BEA 0
........ FMBE 0
heap+000001A0 CONTROL ADDRESS TABLE 64 ... [1]
........ MUTEX HANDLE AREA 0
...
** STK **
* SCB *
stac+00000000 ABIA 72
stac+00000050 SCB FIXED AREA 112
stac+000000C0 TL 1ST AREA 32
stac+000000E0 LCB AREA 80
stac+00000130 SGM POINTERS AREA 8
........ VPA 0
........ PSA 0
........ BVA 0
stac+00000130 BHG 8 ... [2]
........ BOD 0
...
4. Display the contents of the CONTROL ADDRESS TABLE (control information table) ([1]) to obtain the start address of each ofthe data areas.
First, obtain the start address of the heap area.
Information
Obtaining the start address of the heap area
The start address of the heap area is set in the "rbx" register when a procedure is executed. At times other than procedureexecution, the start address of the heap area is not set in the "rbx" register.
The value set at [2], BHG(stac+00000130), can be used to check whether or not "the "rbx" register value = heap area startaddress".
Since "stac" is set in "rsp", use WinDbg to display the "rsp+130" memory contents and the "rbx" register contents and comparethem.
[rbx register]
------------------------------------------------------------------
0:000> r rbx
rbx=00000000030354e0
------------------------------------------------------------------
[rsp+00000130 memory]
------------------------------------------------------------------
0:000> dq rsp+130 L(1)
00000000`0012fb20 00000000`030354e0
------------------------------------------------------------------
- 60 -
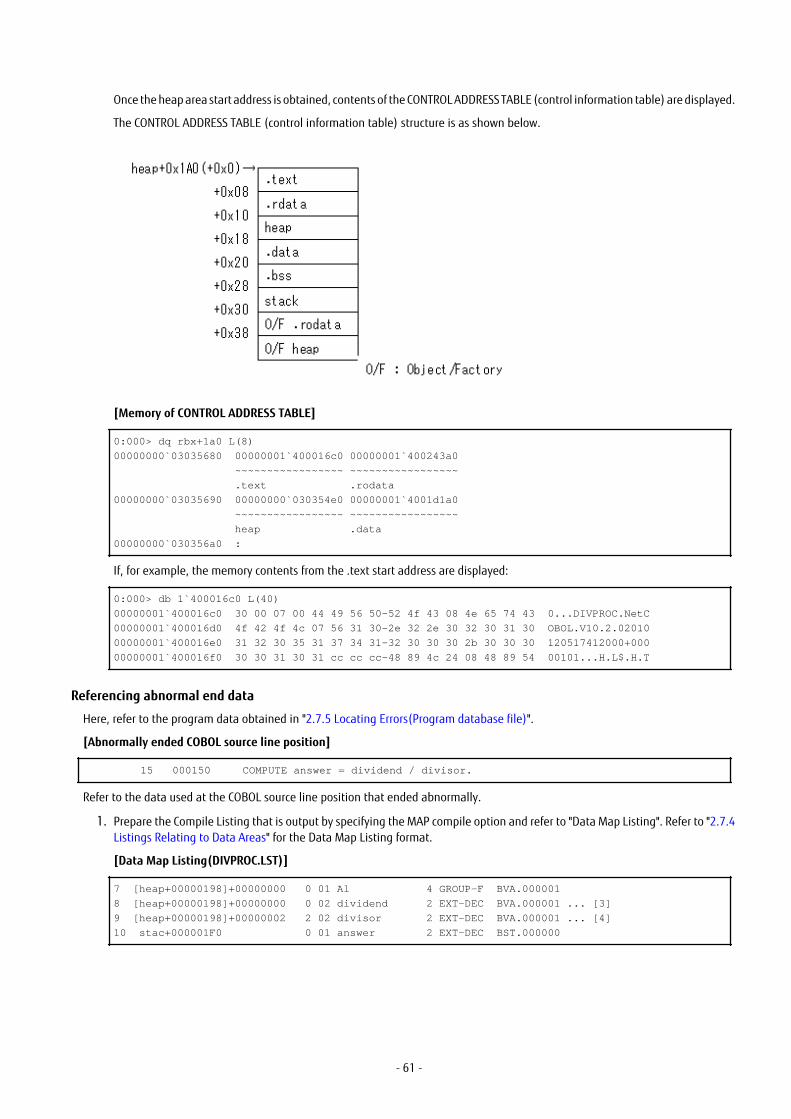
Once the heap area start address is obtained, contents of the CONTROL ADDRESS TABLE (control information table) are displayed.
The CONTROL ADDRESS TABLE (control information table) structure is as shown below.
[Memory of CONTROL ADDRESS TABLE]
0:000> dq rbx+1a0 L(8)
00000000`03035680 00000001`400016c0 00000001`400243a0
~~~~~~~~~~~~~~~~~ ~~~~~~~~~~~~~~~~~
.text .rodata
00000000`03035690 00000000`030354e0 00000001`4001d1a0
~~~~~~~~~~~~~~~~~ ~~~~~~~~~~~~~~~~~
heap .data
00000000`030356a0 :
If, for example, the memory contents from the .text start address are displayed:
0:000> db 1`400016c0 L(40)
00000001`400016c0 30 00 07 00 44 49 56 50-52 4f 43 08 4e 65 74 43 0...DIVPROC.NetC
00000001`400016d0 4f 42 4f 4c 07 56 31 30-2e 32 2e 30 32 30 31 30 OBOL.V10.2.02010
00000001`400016e0 31 32 30 35 31 37 34 31-32 30 30 30 2b 30 30 30 120517412000+000
00000001`400016f0 30 30 31 30 31 cc cc cc-48 89 4c 24 08 48 89 54 00101...H.L$.H.T
Referencing abnormal end data
Here, refer to the program data obtained in "2.7.5 Locating Errors(Program database file)".
[Abnormally ended COBOL source line position]
15 000150 COMPUTE answer = dividend / divisor.
Refer to the data used at the COBOL source line position that ended abnormally.
1. Prepare the Compile Listing that is output by specifying the MAP compile option and refer to "Data Map Listing". Refer to "2.7.4Listings Relating to Data Areas" for the Data Map Listing format.
[Data Map Listing(DIVPROC.LST)]
7 [heap+00000198]+00000000 0 01 Al 4 GROUP-F BVA.000001
8 [heap+00000198]+00000000 0 02 dividend 2 EXT-DEC BVA.000001 ... [3]
9 [heap+00000198]+00000002 2 02 divisor 2 EXT-DEC BVA.000001 ... [4]
10 stac+000001F0 0 01 answer 2 EXT-DEC BST.000000
- 61 -

2. Refer to each of the data contents.
- Data of dividend([heap+00000198]+00000000)
- [heap+00000198]
0:000> dq rbx+198 L(1)
00000000`03035678 00000000`03035240
- [heap+00000198]+00000000
0:000> db 3035240 L(2)
00000000`03035240 30 32 02
The above output indicates that "02" is entered using zoned decimal for the "dividend".
- Data of divisor([heap+00000198]+00000002)
The contents of [heap+00000198] is the same as "dividend".
- [heap+00000198]+00000002
0:000> db 3035240+2 L(2)
00000000`03035242 00 00
From the above results, essentially a zoned decimal value must be set for the "divisor" but, because a value was not set,X"0000" was entered and this was evaluated as being zero.
The results of these checks indicate that a zero divisor was executed.
2.7.8 Referencing calling source data at abnormal end and identifying the calllocation
This section explains, with the aid of simple examples, how to reference calling source data and identify the call location.
- Files
- Clash Dump
- Compiler listing specifying compiler option SOURCE, COPY and MAP
- Debugging Tools
- WinDbg (Debugging Tools for Windows - native x64)
Referencing calling source data
1. Start WinDbg.
2. From the WinDbg "File" menu, select "Open Crash Dump..." and open the investigation target crash dump.
3. The Call Stack information is displayed at WinDbg.
0:000> k
Child-SP RetAddr Call Site
00000000`0012f9f0 00000001`40001438 LISTDBG!DIVPROC+0x431 <- Abnormal end location
00000000`0012fc70 00000001`40001054 LISTDBG!LISTDBG+0x3a8 <- Calling source
00000000`0012fef0 00000001`40001f2b LISTDBG!main+0x14
00000000`0012ff20 00000000`7715495d LISTDBG!__tmainCRTStartup+0x15b
00000000`0012ff60 00000000`77358791 kernel32!BaseThreadInitThunk+0xd
00000000`0012ff90 00000000`00000000 ntdll!RtlUserThreadStart+0x21
This indicates that the abnormally ended location and the calling source program is LISTDBG.
4. Refer to the data of the calling source program, LISTDBG. Refer to the Compile Listing(LISTDB.LST) that was output by specifyingthe MAP compile option.
[Data Map Listing(LISTDBG.LST)]
- 62 -

6 heap+000001E0 0 01 culc 4 GROUP-F BHG.000000
7 heap+000001E0 0 02 diviend 2 EXT-DEC BHG.000000
8 heap+000001E2 2 02 divisor 2 EXT-DEC BHG.000000
9 heap+000001E8 0 01 answer 2 EXT-DEC BHG.000000
[Program Control Information Listing(LISTDBG.LST)]
heap+00000198 CONTROL ADDRESS TABLE 64
:
stac+00000120 BHG 8
Use the same method as in "Referencing abnormal end data" to refer to the data contents of each.
1. From the call stack, obtain the calling source "child-SP" (in this example, 000000000012fc70) as a stack address, andobtain heap address=BHG (in this example, stac+00000120) from the stack.
- BHG(heap address)
0:000> dq 12fc70+120 L(1)
00000000`0012fd90 00000000`03035060
- Heap of CONTROL ADDRESS TABLE
0:000> dq 3035060+198+10 L(1)
00000000`03035208 00000000`03035060
2. Refer to the data contents of each.
- Data of dividend(heap+000001E0)
0:000> db 3035060+1e0 L(2)
00000000`03035240 30 32 02
- Data of divisor(heap+000001E2)
0:000> db 3035060+1e2 L(2)
00000000`03035242 00 00 ..
The above results indicate that, essentially, a zoned decimal value must be set for the "divisor" but, because a value was notset, X"0000" was entered and zero was passed to the calling destination.
Identifying the call location
1. Start WinDbg.
2. From the WinDbg "File" menu, select "Open Crash Dump..." and open the investigation target crash dump.
3. The Call Stack information is displayed at WinDbg. The Call Stack information indicates that the call position of the calling sourceis as follows:
"LISTDBG!LISTDBG+0x3a8"
4. Prepare the Compile Listing that is output by specifying the LIST compile option, and refer to "2.7.3 Object Program Listing".
5. Search for the LISTDBG offset in the "Object Program Listing".
LISTDBG:
000000000050 48894C2408 mov qword ptr [rsp+0x08],rcx
6. Add the LISTDBG offset and the call position offset "0x3a8".
0x3a8 + 0x50 = 0x3f8
7. Identify the call location.
Search for the calculated position, "0x3f8", in the Object Program Listing (LISTDBG.LST).
- 63 -

--- 13 --- CALL
0000000003DE 488D83E0010000 lea rax,[rbx+0x000001E0] culc
0000000003E5 48890424 mov qword ptr [rsp],rax PARM-1B8
0000000003E9 4C8BBBB0010000 mov r15,qword ptr [rbx+0x000001B0] BGW.0
0000000003F0 488B0C24 mov rcx,qword ptr [rsp]
0000000003F4 41FF5758 call qword ptr [r15+0x58] DIVPROC
0000000003F8 48898424C0000000 mov qword ptr [rsp+0x000000C0],rax TRLP+0
000000000400 0FB78424C0000000 movzx eax,word ptr [rsp+0x000000C0] TRLP+0
000000000408 668983E8010000 mov word ptr [rbx+0x000001E8],ax answer
00000000040F 4C8BB3A0010000 mov r14,qword ptr [rbx+0x000001A0] BCO.0
000000000416 410FB64621 movzx eax,byte ptr [r14+0x21] X"00"
00000000041B 0FB68B70010000 movzx ecx,byte ptr [rbx+0x00000170] LCBC+0
000000000422 39C1 cmp ecx,eax
Since the "0x3f8" position is a return position, the called instruction is the previous "0x3F4" call instruction.
8. Identify the position in the source program.
Search upwards from the called instruction position in the object program, looking for line information. In this example, "--- 13--- CALL" is found.
A search for this CALL statement in the Source Program Listing finds the following:
[Source Program Listing(LISTDBG.LST)]
13 000130 CALL "DIVPROC" USING culc RETURNING answer.
When DIVPROC is called, this CALL statement passes the "dividend" and "divisor" included in the "calculation" as arguments.Since a value is not set for the "divisor" in the calling source program "LISTDBG", a zero division was issued.
- 64 -

Index[C]
CHECK function.................................................................3,5,6COBOL Error Report............................................................3,22compiler listings...................................................................38COUNT function...................................................................... 3count information................................................................ 16
[D]data map listing................................................................... 38debugging functions.............................................................. 3
[L]line-number........................................................................... 5
[M]message count....................................................................... 7message output count..........................................................11
[N]NONUMBER............................................................................ 5NUMBER.................................................................................5
[O]object program listing.......................................................... 42OPTIMIZE option...................................................................25
[P]program control information listing..................................... 38
[R]relative address....................................................................44
[S]section size listing................................................................ 50sequence number...................................................................5source program listing..........................................................41statement number................................................................. 5
[T]TEST option...........................................................................25TRACE function.................................................................. 3,11trace information............................................................ 12,13trace information items........................................................12
- 65 -


![Debugging with gdb · Debugging Data Race Conditions: Section 12.2 [Data Race Detection], page 171. Debugging OpenMP*: Section 12.4 [OpenMP* Debugging], page 177. Extended recording](https://img.dokumen.tips/doc/110x75/5f0b5c707e708231d4302334/debugging-with-gdb-debugging-data-race-conditions-section-122-data-race-detection.jpg)