Embed Size (px)
Citation preview
DebuggingDebugging
Dwight Deugo ([email protected])Dwight Deugo ([email protected])Nesa Matic ([email protected])Nesa Matic ([email protected])
2© 2003-2005, Espirity Inc.
Additional Contributors
None as of September, 2005
3© 2003-2005, Espirity Inc.
Module Road Map
1. Eclipse Debugging

4© 2003-2005, Espirity Inc.
Module Road Map
1. Eclipse Debugging Debug Perspective Debug Session Breakpoint Debug Views Breakpoint Types Evaluating and displaying expressions
5© 2003-2005, Espirity Inc.
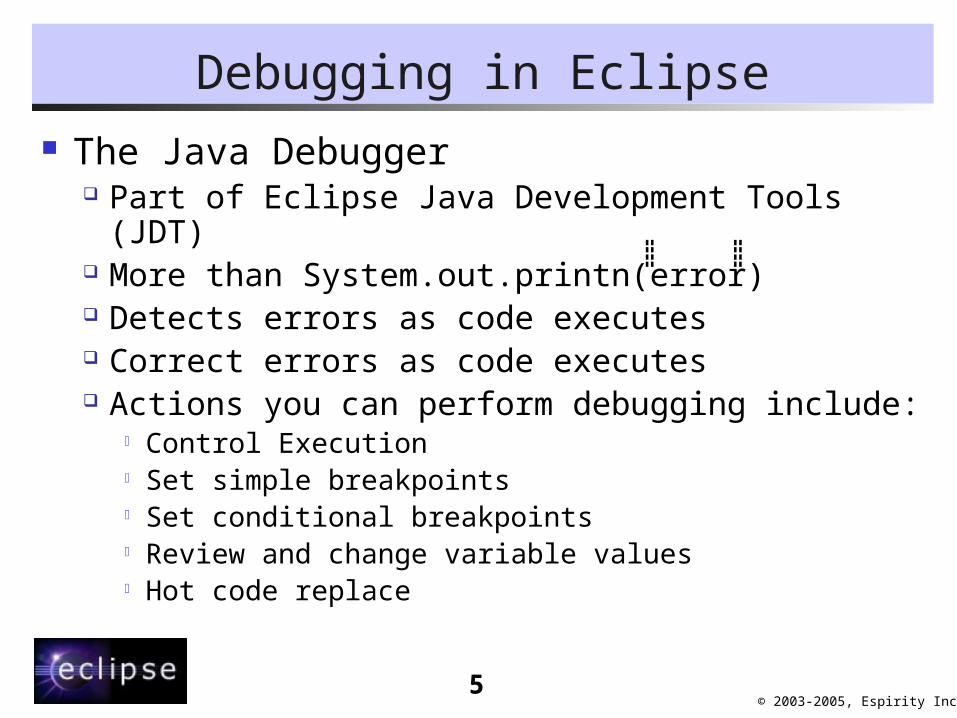
Debugging in Eclipse The Java Debugger
Part of Eclipse Java Development Tools (JDT) More than System.out.printn(,,,
,error ,,,,)
Detects errors as code executes Correct errors as code executes Actions you can perform debugging include:
Control Execution Set simple breakpoints Set conditional breakpoints Review and change variable values Hot code replace
6© 2003-2005, Espirity Inc.
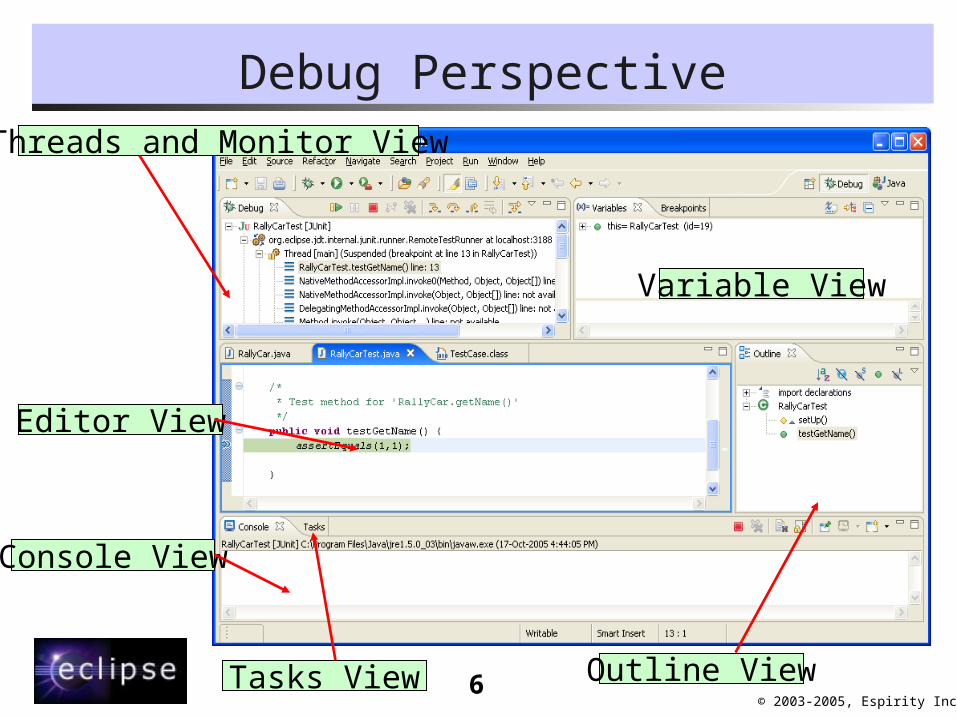
Debug PerspectiveThreads and Monitor View
Console View
Outline View
Editor View
Tasks View
Variable View
7© 2003-2005, Espirity Inc.
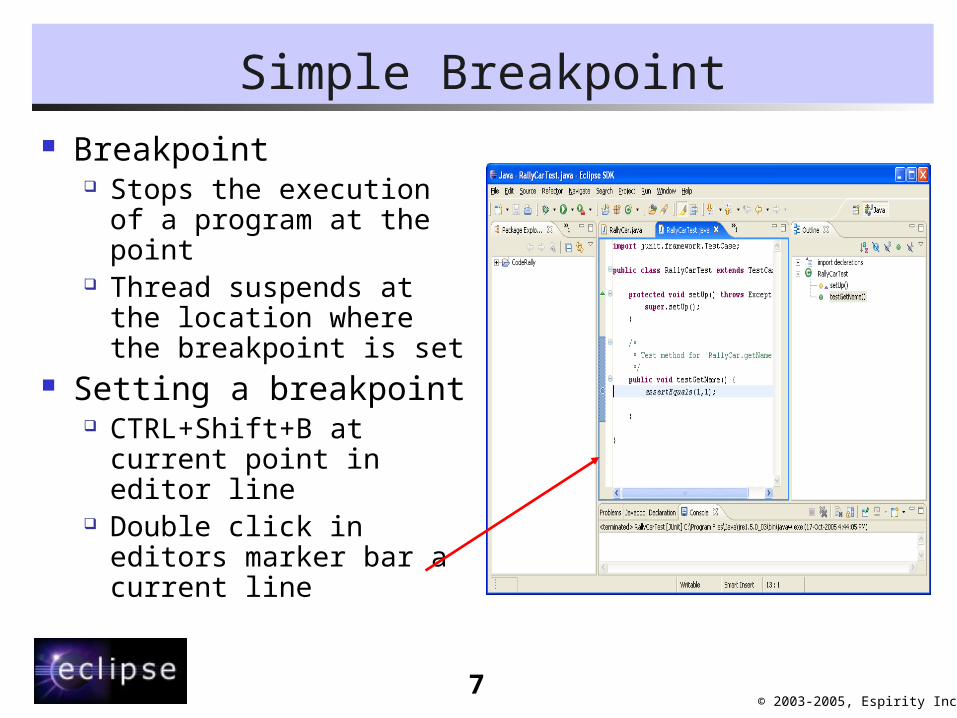
Simple Breakpoint Breakpoint
Stops the execution of a program at the point
Thread suspends at the location where the breakpoint is set
Setting a breakpoint CTRL+Shift+B at
current point in editor line
Double click in editors marker bar a current line
8© 2003-2005, Espirity Inc.
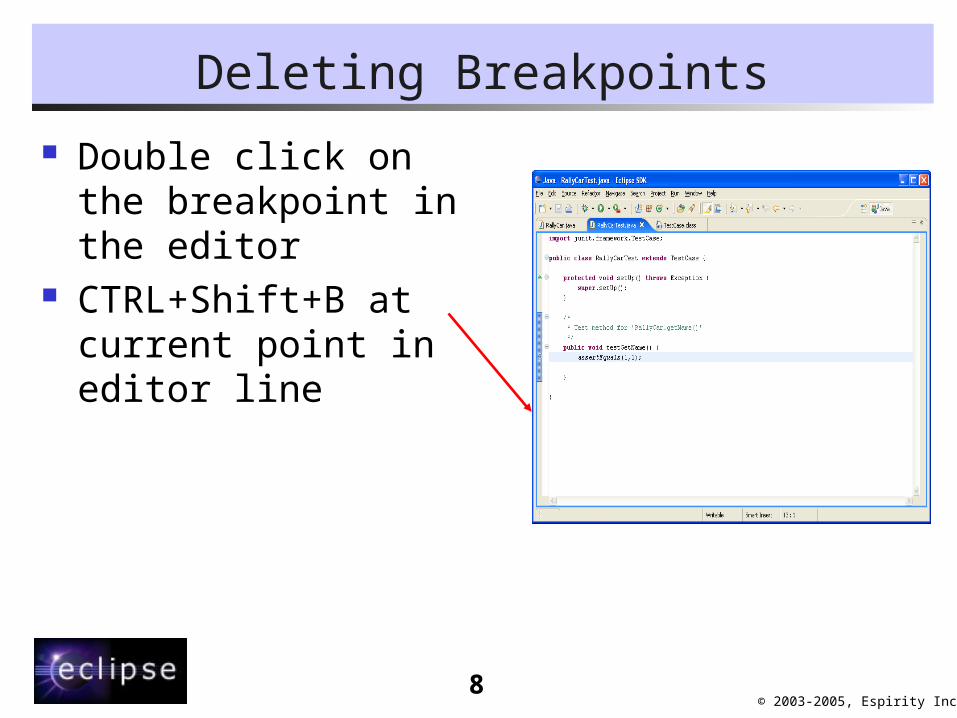
Deleting Breakpoints
Double click on the breakpoint in the editor
CTRL+Shift+B at current point in editor line
9© 2003-2005, Espirity Inc.
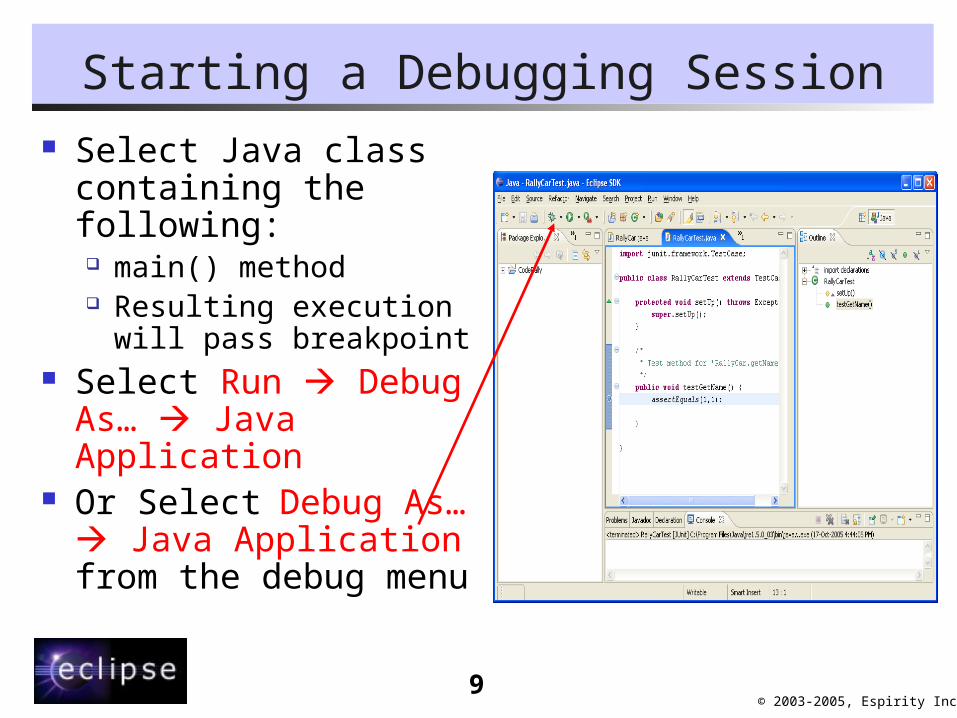
Starting a Debugging Session Select Java class
containing the following: main() method Resulting execution
will pass breakpoint Select Run Debug
As… Java Application Or Select Debug As…
Java Application from the debug menu
10© 2003-2005, Espirity Inc.
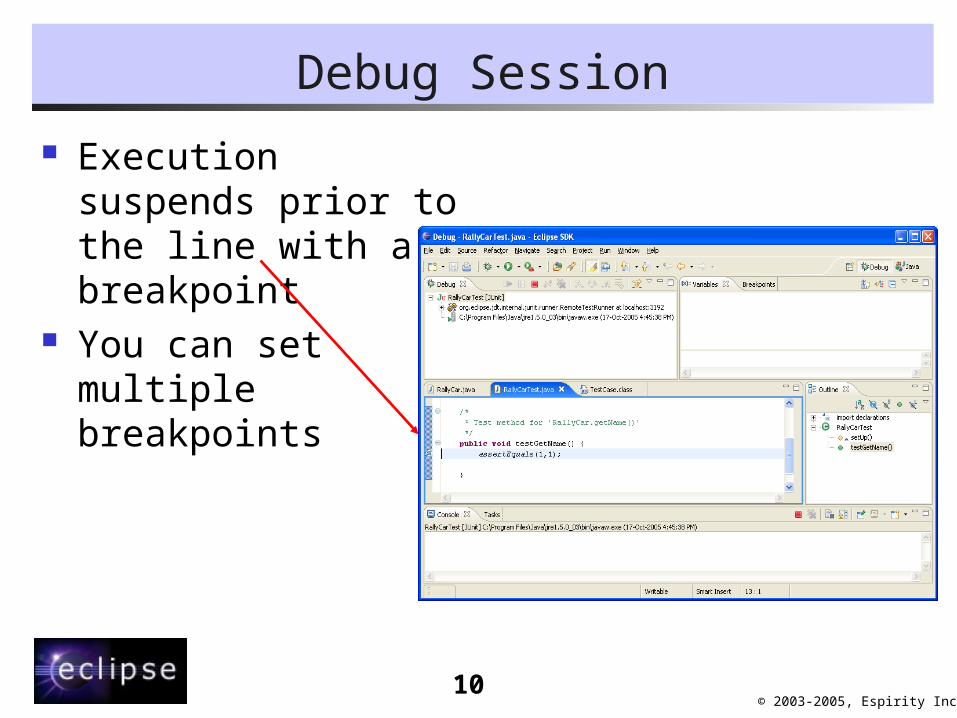
Debug Session
Execution suspends prior to the line with a breakpoint
You can set multiple breakpoints
11© 2003-2005, Espirity Inc.
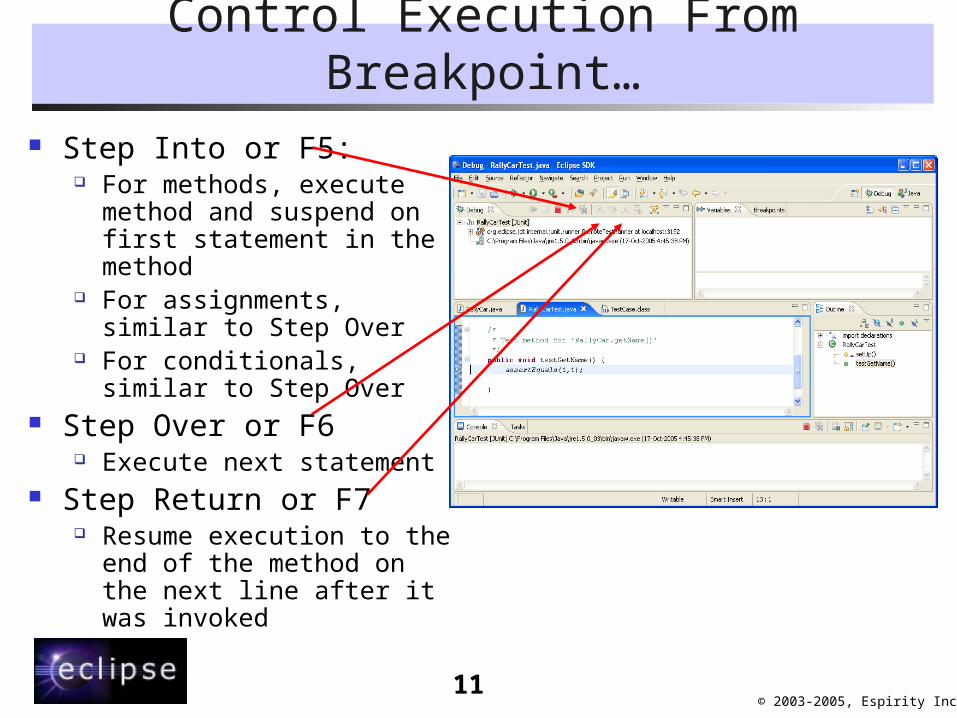
Control Execution From Breakpoint…
Step Into or F5: For methods, execute
method and suspend on first statement in the method
For assignments, similar to Step Over
For conditionals, similar to Step Over
Step Over or F6 Execute next statement
Step Return or F7 Resume execution to the
end of the method on the next line after it was invoked
12© 2003-2005, Espirity Inc.
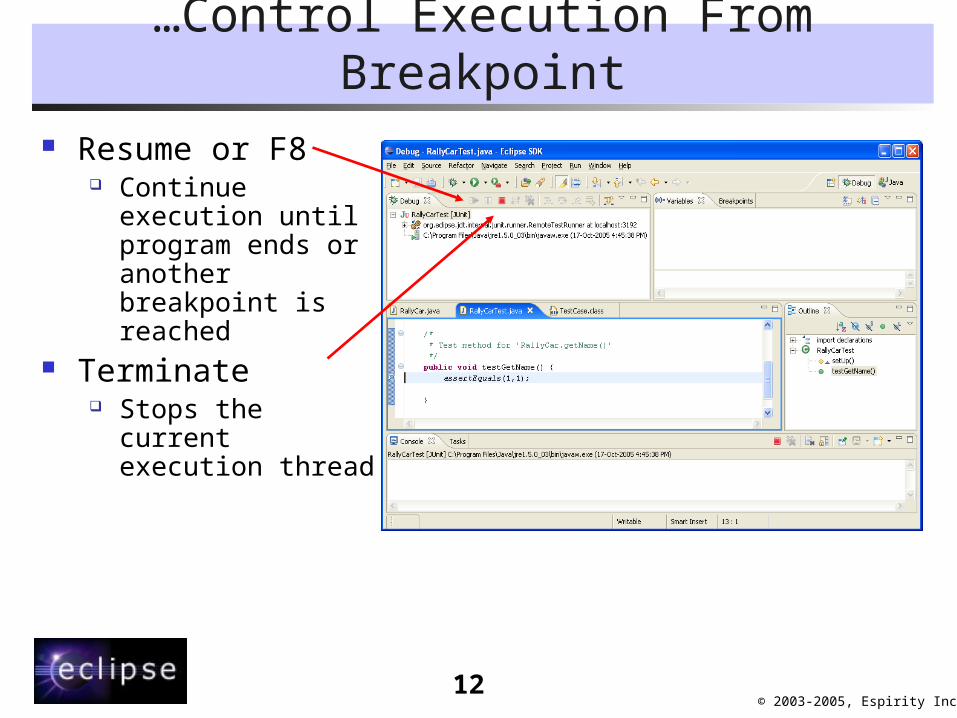
…Control Execution From Breakpoint
Resume or F8 Continue execution
until program ends or another breakpoint is reached
Terminate Stops the current
execution thread

13© 2003-2005, Espirity Inc.
Variables and Fields
To see the values bound to fields: Use Variables View Select variable in
editor and select Inspect
Select variable in editor and select Display

14© 2003-2005, Espirity Inc.
public class Debug {private int something = 0;private Vector list = new Vector();
public void firstMethod(){thirdMethod(something);something = something + 1;
}public void secondMethod(){
thirdMethod(something);something = something + 2;
}public void thirdMethod(int value){
something = something + value;}
public static void main(String[] args) {Debug debug = new Debug();debug.firstMethod();debug.secondMethod();}
}
Code Debugging in this Module
15© 2003-2005, Espirity Inc.
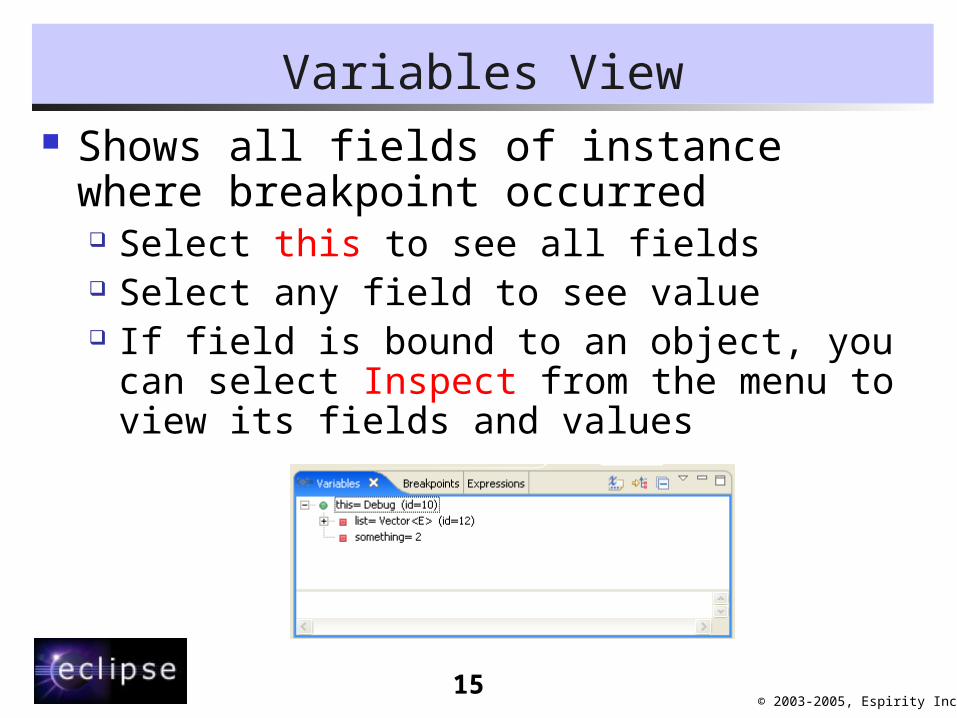
Variables View Shows all fields of instance where
breakpoint occurred Select this to see all fields Select any field to see value If field is bound to an object, you can
select Inspect from the menu to view its fields and values
16© 2003-2005, Espirity Inc.
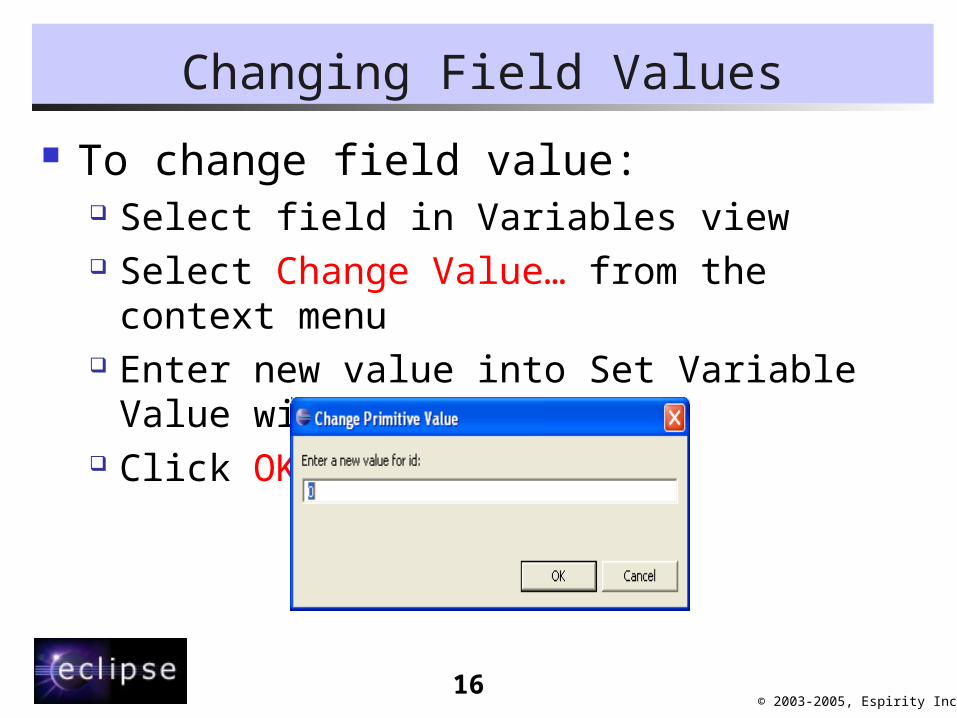
Changing Field Values
To change field value: Select field in Variables view Select Change Value… from the context
menu Enter new value into Set Variable Value
window Click OK
17© 2003-2005, Espirity Inc.
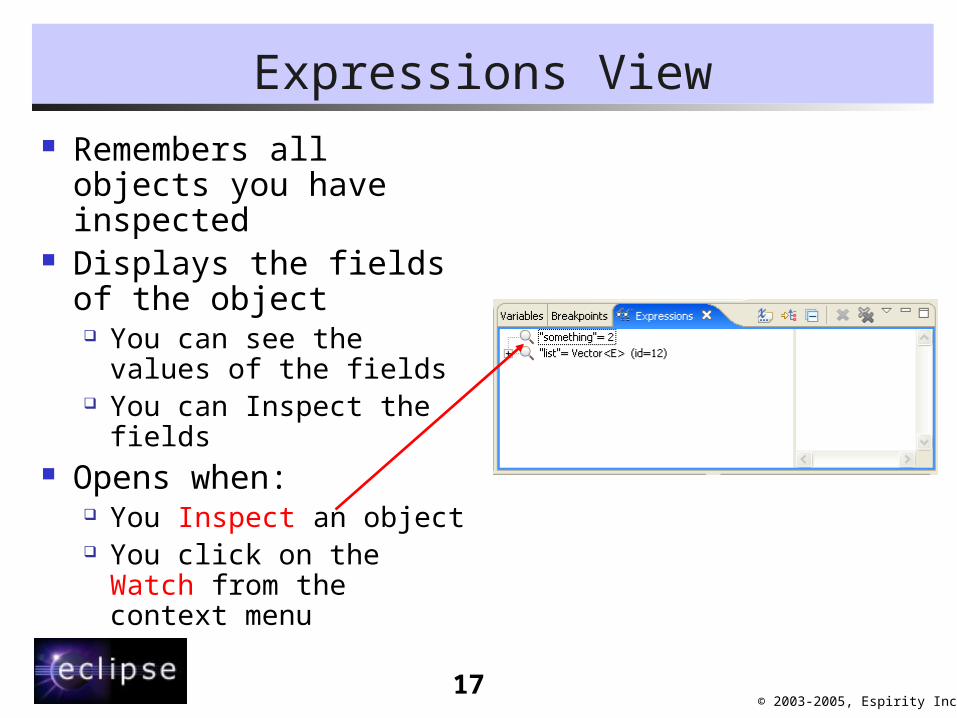
Expressions View Remembers all
objects you have inspected
Displays the fields of the object You can see the values
of the fields You can Inspect the
fields Opens when:
You Inspect an object You click on the Watch
from the context menu
18© 2003-2005, Espirity Inc.
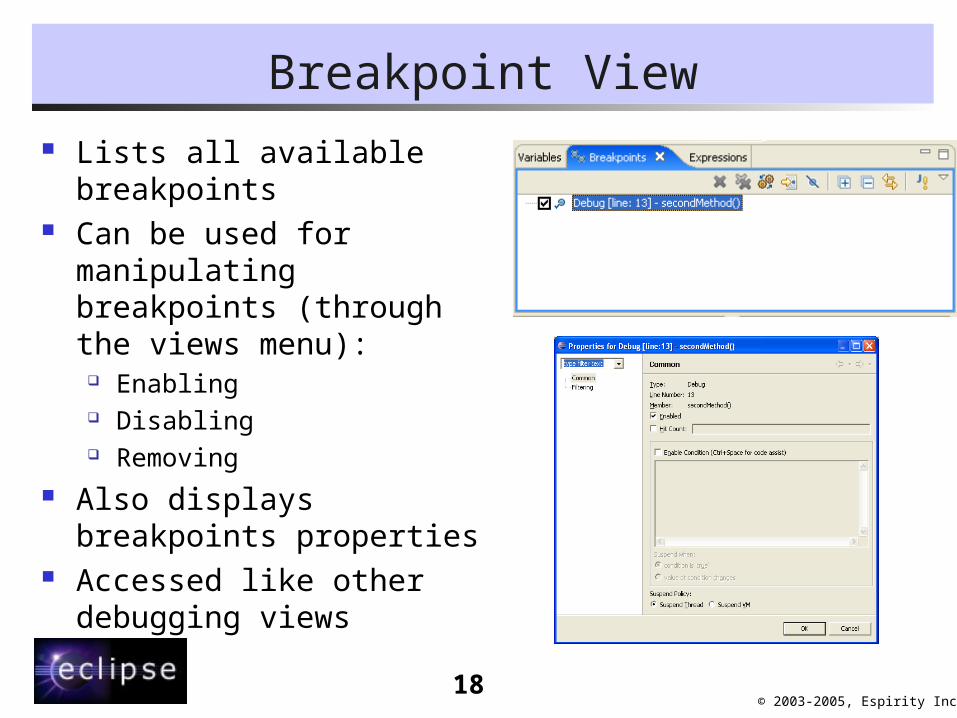
Breakpoint View Lists all available
breakpoints Can be used for
manipulating breakpoints (through the views menu):
Enabling Disabling Removing
Also displays breakpoints properties
Accessed like other debugging views

19© 2003-2005, Espirity Inc.
Debug View
Shows: Active threads Current stack frame
when execution has stopped
Previous stack frames Method and variables
are shown in the editor for the selected frame Update in the editor
updates the source

20© 2003-2005, Espirity Inc.
Breakpoint Types
Breakpoints can be set for the following Java entities: Line (simple breakpoint) Method Field (Watchpoint) Java Exception
Each breakpoint is set a different way and has different properties
21© 2003-2005, Espirity Inc.
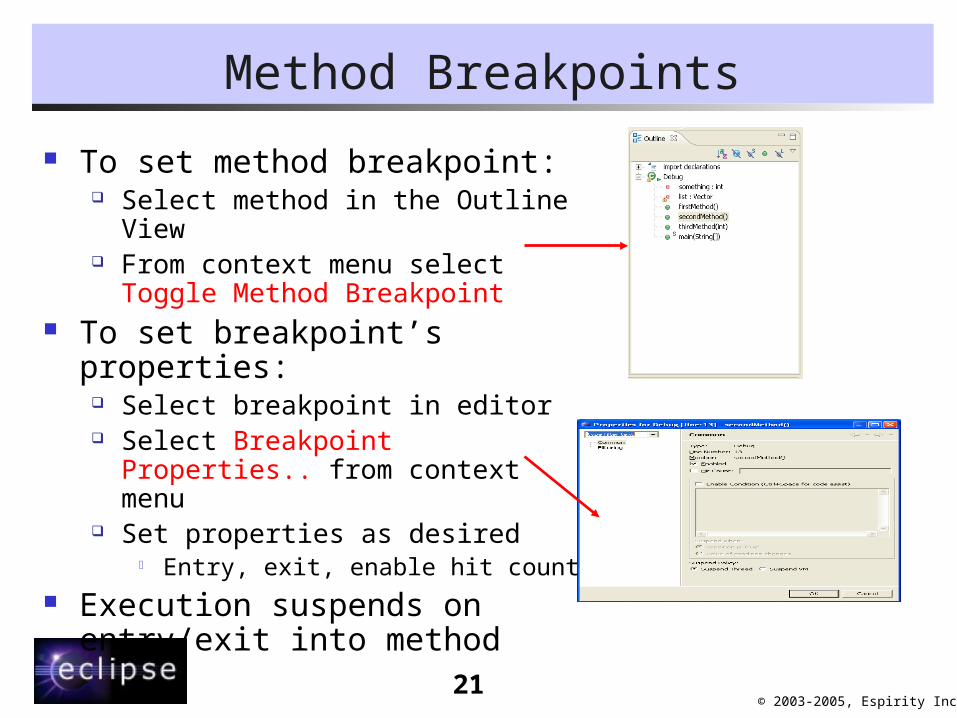
Method Breakpoints
To set method breakpoint: Select method in the Outline View From context menu select Toggle
Method Breakpoint To set breakpoint’s properties:
Select breakpoint in editor Select Breakpoint Properties.. from
context menu Set properties as desired
Entry, exit, enable hit count Execution suspends on
entry/exit into method
22© 2003-2005, Espirity Inc.
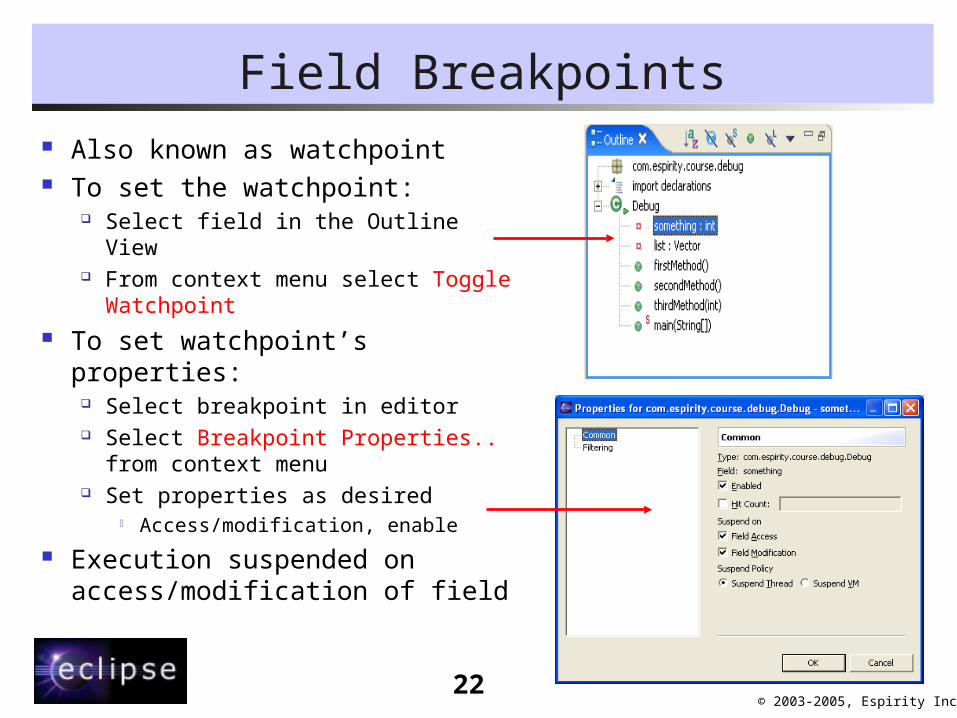
Field Breakpoints Also known as watchpoint To set the watchpoint:
Select field in the Outline View From context menu select
Toggle Watchpoint To set watchpoint’s
properties: Select breakpoint in editor Select Breakpoint Properties..
from context menu Set properties as desired
Access/modification, enable
Execution suspended on access/modification of field
23© 2003-2005, Espirity Inc.
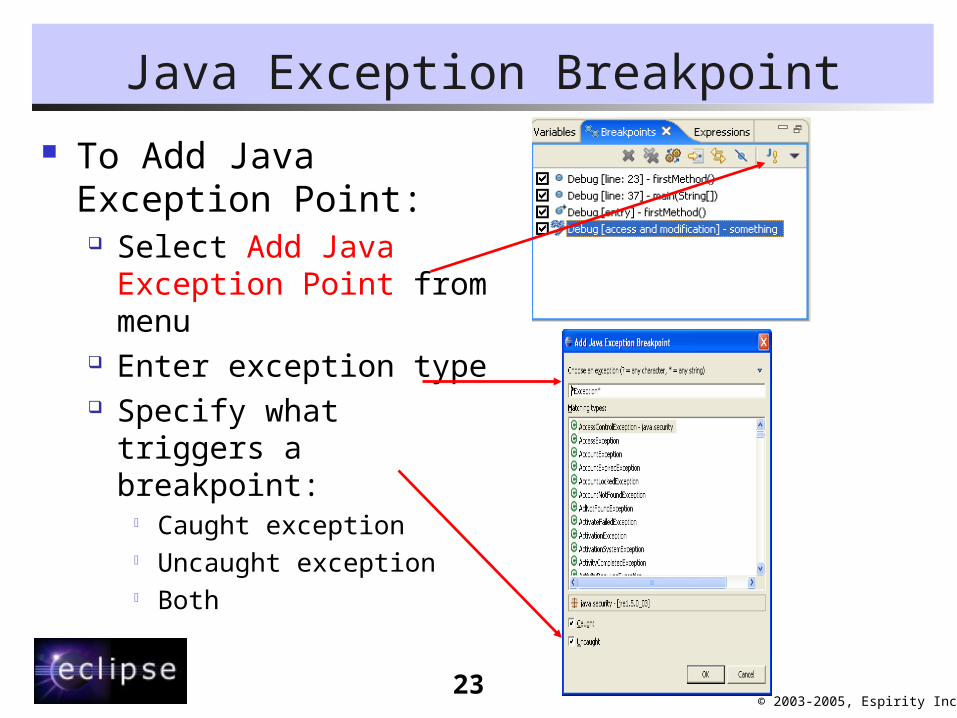
Java Exception Breakpoint
To Add Java Exception Point: Select Add Java
Exception Point from menu
Enter exception type Specify what triggers a
breakpoint: Caught exception Uncaught exception Both
24© 2003-2005, Espirity Inc.
How To Debug
Here are simple steps for debugging in Eclipse: Set your breakpoints Hit a breakpoint during execution Walk/step through code to other
breakpoints Follow along in editor Inspect/Watch interesting fields Watch the Console for things to happen
25© 2003-2005, Espirity Inc.
Summary
You have learned: The views in the Debug Perspective Typical debug session How to use the Inspector About the different types of breakpoints How to set breakpoints How step around your code doing
debugging
26© 2003-2005, Espirity Inc.
Labs!
Lab: Debugging in Eclipse