Embed Size (px)
Citation preview

DDeebbtt PPooll iiccyy SSttaa tteemmeenntt 2006-07
Debt Policy Coordination Office (DPCO),
Ministry of Finance, Government of Pakistan
Islamabad, January 31, 2007

i
TABLE OF CONTENTS
Table of Contents ...................................................................................................... i
List of Tables ........................................................................................................... ii
List of Figures .......................................................................................................... iii
List of Acronyms ..................................................................................................... iv
Acknowledgements ...................................................................................................v
Executive Summary ................................................................................................. vi
Purpose of this Publication ................................................................................ vi
Highlights ........................................................................................................... vi
Introduction ...............................................................................................................1
Objectives of Debt Management ..............................................................................2
State of the Public Debt ............................................................................................2
Dynamics of the Public Debt Burden .................................................................5
Domestic Debt ..........................................................................................................8
Domestic Debt Servicing ...................................................................................15
External Debt and Liabilities ...................................................................................16
Official Loan Disbursements .............................................................................19
New External Loans Signed...............................................................................21
External Debt Burden ........................................................................................22
Guarantees ................................................................................................................24
Report on Compliance with FRDL Act 2005 ..........................................................25
Debt Management Strategy ......................................................................................26
Strategies for Domestic Debt Management .......................................................27
Strategies on External Debt Management ..........................................................29
Strategies on Guarantees ....................................................................................29
Concluding Remarks ................................................................................................29

ii
List of Tables
Table 1. Public Debt, FY90-FY07 .........................................................................4
Table 2. Real Cost of Borrowing ...........................................................................5
Table 3. Dynamics of Public Debt Burden ............................................................6
Table 4. Outstanding Domestic Debt, FY02-FY07 ...............................................9
Table 5. Causative Factors in Change in Stock of Domestic Debt, FY06 ...........10
Table 6. Causative Factors in Change in Stock of Domestic Debt, FY07 ...........11
Table 7. Debt Servicing on Domestic Debt, FY06 .............................................15
Table 8. Domestic Debt Interest Payments Burden, FY91-FY07 .......................16
Table 9. Composition of EDLs, FY06 .................................................................16
Table 10. External Debt and Liabilities, FY02-FY07..........................................17
Table 11. Causative Factors in Change in External Debt and Liabilities, FY06 ...18
Table 12. Causative Factors in Change in External Debt and Liabilities, FY07 ...18
Table 13. Disbursement of Official Loans by Economic Classification, FY06 ....20
Table 14. New Official Loans Signed, FY06 ........................................................22
Table 15. Trends in External Debt Sustainability Indicators, FY00-FY07 ...........23
Table 16. Guarantees Issued, FY06 and FY07 ......................................................25

iii
List of Figures
Figure 1. Public Debt, FY90-FY07........................................................................3
Figure 2. Structure of Domestic Debt, FY99-FY07 ............................................12
Figure 3. Structure of Domestic Debt, FY03 and FY07 ......................................12
Figure 4. Weighted Average Yields at Auction (Jul 00- Dec 06) ........................13
Figure 5. PIB Issuance, FY01-FY07....................................................................13
Figure 6. Net Investment (NSS), FY02-FY07 .....................................................14
Figure 7. Currency Composition of Official Loan Disbursements, FY06 ...........21
Figure 8. External Debt and Liabilities, FY00-FY07 ..........................................23
Figure 9. Currency Composition of Official Debt Servicing, FY06......................23
Figure 10. Maturity Profile of External Debt, FY07-FY37 ...................................24

iv
LIST OF ACRONYMS
ADB Asian Development Bank BOP Balance of Payment BSC Bahbood Saving Certificates CAR Current Account Receipts CBR Central Board of Revenue DPCO Debt Policy Coordination Office DSC Defense Saving Certificates EAD Economic Affairs Division EDL External Debt and Liabilities FEE Foreign Exchange Earnings FER Foreign Exchange Reserves FIB Federal Investment Bonds FRDL Act Fiscal Responsibility and Debt Limitation Act FY07(Q1) First Quarter of FY07 (July-Sep.) GDP Gross Domestic Product GoP Government of Pakistan HBL Habib Bank Limited HTM Held to Maturity IMF International Monetary Fund INT Interest Payments KESC Karachi Electricity Supply Company LIBOR London Inter Bank Offer Rate MoF Ministry of Finance, Government of Pakistan MRTB Market Related Treasury Bills MTB Market Treasury Bills NSS National Saving Schemes PBA Pensioners’ Benefit Accounts PD Primary Dealers PIA Pakistan International Airline PIB Pakistan Investment Bonds PSDP Public Sector Development Program SBP State Bank of Pakistan SDR Special Drawing Rights STD Short-term Debt T-Bills Market Treasury Bills WAPDA Water and Power Development Authority

v
ACKNOWLEDGEMENTS This report has been produced by the Debt Policy Coordination Office (DPCO) to fulfill the requirement laid out under Section 7 of the Fiscal Responsibility and Debt Limitation (FRDL) Act 2005. It is a result of concerted efforts of many individuals. I would like to thank to various Ministries, Departments, Divisions and Agencies for timely provision of the data to the DPCO. In particular, we would like to acknowledge the support from Budget Wing (MoF), Corporate Finance Wing (MoF), EAD (Computer Center) and SBP. I would like to recognize the hard work put in by Dr. Farhan Hameed, Senior Economist (DPCO), in bringing this comprehensive policy document to fruition. This report also greatly benefited from input and experience of Mr. Zafar-ul-Hassan, Assistant Economic Advisor (EA Wing). A special thanks to Umara Daud (Domestic debt), Reema Kazmi and Samina Shabbir (External debt) for their able statistical and research support.
Dr. Ashfaque Hasan Khan Director General (Debt Office)
Ministry of Finance

vi
EXECUTIVE SUMMARY
I. PURPOSE OF PUBLICATION The Debt Policy Statement is presented to fulfill the requirement in Section 7 of the Fiscal Responsibility and Debt Limitation (FRDL) Act 2005. The statement provides an overview of the public debt as well as external debt and liabilities and explains the changes to debt over the FY06 and early FY07.
Section 7 of FRDL Act 2005 requires that:
1) The Federal Government shall cause to be laid before the National Assembly, the debt policy statement by the end of January of each year.
2) The purpose of the debt policy statement is to allow the assessment of the Federal Government’s debt policies against the principles of sound fiscal and debt management and debt reduction path.
3) In particular and without prejudice to the provisions of sub-section (2) the debt policy statement shall, inter alia, contain –
(a) Assessment of the Federal Government's success or failure in meeting the targets of total public debt to estimated gross domestic product for any given year as specified in the debt reduction path;
(b) Evaluations of external and domestic borrowing strategies and provide advice on these strategies;
(c) Evaluations of the nominal and real costs of external and domestic borrowing and suggest ways to contain these costs;
(d) Analysis of the foreign currency exposure of Pakistan's external debt;
(e) Consistent and authenticated information on public and external debt and guarantees issued by the Government with ex post facto budgetary out-turns of all guarantees and those of other such claims and commitments;
(f) Information of all loan agreements contracted, disbursements made thereof and repayments made thereon, if any, by the Government during the fiscal year; and
(g) Analysis of trends in public debt and external debt and steps taken to conform to the debt reduction path as well as suggestions for adjustments, if any, in the Federal Government's overall debt strategy.
II. HIGHLIGHTS In the last five years, Pakistan has recorded some of the highest growth rates seen in recent history which has enhanced the country’s ability to carry debt. At the same time,

vii
funds borrowed have been used effectively to finance infrastructure development as well as structural reforms which provided a further impetus to growth.
Some salient features are illustrated below:
♦ As a result of the credible strategy being followed by the Government, the public debt- to-GDP ratio, which stood at almost 80 percent at the end of FY02, declined substantially to 56 percent by the end of FY06. This reflects a 24 percentage points decline in country’s debt burden in 5 years.
♦ At the end of FY05, the total public stood at 61.5 percent of GDP while at the end of FY06, total public debt was 56 percent of GDP. This represents a reduction in debt as a percentage of GDP of 5.5 percentage points which is greater than the 2.5 percentage points as required by FRDL Act 2005.
♦ Total public debt as percentage of total revenue has also declined from 562 percent at the end of FY02 to 394 percent by the end of FY06.
♦ At the end of FY06 total domestic debt stood at Rs. 2312 billion which is 30 percent of GDP. The net increase in domestic debt was Rs. 153 billion or 7.1 percent from end of FY05 where domestic debt was Rs. 2158 billion.
♦ The increase in the domestic debt during FY06 in absolute terms primarily came from a rise in the stock of floating debt which increased by 162 billion.
♦ During the last five years, the debt servicing of public debt has declined sharply from 50.2 percent of total revenue in FY02 to 27.8 percent of total revenue in FY06 and from 44.7 percent of current expenditure in FY02 to 27.4 percent of current expenditure in FY06.
♦ Over the last five year, external debt and liabilities as percentage of GDP have declined from 51 percent in FY02 to 28.9 percent in FY06.
♦ External debt and liabilities as percentage of GDP have declined from 32.3 percent in FY05 to 28.9 percent in FY06. During the first quarter of FY07 this ratio has further declined to 26.3 percent of the projected GDP for the year.
♦ The total disbursements of official loans during FY06 was US$ 2.26 billion of which multilateral loans accounted for US$ 1.9 billion while Paris club bilateral loans accounted for US$ 330 million.
♦ Nearly US$3.05 billion of new official loans were signed in FY06. Around 55 percent of new loans signed were for earthquake relief assistance.
♦ Pakistan successfully tapped the global capital market in FY06 raising US$ 0.8 billion through two different issues of long term paper (10 Year and 30 Year).

viii
♦ Pakistan’s sovereign foreign currency bond rating was revised upward in Nov 2006 by Moody’s from B2 to B1 which is just three notches below investment grade.
♦ Sum total of new guarantees on loans issued by the government in FY06 were less than 0.2 percent of GDP against the upper limit of 2.0 percent of GDP set by the FRDL Act 2005.
III. DEBT MANAGEMENT STRATEGY The government plans to put in place several measures to meet its twin objectives of borrowing at the minimum cost while keeping risks in check and of developing an efficient local currency sovereign debt market.
♦ The DPCO will publish an analytical report on debt on a quarterly basis.
♦ DPCO will establish links with the four debt management units in the government (SBP, EAD, NSS and Budget Wing) in order to develop an updated electronic database of all components of debt on a historical basis.
♦ The Government will announce a regular calendar for PIB auctions (most likely on a quarterly basis) and also clearly indicate its targets.
♦ Further, the Government will reduce its stock of MRTBs at a measured pace either by issuing PIBs and/or MTBs.
♦ The government will adopt a more balanced approach to borrowing through NSS and consider modifications to NSS instruments in order to make them more market based.
♦ The government will develop a comprehensive external borrowing strategy in coming years which is consistent with borrowing constraints such as saving-investment gap, amortization payments, reserve targets and most importantly the GoP’s medium-term development priorities.
♦ The government will continue to tap the global capital market through regular issuance of bonds (conventional and Islamic) to ensure a steady supply of GoP sovereign paper, establish a bench mark for Pakistan and keep Pakistan on the radar screen of global investors.
♦ The DPCO will develop a framework for regularly assessing the revaluation of debt arising from changes in cross-country exchange rates as well as changes in estimated debt servicing.
♦ The government will closely monitor the share of external debt stock and payments which are on a floating basis and develop a framework to assess on a timely basis the risks arising from developments in the global capital markets.

ix
♦ The government will use various interest rate swaps and cross-currency swap arrangements to hedge the exposure from its external loans.
♦ The government will undertake a study to document the current process for approval and reporting of government guarantees in the GoP.
♦ DPCO will create mechanisms for exchange of information on a regular basis with those units in the government which issue or approve guarantees.

I . INTRODUCTION 1. Prudent debt management is an essential component of macro economic stability and economic growth. Developing countries need to borrow in order to finance their development but this need to be balanced by ability to make repayments as well as ensuring that the borrowed funds are used for productive expenditures. Pakistan has been successful on both these fronts in the last five years. First, by recording some of the highest growth rates seen in recent history, the country’s ability to carry debt has been enhanced. Secondly, the funds have been used effectively to finance infrastructure development as well as structural reforms which provided a further impetus to growth.
2. Any debt strategy is incomplete without a supporting fiscal policy. The root cause of increase in debt is fiscal imbalances so the importance of a prudent fiscal policy cannot be overemphasized. A sound fiscal policy is essential for preventing macroeconomic imbalances and realizing the full growth potential. Pakistan has witnessed serious macroeconomic imbalances in the 1990s mainly on account of its fiscal profligacy. Persistence of large fiscal deficit resulted in unsustainable levels of public debt, adversely affecting the country’s macroeconomic environment. Pakistan accordingly paid a heavy price for its fiscal indiscipline in terms of deceleration in economic growth and investment, and the associated rise in the levels of poverty. Considerable efforts have been made over the last six years to inculcate financial discipline by pursuing a sound fiscal policy. Pakistan’s hard earned macroeconomic stability is underpinned by fiscal discipline.
3. Over the past several decades, there has been increasing acceptance worldwide that financial discipline over a prolonged period is essential for maintaining macroeconomic stability. There is also a general consensus that a prolonged commitment to financial discipline can only come from a rule-based fiscal policy. What is a rule-based fiscal policy? The rules essentially represent constraints which prevent governments from taking the fiscally irresponsible route. International experience suggests that countries that have adopted well-designed fiscal rules and implemented effective operational mechanism for enforcing them have made important credibility gains, reflected by cheaper access to financial markets and greater electoral support. Fiscal policy rules are of several types, however, they are broadly defined as rules that impose a permanent constraint on fiscal deficits or borrowing or debt or a combination of all three indicators of fiscal performance.
4. Excessive borrowing of the past curtails the government's ability in the future to invest in important development programs relating to health, education, population planning, nutrition, and employment creation. However, it has been observed that fiscal adjustment only comes when the cost of accruing more debt becomes inordinately high and there is no option but to make an adjustment. A fiscal policy rule can therefore be

2
used as an instrument to get round this bias and encourage fiscal sustainability and macroeconomic stability, while leaving room for maneuverability in times of exigencies through the provision of safeguards or escape clauses.
5. The government believes that there is no alternative to a rule-based fiscal policy. Accordingly, a rule-based fiscal policy, enshrined in the Fiscal Responsibility and Debt Limitation (FRDL) Act 2005, was by the Parliament in June 2005. This Act ensures responsible and accountable fiscal management by all governments ⎯ the present and the future — and would encourage informed public debate about fiscal policy. It requires the government to be transparent about its short and long term fiscal intensions and imposes high standards of fiscal disclosure. Given the difficult past of Pakistan’s macroeconomic environment during the 1990s, a rule-based fiscal policy was considered essential for maintaining macroeconomic stability and promoting growth on a sustained basis.
6. Due to a credible debt reduction strategy and successive high growth rates, Pakistan has reduced its public debt burden (including Rupees debt and foreign currency debt) from 100.3 percent of GDP in end-FY99 to 56 percent of GDP in end-FY06. Similarly, public debt as percentage of total revenue has also declined from 562 percent at the end of FY02 to 394 percent by the end of FY06. Despite these successes there is a need to remain vigilant. There has been a shift in domestic borrowing from long term paper to floating debt which unless checked early can lead to increased vulnerability of domestic debt to refinancing risk.
II . OBJECTIVES OF DEBT MANAGEMENT 7. The main objectives of the Government for debt management include:
a) Bridging the financing gap of the government by using instruments which minimize the cost of borrowing while keeping in check risks associated with the debt such as interest rate risk and refinancing risk.
b) Managing the debt to ensure that the government is able to meet its past debt obligations for domestic debt as well as external debt and liabilities.
c) Developing the local Rupees sovereign bond market which can provide a credible benchmark for a local debt capital market.
III . STATE OF PUBLIC DEBT
8. Public debt consists of debt denominated in Rupees and debt denominated in foreign currency. Pakistan’s public debt grew by 6.7 percent in the FY06 which translates into an annual average growth rate of 6.15 percent since FY00 while the nominal GDP showed a growth rate of 12.4 percent over the same period. This is in sharp contrast to

3
the experience in the last two decades where Pakistan’s public debt grew at an average rate of 18 percent and 15 percent per annum during the 1980s and 1990s, respectively – much faster than the growth in nominal GDP (11.9% and 13.9% respectively).
9. As a result of slower pace of growth in pubic debt than the nominal GDP, public debt as a percentage of GDP has continued its declining trend. Public debt as percentage of GDP fell from 61.5 percent at the end of FY05 to 56 percent at the end of FY06. This low level of debt is even more remarkable because just 7 years ago at the end of FY99, debt stood at just over 100 percent of GDP. The lower pace of growth in debt is partly a result of lower average fiscal deficits and current account deficits compared to 1990-99 where average fiscal and current account deficits were almost 7 percent and 5 percent of GDP respectively.
Figure 1. Public Debt, FY90-FY07* (% of GDP)
61.5
50.1
56.0
67.1
75.1
79.7
89.191.7
0
20
40
60
80
100
FY90 FY95 FY02 FY03 FY04 FY05 FY06 FY07 (Q1)
Rupee Debt Foreign Currency Debt Total Public Debt
10. There are clear indications that the debt strategy put in place by the government is bearing fruit as indicated by declining trends in debt. The government had set-up a high level Debt Committee in 2000, which examined the root causes of the rising debt burden and suggested debt reduction strategy to stabilize the debt situation. The government is following the debt strategy as suggested by the Committee. Reduction in the fiscal and current account deficits, lowering the cost of borrowing, raising revenue and foreign exchange earnings, and debt re-profiling from the Paris Club have been the key features

4
of the debt reduction strategy. To provide legal cover to the debt reduction strategy a Fiscal Responsibility and Debt Limitation (FRDL) Act 2005 has been promulgated in June 2005.
11. As a result of the credible strategy being followed by the Government, the public debt- to-GDP ratio, which stood at almost 80 percent at the end of FY02, declined substantially to 56 percent by the end of FY06. This reflects a 24 percentage points decline in country’s debt burden in 5 years. During the first quarter of FY07 this ratio has further declined to 50.1 percent of the projected GDP for the year. In absolute terms public debt grew a meager 6.7 percent during FY06.
12. The capacity to carry debt is dependent on the size of the economy (GDP) as well as the resources available to the government to service that debt, therefore debt should also be considered in relation to government revenue. As can be seen in Table 1, public debt at the end of FY99 was at a high of 629 percent of total revenue. Following the debt reduction strategy, which included raising revenue as one of the key elements, the public debt burden in relation to total revenue has declined substantially to 394 percent by end-FY06.
Table 1. Public Debt, FY90-FY07
FY90 FY95 FY99 FY02 FY03 FY04 FY05 FY06 FY07(Q1) (In Billions of Rs.) Domestic Currency Debt Foreign Currency Debt Total Public Debt
374 428 801
790 873
1662
1389 1557 2946
1715 1795 3510
1854 1769 3623
1979 1808 3789
2133 1913 4045
2296 2022 4318
2346 2065 4411
(In percent of GDP) Rupees Debt Foreign Currency Debt Total Public Debt
42.8 48.9 91.7
42.3 46.8 89.1
47.3 53.0 100.3
39.0 40.8 79.7
38.4 36.7 75.1
35.1 32.0 67.1
32.4 29.1 61.5
29.8 26.2 56.0
26.6 23.4 50.1
(In percent of Revenue) Rupees Debt Foreign Currency Debt Total Public Debt
235 269 505
245 270 515
296 332 629
275 288 562
257 245 503
246 224 470
237 212 449
210 185 394
189 167 356
(In percent of Total Debt) Rupees Debt Foreign Currency Debt
46.6 53.4
47.5 52.5
47.2 52.8
48.9 51.1
51.2 48.8
52.3 47.7
52.7 47.3
53.2 46.8
53.2 46.8
Memo: Foreign Currency Debt (in billion U.S.$) Exchange Rate (Rs./US$, EOP) GDP (in Rs. Billion) Total Revenue (in Rs. Billion)
19.5 21.9 874 159
28.1 31.1 1866 323
30.2 51.6 2938 469
29.9 60.1 4402 624
30.6 57.7 4823 721
31.2 57.9 5641 806
32.1 59.7 6581 900
33.6 60.2 7713 1095
34.1 60.5 8808 1239
Source: Various Economic Survey, SBP, Budget Wing (MoF) and calculations by DPCO staff.

5
13. The structure of public debt has seen a subtle change over the last 5 years where share of Rupees debt in total public debt has been increasing. At the end of FY02, Rupees debt represented 48.9 percent of total debt while foreign currency loans accounted for 51.1 percent of total debt. By end of FY06, the shares had shifted where the Rupees debt stands at 53.2 percent of total debt while the share of foreign currency debt has been reduced to 46.8 percent.
14. During the last five years, the debt servicing of public debt has declined sharply from 50.2 percent of total revenue in FY02 to 27.8 percent of total revenue in FY06 and from 44.7 percent of current expenditure in FY02 to 27.4 percent of current expenditure in FY06. The subsequent fiscal space created by bridging the revenue-expenditure gap and low debt servicing cost has enabled the Government to increase spending on the public sector development program (PSDP) as well as poverty and social sector related expenditures.
15. Although public debt is now on a solid downward footing, sustaining the momentum will be a continuing challenge. The coming years will see an increase in borrowing particularly in the foreign currency component to finance the infrastructural development program. The large infrastructure projects envisaged in the next decade will increase the debt burden if sufficient revenues are not generated from within the country.
III -1: Dynamics of the Publ ic Debt Burden 16. What are the main factors behind the increase in public debt over the last two decades? The rise appears to be largely accounted for by the high real cost of borrowing and stagnant government revenue. As stated earlier, public debt consists of debt payable in rupees and debt payable in foreign exchange. The real cost of borrowing for these two components of public debt is measured differently. As shown in Table 2, the real cost of Pakistan’s domestic debt has varied greatly over the last two decades. During the 1980s, the real cost of domestic public debt was only 1.0 percent.
17. The interest rates on domestic debt rose sharply in early 1990s due to financial sector liberalization but the much higher interest rate to a large extent was wiped out by the sharp acceleration in inflation in the 1990s. The average real cost of borrowing for the
External Debt
Domestic Debt
Public Debt
1980s 3.4 1.0 2.31990s 2.7 3.2 2.91990-I -3.0 -1.9 -2.41990-II -5.5 5.7 5.62000-03 -1.7 6.3 4.32003-07* -2.7 0.7 -1.7
Table 2: Real Cost of Borrowing (Percent)
Source: EA Wing and DPCO calculations.* Jul. 2003 - end Sep. 2006.

6
domestic component of the public debt was 3.2 percent because of double digit inflation for most of the 1990s. Further dis-aggregation of the 1990s suggests that the real cost of domestic borrowing was negative (1.9 percent) in the first half of the 1990s but rose sharply (5.7 percent) in the second half, mainly because of a decline in inflation. During the first three years of the decade (2000-03), the real cost of borrowing for domestic debt was 6.3 percent owing to lower inflation but in the last three years (2003-06) the cost of borrowing declined to 0.7 percent partly due to rising inflationary pressure in the economy as well as declining nominal cost of borrowing.
Primary Fiscal Balance
Real Cost of Borrowing
Real Growth of Debt
Real Growth of Revenues
Real Growth of Debt Burden
(Percent of GDP)1980s -3.7 2.3 10.6 7.6 3.01990s -0.3 2.9 4.9 2.9 2.01990-I -1.8 -2.4 3.6 3.2 0.41990-II 1.1 5.6 6.2 2.5 3.72000-03 1.6 4.3 1.4 6.9 -5.52003-07* 0.1 -1.7 -2.3 3.8 -6.1
Table 3. Dynamics of Public Debt Burden
(Percent per year)
Source: EA Wing and DPCO staff calculations. * Jul. 2003 - end Sep. 2006.
18. The issue of measuring the real cost of foreign borrowing (debt payable in foreign exchange) is complex. In the case of the rupee component of debt, only the interest cost is taken into account, but in the case of foreign borrowing, interest cost as well as the cost due to depreciation of the rupee (or capital loss on foreign exchange) is taken into account. Thus, the capital loss on foreign exchange is added to the real interest cost. The average real cost of foreign borrowing was 3.4 percent and 2.7 percent per annum in the 1980s and 1990s respectively [See Table 2]. Further dis-aggregation reveals that the real cost of borrowing was much higher (5.7 percent) in the second half of the 1990s mainly on account of a sharp depreciation of the rupee viz the US dollar and falling domestic inflation. Interestingly, the real costs of both the domestic and foreign debt averaged more or less the same in the second half of the 1990s. During the first three years of the current decade (2000-03), the real cost of borrowing for foreign exchange denominated loan declined to 1.7 percent and further turned into negative 4.1 percent in the forthcoming three years (2003-06). During the first three years (2000-03), the appreciation of Rupee along-with low domestic inflation contributed to lowering of interest rates but in the next three years (2003-06), the depreciation of rupee along-with higher inflation contributed to negative incidence of real cost of borrowing. The lower implied cost of external borrowing has contributed to overall declining trend in real cost of borrowing during the last six years. As a result of the sharp fluctuation in the real cost of borrowing for both domestic and foreign debt, the dynamics of the growth in public debt also changed over the last two decades.

7
19. The changing dynamics of public debt is well-documented in Table 3. The growth in the public debt burden averaged 3.0 percent and 2.0 percent per annum during the 1980s and 1990s. Although, public debt grew in real terms at a very high rate of almost 11 percent per annum in the 1980s; it did not immediately lead to a sharp rise in debt burden because the debt carrying capacity (real growth in revenues) of the country was rising by around 8.0 percent per annum. However, it sowed the seeds for future difficulties because real growth in revenue continued to decelerate in the 1990s. Interestingly, the rate of real growth in public debt decelerated to 4.9 percent but the decline in the public debt burden was not substantial because of a slowdown in the real growth of revenues. Real public debt grew at a faster pace of 6.2 percent during the second half of the 1990s as did the public debt burden which rose by 3.7 percent against a marginal rise of 0.4 percent during the first half of the 1990s. The real cost of borrowing was highest at 5.6 percent per annum, on average, during the second half of the 1990s. A sharp real depreciation in the exchange rate causing real cost of borrowing to rise, slower real growth in revenue and a low level of international as well as domestic inflation have been responsible for the rise in the public debt burden in the second half of the 1990s.
20. The pendulum swung to other extreme during 2003-071 when the real cost of foreign borrowing turned negative (-2.7 percent) from 1.7 percent in 2000-03. The parameters witnessed considerable changes in the first three years and the last three years. During the first three years (2000-03), the interest rates and inflation were benign along with appreciation of Pak-rupee. On the other hand in the last three years (2003-07) interest rate and inflationary pressure bounced back, and rupee depreciated against major currencies.
21. The real cost of rupees borrowing increased substantially to 6.3 percent on average during 2000-03 as against 5.7 percent in the second half of 1990s, mainly on account of a sharp deceleration in inflation. However, the real cost of borrowing for public debt averaged 4.3 percent during 2000-03, slightly lower than 5.6 percent in the second half of the 1990s.
22. The improvement in the real cost of foreign currency borrowing on the one hand and fiscal consolidation effort on the other resulted in a sharp decline in the debt burden during 2000-03. The main contributor to this decline came from massive increase in real revenues and a slower real growth in debt. As can be seen in Table 3, during 2003-07 the real growth in revenues slowed owing to inflationary pressure in the economy, however, the public debt declined witnessed a negative growth in real terms by 2.3 percent which helped in deceleration in debt burden to the extent of 6.1 percent.
1 FY07(Q1) refers to the first quarter of FY07 which is the latest available data on foreign currency debt.

8
23. As shown in Table 3, the primary fiscal balance remained in surplus on average between 2003-07 and the real growth of debt also registered a decline of 2.3 percent. At the same time real revenue grew at an average rate of 3.8 percent per annum. The combined effect of growth in revenue and sharp reduction in debt growth resulted in a sharp decline of (6.1% per annum) in the country’s debt burden during the last three years.
24. An analysis of the dynamics of the public debt burden provides useful lessons for policy-makers to manage the country’s public debt. First, every effort should be made to maintain a primary surplus in the budget. Second, the interest rate and inflation environment should remain benign. Third, the pace of revenue growth must continue to rise to increase the debt carrying capacity of the country and fourth, the exchange rate stability will help reduce the country’s public debt burden. Center to all these lessons is the pursuance of prudent monetary, fiscal and exchange rate policies.
III -2: Domest ic Debt
25. Borrowing from domestic financial sources has several advantages including avoidance of exchange rate risk, lower liquidity risk and ability to deflate debt through higher inflation. On the other hand in most developing countries financial sectors are comparatively small which limits availability of credit. Excessive borrowing by the public sector could lead to crowding out of the private sector as well as high interest rates and inflation. As the financial sector in Pakistan has expanded government has relied more on borrowing from the domestic sources which at the end of first quarter of FY07 (Q1) accounted for 53.2 percent of total public debt.
26. At the end of FY06 total domestic debt stood at Rs. 2312 billion which is 30 percent of GDP. The net increase in domestic debt was Rs. 153 billion from end of FY05 where domestic debt was Rs. 2158 billion. This represents a growth rate of 7.1 percent which is slightly higher than the average growth rate since FY00 of 6.6 percent but still lower than the pace of growth in domestic debt observed in 1980’s and 1990’s which were 20 percent and 16 percent, respectively.
27. The domestic debt is classified in three main categories: permanent debt, floating debt and unfunded debt. Permanent debt includes medium and long-term debt such as Pakistan Investment Bonds (PIB) and prize bonds while floating debt consists of short-term borrowing in the form of T-bills. Unfunded debt refers mostly to outstanding balances of various national saving schemes. At the end of FY06, permanent debt represented 22 percent of total domestic debt while floating debt made up 41 percent. The remaining 37.1 percent consisted of unfunded debt.
28. As can be seen in Figure 2 and Figure 3 there has been a shift in shares of different components of domestic debt since FY99. In particular, shares of permanent debt and unfunded debt in total outstanding debt have been decreasing while the share of floating debt

9
has been increasing. The increase in the domestic debt during 2005-06 in absolute terms was primarily came from a rise in the stock of floating debt, which offset a decline in stock in the other two debt classes, permanent and unfunded.
29. There was a net decrease in stock of permanent debt by Rs. 11.3 billion. Floating debt increased by Rs. 162 billion while unfunded debt saw an increase of Rs. 2.44 billion. The reason for this temporary increase in unfunded debt is discussed later in this section.
FY02 FY03 FY04 FY05 FY06 FY07(End-Nov.)
Permanent Debt 424.8 468.8 570.0 526.2 514.9 509.5Market Loans 2.9 2.9 2.9 2.9 2.9 2.9Government Bond 9.6 9.6 9.6 9.5 9.4 9.4Prize Bonds 103.1 130.0 152.8 162.2 165.5 165.7Foreign Exchange Bearer Certificates 3.1 2.2 1.0 0.6 0.3 0.3Bearer National Fund Bonds 0.0 0.0 0.0 0.0 0.0 0.0Federal Investment Bonds 81.5 45.5 33.5 14.6 6.6 4.0Special National Fund Bonds 0.0 0.0 0.0 0.0 0.0 0.0Foreign Currency Bearer Certificates 0.8 0.1 0.1 0.1 0.1 0.0U.S. Dollar Bearer Certificates 0.1 0.2 0.2 0.1 0.0 0.0Special U.S. Dollar Bond 55.5 40.2 32.1 25.1 14.9 12.2Government Bonds Issued to SLIC 14.3 9.5 6.2 3.6 1.5 0.9Pakistan Investment Bonds (PIB) 153.8 228.7 331.6 307.6 303.9 304.2Government Bonds issued to HBL 0.0 0.0 0.0 0.0 9.8 9.8
Floating Debt 557.8 516.3 542.9 778.2 940.2 1035.7Adhoc Treasury Bills 122.8 0.0 0.0 0.0 0.0 0.0Treasury Bills on Tap 0.0 0.0 0.0 0.0 0.0 0.0Treasury Bills through Auction 197.5 402.5 345.2 452.7 432.1 464.9Rollover of Treasury Bills discounted SBP 10.7 0.5 0.5 0.6 0.6 0.6Treasurey Bills purchased by SBP (MRTB) 226.8 113.2 197.2 324.9 507.5 570.2
Unfunded Debt 792.1 909.5 899.2 854.0 856.5 877.7Defence Savings Certificates 287.0 309.0 312.2 303.5 296.0 294.1Khas Deposit Certificates and Accounts 0.6 0.6 0.6 0.6 0.6 0.6National Deposit Certificates 0.0 0.0 0.0 0.0 0.0 0.0Savings Accounts 7.7 9.3 8.6 9.1 7.2 7.4Mahana Amadni Account 2.0 2.2 2.3 2.4 2.4 2.5Postal Life Insurrance 29.9 37.3 46.0 56.3 66.2 66.2Special Savings Certificates and Accounts 256.2 346.2 335.9 250.7 192.2 192.1Regular Income Scheme 189.9 175.0 125.9 85.2 69.8 63.4Pensioners' Benefit Account 0.0 10.2 23.4 41.1 57.5 63.1Bahbood Savings Certificates 0.0 0.0 22.7 83.3 143.0 167.5G.P. Fund 18.7 19.7 21.6 21.8 21.6 20.9
Total Domestic Debt 1774.7 1894.5 2012.2 2158.4 2311.6 2422.9Total Domestic Debt (excluding foreign 1715.2 1851.9 1978.8 2132.6 2296.3 2410.3currency debt included in external debt)
(In billions of Rs.)
Table 4. Outstanding Domestic Debt, FY02-FY07
Source: Budget Wing, Ministry of Finance and DPCO staff calculations.

10
Stock Stock Reciepts RepaymentsNet
Investment(End FY05) (End FY06)
Permanent Debt 526.18 514.88 135.04 146.34 -11.30Market Loans 2.88 2.88 0.00 0.00 0.00Government Bond 9.49 9.42 0.00 0.07 -0.07Prize Bonds 162.18 165.51 89.47 86.14 3.33Foreign Exchange Bearer Certificates 0.61 0.30 0.00 0.31 -0.31Bearer National Fund Bonds 0.01 0.01 0.00 0.00 0.00Federal Investment Bonds 14.60 6.65 0.00 7.95 -7.95Special National Fund Bonds 0.00 0.00 0.00 0.00 0.00Foreign Currency Bearer Certificates 0.06 0.05 0.00 0.01 -0.01U.S. Dollar Bearer Certificates 0.07 0.05 0.00 0.02 -0.02Special U.S. Dollar Bond 25.08 14.85 0.18 10.41 -10.23Government Bonds Issued to SLIC 3.60 1.50 0.00 2.11 -2.11Pakistan Investment Bonds (PIB) 307.60 303.87 35.59 39.32 -3.73Government Bonds issued to HBL 0.00 9.80 9.80 0.00 9.80
Floating Debt 778.16 940.23 1568.99 1406.92 162.07Adhoc Treasury Bills 0.00 0.00 0.00 0.00 0.00Treasury Bills on Tap 0.01 0.01 0.00 0.00 0.00Treasury Bills through Auction 452.66 432.13 231.30 251.83 -20.53Rollover of Treasury Bills discounted SBP 0.55 0.55 0.00 0.00 0.00Treasurey Bills purchased by SBP (MRTB) 324.94 507.54 1337.69 1155.09 182.60
Unfunded Debt 854.04 856.49 295.47 293.02 2.44Defence Savings Certificates 303.49 296.01 17.45 24.93 -7.48Khas Deposit Certificates and Accounts 0.61 0.61 0.02 0.02 0.00National Deposit Certificates 0.02 0.02 0.01 0.01 0.00Savings Accounts 9.05 7.17 37.04 38.92 -1.89Mahana Amadni Account 2.38 2.41 0.12 0.10 0.03Postal Life Insurrance 56.32 66.17 10.46 0.61 9.85Special Savings Certificates and Accounts 250.66 192.18 112.76 171.24 -58.48Regular Income Scheme 85.22 69.85 16.23 31.61 -15.37Pensioners' Benefit Account 41.12 57.50 23.41 7.03 16.38Bahbood Savings Certificates 83.35 142.98 76.51 16.87 59.64G.P. Fund 21.83 21.59 1.45 1.69 -0.23
Total Domestic Debt 2158.39 2311.60 1999.49 1846.28 153.21Source: Budget Wing, Ministry of Finance and DPCO Staff calculations.
(In billions of Rs.)
Table 5. Causative Factors in Change in Stock of Domestic Debt, FY06
(in FY06)

11
Stock Stock Reciepts RepaymentsNet
Investment(End (End Nov FY07)
Permanent Debt 514.88 509.53 56.34 61.69 -5.35Market Loans 2.88 2.88 0.00 0.00 0.00Government Bond 9.42 9.39 0.00 0.03 -0.03Prize Bonds 165.51 165.68 33.86 33.69 0.17Foreign Exchange Bearer Certificates 0.30 0.28 0.00 0.02 -0.02Bearer National Fund Bonds 0.01 0.01 0.00 0.00 0.00Federal Investment Bonds 6.65 4.03 0 2.615 -2.62Special National Fund Bonds 0.00 0.00 0.00 0.00 0.00Foreign Currency Bearer Certificates 0.05 0.04 0.00 0.00 0.00U.S. Dollar Bearer Certificates 0.05 0.04 0.00 0.00 0.00Special U.S. Dollar Bond 14.85 12.23 0.00 2.62 -2.62Government Bonds Issued to SLIC 1.50 0.89 0.00 0.61 -0.61Pakistan Investment Bonds (PIB) 303.87 304.25 22.4821 22.1019 0.38Government Bonds issued to HBL 9.80 9.80 0.00 0.00 0.00
Floating Debt 940.23 1035.73 807.49 711.99 95.50Adhoc Treasury Bills 0.00 0.00 0 0 0.00Treasury Bills on Tap 0.01 0.01 0 0 0.00Treasury Bills through Auction 432.13 464.93 157.173 124.374 32.80Rollover of Treasury Bills discounted SBP 0.55 55.00 0.05 0.05 0.00Treasurey Bills purchased by SBP (MRTB) 507.54 570.24 650.24 587.54 62.70
Unfunded Debt 856.49 877.67 164.69 143.86 20.82Defence Savings Certificates 296.01 294.04 9.68 11.57 -1.89Khas Deposit Certificates and Accounts 0.61 0.60 0.00 0.00 0.00National Deposit Certificates 0.02 0.02 0.00 0.00 0.00Savings Accounts 7.17 7.36 20.91 20.72 0.20Mahana Amadni Account 2.41 2.45 0.08 0.03 0.04Postal Life Insurrance 66.17 66.17 0.00 0.00 0.00Special Savings Certificates and Accounts 192.18 192.14 62.65 62.69 -0.04Regular Income Scheme 69.85 63.37 8.96 15.43 -6.48Pensioners' Benefit Account 57.50 63.08 14.97 9.39 5.58Bahbood Savings Certificates 142.98 167.47 47.01 22.52 24.49G.P. Fund 21.59 20.87 0.43 1.51 -1.08
Total Domestic Debt 2311.60 2422.92 1028.51 917.55 110.97Source: Budget Wing, Ministry of Finance and DPCO Staff calculations.
(In billion of Rs.)
Table 6. Causative Factors in Change in Stock of Domestic Debt, FY07(end Nov.)
(in FY07 (end Nov.)

12
Fig-2: Structure of Domestic Debt (In Percent of total Domestic Debt)
0
10
20
30
40
50
60
FY99
FY00
FY01
FY02
FY03
FY04
FY05
FY06
FY07Q
1
Permanent Floating Unfunded
FY03
T-bills (SBP)6%
T-bills (Auctions)21%
PIB12%
Unfunded Debt48.0%
Federal Loans/Bonds6%
Prize Bonds7%
FY07
T-bills (SBP)24%
T-bills (Auctions)19%
PIB13%
Unfunded Debt35%
Federal Loans/Bonds2%
Prize Bonds7%
Figure 3. Struture of Domestic Debt, FY03 and FY07
30. Since PIBs are a long term security, freezing the issuance of new PIBs did not change the share of PIB in total debt substantially between FY03 (12%) and FY07 (end Nov.) (13%). The share of other federal loans and bonds has declined from 6 percent to 2 percent in large part because of maturing Federal Investment Bonds. As can be seen in Table 5, in FY06, the largest negative net investments in permanent debt were in FIBs ( Rs. 7.95 billion), Special U.S. Dollard Bonds (Rs. 7.97 billion) and PIBs (Rs. 2.90 billion). The large negative net investment in FIBs is due to the fact that these have been discontinued and replaced by the PIBs. The largest positive increase was for Government Bond to cover HBL CBR refund (Rs. 9.80 billion).

13
Figure 4. Weighted Average Yields at Auction (Jul 00-Dec 06)
0
2
4
6
8
10
12
14
16
Jul-00 Jul-02 Jul-04 Jul-06
Months
Perc
ent
T-Bill 12 Month
PIB 10 Year
Figure 5. PIB Issuance, FY01-FY07
0
20
40
60
80
100
FY01 FY02 FY03 FY04 FY05 FY06 FY07
Rs. (
billi
on)
(End Nov.)
31. The share of floating debt which had declined to 27 percent in FY04, increase to 41 percent by the end of FY06 and has further increased to 42.7 percent by end-Nov. FY07. The major categories under floating debt are Treasury Bills issued through auction and Treasury Bills extended by SBP (MRTB2). As Figure 3 shows that from FY03 to FY07 (end Nov.) there has been a substantial increase in the share of MRTBs which at the end of FY03 made up 6 percent of total domestic debt and by FY07 (end-Nov.) represented 24 percent of domestic debt. The share of treasury bills through auction in outstanding domestic debt remained nearly the same with the share changing from 21 percent in FY03 to 19 percent in FY07 (end-Nov.).
32. There are two fold reasons for this dramatic increase in reliance on short-term debt. First, there was limited issuance of long-term debt (PIBs) between July 2004 and April 2006 due to an unstable interest rate environment. As can be seen in Figure 5, the issuance of PIBs in FY05 and FY06 was substantially lower than earlier financial years. As can be seen in Figure 4, the spread between the weighted average yields on 10 year PIBs and 12 Month Treasury Bills were increasing in the second half of FY04. In the first half of FY05, SBP started to tighten the monetary conditions by increasing the auction rates for treasury bills at unpredictable pace. The rising short-term rates stoked the expectations of higher long-term rates which led to higher premium demands to compensate for the increased uncertainly. In this environment, the government opted to switch to short-term borrowing. As the short-term interest rates have stabilized the
2 Market Related Treasury Bills

14
government has re-entered the PIB market with successful auctions in May 2006 (Rs. 10 billion) and two auction in the first half of FY07 (Rs. 35 billion).
33. The second reason for higher reliance on floating debt was lower than expected net investment in NSS from FY04 to FY06. As can be seen in Figure 6, the net inflow in NSS was negative in FY05. While it was positive in FY04 and FY06, it was nowhere close to the levels observed in FY02 and FY03. This was likely a result of the lowering of NSS yields and the policy decision to ban institutional investors from NSS.
34. As a result of the negative net inflows, the share of unfunded debt has declined from 48 percent in FY03 to 35 percent by end November FY07 (See Figure 3). Over FY06, stock of unfunded debt increased by only Rs. 2.44 billion. The largest positive contributors in this increase was a positive inflow of Rs. 60 billion in Bahbood Saving Instruments (targeted to widows and orphans) while the largest negative contributor was a decline in stock of Special Savings Certificates and Accounts by Rs. 58 billion. There were net withdrawls from Defense Saving Certificates in the tune of Rs. 7.84 billion while there was a positive net investment of Rs. 16.38 billion in Pensioners’ Benefit Accounts (PBA). As can be seen in Table 5, most of net investment declines were compensated for by increases in inflows to Pensioner’s Benefit Account (PBA) and Bahbood Saving Certificates (BSC). Most likely this represents a shift of accounts from other instruments to higher interest bearing accounts such as BSC and PBA which have higher yields since they serve a social welfare purpose. The large shifts suggest that the targeting of account holders in BSC and PBA needs to be tightened to ensure that the higher yields (for social welfare purposes) are limited to the intended beneficiaries. The net investment in NSS should increase in the coming financial year with the government’s decision to allow institutional investors, other than banks and insurance companies, to invest in NSS again.
FY02
FY03
FY04
FY05
FY06
FY07
*
(75)
(25)
25
75
125
Rs. (
billi
on)
Fig-6: Net Investment (NSS), FY02-FY07

15
Debt Servicing †Share of Debt Servicing
Implied Interest Rate*
(FY06)
Permanent Debt 42.55 22.2 8.1Prize Bonds 7.34 3.8 4.5PIB 27.96 14.6 9.1Floating Debt 51.58 27.0 6.6T-Bill (Auction) 19.08 10.0 4.2T-Bill (SBP) 32.50 17.0 10.0Unfunded Debt 93.83 49.0 11.0DSC 45.18 23.6 14.9Special Saving (C&A) 24.02 12.6 9.6Reg. Income Sch. 8.06 4.2 9.5Pensioner's BA 4.97 2.6 12.1Bhabood SC 10.86 5.7 13.0Total 191.40 8.9
Table 7. Debt Servicing on Domestic Debt, FY06
(In billions of Rs.)(Percent)
Source: Budget Wing, MoF and DPCO Staff calculations.† Only large sub-components are shown under each cateogory of debt.*Calculated as debt servicing divided by stock as of end of FY05.
III-3: Domest ic Debt Servic ing 35. Total debt servicing on domestic debt in FY06 was Rs. 191.4 billion which is 2.5 percent of GDP and 17.5 percent of total revenue. As can be seen in Table 7, the largest share of payment was Rs. 45.18 billion (23.6 percent of total) for DSCs while interest payment on MRTBs was Rs. 32 billion (17 percent of total) and Rs. 28 billion (14.6 percent of total) on PIBs. In order to assess the cost of borrowing an implied interest rate is calculated as interest payments in FY06 divided by the stock at the end of previous financial year. The highest implied rate is for unfunded debt at 11 percent which is understandable since it includes many of the higher yield saving (NSS) instruments. The rate on DSC is calculated at 14.9 percent although the current yields on new DSCs are much lower. This is most likely because DSC are a 10 year instrument and debt servicing of DSC issued over the last decade at much higher rates (above 15 percent) are included. As expected, floating debt is the cheapest option with an average implied rate of 6.6 percent while the rate of permanent debt is 1.5 percentage points higher at 8.1 percent.

16
YearDomestic Outstanding Interest Payments
Tax Revenue
Total Revenue
Total Expenditure
Current Expenditure GDP
FY91 448.2 35.7 27.5 20.8 13.7 18.2 3.5FY95 807.7 77.9 30.2 24.1 18.2 22.5 4.2FY00 1642.4 210.2 51.8 41 29.6 33.5 5.5FY02 1774.7 189.5 38.6 29.6 22.3 26.4 4.2FY03 1894.5 166.9 28.9 22.3 17.9 20.3 3.3FY04 2012.2 161.5 25.1 19.2 16.5 20.3 2.7FY05 2158.4 176.3 27.9 19.6 15.8 20.4 2.7FY06 2311.6 191.4† 25 17.6 13.5 17.3 2.5FY07* 2286.8 190.8 21.5 16.4 12.4 17.2 2.2
(In billions of Rs.) (percent)
Table 8. Domestic Debt Interest Payments Burden, FY91-FY07Domestic Interest Payment (in percent of)
Source: Budget Wing (MoF) and EA Wing/DPCO staff calculations.* Budget Estimates. † Provisional
36. As a result of prudent fiscal management over the last 5 years, the burden of interest payments on the domestic budget has declined sharply, thereby, releasing resources for public sector development program (PSDP) and social sector programs. As shown in Table 8, interest payment on domestic debt as a percentage of total revenue has been reduced from 29.6 percent in FY02 to 17.6 percent in FY06. Similarly, as percentage of total expenditure it has declined from 22.3 percent in FY02 to 13.5 percent in FY06. Most importantly, as percentage of GDP, interest payments declined from 4.2 percent to 2.5 percent in the last five years.
IV. EXTERNAL DEBT AND LIABILITIES 37. External debt and liabilities (EDL) at the end of FY06 were US$ 37.26 billion. This is an increase of US$ 1.43 billion which represents a 4 percent increase over the stock at the end of FY05. Majority of the EDLs are in the form of medium and long term borrowing from multilateral bilateral lenders which accounts for nearly 80 percent of outstanding debt (see Table 9). The share of short-term debt is extremely low at 0.5 percent. Pakistan has taken advantage of an earlier Paris Club rescheduling to re-profile its debt at a more manageable level.
Component PercentPublic and Publicly Guaranteed 87.5
Paris club 34.4Multilateral 44.4Other bilateral 2.3Short Term 0.5Other 5.9
Private Non-Guaranteed 4.3IMF 4.0Foreign Exchange Liabilities 4.3Memo:Total EDLs (In billions of US$) 37.26
Table 9. Composition of EDLs*, FY06
Source: SBP Statistical Bulletin and DPCO.* EDL: External Debt and Liabilities.
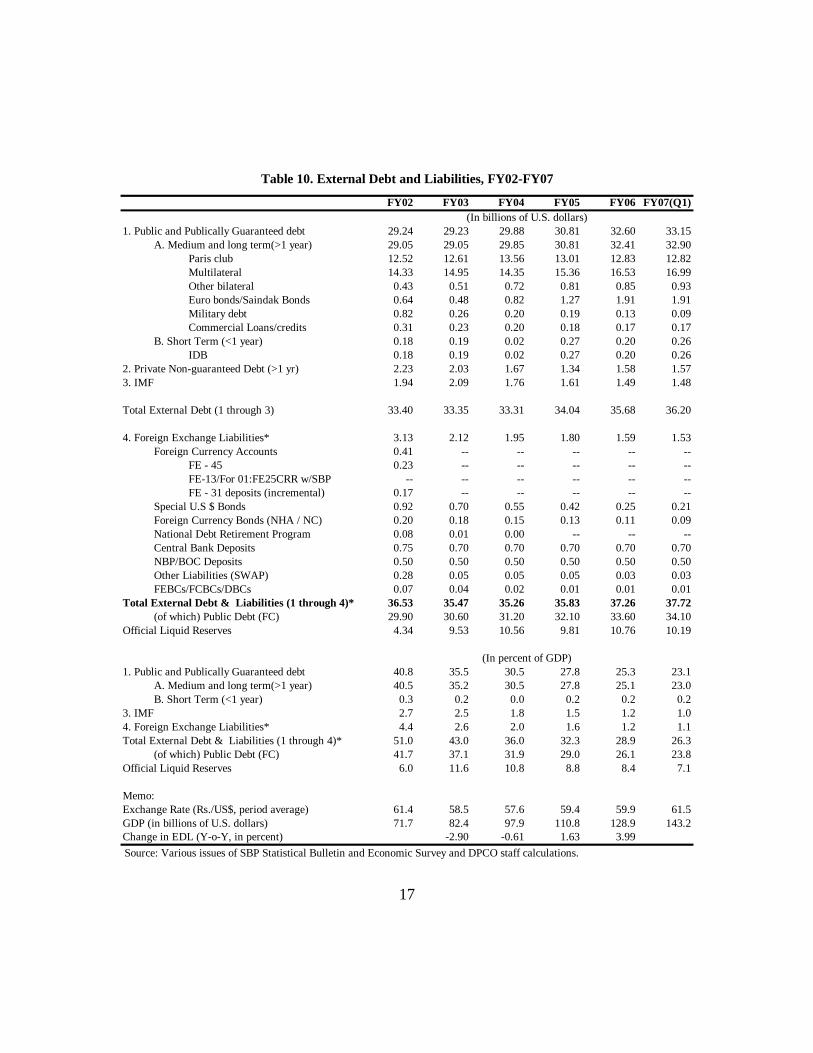
17
FY02 FY03 FY04 FY05 FY06 FY07(Q1)
1. Public and Publically Guaranteed debt 29.24 29.23 29.88 30.81 32.60 33.15A. Medium and long term(>1 year) 29.05 29.05 29.85 30.81 32.41 32.90
Paris club 12.52 12.61 13.56 13.01 12.83 12.82Multilateral 14.33 14.95 14.35 15.36 16.53 16.99Other bilateral 0.43 0.51 0.72 0.81 0.85 0.93Euro bonds/Saindak Bonds 0.64 0.48 0.82 1.27 1.91 1.91Military debt 0.82 0.26 0.20 0.19 0.13 0.09Commercial Loans/credits 0.31 0.23 0.20 0.18 0.17 0.17
B. Short Term (<1 year) 0.18 0.19 0.02 0.27 0.20 0.26IDB 0.18 0.19 0.02 0.27 0.20 0.26
2. Private Non-guaranteed Debt (>1 yr) 2.23 2.03 1.67 1.34 1.58 1.573. IMF 1.94 2.09 1.76 1.61 1.49 1.48
Total External Debt (1 through 3) 33.40 33.35 33.31 34.04 35.68 36.20
4. Foreign Exchange Liabilities* 3.13 2.12 1.95 1.80 1.59 1.53Foreign Currency Accounts 0.41 -- -- -- -- --
FE - 45 0.23 -- -- -- -- --FE-13/For 01:FE25CRR w/SBP -- -- -- -- -- --FE - 31 deposits (incremental) 0.17 -- -- -- -- --
Special U.S $ Bonds 0.92 0.70 0.55 0.42 0.25 0.21Foreign Currency Bonds (NHA / NC) 0.20 0.18 0.15 0.13 0.11 0.09National Debt Retirement Program 0.08 0.01 0.00 -- -- --Central Bank Deposits 0.75 0.70 0.70 0.70 0.70 0.70NBP/BOC Deposits 0.50 0.50 0.50 0.50 0.50 0.50Other Liabilities (SWAP) 0.28 0.05 0.05 0.05 0.03 0.03FEBCs/FCBCs/DBCs 0.07 0.04 0.02 0.01 0.01 0.01
Total External Debt & Liabilities (1 through 4)* 36.53 35.47 35.26 35.83 37.26 37.72(of which) Public Debt (FC) 29.90 30.60 31.20 32.10 33.60 34.10
Official Liquid Reserves 4.34 9.53 10.56 9.81 10.76 10.19
1. Public and Publically Guaranteed debt 40.8 35.5 30.5 27.8 25.3 23.1A. Medium and long term(>1 year) 40.5 35.2 30.5 27.8 25.1 23.0B. Short Term (<1 year) 0.3 0.2 0.0 0.2 0.2 0.2
3. IMF 2.7 2.5 1.8 1.5 1.2 1.04. Foreign Exchange Liabilities* 4.4 2.6 2.0 1.6 1.2 1.1Total External Debt & Liabilities (1 through 4)* 51.0 43.0 36.0 32.3 28.9 26.3
(of which) Public Debt (FC) 41.7 37.1 31.9 29.0 26.1 23.8Official Liquid Reserves 6.0 11.6 10.8 8.8 8.4 7.1
Memo:Exchange Rate (Rs./US$, period average) 61.4 58.5 57.6 59.4 59.9 61.5GDP (in billions of U.S. dollars) 71.7 82.4 97.9 110.8 128.9 143.2Change in EDL (Y-o-Y, in percent) -2.90 -0.61 1.63 3.99
(In billions of U.S. dollars)
(In percent of GDP)
Table 10. External Debt and Liabilities, FY02-FY07
Source: Various issues of SBP Statistical Bulletin and Economic Survey and DPCO staff calculations.

18
F Y 0 5 F Y 0 6 C h a n g e P ercen t C h an g e
P r in cip a l F Y 0 6
In terest F Y 0 6
1 . P u blic an d P u blica lly G u a ran teed d ebt 3 0 .8 1 3 2 .6 0 1 .7 9 5 .8 1 .5 0 0 .7 4A . M ed iu m a n d lon g term (> 1 yea r ) 3 0 .8 1 3 2 .4 1 1 .5 9 5 .2 1 .2 3 0 .7 3
P a r is c lu b 1 3 .0 1 1 2 .8 3 -0 .1 8 -1 .4 0 .2 6 0 .3 6M u ltila ter a l 1 5 .3 6 1 6 .5 3 1 .1 7 7 .6 0 .6 6 0 .2 3O th er bila tera l 0 .8 1 0 .8 5 0 .0 4 5 .2 0 .0 8 0 .0 4E u ro bon d s/S a in d ak B on d s 1 .2 7 1 .9 1 0 .6 4 5 0 .7 0 .1 6 0 .0 9M ilita ry d ebt 0 .1 9 0 .1 3 -0 .0 6 -3 1 .0 0 .0 6 0 .0 1C om m ercia l L oa n s/cred its 0 .1 8 0 .1 7 -0 .0 2 -9 .2 0 .0 2 0 .0 1
B . S h or t T erm (< 1 yea r ) 0 .2 7 0 .2 0 -0 .0 8 -2 7 .7 0 .2 8 0 .0 02 . P r iva te N on -g u a ran teed D ebts (> 1 yr ) 1 .3 4 1 .5 8 0 .2 4 1 8 .1 0 .3 1 0 .0 93 . IM F 1 .6 1 1 .4 9 -0 .1 2 -7 .4 0 .1 4 0 .0 2
T ota l E x tern a l D ebt (1 th r ou g h 3 ) 3 4 .0 4 3 5 .6 8 1 .6 4 4 .8 1 .9 6 0 .8 4
4 . F oreig n E x ch a n g e L ia bilities* 1 .8 0 1 .5 9 -0 .2 1 -1 1 .8 0 .2 1 0 .1 1F oreig n C u r ren cy A ccou n ts 0 .0 0 0 .0 0 0 .0 0 0 .0 0 .0 0 0 .0 0S p ecia l U .S $ B on d s 0 .4 2 0 .2 5 -0 .1 7 -4 1 .4 0 .1 7 0 .0 3F C B on d s (N H A / N C ) 0 .1 3 0 .1 1 -0 .0 2 -1 6 .7 0 .0 2 0 .0 0C en tr a l B a n k D ep osits 0 .7 0 0 .7 0 0 .0 0 0 .0 0 .0 0 0 .0 3N B P /B O C D ep osits 0 .5 0 0 .5 0 0 .0 0 0 .0 0 .0 0 0 .0 3O th er L ia b ilit ies (S W A P ) 0 .0 5 0 .0 3 -0 .0 2 -3 3 .3 0 .0 0 0 .0 0F E B C s/F C B C s/D B C s 0 .0 1 0 .0 1 0 .0 0 -3 5 .0 0 .0 1 0 .0 1
T ota l E x tern a l D ebt & L ia bilities* 3 5 .8 3 3 7 .2 6 1 .4 3 4 .0 2 .1 7 0 .9 5O fficia l L iq u id R eserves 9 .8 1 1 0 .7 6 0 .9 6 9 .7
T a b le 1 1 . C a u sa tiv e F a cto rs in C h a n g e in E xtern a l D eb t a n d L ia b ilit ies, F Y 0 6
(In bill ion s of U S D olla r s)(In billion s of U S D olla r s)
S ou rce: S B P B u lletin an d D P C O sta ff ca lcu la tion s.* E x clu d in g F E B C s/F C B C s & D B C s from 3 0 /0 6 /9 9
FY06 FY07(Q1) Change Percent Change
Principal FY07(Q1)
Dis
In terest FY07(Q1)
1. Public and Publically Guaranteed debt 32.60 33.15 0.55 1.7 0.42 0.20A. M edium and long term (>1 year) 32.41 32.90 0.49 1.5 0.26 0.20
Paris club 12.83 12.82 -0.01 -0.1 0.03 0.01M ultilateral 16.53 16.99 0.46 2.8 0.18 0.08Other bilateral 0.85 0.93 0.08 9.7 0.00 0.02Euro bonds/Saindak Bonds 1.91 1.91 0.00 -0.1 0.00 0.07M ilitary debt 0.13 0.09 -0.04 -30.6 0.04 0.01Com m ercial Loans/credits 0.17 0.17 0.00 -0.2 0.00 0.00
B. Short Term (<1 year) 0.20 0.26 0.06 30.6 0.16 0.012. Private Non-guaran teed Debts (>1 yr) 1.58 1.57 -0.02 -1.2 0.08 0.023. IM F 1.49 1.48 -0.01 -0.9 0.01 0.01
Total External Debt (1 th rough 3) 35.68 36.20 0.52 1.4 0.51 0.23
4. Foreign Exchange Liabilities* 1.59 1.53 -0.06 -3.6 0.06 0.03Foreign Currency Accounts 0.00 0.00 0.00 0.0 0.00 0.00Special U.S $ Bonds 0.25 0.21 -0.04 -14.4 0.04 0.00FC Bonds (NHA / NC) 0.11 0.09 -0.02 -20.3 0.02 0.01Central Bank Deposits 0.70 0.70 0.00 0.0 0.00 0.01NBP/BOC Deposits 0.50 0.50 0.00 0.0 0.00 0.02Other Liabilities (SW AP) 0.03 0.03 0.00 0.0 0.00 0.00FEBCs/FCBCs/DBCs 0.01 0.01 0.00 -10.4 0.00 0.00
Total External Debt & Liabilities* 37.26 37.72 0.46 1.2 0.57 0.26Official Liquid Reserves 10.76 10.19 -0.57 -5.3
Table 12. Causative Factors in Change in External Debt and Liabilities, FY07
(In billions of US Dollars) (In billions of US Dollars)
Source: SBP Bulletin and DPCO staff calculations.* Excluding FEBCs/FCBCs & DBCs from 30/06/99

19
38. The growth of EDLs which had slowed earlier in the decade has started to pick-up pace again partly on account of borrowing for earthquake-related spending. EDLs grew by 1.6 percent in FY05 while they grew by 4 percent in FY06. But because of faster growth in GDP the EDLs as a percentage of GDP have been on a decline. As can be seen in Table 10, EDLs as percentage of GDP have declined from 32.3 percent in FY05 to 28.9 percent in FY06. During the first quarter of FY07, the EDLs have further declined to 23.8 percent of the projected GDP for the year.
39. The largest increase in stock was for debt to multilateral donors with a change in stock of US$ 1.17 billion, as shown in Table 11. The foreign exchange liabilities showed a decline of US$ 211 million (11.8 percent) but this was more than compensated for by fresh borrowing from multilateral lenders and Foreign Currency Bonds (including Euro bonds). Interest payments on EDLs were US$ 0.95 billion and the amortization payments stood at US$ 2.17 billion.
40. As Table 12 shows, the first quarter of FY07 saw an increase of EDLs by 1.2 percent to US$ 37.72 billion. Public and publicly guaranteed debt increased by US$ 0.55 billion (1.7 percent) mainly on account of borrowing from multilateral lenders while the external liabilities continued on their downward trend, declining by $US 0.06 billion (3.6 percent).
IV-1: Off ic ia l Loan Disbursements 41. The total disbursements on official loans3 during FY06 was US$ 2.26 billion of which multilateral debt accounted for US$ 1.9 billion while bilateral loans accounted for US$ 330 million. The foreign loans disbursement by purpose is as follows: US$ 0.604 billion for BOP/Cash support, US$ 0.768 billion for earthquake relief and short-term credit of US$ 0.194 billion. Since majority of the inflow were on concessional longer terms this is likely to improve the maturity profile of external debt.
3 Official lending refer to loans from bilateral and multilateral lenders. These are managed by the Economic Affairs Division (EAD) and make up the bulk of Pakistan’s external debt and liabilities.

20
Economic ClassificationDisbursed Disbursed Undisbursed Disbursed Undisbursed
(US$ billions)Earthquake Relief Assistance 0.768 33.95 15.88 -- --B.O.P/Cash 0.604 26.71 15.74 40.44 18.71Short Term Credit 0.194 8.59 -- 13.00 --Transportation and Communication 0.140 6.19 16.25 9.36 19.32Power 0.140 6.19 11.70 9.36 13.91Rural Development and Poverty Redution 0.121 5.35 4.38 8.10 5.21Water 0.117 5.17 8.79 7.82 10.45Governance, Research and Statistics 0.058 2.57 5.33 3.89 6.34Physical Planning and Housing 0.046 2.01 5.88 3.05 6.99Health and Nutrition 0.038 1.69 1.89 2.55 2.25Others 0.036 1.60 14.16 2.42 16.83Memo:Total (Billions of US$) 2.26 2.26 5.68 1.49 4.78
Table 13. Disbursement of Official Loans by Economic Classification, FY06
(Percent of Total)
(Excluding Earthquake related loans)
Source: DPCO staff calculations based on the EAD Annual Status Report 2006.
42. Table 13 considers total disbursement of official loans by economic classification. Over one third of the total disbursements was for earthquake relief followed by lending for balance of payment and cash support of 26.7 percent. The share of balance of payment support and short term credit increases to 52 percent if non-earthquake related disbursement is considered. Of the rest of the non-earthquake related disbursements, just over 9 percent is accounted for by transportation/communication sector and another 9 percent by the power sector. These are followed by rural development/ poverty reduction and water which make up 8.1 and 7.8 percent of the non-earthquake related disbursement respectively.
43. Table 13 also shows the outstanding amounts of un-disbursed loans by economic classification i.e. loans which have been signed but have not disbursed fully. This gives an indication of the priority sectors in external borrowing in the coming financial years. The largest shares of remaining disbursements are in transportation/communication, power and water sectors. This suggests that a significant part of external borrowing in the coming financial years is linked to infrastructure development.

21
Disbursed
SDR61%
USD18%
JPY17%
Other3%
EUR1%
Undisbursed
SDR38%
USD27%
JPY21%
EUR3%Other
11%
Figure 7. Currency Composition of Official Loan
44. Figure 7 shows the currency distribution of the disbursed amounts for FY06. By far the largest share in total disbursements was in SDR (Special Drawing Rights)4. US dollar disbursements accounted for 18 percent of total disbursements while 17 percent was accounted for by Japanese Yen. Currency composition of un-disbursed external loans gives an indication of the changes expected in currency composition of future external debt. The largest shares in un-disbursed loans are from SDR and US dollar. The share of SDR in remaining disbursements is smaller than disbursements in the current year suggesting that the composition of debt is likely to shift slowly to US dollar and Japanese Yen.
IV-2: New External Loans Signed 45. Nearly US$3.05 billion of new official loans were signed in FY06. Table 14 shows the economic classification of the new loans signed. Nearly 55 percent of new loans signed were for earthquake relief assistance. The next largest share was for BOP/cash which accounts for 57 percent of non-earthquake related new loans contracted. The next three largest sectors were transportation/communication (9.35 percent),
4 SDR is a unit of account used by the IMF and some other international organizations such as World Bank and ADB. SDR is defined as a composite of a basket of currencies consisting of the euro, Japanese yen, pound sterling, and U.S. dollar.

22
governance, research and statistics (8.19 percent) and water (7.79 percent). These figures clearly indicate that the focus of external borrowing is on capital expenditures and public sector reforms which are priority areas for the government.
Economic Classification Signed Disbursed FY06
(Excluding Earthquake related loans)
B.O.P/Cash 0.791 0.395 25.91 57.17Earthquake Relief Assistance 1.670 0.768 54.68 --Environment 0.061 0.003 1.99 4.39Governance, Research and Statistics 0.113 0.010 3.71 8.19Health and Nutrition 0.048 0.027 1.56 3.45Industry and Production 0.005 0.000 0.17 0.37Physical Planning and Housing 0.050 0.000 1.64 3.61Power 0.052 0.000 1.69 3.74Rural Development and Poverty Reduction 0.027 0.000 0.88 1.94Transport and Communication 0.129 0.000 4.24 9.35Water 0.108 0.001 3.53 7.79Memo:Total (Billions of US$)* 3.05 1.20 3.05 1.38
Table 14. New Official Loans Signed, FY06
(Percent of total signed)(Billions of US$)
Source: EAD Annual Status Report FY06 and DPCO staff calculations.
46. Pakistan successfully tapped the global capital market in FY06 raising US$ 0.8 billion through two different issues of long term paper. This included a US$ 0.5 billion 10-Year bond and a US$ 0.3 billion 30-Year bond. Pakistan’s sovereign foreign currency bond rating was revised upward in Nov 2006 by Moody’s from B2 to B1 which is just three notches below investment grade.
IV-3: External Debt Burden 47. A critical appraisal of the external debt and liabilities will be incomplete without a discussion on changes in external debt burden and vulnerability. There are various indicators which are widely used by the international community and financial institutions to determine the debt carrying capacity and the amount of risk associated with a particular country. Some examples of these indicators are; the stock of external debt and liabilities as percent of GDP, export earning, foreign exchange earning, foreign exchange reserves, and debt servicing as percentage of current account receipts. A cursory look at Table 15 is sufficient to see that all indicators of debt burden show that Pakistan’s external debt burden has declined significantly over the last six years. During theFY06, these indicators also demonstrate a marked improvement and the trend persists in the first quarter of the current fiscal year (FY07 (Q1)).

23
Year EDL/ GDP EDL/ FEE EDL/ FER STD/EDL INT/CARRatio
FY00 51.7 297.2 19.3 3.2 11.9FY01 52.1 259.5 11.5 3.7 13.7FY02 50.9 236.8 5.8 1.4 7.8FY03 43.1 181.2 3.3 1.2 5.3FY04 36.7 164.7 3.0 0.6 4.9FY05 32.6 134.3 2.7 0.8 3.9FY06 28.9 120.6 2.9 0.9 3.1FY07* 26.3 111.7 3.0 0.7 3.0
Table 15. Trends in External Debt Sustainability Indicators, FY 00-FY 07
(Percent) (Percent)
Source: EA W ing and SBP Bulletins.* End September 2006EDL: External Debt and Liabilities, FEE: Foreing Exchange Earnings, FER: Foreign Exchange Reserves, STD: Short-term Debt, INT: Interest Payments and CAR: Current Account Receipts
48. The external debt and liabilities (EDL) declined from 51.7 percent of GDP in FY00 to 26.3 percent of the projected GDP for FY07 by end-September 2006. As shown in Figure 8, the EDLs were 297.2 percent of foreign exchange earnings at the end of FY00 but declined to 111.7 percent by end FY07(Q1). The EDLs were over 19 times foreign exchange reserves in FY00 but declined to 3 times by end September 2006. Interest payments on external debt were 11.9 percent of current account receipts but declined to 3.0 percent during the same period. The maturity profile improved significantly as is evident from the fact that short-term debt was 3.2 percent of EDL at the end of FY00 but has declined to 0.7 percent of EDL by FY07 (Q1).
49. As Table 11 shows, total external debt servicing on external debt and liabilities was US$ 3.1 billion of which US$ 2.17 billion was for principal payments while US$ 0.95 billion was against interest payments. Figure 9 shows the currency composition for debt servicing on official loans as reported by EAD in FY06. Of the
USD66%
SDR9%
JP Y15%
EUR9%
Ot her1%
Figure 9 . Currency Compos ition of Debt S ervicing, FY06
100.0
150.0
200.0
250.0
300.0
F Y00 F Y01 F Y02 F Y03 F Y04 F Y05 F Y06 F Y07*
* End September
Perc
ent
Figure 8 . External Debt and Liabilities , FY00-FY07(In percent of Foreing Exchange Earnings )

24
total amount of payments of US$ 1.6 billion nearly 66 percent was made in dollars followed by 15 percent in Japanese Yen and 9 percent in Euro.
Fig-10: Maturity Profile of External Debt
00.20.40.60.8
11.21.41.61.8
FY07 FY10 FY13 FY16 FY19 FY22 FY25 FY28 FY31 FY34 FY37
(Bill
ions
of U
.S. D
olla
rs)
50. Figure 10 shows the maturity profile (including principal payments and interest payments) of the external debt for the next thirty years assuming that all loans are completely disbursed and no new loans are taken. The profile is fairly smooth with few notable spikes which represent the bullet payments of recently issued bonds (2009, 2010, 2016 and 2036). The maximum payment in any given year is just over US$ 1.6 billion which is a manageable level based on Pakistan’s foreign exchange earnings. At the end of FY06 around 25 percent of debt stock was on floating rates and any rise/fall in bench mark rates could result in higher/lower debt servicing cost.
V. GUARANTEES 51. Contingent liabilities are costs which the government will have to pay if a particular event occurs. These are obligations triggered by discrete but uncertain events. The probability of a contingency occurring can depend on exogenous (such as natural disasters) and endogenous (such as implications of market institutions and government programs for moral hazard in the markets) variables. Contingent liabilities are therefore not recognized as direct liabilities. However, contingent government liabilities are associated with major hidden fiscal risks.
52. A common example of a contingent liability is a government-guaranteed loan. At the time the guarantee is issued there is no liability for the government, since this is contingent upon the borrower failing to repay the loan as contracted. However, in the

25
event of default, the lender can invoke the guarantee and the government will be obliged to repay the amount of the loan still outstanding. At that point, the contingent liability will become an actual liability of the government, and a payment must be made. These liabilities support specific policy objectives by creating financial incentives, without an immediate financial outlay. However, when these contractual guarantees or non-contractual commitments are realized, the government faces significant fiscal costs at the expense of other outlays. Thus an analysis of the country’s fiscal position and debt sustainability is incomplete if it skips over obligations made by the government outside the budget.
53. Table 16 shows the new guarantees on loans issued by the government in FY06 and first half of FY07. The total amount of new guarantees issues was less than 0.2 percent of GDP in FY06.
VI. REPORT ON COMPLIANCE WITH FRDL ACT 2005 54. The Fiscal Responsibility and Debt Limitation Act, 2005 was approved on 13 June 2005. It required the federal government take measures to reduce total public debt and maintain it within prudent limits thereof. The following section identifies the various limits set by the FRDL Act 2005 and reports on progress of the government in meeting those targets.
The FRDL Act 2005 requires the following:
(1) Ensure “that within a period of ten financial year, beginning from the first July, 2003 and ending on thirtieth June, 2013, the total public debt at the end of the tenth financial year does not exceed sixty percent of the estimated gross domestic product for that year and thereafter maintaining the total public debt below sixty percent of gross domestic product for any given year.”
Government has already met and actually exceeded the requirement on level of debt as a percentage of GDP. Further, this limit has been realized within three financial years instead of ten years as envisaged by the FRDL Act. At the beginning of July 2003, the
Name of Organization Date of Issue Amount(In Rs. Billion)
FY06PIA 20-May-06 3WAPDA 13-Dec-05 8KESC 29-Sep-05 3Total 14
(In percent of GDP)GDP (in billions of Rs.) 7713 0.18
FY07WAPDA 21-Nov-05 7
Projected GDP (In percent of GDP)(in billion of Rs.) 8808 0.08
Table 16. Guarantees Issued, FY06 and FY07(H1) (As of 15 Jan. 2007)
Source: Corporate Finance Wing, MoF and DPCO staff calculations.

26
total public debt stood at 75.1 percent of GDP while at the end of June 2006, the same figure stands at 56 percent of GDP. Based on projected GDP for FY07 the level of debt has further declined to 50.1 percent of GDP.
(2) Ensure “that in every financial year, beginning from the first July, 2003, and ending on the thirtieth June 2013, the total public debt is reduced by no less than two and a half percent of the estimated gross domestic product for any given year.”5
The government has successfully met and exceeded this requirement in financial year 2006. At the beginning of July 2005, the total public debt stood at 61.5 percent of GDP while at the end of June 2006, total public debt was 56 percent of GDP. This represents a reduction in debt as a percentage of GDP of 5.5 percentage points which is greater than the 2.5 percent required by the law.
(3) Not issue “new guarantees, including those for rupee lending, bonds, rates of return, output purchase agreements and all other claims and commitments that may be prescribed, from time to time, for any amount exceeding two percent of the estimated gross domestic product in any financial year: Provided that the renewal of existing guarantees shall be considered as issuing a new guarantee.”
The government met and exceeded this requirement for FY06 where the total amount of new guarantees stood at Rs. 14 billion which is 0.18 percent of GDP.
VII. DEBT MANAGEMENT STRATEGY 55. The government plans to put in place several measures to meet its twin objectives of borrowing at the minimum cost while keeping risks in check and of developing an efficient local currency sovereign debt market.
• The DPCO will publish an analytical report on debt on a quarterly basis.
• DPCO will establish links with the four debt management units in the government (SBP, EAD, NSS and Budget Wing) in order to develop an updated electronic database of all components of debt on a historical basis.
5 The FRDL Act 2005 also requires the reduction of revenue deficit to nil no later than end of FY08 and sets a lower limit on the expenditure on social and poverty alleviation related expenditures as a share of GDP. Compliance with these requirements is discussed in the Fiscal Policy Statement.

27
VII-1: Strategies on Domest ic Debt Management
56. In order to reduce the interest rate risk associated with floating debt (domestic) the government will take credible measures to reduce the share of floating debt. There are several step which the government has already taken and will put in several other measures in the coming years.
• The government will announce a regular calendar for PIB auctions (most likely on a quarterly basis) and also clearly indicate its targets.
Regular auctioning of PIBs will slowly adjust the domestic debt portfolio towards longer maturities. This will also address the issue of limited supply of PIBs for which hinders an efficient sovereign bond market in Pakistan. Regular auctions can also provide long-term benchmark rates in the absence of a secondary market. The lack of fresh supply of PIBs is detrimental to the secondary market for sovereign bond and should be avoided even at the cost of "over funding". Although the primary reason for freezing of the PIB issuance was the unstable interest rate environment, another argument was that the government borrowing requirements from the banking sector have been reduced due to unexpectedly high inflows in other debt instrument. In order to develop bond markets and establish benchmarks several countries have issued bonds in the absence of financing needs. By mid-2000, Singapore had outstanding government paper of US$ 20 billion while Hong Kong had Exchange Fund paper nearing US$ 14 billion.
• The government will concentrate issuance of debt in a limited number of tenors in order to create size in certain issues which is conducive to secondary market trading of PIBs.
Another factor that hinders the sovereign bond market development is the limited size of the sovereign debt in particular tenors (3, 5, 10, 15, 20 and now 30 year). The government is considering lumping issuance of debt by concentrating on a limited number of tenors. For example, focusing on issuance of the 10 Year PIBs and increasing its supply in the market could foster a liquid secondary market. Since, the largest shares of PIB are in 5 Year PIB (9 percent) and 10 Year PIB (25 percent) they are the most likely candidates for concentration. There is a choice to be made between concentrating on issuance for benchmarks and supplying a continuous yield curve. In Pakistan, preference has been given to establishment of a continuous yield curve evidenced by the recent 30 year PIB auction.

28
• The government will reconsider the primary dealer system for PIB auctions.
Many primary dealers have held onto PIBs instead of selling them to investors which is detrimental to development of a sovereign bond market. Various options are being considered including an increase in the number of PD (bank and non-bank).
• The government will work with SBP to make secondary market trading data readily available.
Availability of data on secondary market transactions plays an important role in making the price discovery process more efficient leading to improved liquidity. Much of the secondary market trading data is already available in Reuters and on the SBP website. This data dissemination process can be further strengthened by providing the data on a historical basis and in a readily usable form.
• Work with the SBP to reconsider the held-to-maturity (HTM) category for sovereign bonds
The suggestion to phase out the held to maturity category which allows banks to hold bonds at book value instead of mark-to-market value should be given serious consideration.
• Further, the government will reduce its stock of MRTBs at a measured pace either by issuing PIBs and/or MTBs.
Direct borrowing from the central bank dampens the efficacy of monetary policy and is against the government’s goals of keeping inflation in check. As a policy, the Government will limit its direct borrowing from SBP and instead borrow from the market.
• The government will adopt a more balanced approach to borrowing through NSS and consider modifications to NSS instruments in order to make them more market based.
• The targeting system in NSS schemes with a social welfare purpose needs to be made more effective.
The large inflows in Bahbood Saving Certificates and Pensioner’s Benefit Account (which are primarily meant for orphans, widows and retirees) suggest that there is room for improvement in the targeting mechanism for these accounts.

29
VII-2: Strategies on External Debt Management 57. The elements of a good external borrowing strategy include:
• A comprehensive external borrowing strategy consistent with borrowing constraints such as saving/investment gap, amortization payments, reserve targets and most importantly the GoP’s medium-term development priorities.
• Evaluation of the terms and conditions of various loan options and optimize borrowing in order to minimize the cost of borrowing while smoothing out the maturity profile and reducing risk
• Continue to tap the global capital market through regular issuance of bonds (conventional and Islamic) to ensure a steady supply of GoP sovereign paper, establish a bench mark for Pakistan and keep Pakistan on the radar screen of global investors. This will keep the spreads on Pakistani paper low, give more borrowing options to Pakistani borrowers including GoP and ensure that Pakistan is covered by various investment research products.
• The DPCO will develop a framework for regularly assessing the revaluation of debt arising from changes in cross-country exchange rates as well as changes in estimated debt servicing.
• The government will continue to closely monitor the share of external debt stock and payments which are on a floating basis and develop a framework to assess on a timely basis the risks arising from developments in the global capital markets.
VII-3: Strategies on Guarantees
• The government will ensure that its guarantees are within the limits imposed under FRDL Act 2005.
VIII . CONCLUDING REMARKS 58. The pace at which Pakistan has transformed itself from the brink of bankruptcy and low growth in 1999, to a level of debt that is sustainable with strong economic recovery in a short period of seven years is perhaps unprecedented for a country of Pakistan’s size. The journey has been difficult and the government willing to take courageous decisions resulted in a sharp reduction of the country’s debt burden and vulnerability. The government intends to continue its prudent macroeconomic policies underpinned by structural reforms. The government’s strategic objective now is to achieve investment grade ratings for which the country’s debt burden must continue to decline.


![Revisiting Course Evaluations: Strategies to Minimize ......Revisiting Course Evaluations: Strategies to Minimize Gender and Racial ... 58% female, 42% male] ... enhancement of instruction](https://img.dokumen.tips/doc/110x75/5f07b0aa7e708231d41e3fa5/revisiting-course-evaluations-strategies-to-minimize-revisiting-course.jpg)