Embed Size (px)
DESCRIPTION
Debt OPTIONS. Options on Treasury Securities: T-Bill Options. Options on T-Bills give the holder the right to buy a T-Bill with a face value of $1M and maturity of 91 days. Exercise price is quoted in terms of the IMM index and the following formula can be used to determine X: - PowerPoint PPT Presentation
Citation preview

Debt OPTIONSDebt OPTIONS

Options on Treasury Securities:T-Bill Options
• Options on T-Bills give the holder the right to buy a T-Bill with a face value of $1M and maturity of 91 days.
• Exercise price is quoted in terms of the IMM index and the following formula can be used to determine X:
• The option premium is quoted in terms of annual discount points (PT). The actual premium is
XR
MD100 25
100
(. )($1 )
C or PPT
M100
25(. ) ($1 )

Options on Treasury Securities: T- Bond Options
• Options on T-Bonds give the holder the right to buy a specified T-Bond with a face value of $100,000.
• Exercise price is quoted as a percentage of par (e.g. IN = 90). If the holder exercises, she pays the exercise price plus the accrued interest:
• The option premium is quoted in terms of points (PT). The actual premium is
XIN
Acc Int 100
000($100, )
C or PPT
100
000($100, )

Fundamental StrategiesFundamental Strategies
• There are six fundamental strategies:– Call Purchase– Naked Call Write– Covered Call Write– Put Purchase– Naked Put Write– Covered Put Write
• There are six fundamental strategies:– Call Purchase– Naked Call Write– Covered Call Write– Put Purchase– Naked Put Write– Covered Put Write

Profit GraphProfit Graph
• Option Strategies can be evaluated in terms of a profit graph.
• A profit graph is a plot of the option position’s profit and security price relation at expiration or when the option is exercised.
• Option Strategies can be evaluated in terms of a profit graph.
• A profit graph is a plot of the option position’s profit and security price relation at expiration or when the option is exercised.
ST
ST
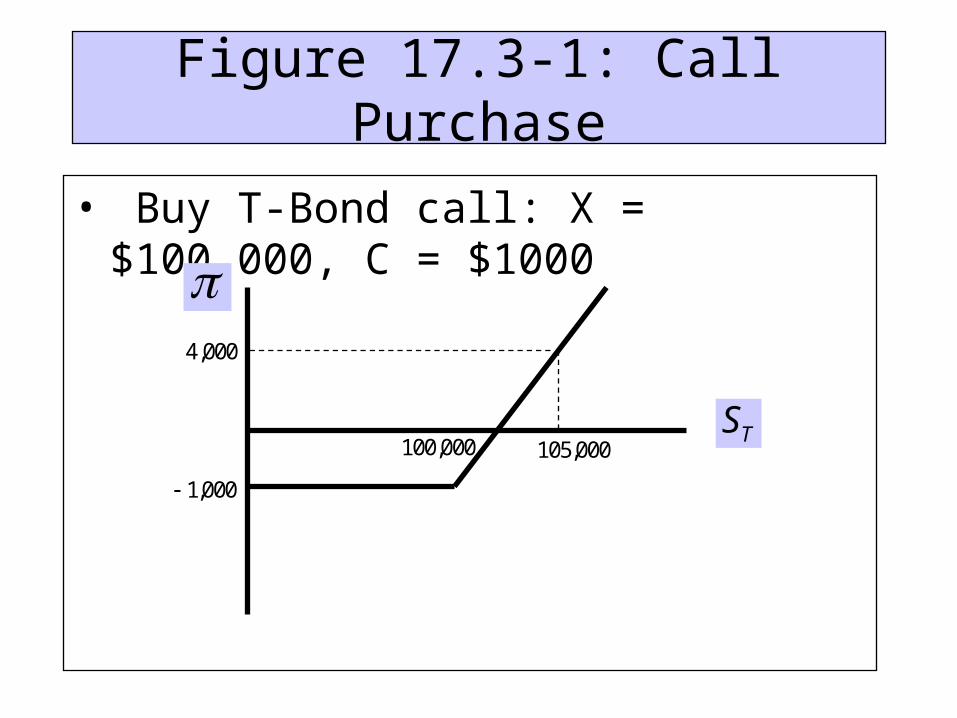
Figure 17.3-1: Call Purchase
• Buy T-Bond call: X = $100,000, C = $1000
ST100 000, 105 000,
4 000,
1 000,
Call PurchaseSpot Price at T Profit/Loss
90000 -100095000 -1000100000 -1000101000 0102000 1000103000 2000104000 3000105000 4000106000 5000

Figure 17.3-2: Naked Call Write
• Sell T-Bond call for: X= 100,000, C=1000.
ST105 000,
1 000,
4 000,
100 000,

Naked Call WriteSpot Price at T Profit/Loss
90000 100095000 1000100000 1000101000 0102000 -1000103000 -2000104000 -3000105000 -4000106000 -5000

Figure 17.3-3: Covered Call Write
• Long T-Bond at 100,000, short 100 T-Bond call at 1.
ST100 000,
1 000,
95 000,
4 000,

Covered Call WriteShort Call Long T-Bond Total
Spot Price at T Profit/Loss Profit/Loss Profit/Loss90000 1000 -10000 -900095000 1000 -5000 -4000100000 1000 0 1000101000 0 1000 1000102000 -1000 2000 1000103000 -2000 3000 1000104000 -3000 4000 1000105000 -4000 5000 1000106000 -5000 6000 1000

Figure 17.3-4: Put Purchase
• Buy T-Bond put: X=100,000, P = 1000
ST95 000,
4 000,
1 000,
100 000,

Put PurchaseSpot Price at T Profit/Loss
90000 900095000 4000
100000 -1000101000 -1000102000 -1000103000 -1000104000 -1000105000 -1000106000 -1000

Figure 17.3-5: Naked Put Write
• Sell T-Bond put: X =100,000, P = 1000
ST95 000,
4 000,
1 000,
100 000,

Naked Put WriteSpot Price at T Profit/Loss
90000 -900095000 -4000
100000 1000101000 1000102000 1000103000 1000104000 1000105000 1000106000 1000

Figure 17.3-6: Covered Put Write
• Short T-Bond at 100,000, short 100 T-Bond put at 1.
ST105 000,
4 000,
100 000,
1 000,

Covered Put WriteShort Put Short T-Bond Total
Spot Price at T Profit/Loss Profit/Loss Profit/Loss90000 -9000 10000 100095000 -4000 5000 1000100000 1000 0 1000101000 1000 -1000 0102000 1000 -2000 -1000103000 1000 -3000 -2000104000 1000 -4000 -3000105000 1000 -5000 -4000106000 1000 -6000 -5000

Other Strategies

Figure 17.4-1: Straddle Purchase
• Buy 100 T-Bond put for 1 and buy 100 T-Bond call for 1:
ST95 000, 100 000, 105 000,
2 000,
1 000,
3 000,
4 000,

Straddle PurchaseCall Purchase Put Purchase Total
Spot Price at T Profit/Loss Profit/Loss Profit/Loss94000 -1000 5000 400097000 -1000 2000 100098000 -1000 1000 0
100000 -1000 -1000 -2000102000 1000 -1000 0103000 2000 -1000 1000106000 5000 -1000 4000

Figure 17.4-2: Bull Spread
• Buy 100 T-Bond call for 1 and sell 101 T-Bond call for .75:
STST
100 000, 101 000,
250
750
1 000,
1 000,
102 000,

Bull Spread100 Call Purchase at 1 101 Call Sale at .75 Total
Spot Price at T Profit/Loss Profit/Loss Profit/Loss94000 -1000 750 -25097000 -1000 750 -25098000 -1000 750 -250
100000 -1000 750 -250100250 -750 750 0101000 0 750 750102000 1000 -250 750103000 2000 -1250 750106000 5000 -4250 750

Hedging

Table 17.8-4: Hedging the Cost of a September T-Bill Purchase with a T-Bill Call
Call: X = 94 (985,000), C = 1 ($2,500)1 2 3 4 51 Effective Costs Hedged
Spot Rate: R Spot Price Profit/Loss col 2 - col 3 YTM7.5 981250 -2500 983750 0.0679212
7.25 981875 -2500 984375 0.0652041676.75 983125 -2500 985625 0.0597959596.5 983750 -2500 986250 0.05710472
6.25 984375 -2500 986875 0.0544220136 985000 -2500 987500 0.051747806
5.75 985625 -1875 987500 0.0517478065.5 986250 -1250 987500 0.051747806
5.25 986875 -625 987500 0.0517478065 987500 0 987500 0.051747806
4.75 988125 625 987500 0.051747806
Spot price SR
M
X M
C M
Hedged YTMEffective Cost
T
FHGIKJFHGIKJ
LNM
OQP
100 25
100100 100 94 25
100000
1
100
90
360500
000 0001
0
365 91
(. )$1
( )(. )$1 $985,
($1 ) $2,
$1, ,/

Table 17.8-5: Hedging a Future T-Bond Sale with a T-Bond Put
T-Bond: M = 15yrs at T; Coupon = 6% Put: X = 94,000, P = 10001 2 3 4 5
Long Put RevenueSpot Index Spot Price Estimated YTM Profit/Loss Col 2 + Col 4
91 91000 0.069109948 2000 9300091.5 91500 0.068581375 1500 9300092 92000 0.068055556 1000 93000
92.5 92500 0.067532468 500 9300093 93000 0.06701209 0 93000
93.5 93500 0.066494401 -500 9300094 94000 0.065979381 -1000 93000
94.5 94500 0.065467009 -1000 9350095 95000 0.064957265 -1000 94000
95.5 95500 0.064450128 -1000 9450096 96000 0.063945578 -1000 95000
96.5 96500 0.063443596 -1000 95500
Estimated YTMSpot price
Spot price
$6000 ($100, ) /
($100, ) /
000 15
000 2

Futures Options onTreasury Securities
• Futures options give the holder the right to take a futures position:– Futures Call Option gives the holder the right to go long.
When the holder exercises, she obtains a long position in the futures at the current price, ft, and the assigned writer takes the short position and pays the holder ft - X.
– Futures Put Option gives the holder the right to go short. When the holder exercises, she obtains a short position at the current futures price, ft, and the assigned writer takes the long position and pays put holder X - ft.
• Futures option on Treasuries: Options on T-Bill Futures, T-Bond Futures, and T-Note Futures.

Exhibit 17.9-1: Futures Options on
Treasury Securities Call on T-Bill Futures:• X = IMM 90 or X = $975,000
• PT = .5 or C = $1,250
• Futures and options futures have same expiration.
R S f fD T T C T
( , )
$1250
. ,
. ,
. ,
. ,
. ,
. ,
975 000
105 973 750 1250
10 0 975 000 1250
9 5 976 250 0
9 0 977 500 1250
85 978 750 2500
8 0 980 000 3750
S fT T975000
1250
980000
3750
Exercise at Holder goes
long at f and then closes
by going short at f
and receives f X
T
T
T
980 000
980 000
980 000
980 000 975 000
980000 975000 1250 3750
, :
,
, ,
, , :
.

Exhibit 17.9-2: Futures Options on
Treasury Securities Put on T-Bill Futures:• X = IMM 90 or X = $975,000
• PT = .5 or P = $1,250
• Futures and options futures have same expiration.R S f fD T T P T
( ,
$1250
. ,
. ,
. ,
. ,
. ,
. ,
. ,
. ,
. ,
975 000
12 0 970 000 3750
115 971 250 2500
110 972 500 1250
10 5 973 750 0
10 0 975 000 1250
9 5 976 250 1250
9 0 977 500 1250
8 5 978 750 1250
8 0 980 000 1250
S fT T972250
1250
970000
3750
Exercise at Holder goes
short at f and then
closes by going long at f
and receives X f
T
T
T
970 000
970 000
980 000
975 000 970 000
975000 970000 1250 3750
, :
,
, ,
, , :
.

Table 17.9-1: Put-Call-Futures Parity
Expiration Cash Flow
Position Investment f X f X f X
Long Futures f f S f f f
Long Put P X f
Short Call C f X
Total P C X f X f X f
T T T
T T T
T
T
0
0 0
0 0
0 0 0
0
0
0 0 0 0 0
Value of the conversion
P C X f R fT
:
( )( )0 0 00 1
Hedging Cases
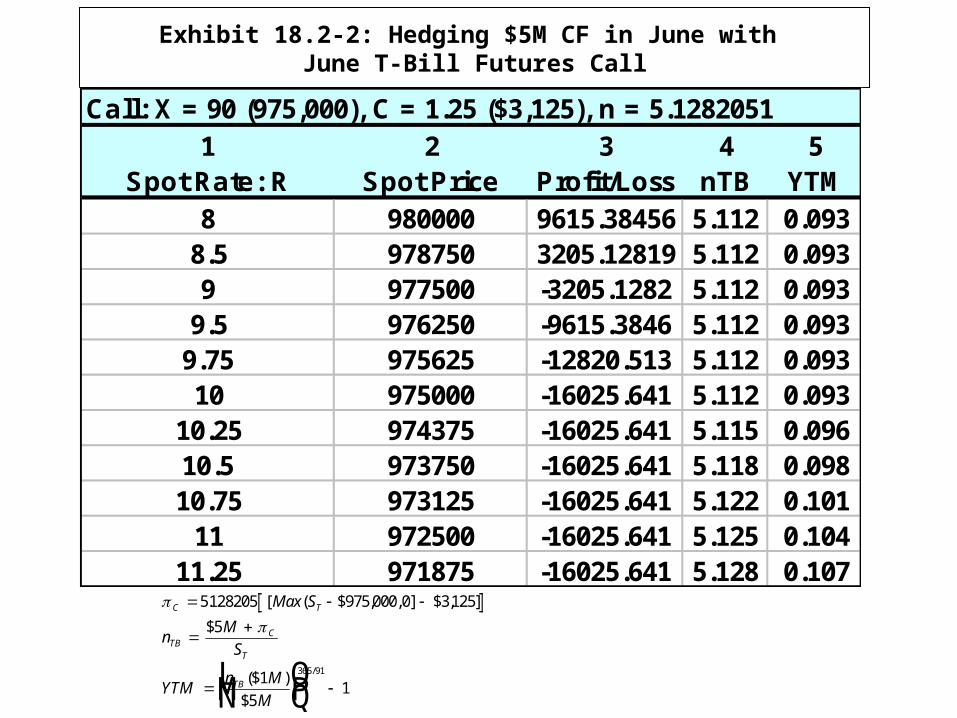
Exhibit 18.2-2: Hedging $5M CF in June with June T-Bill Futures Call
C T
TBC
T
TB
Max S
nM
S
YTMn M
M
LNMOQP
5128205 000 0 125
1365 91
. [ ( $975, , ] $3, ]
$5
($1 )
$5
/
Call: X = 90 (975,000), C = 1.25 ($3,125), n = 5.12820511 2 3 4 5
Spot Rate: R Spot Price Profit/Loss nTB YTM8 980000 9615.38456 5.112 0.093
8.5 978750 3205.12819 5.112 0.0939 977500 -3205.1282 5.112 0.093
9.5 976250 -9615.3846 5.112 0.0939.75 975625 -12820.513 5.112 0.09310 975000 -16025.641 5.112 0.093
10.25 974375 -16025.641 5.115 0.09610.5 973750 -16025.641 5.118 0.09810.75 973125 -16025.641 5.122 0.101
11 972500 -16025.641 5.125 0.10411.25 971875 -16025.641 5.128 0.107

Managing the Maturity Gap with T-Bill Put
• Case: In June, a bank makes a $1M loan for 180 days which it plans to finance by selling a 90-day CD now at the LIBOR of 8.258% and a 90-day CD ninety days later (in September) at the LIBOR prevailing at that time. To minimize its exposure to market risk, the bank buys a T-Bill put at X = IMM = 90 for $$1250.
X IMM or R
X M
D
90 10%
100 10 25
100000
( )(. )($1 ) $975,
Bank sells M CD now June at
At the September maturity the bank will owe
M To hedge this liability the bank
would need to buy puts
nCF
X
Mputs
Cost
PT
$1 ( ) .
,
$1. . ,
. :
$1.
$975,.
( . )($1250) $1307
8 258%.
019758
10459056
019758
00010459056
10459056

Maturity Gap Hedged with T-Bill Puts
( ) ( ) ( ) ( ) (5) ( ) ( ) (8)
(5) ( ) ( )[ ( )] [( ) / $1 ]
$982, . , , , , , , .
$980, . , , , , , , .
$977, . , , , , , , .
/ /
1 2 3 4 6 7
90
4 6 1 3 7
7% 500 07588 1307 1 019 750 1 021 065 1 039 646 8 203%
8% 000 08690 1307 1 019 750 1 021 065 1 042 262 8 756%
9% 500 09807 1307 1 019 750 1 021 065 1 044 893 9
90 365 365 180
R S Rate Debt on CD Funds Needed Debt days later Rate
M
D T CD p
313%
10% 000 10940 1307 1 019 750 1 021 065 1 047 500 9 867%
11% 500 12080 1307 1 019 750 1 018 451 1 047 500 9 867%
12% 000 13240 3922 1 019 750 1 015 836 1 047 500 9 867%
90 25%
0025 1
14059056 000 0
365 91
$975, . , , , , , , .
$972, . , , , , , , .
$970, . , , , , , , .
. :
$1.
. [ [$975, , ] $1307
/
Assume day CD rate is greater than T Bill rate
RateM
S
Max S
CDT
P T

Hedging future T-Bond Sale With T-Bond Puts
• Case: Three months from the present (.25 of year), a bond manager plans to sell a T-Bond with maturity of 15.25 years, F = $100,000, and coupon rate = 10%.
• Manager hedges the sale against interest rate increases by buying one put option on a T-Bond with a current maturity of 15.25 years and face value of $100,000. The put has an expiration of T = .25 years, exercise price of X = IN = 95 or X = $95,000, and is trading at P = 1 - 5 or P = [1.15625/100]($100,000) = $1156.

Hedging future T-Bond Sale With T-Bond Puts
• Hedge T-Bond Sale:S Yield Hedged revenueT P91 1110% 844 844
92 10 97% 844 844
93 10 85% 844
93844 10 74% 0 844
94 10 72% 844
95 10 60% 156 844
96 10 48% 156 844
97 10 35% 156 844
. $2, $93,
. $1, $93,
. $844 $93,
. . $93,
. $156 $93,
. $1, $93,
. $1, $94,
. $1, $95,
Yield ARTMS
S
Hedged revenue S
T
T
T P
$10, [$100, [( / )($100, )] / ]$100, ( / )($100, )
( / )($100, )
000 000 100 000 15000 100 000
2100 000

Hedging Future Bond PortfolioSale With T-Bond Puts
• Case: Three months from the present (.25 of year), a bond manager plans to liquidate a bond portfolio consisting of AAA, AA, and A bonds. The portfolio currently has a WAM of 15.25 years, F = $10M, WAC = 10%, and has tended to yield a rate 1% above T-Bond rates.
• Manager hedges the sale against interest rate increases by buying put options on a T-Bond with a current maturity of 15.25 years and face value of $100,000. The put has an expiration of T = .25 years, exercise price of X = IN = 95 or X = $95,000, and is trading at P = 1 - 5 or P = [1.15625/100]($100,000) = $1156.
• To hedge, the manager buys 105.26316 T-Bond puts for $121,684: n
F
X
M
Cost
P
$10
$95,.
( , ) ($1156) $121,
00010526316
105 26316 684

Hedging Future Bond PortfolioSale With T-Bond Puts
• Hedge Bond Portfolio Sale:
S Yield Bond revenue Hedged revenue
M M
M M
M M
M M
M M
M M
T P93 1085% 842 7298 80
94 10 72% 421 8108 80
95 10 60% 684 8865 80
96 10 48% 684 9633 84
97 10 35% 684 0477 92
98 10 23% 684 1266 00
. $88, $8. $8.
. $16, $8. $8.
. $121, $8. $8.
. $121, $8. $8.
. $121, $9. $8.
. $123, $9. $9.
Bond revenueM
yield
M
yield
Max S
Hedged revenue Bond revenue
tt
P T
P
$1
( )
$10
( )
. [ [$95, ( / )($100, ), ] $121,
1 1
105 26316 000 100 000 0 684
151
15

Interest Rate Options

Interest Rate Options
• Interest rate call option gives the holder the right to a payoff if an interest rate (e.g., LIBOR) exceeds a specified exercise rate; interest rate put option gives the holder the right to a payoff if an interest rate is less than the exercise rate.
• Interest rate options are written by commercial banks in conjunction with a future loan or CD investment.

Interest Rate Call Option
Case: • A company plans to borrow $10M in sixty days from
Sun Bank. The loan is for 90 days with the rate equal to LIBOR in 60 days plus 100 BP.
• Worried that rates could increase in the next 60 days, the company buys an interest rate call from the bank for $20,000.
• Terms: Exercise Rate = 7%; call premium plus interest will be paid at the maturity of the loan; any interest rate payoff will be paid at the loan’s maturity.
• See Chapter 17.

Interest Rate Put Option
Case: • A company plans to invest $10M in sixty days in a Sun
Bank 90-day CD. The CD will pay the LIBBER.• Worried that rates could decrease in the next 60 days,
the company buys an interest rate put from the bank for $15,000.
• Terms: Exercise Rate = 7%; put premium plus interest will be paid at the maturity of the CD; any interest rate payoff will be paid at the CD’s maturity.
• See Chapter 17

Caps: Series of Interest Rate Call Options
• A Cap is a series of interest rate calls that expire at or near the interest rate payment dates on a loan. They are written by financial institutions in conjunction with a variable rate loan.
Case: • A company borrow $50M from Commerce Bank to finance its yearly
construction projects. The loan starts on March 1 at 8% and is reset every three months at the prevailing LIBOR.
• Cap: In order to obtain a maximum rate while still being able to obtain lower rates if the LIBOR falls, the company buys a Cap from the bank for $100,000 with exercise Rate = 8%.
• See Chapter 17

Floor: Series of Interest Rate Put Options
• A floor is a series of interest rate puts that expire at or near the payment dates on a loan. They are purchased by financial institutions in conjunction with a variable rate loan they are providing.
Case: • Commerce Bank purchases a floor with an exercise rate
of 8% for $70,000 from another institution to protect the variable rate loan it made.
• See Chapter 17

Table 17.8-1: Profit and Interest Rate Relation from Closing a Long 94 T-Bill Call Purchased at 1
Call: X = 94 (985,000), C = 1 ($2,500)Long Call
Spot Rate: R Spot Index = 100-R Spot Price Profit/Loss6.5 93.5 983750 -2500
6.25 93.75 984375 -25006 94 985000 -2500
5.75 94.25 985625 -18755.5 94.5 986250 -1250
5.25 94.75 986875 -6255 95 987500 0
4.75 95.25 988125 6254.5 95.5 988750 1250
4.25 95.75 989375 18754 96 990000 2500
Spot price SR
M
X M
C M
T
FHGIKJFHGIKJ
100 25
100100 100 94 25
1001
100
90
3605000
(. )$1
( )(. )$1
($1 ) $2,

Table 17.8-3: Profit and Interest Rate Relation from Closing a Long 94 T-Bond Put Purchased at $1000
Estimated YTMSpot price
Spot price
$6000 ($100, ) /
($100, ) /
000 15
000 2
T-Bond: M = 15yrs at T; Coupon = 6%; Put: X = 94,000, P = 1000Long Put
Spot Index Spot Price Estimated YTM Profit/Loss90 90000 0.070175439 3000
90.5 90500 0.069641295 250091 91000 0.069109948 2000
91.5 91500 0.068581375 150092 92000 0.068055556 1000
92.5 92500 0.067532468 50093 93000 0.06701209 0
93.5 93500 0.066494401 -50094 94000 0.065979381 -1000
94.5 94500 0.065467009 -100095 95000 0.064957265 -1000

Table 17.8-2: Profit and Interest Rate Relation from Closing a Long 94 T-Bill Put Purchased at 1
Put: X = 94 (985,000), C = 1 ($2,500)Long Put
Spot Rate: R Spot Index = 100-R Spot Price Profit/Loss8 92 980000 2500
7.75 92.25 980625 18757.5 92.5 981250 1250
7.25 92.75 981875 6257 93 982500 0
6.75 93.25 983125 -6256.5 93.5 983750 -1250
6.25 93.75 984375 -18756 94 985000 -2500
5.75 94.25 985625 -25005 95 987500 -2500
Spot price SR
M
X M
P M
T
FHGIKJFHGIKJ
100 25
100100 100 94 25
1001
100
90
3605000
(. )$1
( )(. )$1
($1 ) $2,