Embed Size (px)
Citation preview

Debt Investor Update
Good operating performance in Q1/20, but results affected
by COVID-19 pandemic – PBT of EUR 2 mn
2
Disclaimer
This presentation is not an offer or invitation to subscribe for or purchase any securities in any jurisdiction, including any jurisdiction of
the United States. Securities may not be offered or sold in the United States absent registration or pursuant to an available exemption
from registration under the U.S. Securities Act. Deutsche Pfandbriefbank AG (pbb) does not intend to conduct a public offering of
securities in the United States.
No warranty is given as to the accuracy or completeness of the information in this presentation. You must make your own
independent investigation and appraisal of the business and financial condition of pbb and its direct and indirect subsidiaries and their
securities. Nothing in this presentation shall form the basis of any contract or commitment whatsoever.
This presentation may only be made available, distributed or passed on to persons in the United Kingdom in circumstances in which
section 21(1) of the Financial Services and Markets Act 2000 does not apply.
This presentation may only be made available, distributed or passed on to persons in Australia who qualify as 'wholesale clients' as
defined in section 761G of the Australian Corporations Act.
This presentation is furnished to you solely for your information. You may not reproduce it or redistribute to any other person.
This presentation contains forward-looking statements based on calculations, estimates and assumptions made by the company’s top
management and external advisors and are believed warranted. These statements may be identified by such words as ‘may’, ‘plans’,
‘expects’, ‘believes’ and similar expressions, or by their context and are made on the basis of current knowledge and assumptions.
Various factors could cause actual future results, performance or events to differ materially from those described in these statements.
Such factors include general economic conditions, the conditions of the financial markets in Germany, in Europe, in the United States
and elsewhere, the performance of pbb’s core markets and changes in laws and regulations. No obligation is assumed to update any
forward-looking statements.
By participating in this presentation or by accepting any copy of the slides presented, you agree to be bound by the noted limitations.
Investor Update based on results Q1/20 (IFRS, pbb Group, unaudited), May 2020
COVID-19 pandemic
COVID-19 unprecedented, invades all areas of business and social/public life
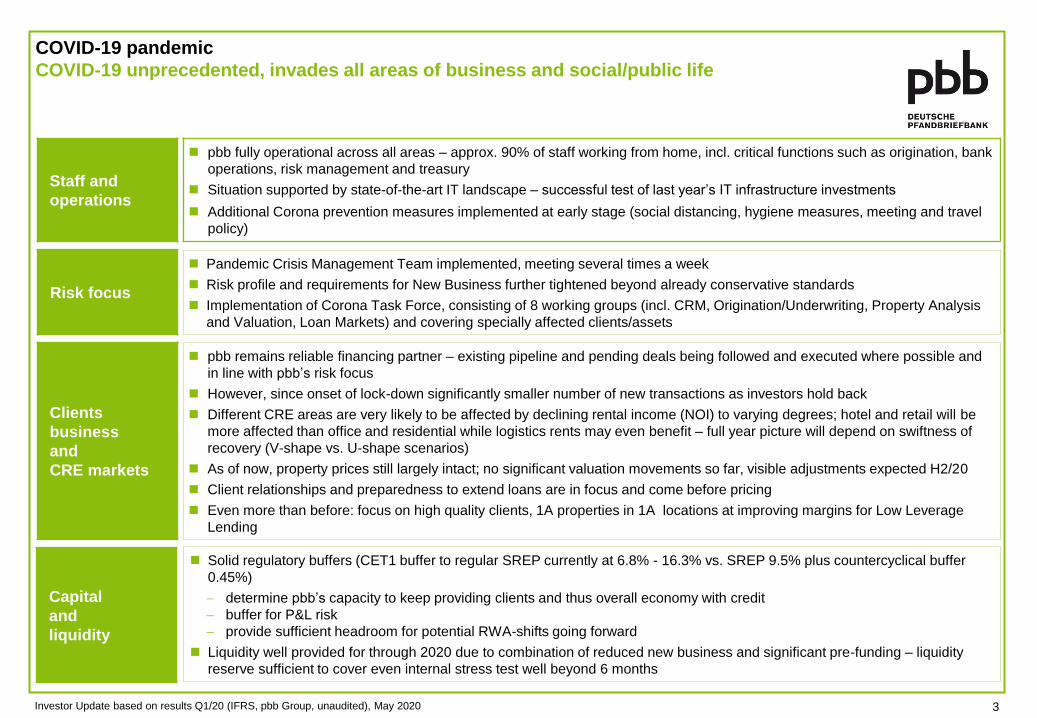
pbb fully operational across all areas – approx. 90% of staff working from home, incl. critical functions such as origination, bank
operations, risk management and treasury
Situation supported by state-of-the-art IT landscape – successful test of last year’s IT infrastructure investments
Additional Corona prevention measures implemented at early stage (social distancing, hygiene measures, meeting and travel
policy)
Staff and
operations
pbb remains reliable financing partner – existing pipeline and pending deals being followed and executed where possible and
in line with pbb’s risk focus
However, since onset of lock-down significantly smaller number of new transactions as investors hold back
Different CRE areas are very likely to be affected by declining rental income (NOI) to varying degrees; hotel and retail will be
more affected than office and residential while logistics rents may even benefit – full year picture will depend on swiftness of
recovery (V-shape vs. U-shape scenarios)
As of now, property prices still largely intact; no significant valuation movements so far, visible adjustments expected H2/20
Client relationships and preparedness to extend loans are in focus and come before pricing
Even more than before: focus on high quality clients, 1A properties in 1A locations at improving margins for Low Leverage
Lending
Clients
business
and
CRE markets
Pandemic Crisis Management Team implemented, meeting several times a week
Risk profile and requirements for New Business further tightened beyond already conservative standards
Implementation of Corona Task Force, consisting of 8 working groups (incl. CRM, Origination/Underwriting, Property Analysis
and Valuation, Loan Markets) and covering specially affected clients/assets
Risk focus
Solid regulatory buffers (CET1 buffer to regular SREP currently at 6.8% - 16.3% vs. SREP 9.5% plus countercyclical buffer
0.45%)
determine pbb’s capacity to keep providing clients and thus overall economy with credit
buffer for P&L risk
provide sufficient headroom for potential RWA-shifts going forward
Liquidity well provided for through 2020 due to combination of reduced new business and significant pre-funding – liquidity
reserve sufficient to cover even internal stress test well beyond 6 months
Capital
and
liquidity
Investor Update based on results Q1/20 (IFRS, pbb Group, unaudited), May 2020 3
COVID-19 pandemic
COVID-19 unprecedented, invades all areas of business and social/public life
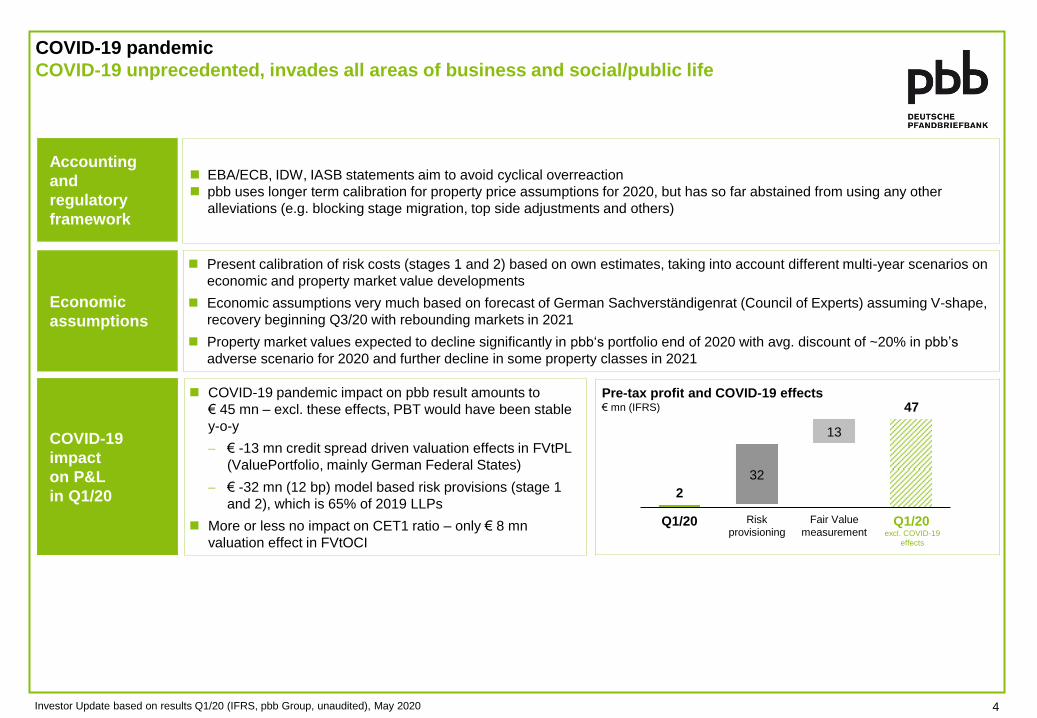
Present calibration of risk costs (stages 1 and 2) based on own estimates, taking into account different multi-year scenarios on
economic and property market value developments
Economic assumptions very much based on forecast of German Sachverständigenrat (Council of Experts) assuming V-shape,
recovery beginning Q3/20 with rebounding markets in 2021
Property market values expected to decline significantly in pbb‘s portfolio end of 2020 with avg. discount of ~20% in pbb’s
adverse scenario for 2020 and further decline in some property classes in 2021
Economic
assumptions
EBA/ECB, IDW, IASB statements aim to avoid cyclical overreaction
pbb uses longer term calibration for property price assumptions for 2020, but has so far abstained from using any other
alleviations (e.g. blocking stage migration, top side adjustments and others)
Accounting
and
regulatory
framework
COVID-19 pandemic impact on pbb result amounts to
€ 45 mn – excl. these effects, PBT would have been stable
y-o-y
€ -13 mn credit spread driven valuation effects in FVtPL
(ValuePortfolio, mainly German Federal States)
€ -32 mn (12 bp) model based risk provisions (stage 1
and 2), which is 65% of 2019 LLPs
More or less no impact on CET1 ratio – only € 8 mn
valuation effect in FVtOCI
COVID-19
impact
on P&L
in Q1/20 2
47
32
13
Fair Value
measurement
Risk
provisioning Q1/20 Q1/20
Pre-tax profit and COVID-19 effects € mn (IFRS)
excl. COVID-19
effects
Investor Update based on results Q1/20 (IFRS, pbb Group, unaudited), May 2020 4
Business Model & Strategy
pbb is a leading commercial real estate lender with a complementary
public investment finance business
LENDING FUNDING
Stable, well diversified funding base
Pfandbrief
Senior unsecured bonds
Retail deposits (online)
Strong capital markets presence
(benchmarks/private placements)
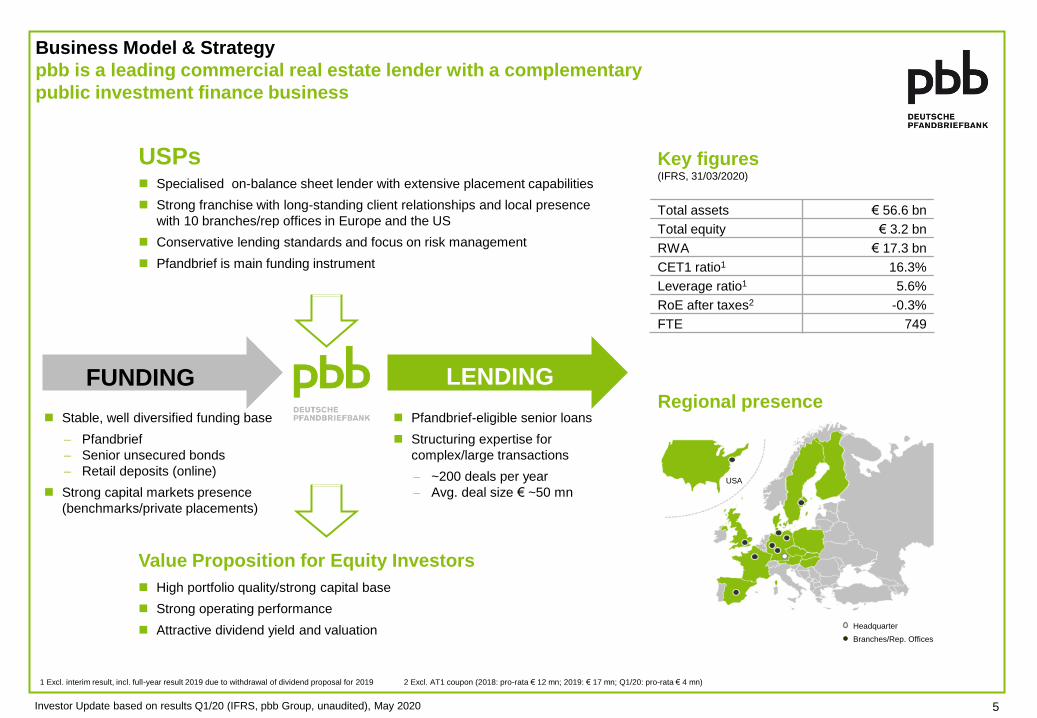
Key figures (IFRS, 31/03/2020)
Total assets € 56.6 bn
Total equity € 3.2 bn
RWA € 17.3 bn
CET1 ratio1 16.3%
Leverage ratio1 5.6%
RoE after taxes2 -0.3%
FTE 749
Pfandbrief-eligible senior loans
Structuring expertise for
complex/large transactions
~200 deals per year
Avg. deal size € ~50 mn
1 Excl. interim result, incl. full-year result 2019 due to withdrawal of dividend proposal for 2019 2 Excl. AT1 coupon (2018: pro-rata € 12 mn; 2019: € 17 mn; Q1/20: pro-rata € 4 mn)
USPs Specialised on-balance sheet lender with extensive placement capabilities
Strong franchise with long-standing client relationships and local presence
with 10 branches/rep offices in Europe and the US
Conservative lending standards and focus on risk management
Pfandbrief is main funding instrument
Value Proposition for Equity Investors
High portfolio quality/strong capital base
Strong operating performance
Attractive dividend yield and valuation
Regional presence
Investor Update based on results Q1/20 (IFRS, pbb Group, unaudited), May 2020 5
Headquarter
Branches/Rep. Offices
USA
Pre-tax profit € mn (IFRS)
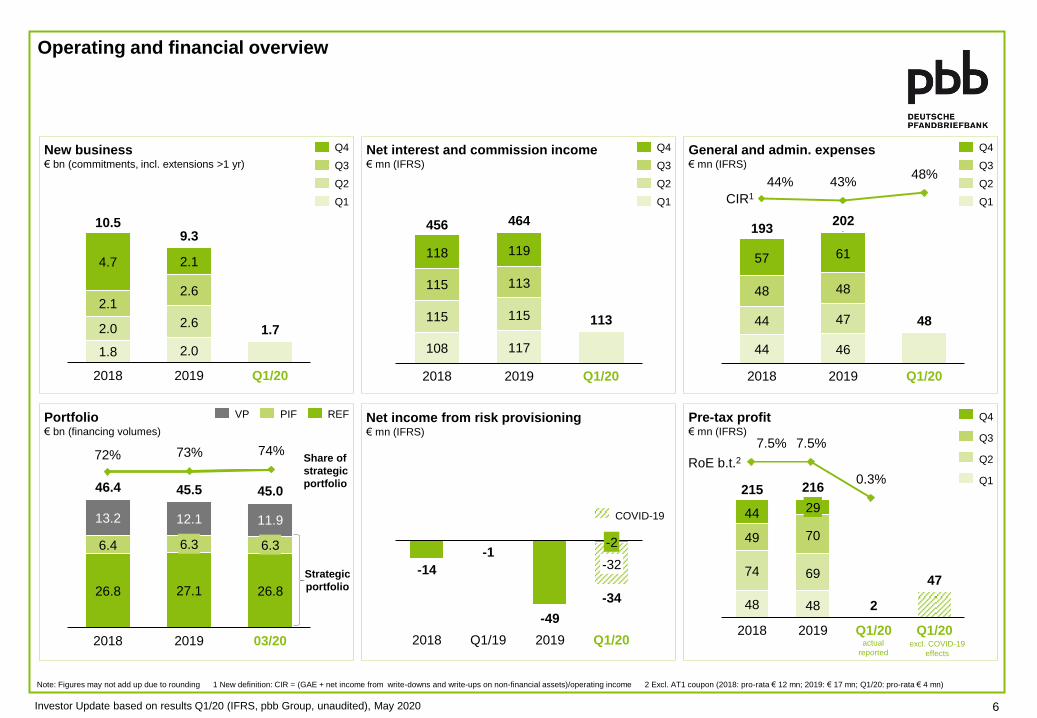
Operating and financial overview
New business € bn (commitments, incl. extensions >1 yr)
Net interest and commission income € mn (IFRS)
Note: Figures may not add up due to rounding 1 New definition: CIR = (GAE + net income from write-downs and write-ups on non-financial assets)/operating income 2 Excl. AT1 coupon (2018: pro-rata € 12 mn; 2019: € 17 mn; Q1/20: pro-rata € 4 mn)
General and admin. expenses € mn (IFRS)
Net income from risk provisioning € mn (IFRS)
Portfolio € bn (financing volumes)
2018
4.7
2.1
2.1
2.0
2019
1.8
2.6
2.6
2.0
Q1/20
10.5 9.3
1.7
Q4
Q3
Q2
Q1
RoE b.t.2
7.5%
0.3%
7.5%
48 48 2
47 74 69
49 70
44
216
29
2018 2019
215
Q1/20 Q1/20
72% 73% 74%
13.2 12.1
6.3
03/20
6.4
2018
26.8 27.1
2019
11.9
6.3
26.8
46.4 45.0 45.5
VP REF PIF
Strategic
portfolio
Share of
strategic
portfolio
108 117
113 115 115
115 113
118 119
2018 2019 Q1/20
456 464
9
44% 43% 48%
44 46
48 44 47
48 48
57 61
Q1/20 2019
202
2018
193
CIR1
-14
-1
-49
-34
-32
2018 2019 Q1/19
-2
Q1/20
Q4
Q2
Q3
Q1
Q4
Q3
Q1
Q2
Q4
Q2
Q3
Q1
COVID-19
excl. COVID-19
effects
actual
reported
Investor Update based on results Q1/20 (IFRS, pbb Group, unaudited), May 2020 6
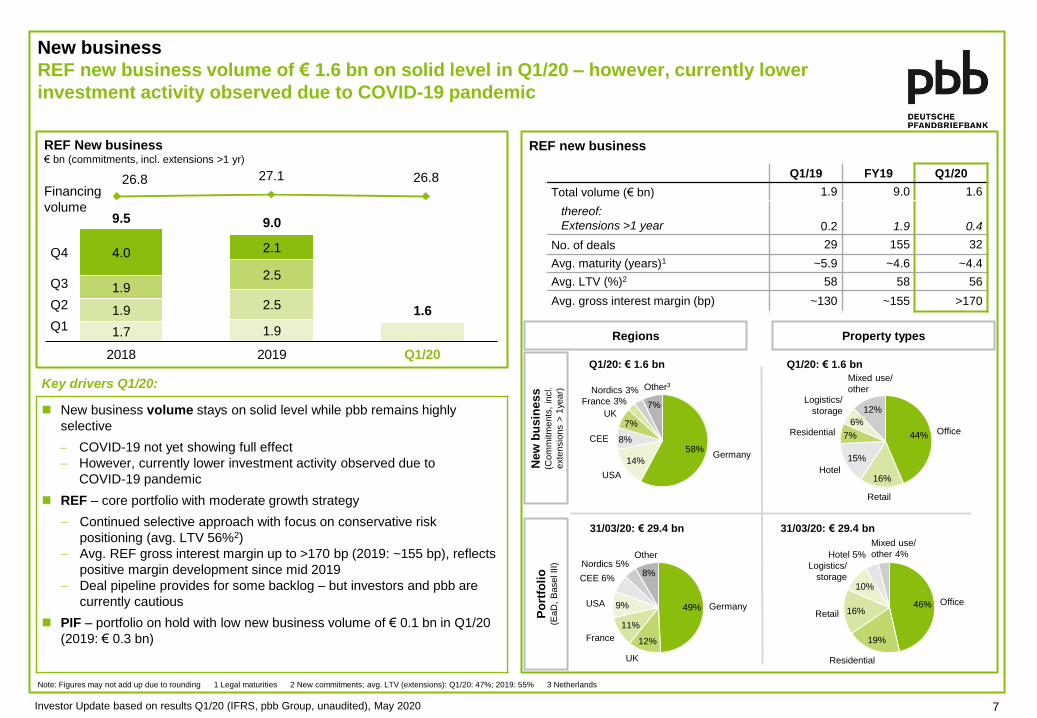
Key drivers Q1/20:
New business volume stays on solid level while pbb remains highly
selective
COVID-19 not yet showing full effect
However, currently lower investment activity observed due to
COVID-19 pandemic
REF – core portfolio with moderate growth strategy
Continued selective approach with focus on conservative risk
positioning (avg. LTV 56%2)
Avg. REF gross interest margin up to >170 bp (2019: ~155 bp), reflects
positive margin development since mid 2019
Deal pipeline provides for some backlog – but investors and pbb are
currently cautious
PIF – portfolio on hold with low new business volume of € 0.1 bn in Q1/20
(2019: € 0.3 bn)
New
bu
sin
es
s
(Com
mitm
ents
, in
cl.
exte
nsio
ns >
1ye
ar)
Note: Figures may not add up due to rounding 1 Legal maturities 2 New commitments; avg. LTV (extensions): Q1/20: 47%; 2019: 55% 3 Netherlands
New business
REF new business volume of € 1.6 bn on solid level in Q1/20 – however, currently lower
investment activity observed due to COVID-19 pandemic
Q1/19 FY19 Q1/20
Total volume (€ bn) 1.9 9.0 1.6
thereof:
Extensions >1 year
0.2 1.9 0.4
No. of deals 29 155 32
Avg. maturity (years)1 ~5.9 ~4.6 ~4.4
Avg. LTV (%)2 58 58 56
Avg. gross interest margin (bp) ~130 ~155 >170
Q1/20: € 1.6 bn Q1/20: € 1.6 bn
44%
16%
15%
7%
12%
Office
Retail
Hotel
Residential
Logistics/
storage
6%
Mixed use/
other
Po
rtfo
lio
(E
aD
, B
asel III)
49%
12%
11%
9%
8%
France
Germany
UK
USA
CEE 6%
Other Nordics 5%
46%
19%
16% Retail
Office
Logistics/
storage
Residential
10%
Hotel 5%
Mixed use/
other 4%
31/03/20: € 29.4 bn 31/03/20: € 29.4 bn
Regions Property types
58%
14%
8%
7%
7%
Nordics 3%
Germany
USA
CEE
Other3
France 3%
UK
REF new business
26.8 27.1 26.8
4.0
2018
1.9
2.1
1.9
2.5
1.7
2.5
1.9
2019 Q1/20
Q4
Q2
Q3
Q1
9.5 9.0
1.6
REF New business € bn (commitments, incl. extensions >1 yr)
Financing
volume
Investor Update based on results Q1/20 (IFRS, pbb Group, unaudited), May 2020 7
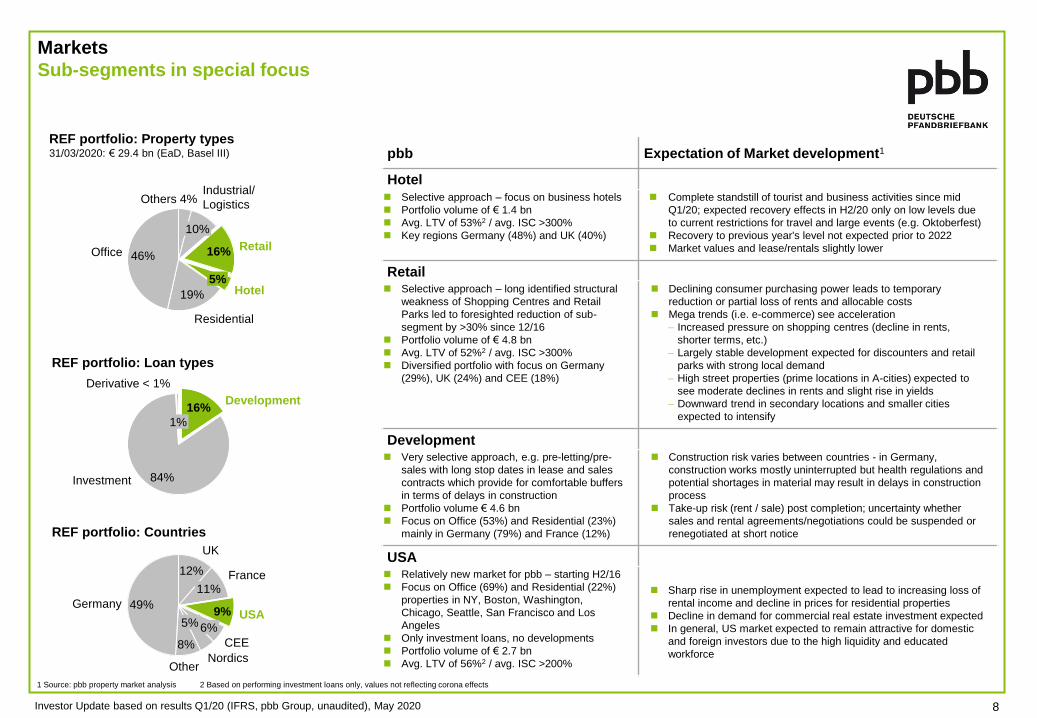
Markets
Sub-segments in special focus
1 Source: pbb property market analysis 2 Based on performing investment loans only, values not reflecting corona effects
REF portfolio: Property types 31/03/2020: € 29.4 bn (EaD, Basel III)
12%
9%
8%
49%
Nordics
UK
11%
5%
France
USA
CEE
6%
Other
Germany
REF portfolio: Countries
pbb Expectation of Market development1
Hotel Selective approach – focus on business hotels
Portfolio volume of € 1.4 bn
Avg. LTV of 53%2 / avg. ISC >300%
Key regions Germany (48%) and UK (40%)
Complete standstill of tourist and business activities since mid
Q1/20; expected recovery effects in H2/20 only on low levels due
to current restrictions for travel and large events (e.g. Oktoberfest)
Recovery to previous year's level not expected prior to 2022
Market values and lease/rentals slightly lower
Retail Selective approach – long identified structural
weakness of Shopping Centres and Retail
Parks led to foresighted reduction of sub-
segment by >30% since 12/16
Portfolio volume of € 4.8 bn
Avg. LTV of 52%2 / avg. ISC >300%
Diversified portfolio with focus on Germany
(29%), UK (24%) and CEE (18%)
Declining consumer purchasing power leads to temporary
reduction or partial loss of rents and allocable costs
Mega trends (i.e. e-commerce) see acceleration
Increased pressure on shopping centres (decline in rents,
shorter terms, etc.)
Largely stable development expected for discounters and retail
parks with strong local demand
High street properties (prime locations in A-cities) expected to
see moderate declines in rents and slight rise in yields
Downward trend in secondary locations and smaller cities
expected to intensify
Development Very selective approach, e.g. pre-letting/pre-
sales with long stop dates in lease and sales
contracts which provide for comfortable buffers
in terms of delays in construction
Portfolio volume € 4.6 bn
Focus on Office (53%) and Residential (23%)
mainly in Germany (79%) and France (12%)
Construction risk varies between countries - in Germany,
construction works mostly uninterrupted but health regulations and
potential shortages in material may result in delays in construction
process
Take-up risk (rent / sale) post completion; uncertainty whether
sales and rental agreements/negotiations could be suspended or
renegotiated at short notice
USA Relatively new market for pbb – starting H2/16
Focus on Office (69%) and Residential (22%)
properties in NY, Boston, Washington,
Chicago, Seattle, San Francisco and Los
Angeles
Only investment loans, no developments
Portfolio volume of € 2.7 bn
Avg. LTV of 56%2 / avg. ISC >200%
Sharp rise in unemployment expected to lead to increasing loss of
rental income and decline in prices for residential properties
Decline in demand for commercial real estate investment expected
In general, US market expected to remain attractive for domestic
and foreign investors due to the high liquidity and educated
workforce
16%
19%
46%
Others 4%
Office
10%
Industrial/
Logistics
Retail
Hotel 5%
Residential
16%
84%
1%
Development
Derivative < 1%
Investment
REF portfolio: Loan types
Investor Update based on results Q1/20 (IFRS, pbb Group, unaudited), May 2020 8
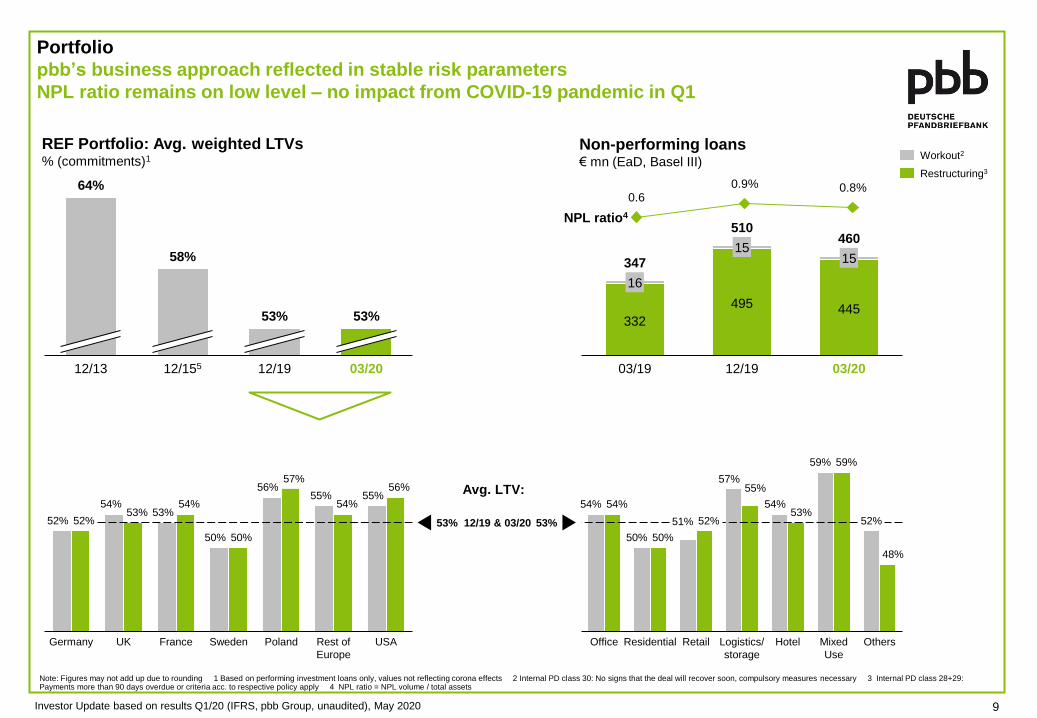
Portfolio
pbb’s business approach reflected in stable risk parameters
NPL ratio remains on low level – no impact from COVID-19 pandemic in Q1
REF Portfolio: Avg. weighted LTVs % (commitments)1
Investor Update based on results Q1/20 (IFRS, pbb Group, unaudited), May 2020
Note: Figures may not add up due to rounding 1 Based on performing investment loans only, values not reflecting corona effects 2 Internal PD class 30: No signs that the deal will recover soon, compulsory measures necessary 3 Internal PD class 28+29: Payments more than 90 days overdue or criteria acc. to respective policy apply 4 NPL ratio = NPL volume / total assets
12/13 12/155 03/20 12/19
58%
64%
53% 53%
Avg. LTV:
9
0.8% 0.6
0.9%
332
495 445
347
16
15
03/19 12/19 03/20
15
510 460
Workout2
Restructuring3
Non-performing loans € mn (EaD, Basel III)
NPL ratio4
Poland USA Germany UK France Sweden Rest of
Europe
53% 12/19 & 03/20 52% 52%
54%
57%
53% 54%
53% 54%
50% 50%
56% 55% 55%
56%
52%
Hotel Office Logistics/
storage
Residential Others Retail Mixed
Use
53% 52%
54% 54%
50% 50%
54%
55%
51%
57%
53%
59% 59%
48%
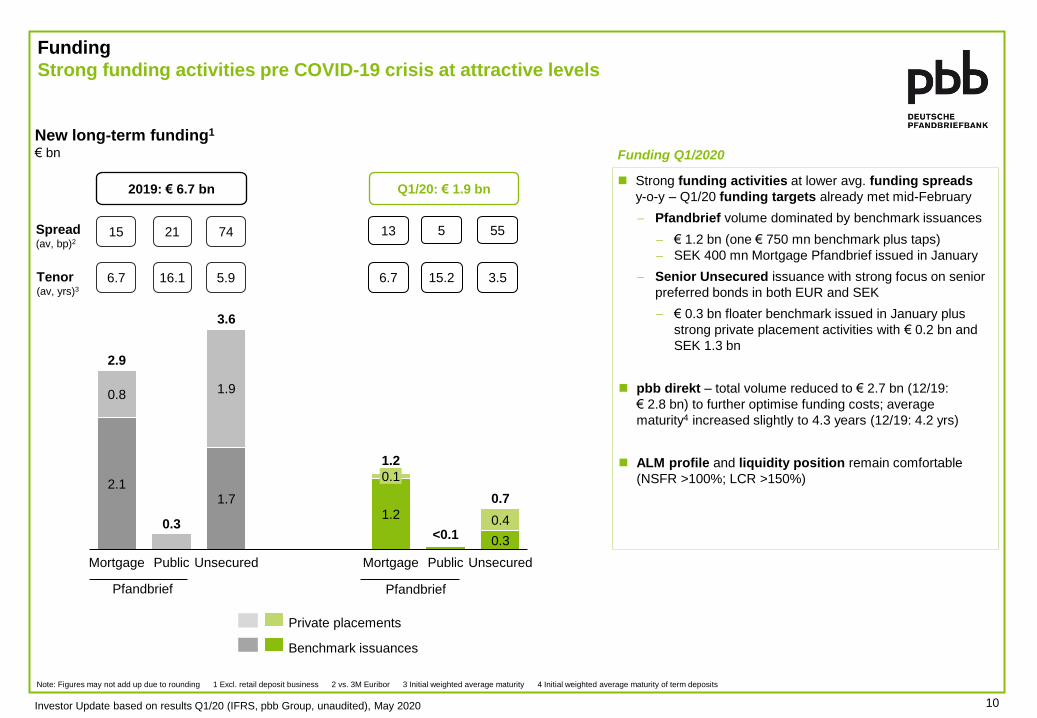
Funding
Strong funding activities pre COVID-19 crisis at attractive levels
10
1.9
Mortgage
0.1
Mortgage
0.8
2.1
Unsecured
1.7
Public
1.2
Public
0.4
0.3
Unsecured
2.9
0.7
3.6
1.2
<0.1 0.3
Q1/20: € 1.9 bn
Tenor (av, yrs)3
6.7 15.2 3.5
13 5 55 Spread (av, bp)2
Note: Figures may not add up due to rounding 1 Excl. retail deposit business 2 vs. 3M Euribor 3 Initial weighted average maturity 4 Initial weighted average maturity of term deposits
New long-term funding1
€ bn
Pfandbrief Pfandbrief
2019: € 6.7 bn
6.7 16.1 5.9
15 21 74
Private placements
Benchmark issuances
Investor Update based on results Q1/20 (IFRS, pbb Group, unaudited), May 2020
Funding Q1/2020
Strong funding activities at lower avg. funding spreads
y-o-y – Q1/20 funding targets already met mid-February
Pfandbrief volume dominated by benchmark issuances
€ 1.2 bn (one € 750 mn benchmark plus taps)
SEK 400 mn Mortgage Pfandbrief issued in January
Senior Unsecured issuance with strong focus on senior
preferred bonds in both EUR and SEK
€ 0.3 bn floater benchmark issued in January plus
strong private placement activities with € 0.2 bn and
SEK 1.3 bn
pbb direkt – total volume reduced to € 2.7 bn (12/19:
€ 2.8 bn) to further optimise funding costs; average
maturity4 increased slightly to 4.3 years (12/19: 4.2 yrs)
ALM profile and liquidity position remain comfortable
(NSFR >100%; LCR >150%)
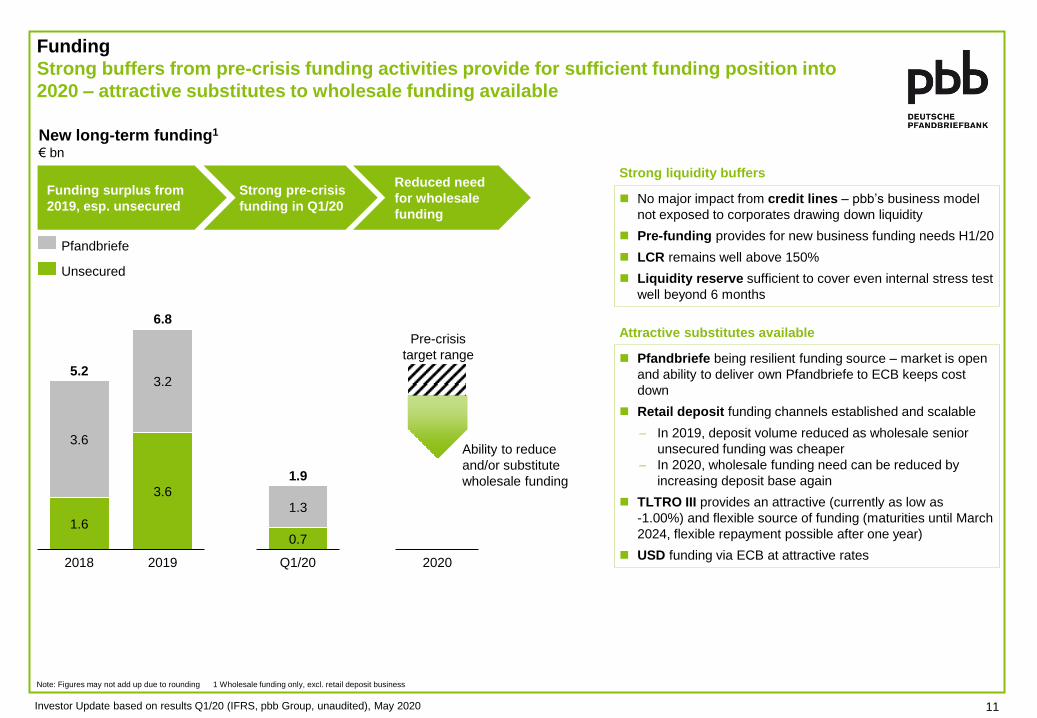
Funding
Strong buffers from pre-crisis funding activities provide for sufficient funding position into
2020 – attractive substitutes to wholesale funding available
2018
5.2 3.2
1.6
3.6
3.6
2019
6.8
Pre-crisis
target range
Note: Figures may not add up due to rounding 1 Wholesale funding only, excl. retail deposit business
Strong liquidity buffers
No major impact from credit lines – pbb’s business model
not exposed to corporates drawing down liquidity
Pre-funding provides for new business funding needs H1/20
LCR remains well above 150%
Liquidity reserve sufficient to cover even internal stress test
well beyond 6 months
New long-term funding1
€ bn
1.9
1.3
0.7
Q1/20
Pfandbriefe
Unsecured
2020
Funding surplus from
2019, esp. unsecured
Strong pre-crisis
funding in Q1/20
Reduced need
for wholesale
funding
Attractive substitutes available
Pfandbriefe being resilient funding source – market is open
and ability to deliver own Pfandbriefe to ECB keeps cost
down
Retail deposit funding channels established and scalable
In 2019, deposit volume reduced as wholesale senior
unsecured funding was cheaper
In 2020, wholesale funding need can be reduced by
increasing deposit base again
TLTRO III provides an attractive (currently as low as
-1.00%) and flexible source of funding (maturities until March
2024, flexible repayment possible after one year)
USD funding via ECB at attractive rates
Ability to reduce
and/or substitute
wholesale funding
Investor Update based on results Q1/20 (IFRS, pbb Group, unaudited), May 2020 11
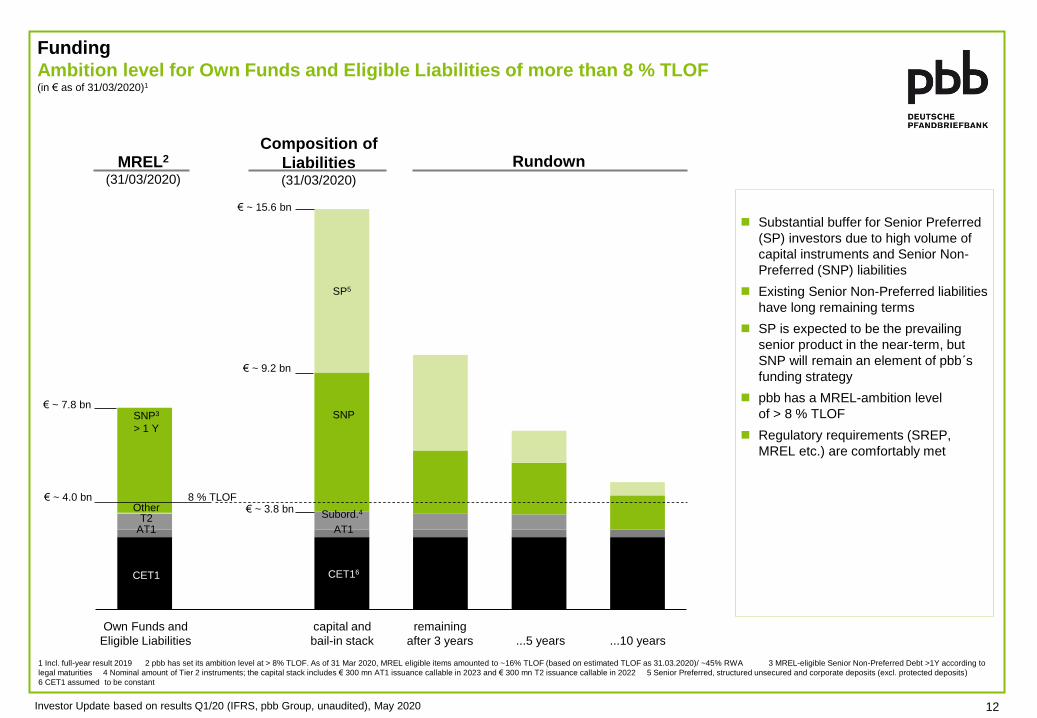
SP5
Funding
Ambition level for Own Funds and Eligible Liabilities of more than 8 % TLOF (in € as of 31/03/2020)1
AT1
capital and
bail-in stack
SNP
remaining
after 3 years ...5 years ...10 years
Subord.4
CET16
€ ~ 4.0 bn 8 % TLOF
€ ~ 15.6 bn
€ ~ 9.2 bn
€ ~ 3.8 bn
Substantial buffer for Senior Preferred
(SP) investors due to high volume of
capital instruments and Senior Non-
Preferred (SNP) liabilities
Existing Senior Non-Preferred liabilities
have long remaining terms
SP is expected to be the prevailing
senior product in the near-term, but
SNP will remain an element of pbb´s
funding strategy
pbb has a MREL-ambition level
of > 8 % TLOF
Regulatory requirements (SREP,
MREL etc.) are comfortably met
Own Funds and
Eligible Liabilities
€ ~ 7.8 bn SNP3
> 1 Y
AT1
CET1
T2
Composition of
Liabilities (31/03/2020)
Rundown MREL2
(31/03/2020)
Other
1 Incl. full-year result 2019 2 pbb has set its ambition level at > 8% TLOF. As of 31 Mar 2020, MREL eligible items amounted to ~16% TLOF (based on estimated TLOF as 31.03.2020)/ ~45% RWA 3 MREL-eligible Senior Non-Preferred Debt >1Y according to
legal maturities 4 Nominal amount of Tier 2 instruments; the capital stack includes € 300 mn AT1 issuance callable in 2023 and € 300 mn T2 issuance callable in 2022 5 Senior Preferred, structured unsecured and corporate deposits (excl. protected deposits)
6 CET1 assumed to be constant
Investor Update based on results Q1/20 (IFRS, pbb Group, unaudited), May 2020 12

13
Funding
Investment opportunities
Pfandbrief Investments
One of the largest Pfandbrief issuers with 15 € benchmarks outstanding and a strong presence in the GBP, SEK and USD market
Benchmarks issued with maturities up to 2035
Very low weighted average LTV of 33.85% in the Mortgage Cover Pool (based on market value)
Private Placements starting with € 1 mn and maturities up to 30 years
Available currencies: EUR, GBP, SEK, USD
Unsecured Investments
2 € senior preferred and 2 € senior non preferred benchmarks outstanding
Private Placements starting with € 1 mn and maturities up to 30 years
Available currencies (e.g. EUR, GBP, SEK, USD, CHF, NOK, YEN, CZK)
Senior “preferred” (rated A-) and “non preferred” (rated BBB-) products
Focus on the development of the funding franchise
New debt product “Senior Preferred” opens the access to a larger investor base.
Co-operation with Origin for the MTN placement and Deposit Solutions for our retail deposit brand pbb direkt in order to
stream line internal processes.
Investor Update based on results Q1/20 (IFRS, pbb Group, unaudited), May 2020

Capital
Capitalisation remains strong – withdrawal of dividend proposal and full retention of 2019
profit follows ECB recommendation and accounts for COVID-19 pandemic uncertainties
Basel III: Equity and capital ratios
(IFRS)
Note: Figures may not add up due to rounding
1 Excl. interim result, post dividend 2018 2 Retrospectively adjusted, incl. full-year result 2019 due to withdrawal of dividend proposal for 2019 3 Excl. interim result, incl. full-year result 2019 due to withdrawal of dividend proposal for 2019
Basel III: RWA
€ bn (IFRS)
RWA development Q1/20:
RWA down € 0.4 bn q-o-q mainly due to technical effects
(e.g. regular reviews, construction completions,
reclassification effects) – increase as of 12/19 resulted
from LGD parameter recalibration, anticipating EBA and
Basel IV
03/19
17.3
14.3
12/19 03/20
17.7
SREP requirements 2020:
SREP requirements:
CET 1 ratio: 9.5%
Tier 1 ratio: 11.0%
Own funds ratio: 13.0%
ECB’s Banking Supervisory Committee lowered
requirements due to COVID-19 as of 12th March 2020 with
1.09%-pts CET1-relief for pbb
Anticipated countercyclical buffer stable at 45bp,
temporarily suspended
Capital ratios in %
03/191
12/19 03/203
reported full profit
retention2
CET 1 18.8 15.2 15.9 16.3
Tier 1 20.9 16.9 17.5 18.0
Own funds 25.4 20.4 21.1 21.6
Leverage ratio 5.1 5.4 5.6 5.6
Capital in € bn 03/191
12/19 03/203
reported full profit
retention2
CET 1 2.7 2.7 2.8 2.8
AT 1 0.3 0.3 0.3 0.3
Tier 2 0.6 0.6 0.6 0.6
Total Equity 3.6 3.6 3.7 3.7
Capital ratios – dividend impact:
Capital position strengthened by full retention of 2019 profit
due to withdrawal of dividend proposal
12/19 retrospectively adjusted – +0.7%-pts to 15.9%3
03/20 CET 1 ratio at 16.3%2
Withdrawal of dividend proposal for 2019 follows ECB
recommendation related to COVID-19 pandemic
– market situation will be re-assessed after 1 October 2020
when the impact of the COVID-19 pandemic provides for
greater certainty
Investor Update based on results Q1/20 (IFRS, pbb Group, unaudited), May 2020 14
Solid operating performance in Q1/20 – impact from COVID-19 pandemic related to changed economic
and sector specific forecast assumptions and fair value measurements, but no COVID-19 related defaults
so far
Risk provisioning mainly related to model based provisions in stages 1 and 2
Fair value measurements driven by widened credit spreads
Guidance 2020 withdrawn in view of significant macro-economic challenges – in particular, the development
of risk provisioning and valuation effects is not predictable
For the time being, V-shape economic development assumed for 2020/2021 – if negative tendencies
become more pronounced, further risk provisioning likely
All relevant (organisational and risk) measures taken to cope with the impacts from the COVID-19 crisis
Client relationship and new business remain key, while risks continue to be assessed carefully
Combination of lower prepayments, higher extensions and very selective new business origination
expected to safeguard stable portfolio level
Overall operative performance (excluding further COVID-19-effects) expected to be reasonably resilient
pbb continues to work on cost efficiency and digitalisation – investments in digitalisation to be
continued
Summary & Outlook
Operative performance expected to be resilient despite COVID-19
Investor Update based on results Q1/20 (IFRS, pbb Group, unaudited), May 2020 15

16 Investor Update based on results Q1/20 (IFRS, pbb Group, unaudited), May 2020
Funding / Debt Investor Relations
Götz Michl +49 (0)6196 9990 2931
Silvio Bardeschi + 49 (0)6196 9990 2934
Funding Desk [email protected]
Webpage: www.pfandbriefbank.com/investors/debt-investors.html
Contact details
© Deutsche Pfandbriefbank AG
Parkring 28
85748 Garching/Germany
+49 (0) 89 28 80-0
www.pfandbriefbank.com
Appendix
17 Investor Update based on results Q1/20 (IFRS, pbb Group, unaudited), May 2020
Key figures
pbb Group
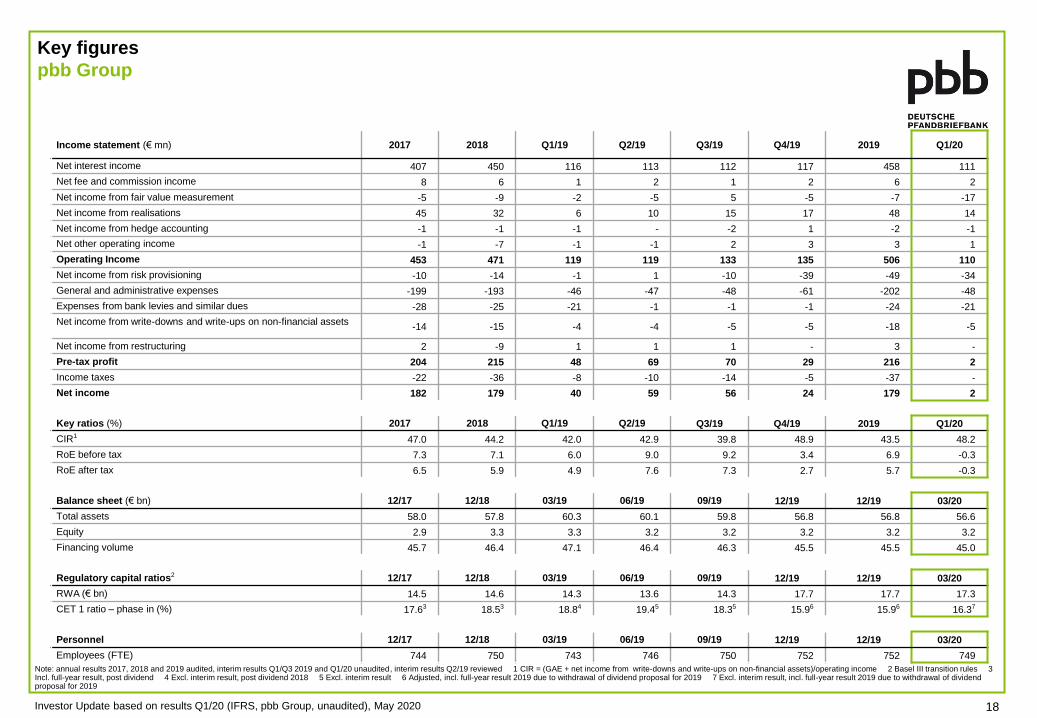
Income statement (€ mn) 2017 2018 Q1/19 Q2/19 Q3/19 Q4/19 2019 Q1/20
Net interest income 407 450 116 113 112 117 458 111
Net fee and commission income 8 6 1 2 1 2 6 2
Net income from fair value measurement -5 -9 -2 -5 5 -5 -7 -17
Net income from realisations 45 32 6 10 15 17 48 14
Net income from hedge accounting -1 -1 -1 - -2 1 -2 -1
Net other operating income -1 -7 -1 -1 2 3 3 1
Operating Income 453 471 119 119 133 135 506 110
Net income from risk provisioning -10 -14 -1 1 -10 -39 -49 -34
General and administrative expenses -199 -193 -46 -47 -48 -61 -202 -48
Expenses from bank levies and similar dues -28 -25 -21 -1 -1 -1 -24 -21
Net income from write-downs and write-ups on non-financial assets -14 -15 -4 -4 -5 -5 -18 -5
Net income from restructuring 2 -9 1 1 1 - 3 -
Pre-tax profit 204 215 48 69 70 29 216 2
Income taxes -22 -36 -8 -10 -14 -5 -37 -
Net income 182 179 40 59 56 24 179 2
Key ratios (%) 2017 2018 Q1/19 Q2/19 Q3/19 Q4/19 2019 Q1/20
CIR1 47.0 44.2 42.0 42.9 39.8 48.9 43.5 48.2
RoE before tax 7.3 7.1 6.0 9.0 9.2 3.4 6.9 -0.3
RoE after tax 6.5 5.9 4.9 7.6 7.3 2.7 5.7 -0.3
Balance sheet (€ bn) 12/17 12/18 03/19 06/19 09/19 12/19 12/19 03/20
Total assets 58.0 57.8 60.3 60.1 59.8 56.8 56.8 56.6
Equity 2.9 3.3 3.3 3.2 3.2 3.2 3.2 3.2
Financing volume 45.7 46.4 47.1 46.4 46.3 45.5 45.5 45.0
Regulatory capital ratios2 12/17 12/18 03/19 06/19 09/19 12/19 12/19 03/20
RWA (€ bn) 14.5 14.6 14.3 13.6 14.3 17.7 17.7 17.3
CET 1 ratio – phase in (%) 17.63 18.53 18.84 19.45 18.35 15.96 15.96 16.37
Personnel 12/17 12/18 03/19 06/19 09/19 12/19 12/19 03/20
Employees (FTE) 744 750 743 746 750 752 752 749
Note: annual results 2017, 2018 and 2019 audited, interim results Q1/Q3 2019 and Q1/20 unaudited, interim results Q2/19 reviewed 1 CIR = (GAE + net income from write-downs and write-ups on non-financial assets)/operating income 2 Basel III transition rules 3 Incl. full-year result, post dividend 4 Excl. interim result, post dividend 2018 5 Excl. interim result 6 Adjusted, incl. full-year result 2019 due to withdrawal of dividend proposal for 2019 7 Excl. interim result, incl. full-year result 2019 due to withdrawal of dividend proposal for 2019
Investor Update based on results Q1/20 (IFRS, pbb Group, unaudited), May 2020 18
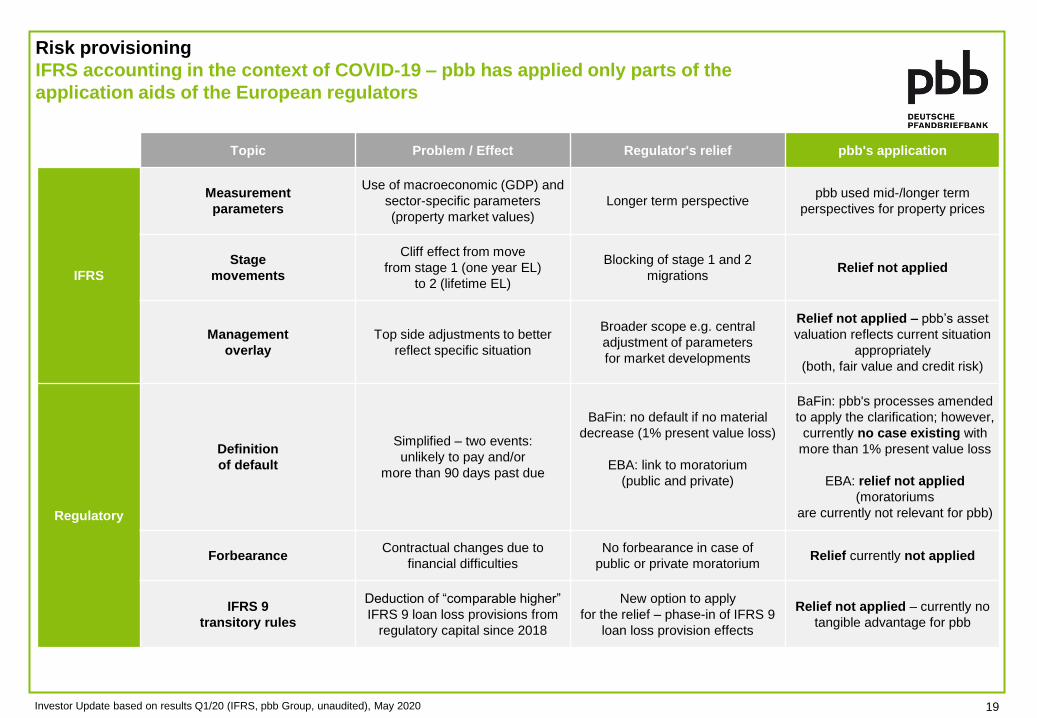
Risk provisioning
IFRS accounting in the context of COVID-19 – pbb has applied only parts of the
application aids of the European regulators
Topic Problem / Effect Regulator's relief pbb's application
IFRS
Measurement
parameters
Use of macroeconomic (GDP) and
sector-specific parameters
(property market values)
Longer term perspective pbb used mid-/longer term
perspectives for property prices
Stage
movements
Cliff effect from move
from stage 1 (one year EL)
to 2 (lifetime EL)
Blocking of stage 1 and 2
migrations Relief not applied
Management
overlay
Top side adjustments to better
reflect specific situation
Broader scope e.g. central
adjustment of parameters
for market developments
Relief not applied – pbb’s asset
valuation reflects current situation
appropriately
(both, fair value and credit risk)
Regulatory
Definition
of default
Simplified – two events:
unlikely to pay and/or
more than 90 days past due
BaFin: no default if no material
decrease (1% present value loss)
EBA: link to moratorium
(public and private)
BaFin: pbb's processes amended
to apply the clarification; however,
currently no case existing with
more than 1% present value loss
EBA: relief not applied
(moratoriums
are currently not relevant for pbb)
Forbearance Contractual changes due to
financial difficulties
No forbearance in case of
public or private moratorium Relief currently not applied
IFRS 9
transitory rules
Deduction of “comparable higher”
IFRS 9 loan loss provisions from
regulatory capital since 2018
New option to apply
for the relief – phase-in of IFRS 9
loan loss provision effects
Relief not applied – currently no
tangible advantage for pbb
Investor Update based on results Q1/20 (IFRS, pbb Group, unaudited), May 2020 19
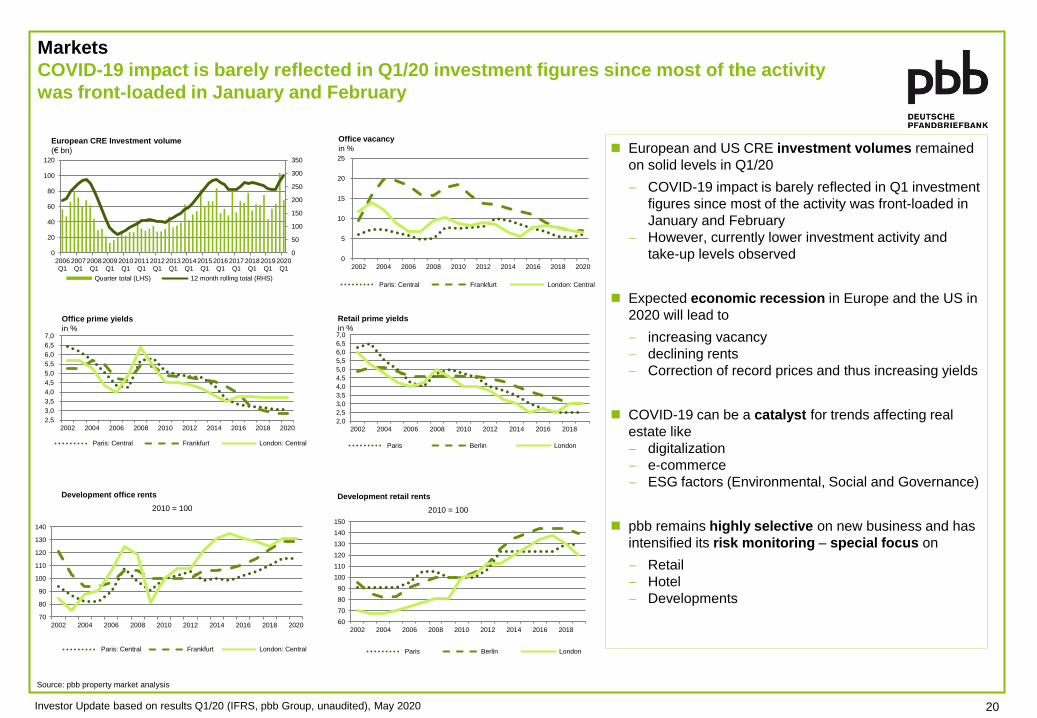
Markets
COVID-19 impact is barely reflected in Q1/20 investment figures since most of the activity
was front-loaded in January and February
Source: pbb property market analysis
European and US CRE investment volumes remained
on solid levels in Q1/20
COVID-19 impact is barely reflected in Q1 investment
figures since most of the activity was front-loaded in
January and February
However, currently lower investment activity and
take-up levels observed
Expected economic recession in Europe and the US in
2020 will lead to
increasing vacancy
declining rents
Correction of record prices and thus increasing yields
COVID-19 can be a catalyst for trends affecting real
estate like
digitalization
e-commerce
ESG factors (Environmental, Social and Governance)
pbb remains highly selective on new business and has
intensified its risk monitoring – special focus on
Retail
Hotel
Developments
European CRE Investment volume
(€ bn)
Retail prime yields
in %
Development retail rents
2010 = 100
Office prime yields
in %
Office vacancy
in %
Development office rents
2010 = 100
0
50
100
150
200
250
300
350
0
20
40
60
80
100
120
2006Q1
2007Q1
2008Q1
2009Q1
2010Q1
2011Q1
2012Q1
2013Q1
2014Q1
2015Q1
2016Q1
2017Q1
2018Q1
2019Q1
2020Q1
Quarter total (LHS) 12 month rolling total (RHS)
0
5
10
15
20
25
2002 2004 2006 2008 2010 2012 2014 2016 2018 2020
Paris: Central Frankfurt London: Central
2,5
3,0
3,5
4,0
4,5
5,0
5,5
6,0
6,5
7,0
2002 2004 2006 2008 2010 2012 2014 2016 2018 2020
Paris: Central Frankfurt London: Central
70
80
90
100
110
120
130
140
2002 2004 2006 2008 2010 2012 2014 2016 2018 2020
Paris: Central Frankfurt London: Central
2,0
2,5
3,0
3,5
4,0
4,5
5,0
5,5
6,0
6,5
7,0
2002 2004 2006 2008 2010 2012 2014 2016 2018
Paris Berlin London
60
70
80
90
100
110
120
130
140
150
2002 2004 2006 2008 2010 2012 2014 2016 2018
Paris Berlin London
Investor Update based on results Q1/20 (IFRS, pbb Group, unaudited), May 2020 20
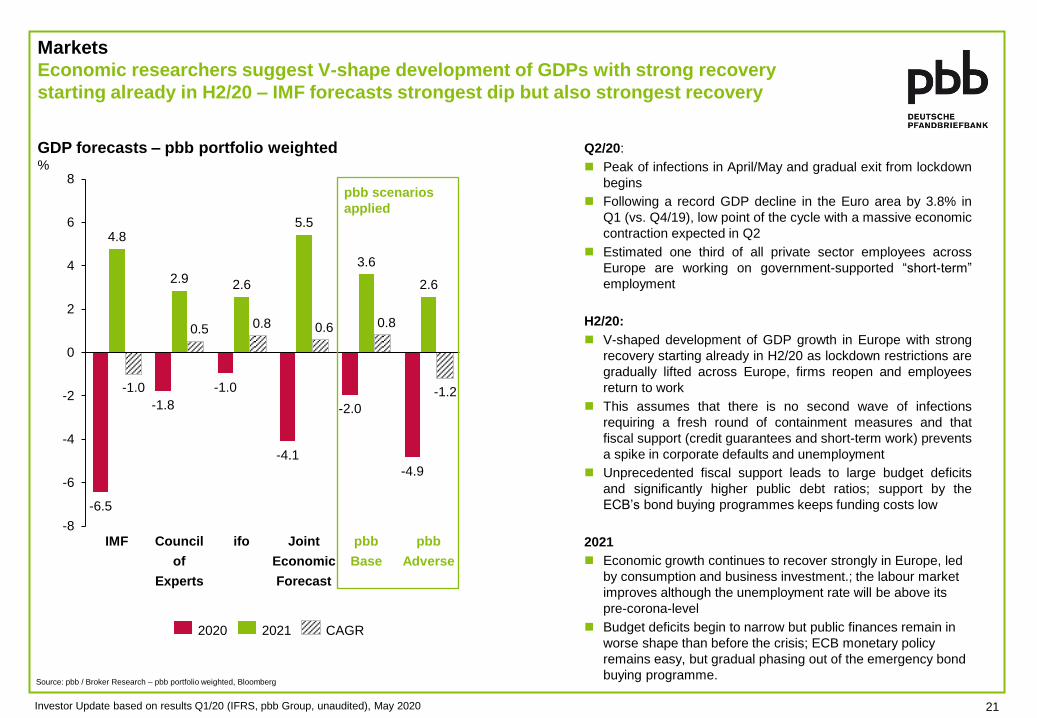
Q2/20:
Peak of infections in April/May and gradual exit from lockdown
begins
Following a record GDP decline in the Euro area by 3.8% in
Q1 (vs. Q4/19), low point of the cycle with a massive economic
contraction expected in Q2
Estimated one third of all private sector employees across
Europe are working on government-supported “short-term”
employment
H2/20:
V-shaped development of GDP growth in Europe with strong
recovery starting already in H2/20 as lockdown restrictions are
gradually lifted across Europe, firms reopen and employees
return to work
This assumes that there is no second wave of infections
requiring a fresh round of containment measures and that
fiscal support (credit guarantees and short-term work) prevents
a spike in corporate defaults and unemployment
Unprecedented fiscal support leads to large budget deficits
and significantly higher public debt ratios; support by the
ECB’s bond buying programmes keeps funding costs low
2021
Economic growth continues to recover strongly in Europe, led
by consumption and business investment.; the labour market
improves although the unemployment rate will be above its
pre-corona-level
Budget deficits begin to narrow but public finances remain in
worse shape than before the crisis; ECB monetary policy
remains easy, but gradual phasing out of the emergency bond
buying programme.
Markets
Economic researchers suggest V-shape development of GDPs with strong recovery
starting already in H2/20 – IMF forecasts strongest dip but also strongest recovery
Source: pbb / Broker Research – pbb portfolio weighted, Bloomberg
-8
-6
-4
-2
0
2
4
6
8
Council
of
Experts
pbb
Base
-1.2
IMF
-1.8
pbb
Adverse
ifo
2.6
Joint
Economic
Forecast
-6.5
-4.1
4.8
-1.0
2.9
0.5
-1.0
2.6
0.8
5.5
0.6
-2.0
3.6
0.8
-4.9
2021 2020 CAGR
pbb scenarios
applied
GDP forecasts – pbb portfolio weighted %
Investor Update based on results Q1/20 (IFRS, pbb Group, unaudited), May 2020 21
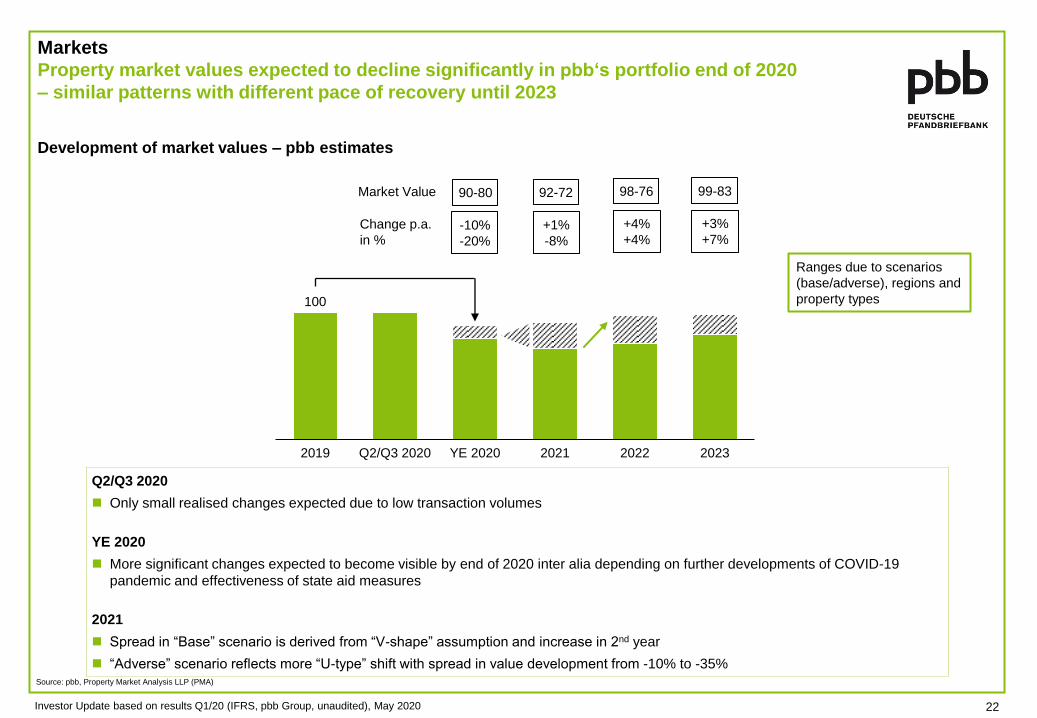
Markets
Property market values expected to decline significantly in pbb‘s portfolio end of 2020
– similar patterns with different pace of recovery until 2023
Source: pbb, Property Market Analysis LLP (PMA)
Q2/Q3 2020
Only small realised changes expected due to low transaction volumes
YE 2020
More significant changes expected to become visible by end of 2020 inter alia depending on further developments of COVID-19
pandemic and effectiveness of state aid measures
2021
Spread in “Base” scenario is derived from “V-shape” assumption and increase in 2nd year
“Adverse” scenario reflects more “U-type” shift with spread in value development from -10% to -35%
100
Q2/Q3 2020 YE 2020 2019 2022 2021 2023
Market Value 90-80
-10%
-20%
92-72
+1%
-8%
98-76
+4%
+4%
99-83
+3%
+7% Change p.a.
in %
Development of market values – pbb estimates
Ranges due to scenarios
(base/adverse), regions and
property types
Investor Update based on results Q1/20 (IFRS, pbb Group, unaudited), May 2020 22
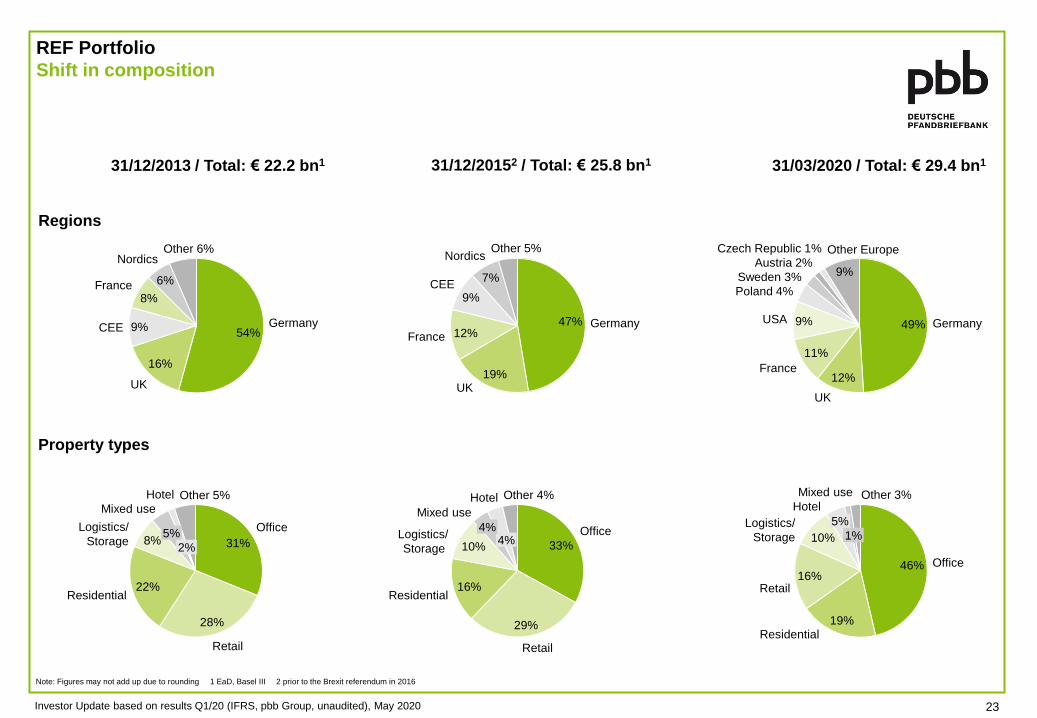
REF Portfolio
Shift in composition
Regions
31/03/2020 / Total: € 29.4 bn1
Note: Figures may not add up due to rounding 1 EaD, Basel III 2 prior to the Brexit referendum in 2016
31/12/2013 / Total: € 22.2 bn1
54%
16%
9%
8%
6%
UK
Germany CEE
Other 6%
France
Nordics
Investor Update based on results Q1/20 (IFRS, pbb Group, unaudited), May 2020 23
31/12/20152 / Total: € 25.8 bn1
47%
19%
12%
9%
7%
Germany
Other 5% Nordics
UK
France
CEE
33%
29%
16%
10% 4%
Office
Retail
Mixed use
Residential
4% Logistics/
Storage
Hotel Other 4%
49%
12%
11%
9%
9%
Germany
UK
France
Poland 4%
Sweden 3%
USA
Austria 2%
Czech Republic 1% Other Europe
46%
19%
16%
10%
5%
Office
Residential
Logistics/
Storage
Mixed use
Retail
Hotel
1%
Other 3%
31%
28%
22%
8% Office
Retail
Residential
Logistics/
Storage
Mixed use Other 5%
5%
Hotel
2%
Property types

REF Portfolio
Special focus: Retail
REF portfolio: Property types 31/03/2020: € 29.4 bn (EaD, Basel III) Structural changes to overall retail segment
(e.g. e-Commerce, Brexit) resulted in
foresighted reduction of pbb’s retail exposure
(03/20: 16%; 12/16: 26%); almost completely
investments loans
Main countries Germany, UK and Poland
(major part of CEE).
UK – Retail parks, shopping centres and
outlet parks
Poland – Local and regional shopping malls
in larger/mid sized cities
Germany – Broad selection of Shopping
Malls (mostly owned / operated by market
leaders), High Street Shopping,
Neighborhood Shopping Centres and Retail
Parks
Average LTV1 of 52%
Average ISC >300%
COVID-19 impact varies depending on asset
class/country – thus far only minor effects, but
increasingly depending on pandemic’s further
course
Note: Figures may not add up due to rounding 1 Based on performing investment loans only, values not reflecting corona effects
>100% ≤70%
3.8
≤100% ≤60%
0.7
≤85%
0.2 0.0 0.0
1.8
>100% >350% >200% <100%
0.4
2.5
0.0
Retail portfolio: LTV1 ratio
31/03/2020: € 4.8 bn (EaD, Basel III)
Retail portfolio: ISC ratio 31/03/2020: € 4.8 bn (EaD, Basel III)
Retail: Countries 31/03/2020: € 4.8 bn (EaD, Basel III)
19%
16%
46%
10%
Residential
Retail
Hotel
Office
Industrial/
Logistics 5%
Others 4%
29%
24% 18%
7%
Switzerland 4% Germany
UK CEE
France
6%
Spain 3%
Nordics
Austria 3%
USA 3%
Netherlands 1%
Avg.-ISC
>300% Avg.-LTV1
52%
Investor Update based on results Q1/20 (IFRS, pbb Group, unaudited), May 2020 24

REF Portfolio
Special focus: Hotel
REF portfolio: Property types 31/03/2020: € 29.4 bn (EaD, Basel III)
Note: Figures may not add up due to rounding 1 Based on performing investment loans only, values not reflecting corona effects
1.3
60% 70% ≤85%
0.0
85% <=100%
0.1 0.0 0.0 0.1
>350%
0.3 0.4
>200%
0.5
>100% <100%1
Hotel portfolio: LTV1 ratio
31/03/2020: € 1.4 bn (EaD, Basel III)
Hotel portfolio: ISC ratio 31/03/2020: € 1.4 bn (EaD, Basel III)
Hotel: Countries 31/03/2020: € 1.4 bn (EaD, Basel III)
19%
46%
16%
10%
Residential
Industrial/
Logistics
Hotel 5%
Office
Retail
Others 4%
48%
40%
8%
Austria 5%
Germany
UK
Benelux
Focus on business hotels in metropolitan
regions of
Germany – Frankfurt, Hamburg, Munich,
Berlin, Stuttgart
Benelux – Luxemburg, Den Haag, Utrecht
London and Vienna
No holiday ressort hotels
90% investment loans, only 10% developments
Typically good sponsor / brand background with
established large brands / trademarks
Average LTV1 of 53%
Average ISC >300%
At present, most hotels are closed due to
COVID-19; based on prime location / sponsor
quality / well-known branding, we generally
expect good recovery and stabilisation post
COVID-19
Avg.-ISC
>300% Avg.-LTV1
53%
Investor Update based on results Q1/20 (IFRS, pbb Group, unaudited), May 2020 25
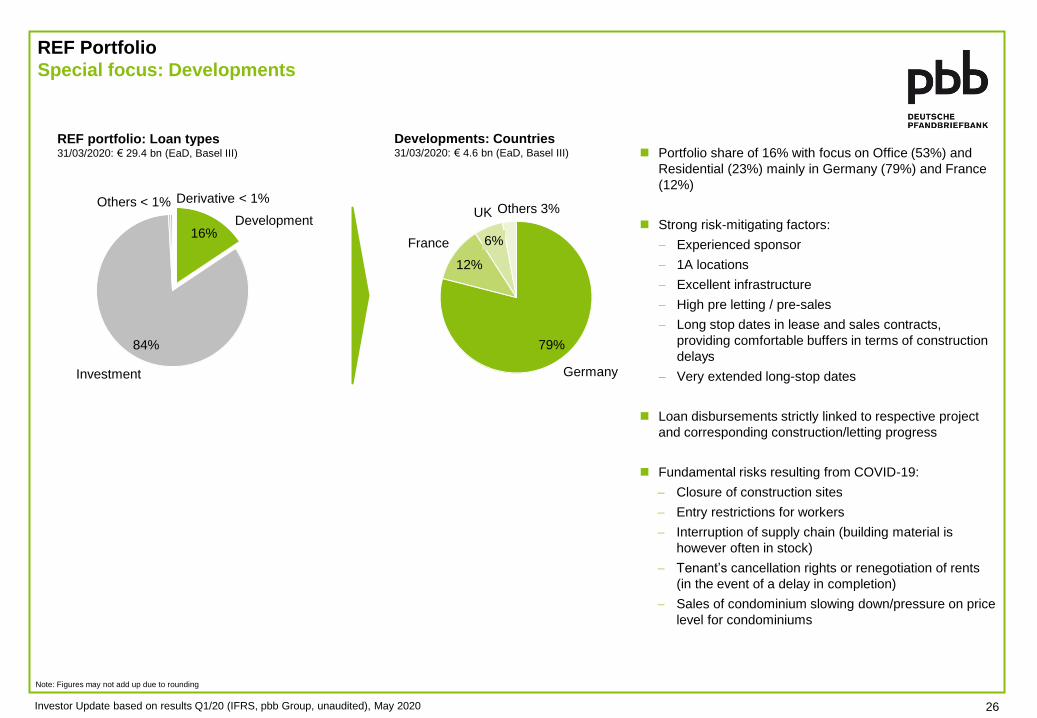
REF Portfolio
Special focus: Developments
REF portfolio: Loan types 31/03/2020: € 29.4 bn (EaD, Basel III)
Note: Figures may not add up due to rounding
Developments: Countries 31/03/2020: € 4.6 bn (EaD, Basel III)
16%
84%
Development
Investment
Derivative < 1% Others < 1%
79%
12%
France
Germany
6%
UK Others 3%
Portfolio share of 16% with focus on Office (53%) and
Residential (23%) mainly in Germany (79%) and France
(12%)
Strong risk-mitigating factors:
Experienced sponsor
1A locations
Excellent infrastructure
High pre letting / pre-sales
Long stop dates in lease and sales contracts,
providing comfortable buffers in terms of construction
delays
Very extended long-stop dates
Loan disbursements strictly linked to respective project
and corresponding construction/letting progress
Fundamental risks resulting from COVID-19:
Closure of construction sites
Entry restrictions for workers
Interruption of supply chain (building material is
however often in stock)
Tenant’s cancellation rights or renegotiation of rents
(in the event of a delay in completion)
Sales of condominium slowing down/pressure on price
level for condominiums
Investor Update based on results Q1/20 (IFRS, pbb Group, unaudited), May 2020 26
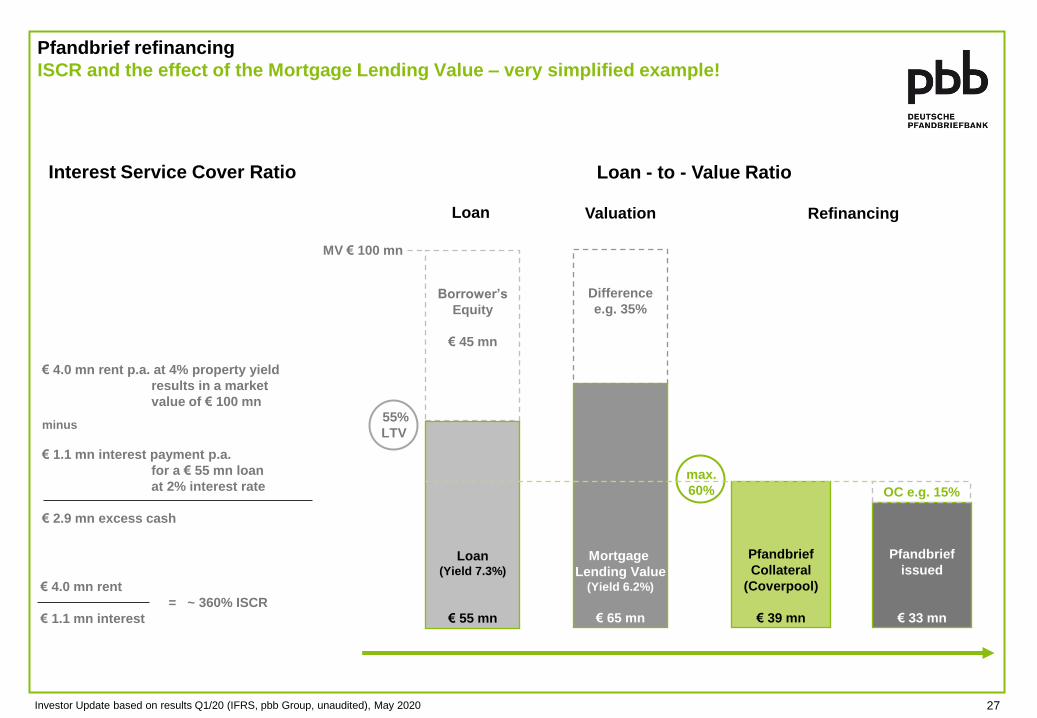
Mortgage
Lending Value (Yield 6.2%)
€ 65 mn
Difference
e.g. 35%
27
Pfandbrief refinancing
ISCR and the effect of the Mortgage Lending Value – very simplified example!
Loan
Pfandbrief
issued
€ 33 mn
OC e.g. 15%
Pfandbrief
Collateral
(Coverpool)
€ 39 mn
Borrower’s
Equity
€ 45 mn
Loan (Yield 7.3%)
€ 55 mn
Refinancing
55%
LTV
max.
60%
MV € 100 mn
Valuation
27 Investor Update based on results Q1/20 (IFRS, pbb Group, unaudited), May 2020
minus
€ 1.1 mn interest payment p.a.
for a € 55 mn loan
at 2% interest rate
€ 2.9 mn excess cash
€ 4.0 mn rent
= ~ 360% ISCR
€ 1.1 mn interest
€ 4.0 mn rent p.a. at 4% property yield
results in a market
value of € 100 mn
Interest Service Cover Ratio Loan - to - Value Ratio
28 Investor Update based on results Q1/20 (IFRS, pbb Group, unaudited), May 2020
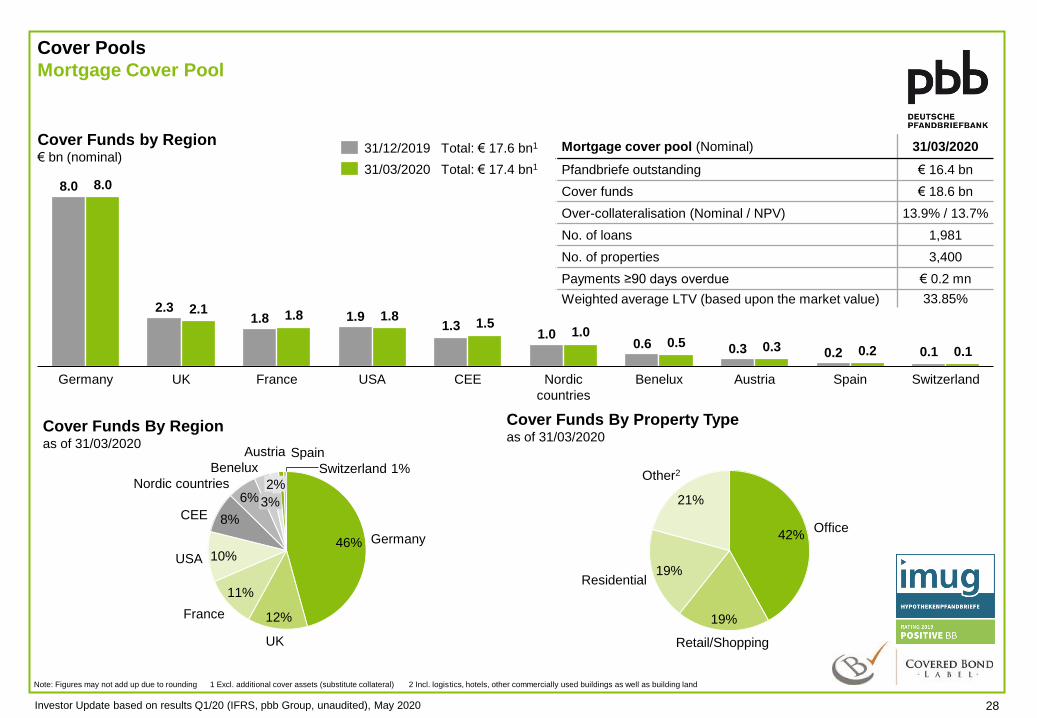
Cover Pools
Mortgage Cover Pool
Cover Funds by Region € bn (nominal)
Note: Figures may not add up due to rounding 1 Excl. additional cover assets (substitute collateral) 2 Incl. logistics, hotels, other commercially used buildings as well as building land
Cover Funds By Property Type as of 31/03/2020
Cover Funds By Region as of 31/03/2020
46%
12%
11%
10%
8%
6%
Germany
2%
CEE
UK
France
USA
Nordic countries
Benelux
3%
Austria Spain
Switzerland 1%
42%
19%
19%
21%
Office
Retail/Shopping
Other2
Residential
Mortgage cover pool (Nominal) 31/03/2020
Pfandbriefe outstanding € 16.4 bn
Cover funds € 18.6 bn
Over-collateralisation (Nominal / NPV) 13.9% / 13.7%
No. of loans 1,981
No. of properties 3,400
Payments ≥90 days overdue € 0.2 mn
Weighted average LTV (based upon the market value) 33.85%
0.2 0.3 0.6
France
1.0
Germany USA
8.0
UK Nordic
countries
1.3
CEE Benelux
Austria Spain
1.9
Switzerland
8.0
2.3 2.1 1.8
0.3
1.8 1.8 1.5
1.0 0.5
0.2 0.1 0.1
31/12/2019 Total: € 17.6 bn1
31/03/2020 Total: € 17.4 bn1
29
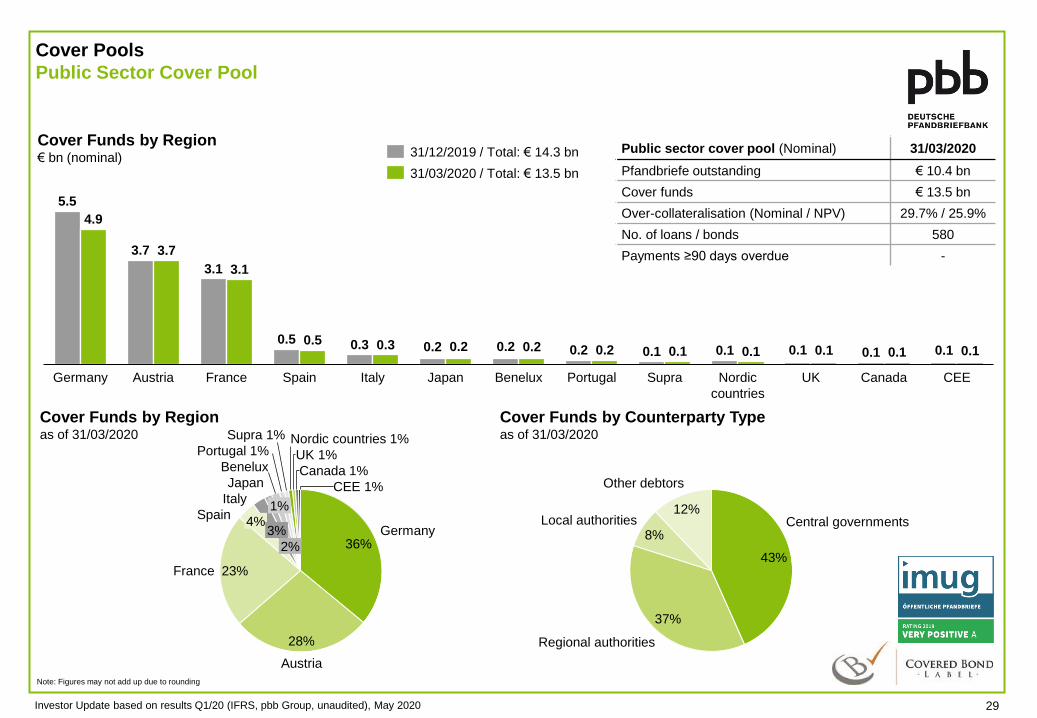
Cover Pools
Public Sector Cover Pool
Cover Funds by Region € bn (nominal)
Note: Figures may not add up due to rounding
Cover Funds by Counterparty Type as of 31/03/2020
Cover Funds by Region as of 31/03/2020
36%
28%
23%
Germany
Austria
Spain
Nordic countries 1%
France
Italy
4% 3%
Japan
Benelux
CEE 1%
Portugal 1%
Canada 1%
Supra 1%
2%
UK 1%
1%
43%
37%
8%
12% Local authorities Central governments
Regional authorities
Other debtors
Public sector cover pool (Nominal) 31/03/2020
Pfandbriefe outstanding € 10.4 bn
Cover funds € 13.5 bn
Over-collateralisation (Nominal / NPV) 29.7% / 25.9%
No. of loans / bonds 580
Payments ≥90 days overdue -
Investor Update based on results Q1/20 (IFRS, pbb Group, unaudited), May 2020
0.1 0.2
Spain
5.5
UK Austria Germany Japan
3.7
France Italy
0.1
Benelux Portugal
3.1
Supra Nordic
countries
Canada CEE
4.9
3.7
3.1
0.5 0.5 0.3 0.3 0.2 0.2 0.2 0.1 0.2 0.2 0.1 0.1 0.1 0.1 0.1 0.1 0.1
31/12/2019 / Total: € 14.3 bn
31/03/2020 / Total: € 13.5 bn

Ratings
Ratings unchanged – S&P Unsecured ratings and outlook recently affirmed
Bank ratings S&P
Long-term A-
Outlook/Trend Negative
Short-term A-2
Stand-alone rating1 bbb
Long Term Debt Ratings
“Preferred” senior unsecured Debt2 A-
“Non-preferred” senior unsecured
Debt3 BBB-
Subordinated Debt BB+
Pfandbrief ratings Moody’s
Public Sector Pfandbrief Aa1
Mortgage Pfandbrief Aa1
Disclaimer:
The rating information published in this presentation and on our web site are a service for our investors. The
information does not necessarily represent the opinion of Deutsche Pfandbriefbank AG. Ratings should not
serve as a substitute for individual analysis. The information provided should not be seen as a recommendation
to buy, hold or sell securities. Deutsche Pfandbriefbank AG does not assume any liability, including for the
completeness, timeliness, accuracy and selection of such information, or for any potential damages which may
occur in connection with this information.
The rating agencies may alter or withdraw their ratings at any time. The rating of an individual security issued by
Deutsche Pfandbriefbank AG may differ from the ratings shown above or an individual security might not be
rated at all. For the evaluation and usage of the rating information (including the rating reports), please refer to
the respective rating agencies’ pertinent criteria and explanations, terms of use, copyrights and disclaimers,
which are to be considered.
Note: The above list does not include all ratings 1 Stand-alone credit profile 2 "Senior Unsecured Debt" 3 "Senior Subordinated Debt"
Ratings Q1/2020
In the context of the COVID-19 pandemic, rating agencies
have been extensively reviewing rating parameters on
sectorial and individual basis resulting in numerous rating
actions on inter alia banks varying from outlook revisions,
assignment of rating watches, downgrades to rating
affirmations
S&P: pbb’s unsecured ratings and outlook unchanged since
03/17 and last affirmed on 23rd April 2020 as part of a
COVID-19 related sector review of German banks
Negative outlook inter alia reflects the negative trend of
Germany’s S&P BICRA score already since 09/19
Moody’s: pbb’s Pfandbrief ratings unchanged since 11/15
– currently no COVID-19 impact on OC requirements
Potential COVID-19 related rating changes or changes to
OC requirements inter alia contingent on further
development of economic environment and the rating
agencies’ assessment thereof
Investor Update based on results Q1/20 (IFRS, pbb Group, unaudited), May 2020 30