Embed Size (px)
Citation preview

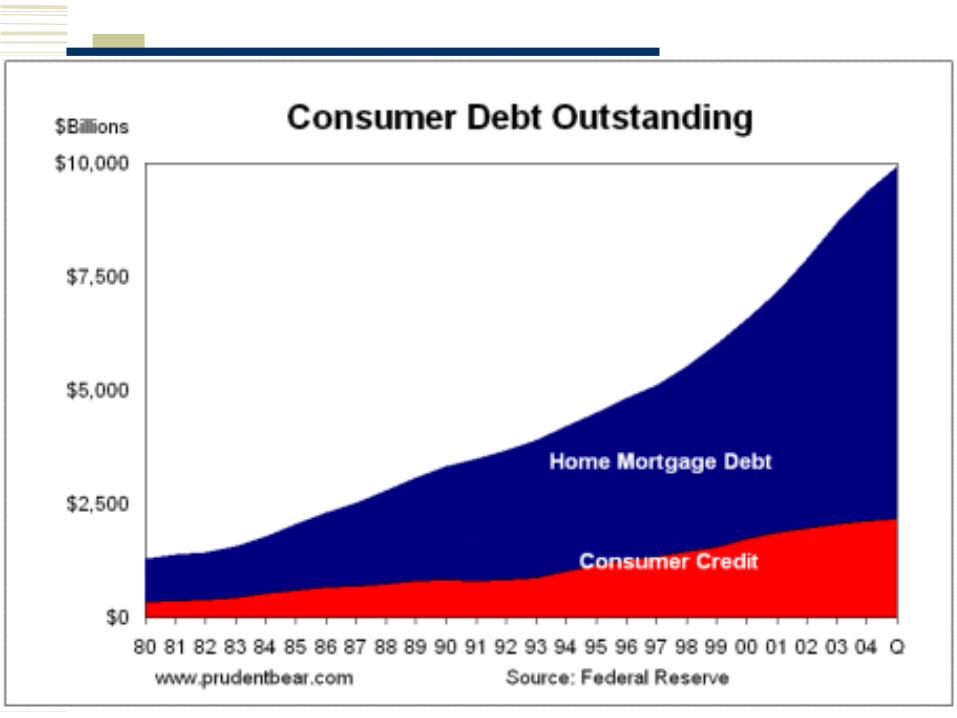
Debt
Business Ethics

Debt At All Levels
Low-income Pay-day loans Predatory lending
Wealthiest fifth Highest ratio of debt to disposable income
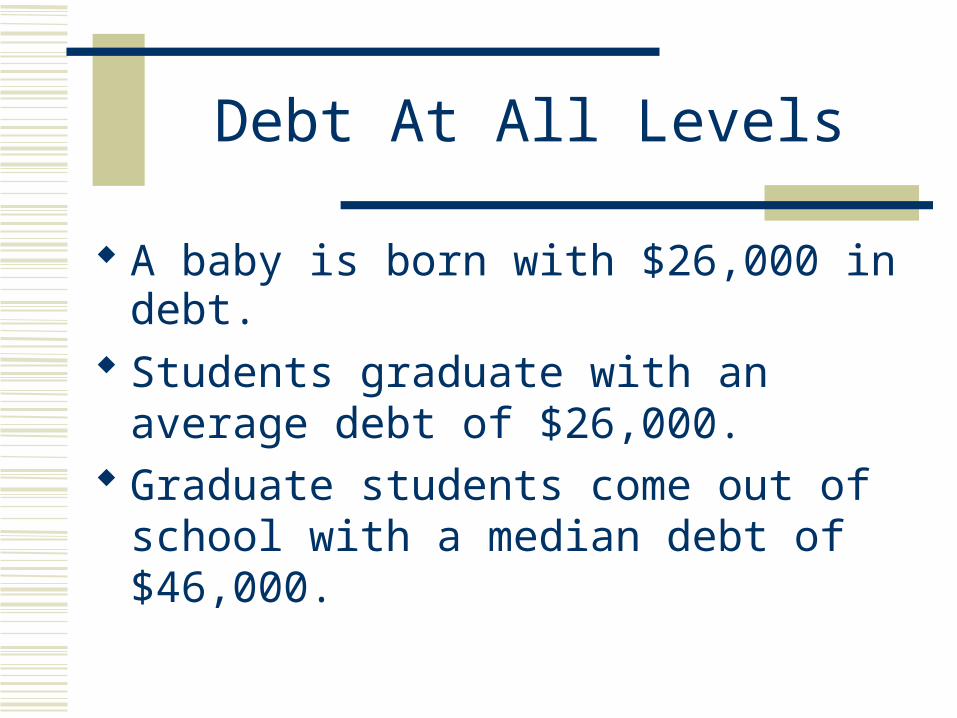
Debt At All Levels
A baby is born with $26,000 in debt. Students graduate with an average debt of
$26,000. Graduate students come out of school with a
median debt of $46,000.

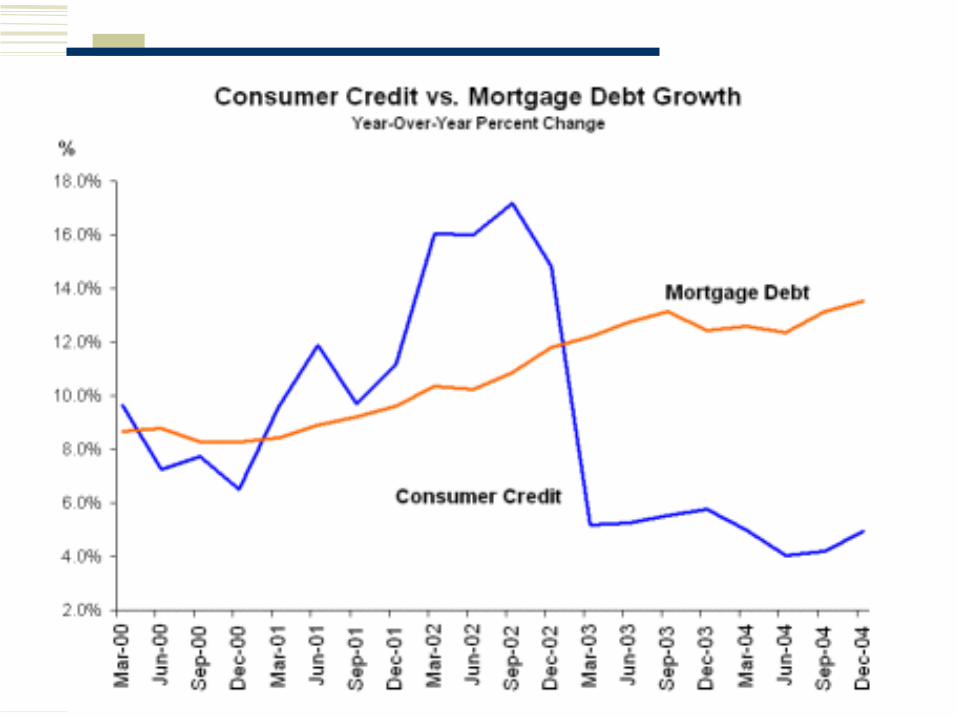
The credit surge, another view
Total Credit Market Debt Outstanding1985 - 2004 ($Billions)
7,000
12,000
17,000
22,000
27,000
32,000
37,000
85 86 87 88 89 90 91 92 93 94 95 96 97 98 99 00 01 02 03 04
Source: Federal Reserve Z-1

And another view
Total Debt Outstanding to GDP1964 - 2004
1.30
1.40
1.50
1.60
1.70
1.80
1.90
2.00
2.10
64 66 68 70 72 74 76 78 80 82 84 86 88 90 92 94 96 98 00 02 04
www.prudentbear.com Source: BEA, Federal Reserve Z-1

Household Debt as % of GDP
40%
45%
50%
55%
60%
65%
70%
75%
80%
85%
70 72 74 76 78 80 82 84 86 88 90 92 94 96 98 00 02 04*
*Q3 2004 debt, 2004 GDP Source: Federal Reserve Z-1, Bureau of Economic Analysis
And balance sheets bear the burden of excess

Credit fueled our recent mania$ Billions of private nonfinancial borrowing & borrowing to change in GDP (left scale)
$0.00
$0.50
$1.00
$1.50
$2.00
$2.50
$3.00
$3.50
$4.00
66 68 70 72 74 76 78 80 82 84 86 88 90 92 94 96 98 00 02 04
Source: Fed's Z-1, Bureau of Economic Analysis
0
200
400
600
800
1000
1200
1400
1600
1800$ Bill
Borrowing/change in GDP: More and more borrowing required for a dollar of GDP growth
Non-federal Borrowing

Credit flooded the corporate sector in the late ’90s, supplying financing to too many marginal companies and credit excess capacity, particularly in telecom.
When credit growth slowed in these sectors, the Federal Reserve tried to buoy the economy by easing monetary and credit conditions further. The result was a middling economy and a bubble in the home mortgage sector. For the first time in memory , rather than retrenching, consumers took on more debt during the recession.
Credit fueled our recent mania

Business Sector BorrowingQuarterly borrowings at annual rate, Q1 '70 - Q4 '04
-50
50
150
250
350
450
550
650
750
850
Mar-70
Sep-72
Mar-75
Sep-77
Mar-80
Sep-82
Mar-85
Sep-87
Mar-90
Sep-92
Mar-95
Sep-97
Mar-00
Sep-02
Source: Federal Reserve
Telecom helped business borrowings explode in the late ’90s


How much debt is there?
The average American household is
sitting on $7,200 of credit card debt.
All told, Americans owe $800 billion on credit cards, more than double the amount of just ten years ago.

Credit cards
Much of recent debt has been taken on by lower-income and lower-middle-income families.
They have borrowed aggressively to maintain their standard of living.

Credit Cards
Increased bankruptcy rates.
Slower economic growth 2/3 of the economy comes from consumer spending.

How much debt is there?
Americans owe another $1.3 TRILLION in installment debt — on cars, appliances and personal loans.
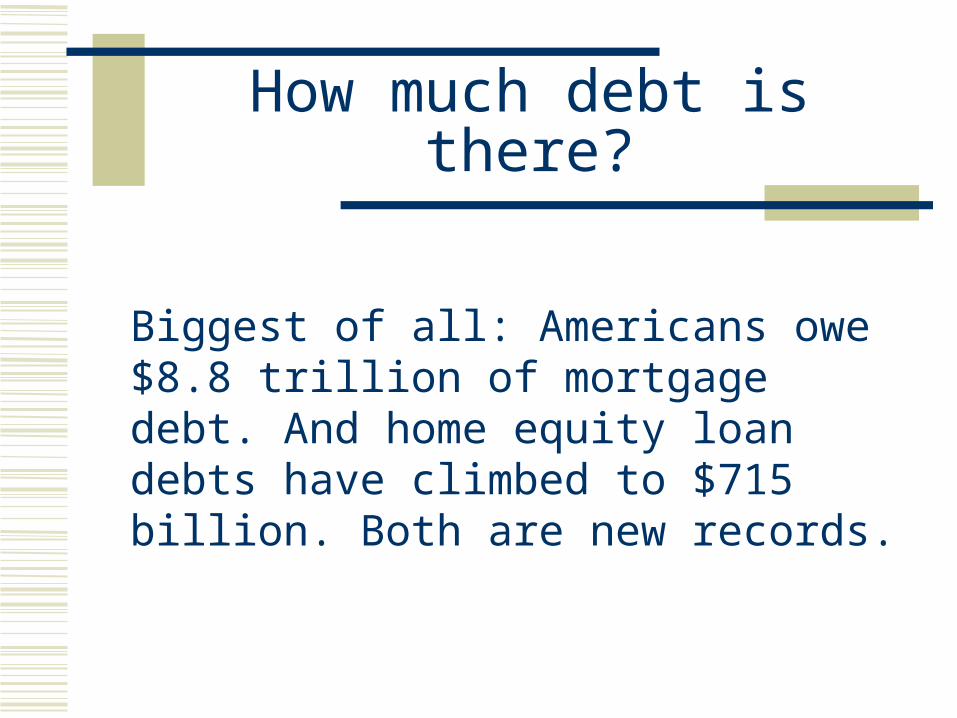
How much debt is there?
Biggest of all: Americans owe $8.8 trillion of mortgage debt. And home equity loan debts have climbed to $715 billion. Both are new records.
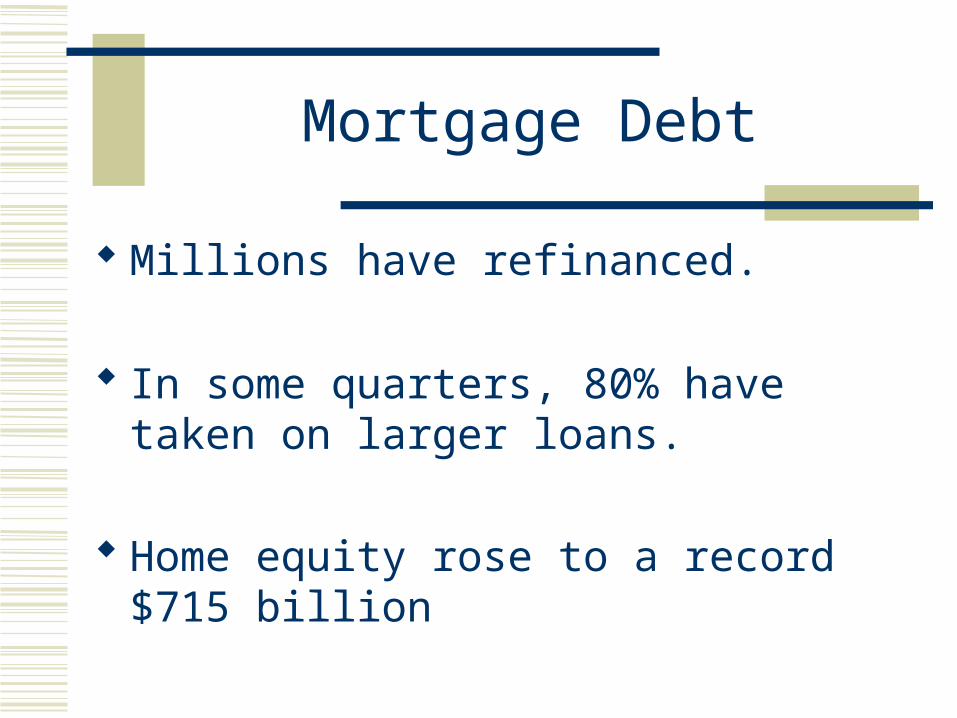
Mortgage Debt
Millions have refinanced.
In some quarters, 80% have taken on larger loans.
Home equity rose to a record $715 billion

When business borrowing collapsed, the mortgage sector more than made up for it
Mortgage & Business Sector BorrowingQuarterly borrowings at annual rate, Q1 '70 - Q4 '04
0
200
400
600
800
1000
1200
1400
1600
Mar-70
Sep-72
Mar-75
Sep-77
Mar-80
Sep-82
Mar-85
Sep-87
Mar-90
Sep-92
Mar-95
Sep-97
Mar-00
Sep-02
Source: Federal Reserve
$Billions
Business Sector Borrowing
Household Mortgage Borrowing

More lending = more spendingCash out volume for prime conventional loans ($bill.)
$0
$20
$40
$60
$80
$100
$120
$140
$160
1993 1994 1995 1996 1997 1998 1999 2000 2001 2002 2003 2004(e)
2005(e)
Source: Freddie Mac
Cash-out refis were key to the surprising strength in consumer spending
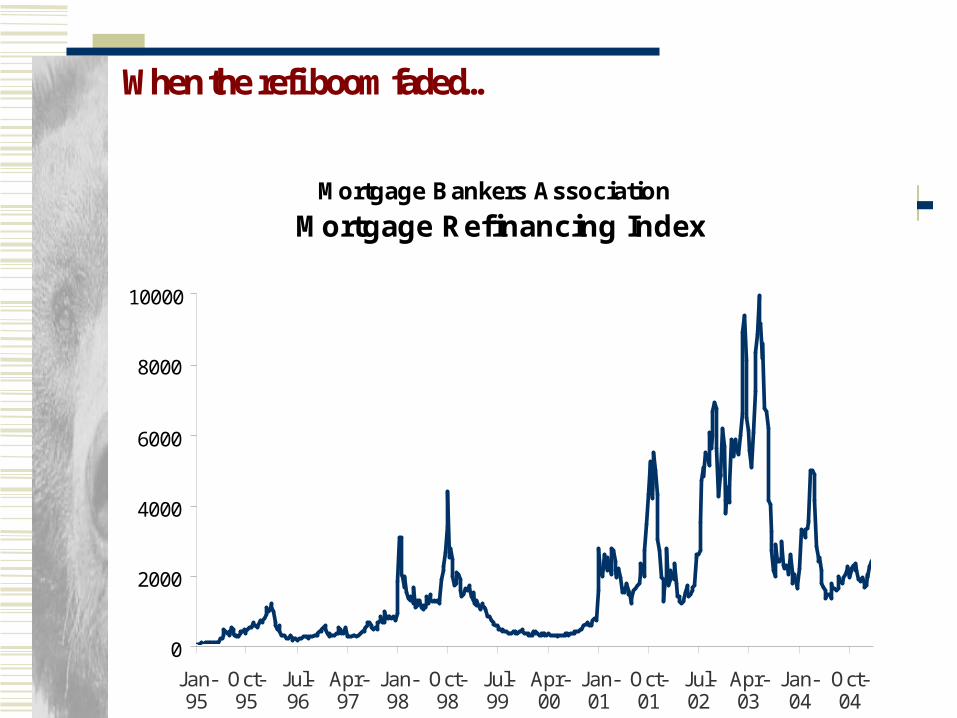
When the refi boom faded…
Mortgage Bankers Association
Mortgage Refinancing Index
0
2000
4000
6000
8000
10000
Jan-95
Oct-95
Jul-96
Apr-97
Jan-98
Oct-98
Jul-99
Apr-00
Jan-01
Oct-01
Jul-02
Apr-03
Jan-04
Oct-04

… home equity lending surged
Home Equity Borrowing
0
50
100
150
200
250
98 99 00 01 02 03 04
* Annualized Source: Federal Reserve, Z-1

…enabling the mortgage finance bubble to keep going
Total Mortgage Borrowing
0.00
100.00
200.00
300.00
400.00
500.00
600.00
700.00
800.00
98 99 00 01 02 03 04
All Other
Home Equity Borrowing
Source: Federal Reserve, Z-1
$ Billions

Despite credit-induced ‘wealth creation’ consumers are more leveraged to housing than ever
Home Equity as Percent of Home Market Value1965 - Q3 2004
50
55
60
65
70
75
65 67 69 71 73 75 77 79 81 83 85 87 89 91 93 95 97 99 01 03
Source: Fed's Z-1
%


Mortgage Debt
Less available for retirement or emergencies.
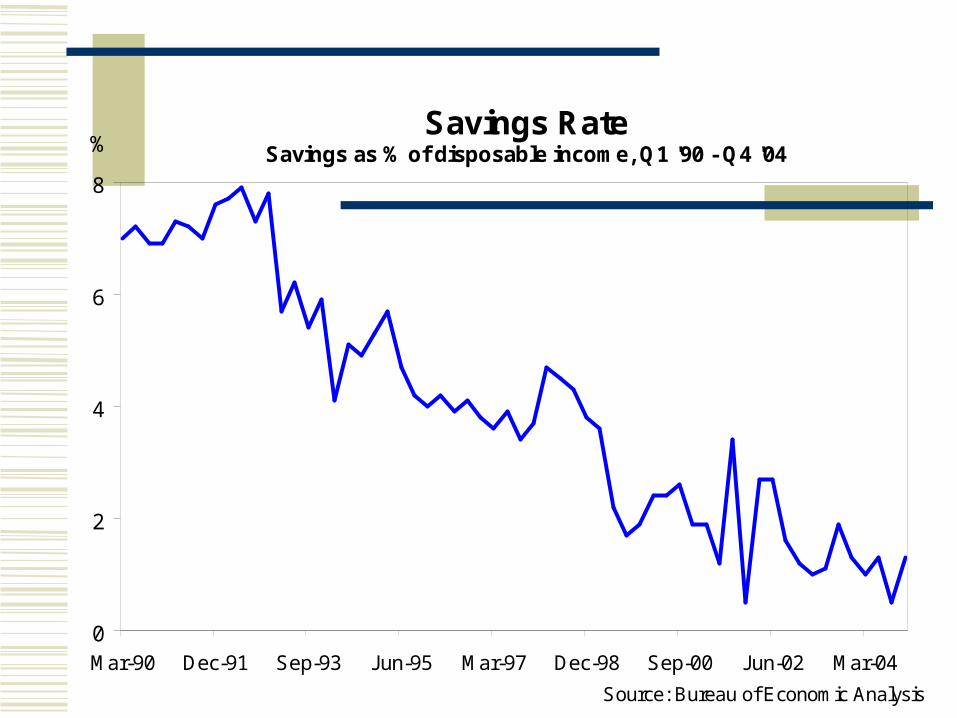
Savings RateSavings as % of disposable income, Q1 '90 - Q4 '04
0
2
4
6
8
Mar-90 Dec-91 Sep-93 Jun-95 Mar-97 Dec-98 Sep-00 Jun-02 Mar-04
Source: Bureau of Economic Analysis
%
Mortgage Debt
Housing bubble

New & Existing Home Sales1969 - 2004
1.00
2.00
3.00
4.00
5.00
6.00
7.00
8.00
69 71 73 75 77 79 81 83 85 87 89 91 93 95 97 99 01 03 Source: Nat'l Assoc. of Realtors
Millions of Units
Bubble!
The physical evidence of the bubble is obvious

For another view of the mortgage bubble, consider the dollars involved
Transaction Value of New & Existing Home Sales ($billions, thru Jan. '05)
200
400
600
800
1000
1200
1400
1600
1800
2000
Jan-90 Oct-91 Jul-93 Apr-95 Jan-97 Oct-98 Jul-00 Apr-02 Jan-04
Source data: National Assoc. of Realtors, Census Bureau
New Homes SalesExisting Home Sales
Annualized new + existing home sales x mean sales price

Business Debt
S&P analysts are reporting a record 618 corporations poised for debt downgrade
considerationOnly 318 are positioned for possible upgrade. The number of firms and dollars in or nearing below investment grade status looks to be at, or
approaching, record levels these days. (October 18, 2005)

Foreign Debt
America’s trade deficit continues to increase.
It has risen to $650 billion.


International Debt
JP Morgan Chase estimates that government bond supply will be $2,320 billion, up 2/3 from 2001.

Loose Lending Practices
Innovative alternative financing No-down-payment loans Interest-only mortgages Optional-payment mortgages Adjustable-rate mortgages

Meanwhile, the mortgage bubble squeezes consumer income
Fed's Financial Obligation Ratio - HomeownersMarch '80 - Sept. '04
13
14
15
16
17
Mar-80
May-82
Jul-84
Sep-86
Nov-88
Jan-91
Mar-93
May-95
Jul-97
Sep-99
Nov-01
Jan-04
Includes consumer and mortgage debt. Source: Federal Reserve
Refi booms: a help, not a cure
Fed's estimate of debt service to disposable income

Consequences
Bankruptcy filings increased 320% between 1980 and 2004.
40% of S&P profits are related to financing. Debt is left for future generations.

Consequences
The economic rebound since 2001 is not self-sustaining.
Lack of growth in Capital investment Employment, wage, and salary income

Consequences
Budget deficits no longer stimulate, but become a drag on the economy.
Eventually, taxes will be higher.

The Future
Rising interest rates could lead to an economic disaster.
Yet, not restraining debt will justr make the problem worse.