Embed Size (px)
Citation preview

Nov. 2007 Failure Confinement Slide 1
Fault-Tolerant ComputingDealing with High-Level Impairments

Nov. 2007 Failure Confinement Slide 2
About This Presentation
Edition Released Revised Revised
First Nov. 2006 Nov. 2007
This presentation has been prepared for the graduate course ECE 257A (Fault-Tolerant Computing) by Behrooz Parhami, Professor of Electrical and Computer Engineering at University of California, Santa Barbara. The material contained herein can be used freely in classroom teaching or any other educational setting. Unauthorized uses are prohibited. © Behrooz Parhami

Nov. 2007 Failure Confinement Slide 3
Failure Confinement

Nov. 2007 Failure Confinement Slide 4

Nov. 2007 Failure Confinement Slide 5
Multilevel Model of Dependable Computing
Component Logic Service ResultInformation SystemLevel →
Low-Level Impaired Mid-Level Impaired High-Level ImpairedUnimpaired
EntryLegend: Deviation Remedy Tolerance
Idea
l
Def
ectiv
e
Faul
ty
Err
oneo
us
Mal
func
tioni
ng
Deg
rade
d
Faile
d

Nov. 2007 Failure Confinement Slide 6
Failure Is Not the Same as Disaster• Computers are components in larger technical or societal systems• Failure detection and manual back-up system can prevent disaster
Used routinely in safety-critical systems:Manual control/override in jetlinersGround-based control for spacecraftManual bypass in nuclear reactors
Faile
d
Not just for safety-critical systems:Amtrak lost ticketing capability on Friday, Nov. 30, 1996, (Thanksgiving weekend) due to a communication system failure and had no up-to-date fare information in train stations to issue tickets manually
Manual back-up and bypass systems provide a buffer between the failed state and potential disaster
Manual system infeasible for e-commerce sites

Nov. 2007 Failure Confinement Slide 7
Importance of Experimental Failure Data• Indicate where effort is most needed• Help with verification of analytic models
System outage stats (%)* Hardware Software Operations EnvironmentBellcore [Ali86] 26 30 44 --Tandem [Gray87] 22 49 15 14Northern Telecom 19 19 33 28Japanese Commercial 36 40 11 13Mainframe users 47 21 16 16Overall average 30 32 24 14*Excluding scheduled maintenance
Tandem unscheduled outagesPower 53%Communication lines 22%Application software 10%File system 10%Hardware 5%
Tandem outages due to hardwareDisk storage 49%Communications 24%Processors 18%Wiring 9%Spare units 1%
Nov. 2007 Failure Confinement Slide 8
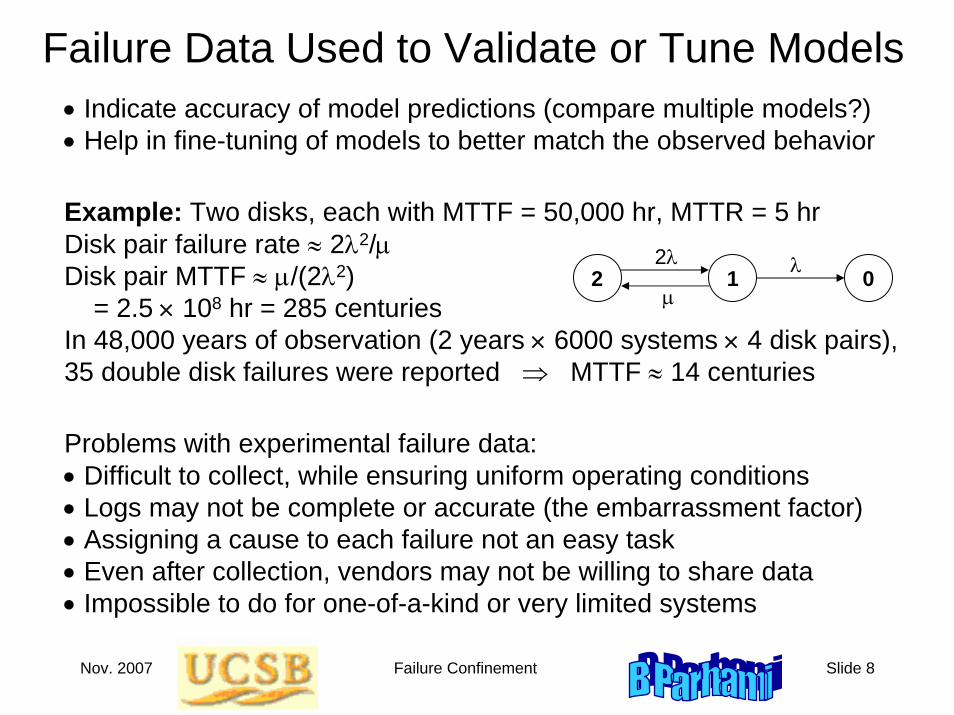
Failure Data Used to Validate or Tune Models
Example: Two disks, each with MTTF = 50,000 hr, MTTR = 5 hrDisk pair failure rate ≈ 2λ2/μDisk pair MTTF ≈ μ/(2λ2)
= 2.5 × 10⁸ hr = 285 centuriesIn 48,000 years of observation (2 years × 6000 systems × 4 disk pairs), 35 double disk failures were reported ⇒ MTTF ≈ 14 centuries
2 1 02λ λμ
• Indicate accuracy of model predictions (compare multiple models?)• Help in fine-tuning of models to better match the observed behavior
Problems with experimental failure data:• Difficult to collect, while ensuring uniform operating conditions• Logs may not be complete or accurate (the embarrassment factor)• Assigning a cause to each failure not an easy task• Even after collection, vendors may not be willing to share data• Impossible to do for one-of-a-kind or very limited systems
Nov. 2007 Failure Confinement Slide 9
Failure Data RepositoriesLANL data, collected 1996-2005: SMPs, Clusters, NUMAshttp://institutes.lanl.gov/data/fdata/From the site’s FAQs: “A failure record contains the time when the failure started (start time), the time when it was resolved (end time), the system and node affected, the type of workload running on the node and the root cause.”
Storage failure data: “Disk Failures in the Real World: What does an MTTF of 1,000,000 hours mean to you?” (Schroeder & Gibson, CMU)http://www.cs.cmu.edu/~bianca/fast07.pdfFrom the abstract: “. . . field replacement is a fairly different process than one might predict based on datasheet MTTF. We also find evidence [of] a significant early onset of wear-out degradation.”
Software Forensics Centre failure data, Middlesex Universityhttp://www.cs.mdx.ac.uk/research/SFC/From the website: “The repository of failures is the largest of its kind in the world and has specific details of well over 300 projects (with links to another 2,000 cases).”

Nov. 2007 Failure Confinement Slide 10
Preparing for Failure• Minimum requirement: accurate estimation of failure probability• Putting in place procedures for dealing with failures when they occur
Failure probability = UnreliabilityReliability models are by nature pessimistic (provide lower bounds)However, we do not want them to be too pessimistic
Risk = Frequency × MagnitudeConsequence / Unit time Events / Unit time Consequence / Event
Frequency may be equated with unreliability or failure probabilityMagnitude is estimated via economic analysis (next slide)
Failure handling is often the most neglected part of the processAn important beginning: clean, unambiguous messages to operator/userListing the options and urgency of various actions is a good ideaTwo way system-user communication (adding user feedback) helpfulQuality of failure handling affects the “Magnitude” term in risk equation

Nov. 2007 Failure Confinement Slide 11
How Much Is Your Life Worth to You?Thought experiment:You are told that you have a 1/10,000 chance of dying todayHow much would you be willing to pay to buy out this risk, assuming that you’re not limited by current assets (can use future earnings too)?
If your answer is $1000, then your life is worth $10M to you
Risk = Frequency × MagnitudeConsequence / Unit time Events / Unit time Consequence / Event
Can visualize the risk by imagining that 10,000 people in a stadium are told that one will be killed unless they collectively pay a certain sum
Consciously made tradeoffs in the face of well-understood risks (salary demanded for certain types of work, willingness to buy smoke detector) has been used to quantify the worth of a “statistical human life”

Nov. 2007 Failure Confinement Slide 12
Very Small Probabilities: The Human FactorInterpretation of data, understanding of probabilities, acceptance of risk
Risk of death / person / yearInfluenza 1/5KStruck by auto 1/20KTornado (US MW) 1/455KEarthquake (CA) 1/588KNuclear power plant 1/10MMeteorite 1/100B
Factors that increase risk of death by 1/106 (deemed acceptable risk)Smoking 1.4 cigarettesDrinking 0.5 liter of wineBiking 10 milesDriving 300 milesFlying 1000 milesTaking a chest X-rayEating 100 steaks
US causes of death / 106 personsAuto accident 210Work accident 150Homicide 93Fall 74Drowning 37Fire 30Poisoning 17Civil aviation 0.8Tornado 0.4Bite / sting 0.2
Risk underestimation factors:Familiarity, being part of our job, remoteness in time or space Risk overestimation factors:Scale (1000s killed), proximity

Nov. 2007 Failure Confinement Slide 13
Believability and Helpfulness of Failure Warning“No warning system will function effectively if its messages, however logically arrived at, are ignored, disbelieved, or lead to inappropriate actions.” Foster, H.D., “Disaster Warning Systems,” 1987
Unhelpful failure warnings:Autos – “Check engine”Computer systems – “Fatal error”
Unbelievable failure warnings:Failure event after numerous false alarmsReal failure occurring in the proximity of a scheduled test runUsers or operators inadequately trained (May 1960 Tsunami in Hilo,
Hawaii, killed 61, despite 10-hour advance warning via sirens)

Nov. 2007 Failure Confinement Slide 14
Engineering EthicsRisks must be evaluated thoroughly and truthfully
IEEE Code of Ethics: As IEEE members, we agree to1. accept responsibility in making decisions consistent with the safety,
health and welfare of the public, and to disclose promptly factors that might endanger the public or the environment
6. maintain and improve our technical competence and to undertake technological tasks for others only if qualified by training or experience, or after full disclosure of pertinent limitations;
7. seek, accept, and offer honest criticism of technical work, to acknowledge and correct errors, and to credit properly the contributions of others
ACM Code of Ethics: Computing professionals mustminimize malfunctions by following generally accepted standards for system design and testinggive comprehensive and thorough evaluations of computer systems and their impacts, including analysis of possible risks

Nov. 2007 Failure Confinement Slide 15
Speed of Failure Detection
In many cases dealing with mechanical elements, such as wing flaps, reaction time of 10s/100s of milliseconds is adequate (reason: inertia)
Prompt failure detection is a prerequisite to failure confinement
In some ways, catastrophic failures that are readily identified may be better than subtle failures that escape detection
Failure detection latency can be made negative via “failure prediction”(e.g., in a storage server, increased error rate signals impending failure)
Example: For redundant disks with two-way mirroring, detection latency was found to have a significant effect on the probability of data lossSee: http://hpdc13.cs.ucsb.edu/papers/34.pdf
Redundancygroup sizes
Nov. 2007 Failure Confinement Slide 16
Fail-Safe SystemsFail-safe: Produces one of a predetermined set of safe outputs when it fails as a result of “undesirable events” that it cannot tolerate
Fail-safe traffic light: Will remain stuck on red
Fail-safe gas range/furnace pilot: Cooling off of the pilot assembly due to the flame going out will shut off the gas intake valve
A fail-safe digital system must have at least two binary output lines, together representing the normal outputs and the safe failure conditionReason: If we have a single output line, then even if one value (say, 0) is inherently safe, the output stuck at the other value would be unsafeTwo-rail encoding is a possible choice: 0: 01, 1: 10, F: 00, 11, or both
Totally fail-safe: Only safe erroneous outputs are produced, provided another failure does not occur before detection of the current oneUltimate fail-safe: Only safe erroneous output is produced, forever

Nov. 2007 Failure Confinement Slide 17
Fail-Safe System Specification
Is the specification above consistent and complete?
Correct output
Safe outputs
Unsafe outputs
Input
Input space
Output spaceAmusement park train safety system
Signal sB when asserted indicates that the train is at beginning of its track (can move forward, but should not be allowed to go back)
Signal sE when asserted indicates that the train is at end of its track (can go back, but should not move forward)
No, because it does not say what happens if sB = sE = 1; this would not occur under normal conditions, but because such sensors are often designed to fail in the safe mode, the combination is not impossible
Why is this a problem, though? (Train simply cannot be moved at all)
Completeness will prevent potential implementation or safety problems

Nov. 2007 Failure Confinement Slide 18
Fail-Safe 2-out-of-4 Code CheckerInput: 4 bits abcd, exactly 2 of which must be 1s
Output: fg = 01 or 10, if the input is valid 00 safe erroneous output 11 unsafe erroneous output
Output will become permanently 00 upon the first unsafe condition
Preset
ba
dc
ba
dc
f
g
S
R
Q
Q
Codewordsa b c d0 0 1 10 1 0 10 1 1 01 0 0 11 0 1 01 1 0 0

Nov. 2007 Failure Confinement Slide 19
Fail-Safe State Machines
Possible design methodology:Use Berger code for states, avoiding the all 0s state with all-1s check, and vice versaImplement next-state logic equations in sum-of-products form for the main state bits and in product-of-sums form for the check state bitsThe resulting state machine will be fail-safe under unidirectional errors
Use an error code to encode statesImplement the next-state logic so that the machine is forced to an error state when something goes wrong
InputState x=0 x=1A E BB C DC A DD E DE A D
State EncodingA 001 10B 010 10C 011 01D 100 10E 101 01
Hardware overhead for n-state machine consists of O(log log n) additional state bits and associated next-state logic, and a Berger code checker connected to state FFs

Nov. 2007 Failure Confinement Slide 20
Principles of Safety EngineeringPrinciples for designing a safe system (J. Goldberg, 1987)
1. Use barriers and interlocks to constrain access to critical system resources or states
2. Perform critical actions incrementally, rather than in a single step
3. Dynamically modify system goals to avoid or mitigate damages
4. Manage the resources needed to deal with a safety crisis, so that enough will be available in an emergency
5. Exercise all critical functions and safety features regularlyto assess and maintain their viability
6. Design the operator interface to provide the information and power needed to deal with exceptions
7. Defend the system against malicious attacks

Nov. 2007 Failure Confinement Slide 21
Recovery from FailuresThe recovery block scheme (originally developed for software)
ensure acceptance testby primary moduleelse by first alternate...
else by last alternateelse fail
Computer system with manual backup may be viewed as a one-alternate recovery block scheme, with human judgment constituting the acceptance test
Instead of resorting to an alternate (hardware/software) module,one may reuse the primary oneThis scheme is known as “retry” or time redundancy and is particularly effective for dealing with transient or soft failures
e.g., sorted liste.g., quicksorte.g., bubblesort...
e.g., insertion sort

Nov. 2007 Failure Confinement Slide 22
Fail-Stop and Failover StrategiesFail-stop systems: Systems designed and built in such a way that they cease to respond or take any action upon internal malfunction detectionSuch systems do not confuse the users or other parts of a distributed system by behaving randomly or, worse, maliciously upon failureA subclass of fail-safe systems (here, stopping is deemed a safe output)
Failover: Upon failure detection, often of the fail-stop kind, requests and other tasks are redirected to a back-up system
Example – Failover on long-running connections for streaming media: all that is needed is to know the file being streamed, and current location within the file, to successfully switch over to a different server
Failover software is available for Web servers as part of firewalls for most popular operating systemsIt monitors resources and directs requests to a functioning serverFailover features of Windows XP: http://msdn2.microsoft.com/en-us/library/ms686091.aspx


![Drunk User Interfaces: Determining Blood Alcohol Level ... · the effects of situational impairments within them [50]. These works and others view situational impairments as problems](https://img.dokumen.tips/doc/110x75/5f6a452dedce2f1c1321aad1/drunk-user-interfaces-determining-blood-alcohol-level-the-effects-of-situational.jpg)