Embed Size (px)
Citation preview

DEALERS’ VIEW OF WARRANTY: SGS GLOBAL WARRANTY SATISFACTION SURVEY RESULTS FOR BRAZIL
WARRANTY ADMINISTRATION SYSTEMS SERVE TO IMPROVE AFTER SALES PROCESSES AND BUILD LONG-TERM CUSTOMER LOYALTY
MAY 2014
AUTHOR
Roland Gagel
Global Automotive Sector Manager, SGS

1
The Brazil Dealer Warranty Survey 2014 is part of the first ever global warranty satisfaction survey of automotive dealers. It has intensively researched the business areas of sales, aftersales and warranty from interviews with 300 dealers in Brazil representing 15 OEMs. The results enable those responsible for warranties at vehicle manufacturers to understand their brand’s position compared to the competition. It gives
a clear benchmark for the warranty controlling processes of hotlines, field force and audits. The survey, conducted between January and March 2014 indicates overall satisfaction with the ease of warranty handling, goodwill policies and extended warranty programmes with findings based on high-level analysis that lends support to the conclusions of this paper.
I. EXECUTIVE SUMMARY
CONTENTSI. EXECUTIVE SUMMARY 1
II. THE ROLE OF WARRANTY ADMINISTRATION FOR DEALER AND CUSTOMER SATISFACTION 2
III. SCOPE OF THE STUDY 3
IV. RESULTS IN DETAIL 5
V. MAIN FINDINGS 20
VI. CONCLUSIONS 21

2
The goal was to evaluate franchised dealers’ satisfaction of the key tools for modern warranty management, which are supplied to them by vehicle manufacturers. Original Equipment Manufacturers (OEMs) provide support and controls for their dealers when repairing vehicles during the new vehicle warranty period, and the following period under goodwill policy schemes.
The focus of the study was the overall processes and dealer perception of the warranty management system which was evaluated in four main areas:
• Ease of conducting business
• Warranty control mechanisms
• Policy and extended warranty
• Satisfaction with the payment terms
• Support of customer loyalty and the competitive position
In particular, warranty management that involves OEM personnel and their service providers, each of whom plays a vital role in the cost structure of an OEM, was researched. When looking at the cost levels of call centres, field force and auditors, an OEM has to carefully evaluate if their deployed resources contribute to warranty cost control and to dealer and customer satisfaction or whether they are counterproductive.
One underlying assumption of the study is that inefficient warranty processes that dissatisfy dealers also create dissatisfaction with customers. Therefore, the survey also asks for verbatims regarding potential improvement areas of the warranty operations from the dealers’ viewpoint. Questions include the warranty IT system and evaluate the effective support of the customer loyalty by the OEMs’ warranty programme.
II. THE ROLE OF WARRANTY ADMINISTRATION FOR DEALER AND CUSTOMER SATISFACTION
SATISFIED DEALERS WILL LEAD TO LOYAL CUSTOMERS.

3
SCOPE AND PARAMETERS
The study was conducted on behalf of SGS between January and March 2014 by an independent and well recognised market research company based in Brazil. Dealer data was retrieved from the internet and the method used was Computer Assisted Telephone Interviews (CATI). The preferred role of the interviewed person was warranty administrator, service manager or service advisor (i.e. those people in a dealership that work daily on warranty related matters).
Countries within the scope
• Brazil
Brands within the scope and grouping of OEMs
The survey included 15 brands within the scope. The grouping was done in order to enable publication of the study to a wide audience. The study results with detailed brand information are not published and will only be made available to interested parties under non-disclosure agreements.
Premium
• Audi
• BMW
• Mercedes Benz
French
• Citroen
• Peugeot
• Renault
Volume
• Chevrolet
• Fiat
• Ford
• VW
JP/KO
• Honda
• Hyundai
• Kia
• Nissan
• Toyota
Size of the samples
Twenty dealers per brand were randomly selected from dealer address data files available on the internet. Multi-branded dealers were asked to answer the questions referring to their ‘main brand’, as identified by the dealer themselves.
SURVEY QUESTIONS
The goal of the study was to have easily understood questions that yielded comparable answers between dealers. No verbatim answers were recorded, only categorised answers to questions.
Brand background
Q1. What is your main brand?
Key questions (Satisfaction Index)
Q2. When you think about warranty and administration, how would you rate warranty processing with your OEM? (This question is later referred to as the index question.)
Q3. How has it developed over the past 5 years?
Warranty administration groups
Q4. Is there a warranty field force?
Q5. How satisfied are you with the warranty field force?
Q6. Is there a warranty hotline?
Q7. How satisfied are you with the warranty hotline?
Q8. How satisfied are you with the warranty audit?
Q9. How do you evaluate the OEM warranty audits of the major brands?
Q10. How happy are you with the warranty IT system of your OEM?
Goodwill policy and extended warranty products
Q11. How do you rate the administration of your main brand’s goodwill policy?
Q12. How do you rate the actual level of policy goodwill that is granted, for your OEM?
Q13. How do you rate the handling of the extended warranty products of your OEM?
Q14. How satisfied are you with the actual coverage of the extended warranty products your OEM offers?
III. SCOPE OF THE STUDY
4
Satisfaction with the payment terms
Q15. How satisfied are you with the warranty labour rate per hour?
Q16. How satisfied are you with the reimbursement for parts / handling charge?
Free text answers
Q17. What works very well with your OEM in warranty?
Q18. What does not work well with your OEM?
Q19. What should your OEM change to make warranty easier for you?
Effectiveness of warranty programmes
Q20. Do you think that the warranty processes and systems of your OEM overall support the customer loyalty in service and new vehicle sales?
Q21. Do you think that a warranty programme (e.g. extension, service contracts) can create an active competitive advantage for you as a dealer?
Sizing and qualification
Q22. What is the size of your dealership, by new vehicle sales per annum?
Q23. What is the size of your dealership, by service job cards per annum?
Q24. What is your position in the dealership’s organisation?
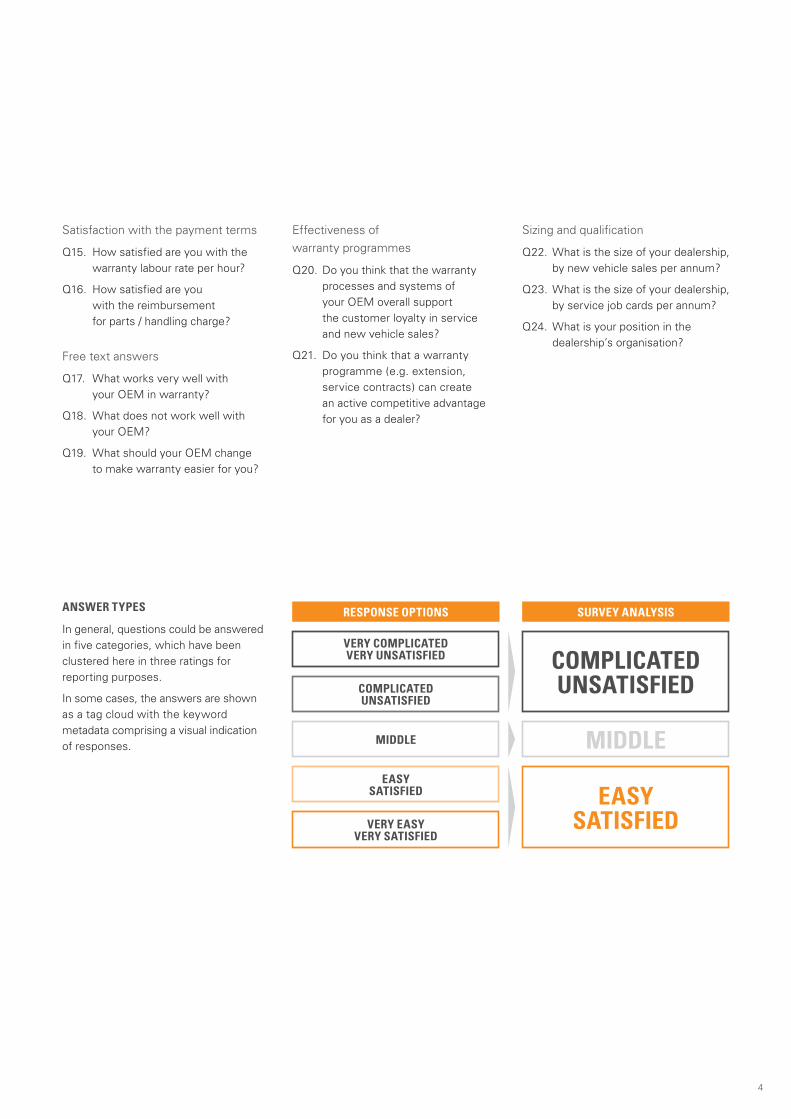
ANSWER TYPES
In general, questions could be answered in five categories, which have been clustered here in three ratings for reporting purposes.
In some cases, the answers are shown as a tag cloud with the keyword metadata comprising a visual indication of responses.
RESPONSE OPTIONS SURVEY ANALYSIS
COMPLICATED UNSATISFIED
MIDDLE
EASY SATISFIED
VERY COMPLICATEDVERY UNSATISFIED
COMPLICATEDUNSATISFIED
MIDDLE
EASYSATISFIED
VERY EASY VERY SATISFIED

5
Q2. WHEN YOU THINK ABOUT WARRANTY AND ADMINISTRATION, HOW WOULD YOU RATE WARRANTY PROCESSING WITH YOUR OEM?
Overall results
• 64% of dealers find warranty administration easy
• 10% of dealers rate warranty administration as complicated
• Premium rates easiest for warranty administration
• Volume rates the highest for unsatisfied dealers
Brand results
• Overall gap between brands 55%
• Only one brand rates 100% for ease of warranty administration
• Three brands have a high percentage of dealers finding warranty administration complicated
• Industry average 64% (only 5% below the industry average for Europe)
IV. RESULTS IN DETAIL
PREMIUM RATES HIGHEST FOR SATISFACTION IN WARRANTY ADMINISTRATION.
VOLUME HAS THE LARGEST PERCENTAGE OF UNSATISFIED DEALERS.
THREE BRANDS FIND WARRANTY ADMINISTRATION PARTICULARLY COMPLICATED.
100% SATISFACTION WITH THE EASE OF WARRANTY ADMINISTRATION IS POSSIBLE.
WARRANTY ADMINISTRATION FROM A DEALER POINT OF VIEW (%)
COMPLICATED MIDDLE EASY INDUSTRY AVERAGE
100
90
80
70
60
50
40
30
20
10
0Premium French Volume JP/KO
WARRANTY ADMINISTRATION FROM A DEALER POINT OF VIEW (%)
COMPLICATED MIDDLE EASY BEST AND WORST IN CLASS
100
90
80
70
60
50
40
30
20
10
0 Q L T H A R M Z * X S D C P W B
*Industry Average

6
STRONG OVERALL RATING – PREMIUM HIGHEST FOR SATISFACTION WITH FIELD FORCE (96%).
SIGNIFICANT GAP BETWEEN THE HIGHEST AND LOWEST SATISIFIED RATING.
Premium French Volume JP/KO
Q5. HOW SATISFIED ARE YOU WITH THE WARRANTY FIELD FORCE?
Overall results
• Premium rates highest for satisfaction with field force at 96%
• JP/KO lowest dealer satisfaction (75%) and highest unsatisfied dealers (3%)
• Industry average 84% (overall a fairly strong result and better than Europe’s industry average 78%)
FIELD FORCE SATISFACTION
UNSATISFIED MIDDLE SATISFIED INDUSTRY AVERAGE
100
90
80
70
60
50
40
30
20
10
0
Q7. HOW SATISFIED ARE YOU WITH THE WARRANTY HOTLINE?
Overall results
• Overall gap between groups 22% for warranty hotline satisfaction but 47% between individual OEMs
• Premium rates highest for satisfaction at 97%
• Volume lowest satisfaction rating (70%) and highest unsatisfied dealers (9%)
• One brand rates 100% for hotline satisfaction but three brands rate only just above 50% satisfaction
• Industry average 79%
HOTLINE SATISFACTION
UNSATISFIED MIDDLE SATISFIED INDUSTRY AVERAGE
100
90
80
70
60
50
40
30
20
10
0Premium French Volume JP/KO

7

8
Q9. HOW SATISFIED ARE YOU WITH THE WARRANTY AUDIT?
Overall results
• Premium and JP/KO above industry average satisfaction rating
• French and Volume similar rating for unsatisfied dealers (15% and 18% respectively)
• Industry average 84% (very high compared to Europe’s industry average 68%)
• Almost all dealers confirm that their OEM conducts a warranty audit (98%)
Brand results
• Four brands with 95% satisfaction ratings
• Brand B rates significantly low on satisfied (60%) and high on unsatisfied (15%) dealers
• Overall gap between brands 35%
AUDIT SATISFACTION
UNSATISFIED MIDDLE SATISFIED INDUSTRY AVERAGE
100
90
80
70
60
50
40
30
20
10
0
PREMIUM RATES HIGHEST FOR SATISFACTION IN WARRANTY AUDITS.
FOUR BRANDS WITH ALMOST 100% RATING FOR SATISFIED DEALERS.
AUDIT SATISFACTION
UNSATISFIED MIDDLE SATISFIED BEST AND WORST IN CLASS
100
90
80
70
60
50
40
30
20
10
0
*Industry Average
Premium French Volume JP/KO
Q L T H A R M Z * X S D C P W B

9
Q10. HOW SATISFIED ARE YOU WITH THE WARRANTY IT SYSTEM OF YOUR OEM?
Overall results
• Premium rates 93% for satisfaction with warranty IT systems
• French, Volume and JP/KO rate below the industry average for warranty IT satisfaction
• All groups have some unsatisfied dealers
• Industry average 81%
Brand results
• Two brands rate 95% for satisfaction with warranty IT systems
• Two brands with 10% of dealers unsatisfied
• Brand R rates overall lowest for satisfaction (65%) and highest for unsatisfied (10%) dealers
• Overall gap between brands 30%
WARRANTY IT SYSTEM IS NOT A MAJOR CONCERN FOR MOST BRANDS.
WARRANTY IT SYSTEM SATISFACTION
UNSATISFIED MIDDLE SATISFIED INDUSTRY AVERAGE
100
90
80
70
60
50
40
30
20
10
0
WARRANTY IT SYSTEM SATISFACTION
UNSATISFIED MIDDLE SATISFIED BEST AND WORST IN CLASS
100
90
80
70
60
50
40
30
20
10
0
*Industry Average
Premium French Volume JP/KO
Q L T H A R M Z * X S D C P W B

10
Q11. HOW DO YOU RATE THE ADMINISTRATION OF YOUR MAIN BRAND’S GOODWILL POLICY?
Overall results
• Premium rates highest for ease of policy and goodwill administration at 80%
• French and JP/KO rate low for ease (55% and 54%) and high for complicated (8% and 7%)
• Industry average 64% versus 72% in Europe
• Overall gap between individual brands 45% with highest brand satisfaction rating at 85%
FRENCH, JAPANESE AND KOREAN ALL HAVE ISSUES IN GOODWILL ADMINISTRATION.
POLICY AND GOODWILL ADMINISTRATION ASSESSMENT
COMPLICATED MIDDLE EASY INDUSTRY AVERAGE
100
90
80
70
60
50
40
30
20
10
0Premium French Volume JP/KO

11
Q12. HOW DO YOU RATE THE ACTUAL LEVEL OF GOODWILL POLICY THAT IS GIVEN BY YOUR MAIN BRAND?
Overall results
• Premium highest for satisfaction of goodwill policy levels at 88%
• French lowest for satisfaction at 63%
• Volume rates least number of unsatisfied dealers at 1%
• Industry average 74%
• Overall gap between individual brands 50% with highest brand satisfaction rating at 95%
LARGE DIFFERENCE IN GOODWILL POLICY SATISFACTION BETWEEN THE BEST AND WORST PERFORMING OEM GROUP.
POLICY AND GOODWILL LEVEL ASSESSMENT
UNSATISFIED MIDDLE SATISFIED INDUSTRY AVERAGE
100
90
80
70
60
50
40
30
20
10
0Premium French Volume JP/KO

12
Q15. HOW SATISFIED ARE YOU WITH THE WARRANTY LABOUR RATE PER HOUR?
Overall results
• Volume rates highest for satisfaction with labour rate at 69%
• Premium and JP/KO with lowest satisfaction ratings (58% and 57% respectively)
• Overall each OEM group has a significant number of unsatisfied dealers
Brand results
• Significant overall gap between brands at 50%
• 12 out of 15 brands are unsatisfied with labour rate, with one brand having 30% of dealers unsatisfied
• Industry average 59%
SIGNIFICANT LEVEL OF DISSATISFACTION WITH THE LABOUR RATE – REACHING AS HIGH AS 30%.
LABOUR RATE SATISFACTION
UNSATISFIED MIDDLE SATISFIED INDUSTRY AVERAGE
100
90
80
70
60
50
40
30
20
10
0
LABOUR RATE SATISFACTION
UNSATISFIED MIDDLE SATISFIED BEST AND WORST IN CLASS
100
90
80
70
60
50
40
30
20
10
0
*Industry Average
Premium French Volume JP/KO
R H W B A Q T D M * P L C Z X S

13
Q16. HOW SATISFIED ARE YOU WITH THE REIMBURSEMENT FOR PARTS / HANDLING CHARGE?
Overall results
• JP/KO rates lowest for satisfied (57%) and highest for unsatisfied (18%) dealers
• Volume rates highest again for satisfaction at 68%
• Industry average 61% (slightly above labour rate satisfaction)
Brand results
• Overall gap between brands 50%
• Brand S with greater number of unsatisfied (50%) than satisfied (30%) dealers
• Only three brands with no unsatisfied dealers
• Industry average 61%
SOME BRANDS HAVE SIGNIFICANT DISSATISFACTION WITH PARTS REIMBURSEMENT.
REIMBURSEMENT FOR PARTS / HANDLING CHARGE
UNSATISFIED MIDDLE SATISFIED INDUSTRY AVERAGE
100
90
80
70
60
50
40
30
20
10
0
REIMBURSEMENT FOR PARTS / HANDLING CHARGE
UNSATISFIED MIDDLE SATISFIED BEST AND WORST IN CLASS
100
90
80
70
60
50
40
30
20
10
0
*Industry Average
Premium French Volume JP/KO
R T B A L P W * Q H D M Z C X S

14

15
WHAT WORKS VERY WELL WITH YOUR OEM WARRANTIES?
WHAT DOES NOT WORK WELL WITH YOUR OEM WARRANTIES?
Q17. WHAT WORKS VERY WELL WITH YOUR OEM IN WARRANTY?
Overall results*
• Dealers like the ‘communication’ and ‘service’ provided by the OEM
• ‘System’ rates well
• ‘Warranty coverage’ mentioned 17 times – probably in line with recent increases in warranty coverage of some brands
Q18. WHAT DOES NOT WORK WELL WITH YOUR OEM?
Overall results*
• ‘Parts delivery’ highest mentioned issue for not working well by a significant margin (49 out of 300 dealers)
• ‘Communication’ is also mentioned as a key item that does not work well
• Vehicle ‘diagnosis’ appears to be an issue for some dealers
* The numbers indicate the frequency of mentioning by the dealers; multiple answers possible; results are keyword coded.
DEALERS COMPLAIN ABOUT THE PARTS DELIVERY PERFORMANCE, DIAGNOSIS AND WARRANTY COVERAGE OF THEIR OEM.
DEALERS APPRECIATE THE GOOD COMMUNICATION THEY HAVE WITH THEIR OEMS.

16
WHAT SHOULD YOUR OEM CHANGE TO MAKE WARRANTIES EASIER FOR YOU?Q19. WHAT SHOULD YOUR OEM CHANGE TO MAKE WARRANTY EASIER FOR YOU?
Overall results*
• Dealers want improvements in ‘parts delivery’ and for OEMs to ‘simplify’ processes
• ‘Authorisation’ and ‘approval processes’ are mentioned by dealers to be insufficient
• The ‘speed’ of decision and answers from OEMs is in line with the issue of ‘authorisation’
DEALERS WANT SIMPLER WARRANTY PROCESSES, RELIABLE PARTS DELIVERY, IMPROVED COMMUNICATION AND BETTER TRAINING.

17
Q20. DO YOU THINK THAT THE WARRANTY PROCESSES AND SYSTEMS OF YOUR OEM OVERALL SUPPORT THE CUSTOMER LOYALTY IN SERVICE AND NEW VEHICLE SALES?
Overall results
• French rates highest for agreement and above average at 92%
• Industry average 91%
Brand results
• Overall gap between brands 20%
• Four brands with 100% agreement, but more brands rate below industry average on agreement that warranty processes and systems support customer loyalty
• Industry average 90%
DEALERS CONVINCED THAT WARRANTY PROCESSES SUPPORT LOYALTY.
DO WARRANTY PROCESSES AND SYSTEMS SUPPORT CUSTOMER LOYALTY?
DISAGREE INDIFFERENT AGREE INDUSTRY AVERAGE
100
90
80
70
60
50
40
30
20
10
0
DO WARRANTY PROCESSES AND SYSTEMS SUPPORT CUSTOMER LOYALTY?
DISAGREE INDIFFERENT AGREE BEST AND WORST IN CLASS
100
90
80
70
60
50
40
30
20
10
0
*Industry Average
Premium French Volume JP/KO
X D H R T * Z W M C L Q B P A S

18
Q21. DO YOU THINK THAT A WARRANTY PROGRAMME (E.G. EXTENSION, SERVICE CONTRACTS) CAN CREATE AN ACTIVE COMPETITIVE ADVANTAGE FOR YOU AS A DEALER?
Overall results
• French brands rate lowest for agreement (87%) and highest for disagreement (7%) that warranty programmes create an active competitive advantage
• Industry average 92%
DEALERS AGREE ON COMPETITIVE ADVANTAGE.
DO WARRANTY PROGRAMMES CREATE AN ACTIVE COMPETITIVE ADVANTAGE?
DISAGREE INDIFFERENT AGREE INDUSTRY AVERAGE
100
90
80
70
60
50
40
30
20
10
0Premium French Volume JP/KO
DO WARRANTY PROGRAMMES CREATE AN ACTIVE COMPETITIVE ADVANTAGE?
DISAGREE INDIFFERENT AGREE BEST AND WORST IN CLASS
100
90
80
70
60
50
40
30
20
10
0 H A D R C S Z X Q * L W M B T P

19
Q24. WHAT IS YOUR POSITION IN THE DEALERSHIP’S ORGANISATION?
Who answered the survey?
• The survey was mainly answered by warranty administrators and head of service/after sales managers making up nearly two-thirds of respondents
WHO ANSWERED THE SURVEY?
DEALER PRINCIPAL
WARRANTY ADMINISTRATOR
HEAD OF SERVICE / AFTER SALES MANAGER
OTHER
HEAD OF SALES
SERVICE ADVISOR
Q22. WHAT IS THE SIZE OF YOUR DEALERSHIP, BY NEW VEHICLE SALES PER ANNUM?
Dealer size: new vehicle sales per annum
• Approximately 50% of dealerships sized between 200-1000 new vehicle sales per annum
WHAT WAS THE DEALER SIZE IN TERMS OF NEW VEHICLE SALES P.A.?
0-50
50-100
100-200
200-300
300-500
500-1000
1000-2000
2000-5000
MORE THAN 5000 CARS PER ANNUM
Q23. WHAT IS THE SIZE OF YOUR DEALERSHIP, BY SERVICE JOB CARDS PER ANNUM?
Dealer size: job cards per annum
• The dealer size by job cards per annum fairly evenly distributed
WHAT WAS THE SIZE OF THE ANSWERING DEALERS IN TERMS OF JOB CARDS P.A.?
0-500
500-1000
1000-2000
2000-3000
3000-5000
5000-10000
ABOVE 10000
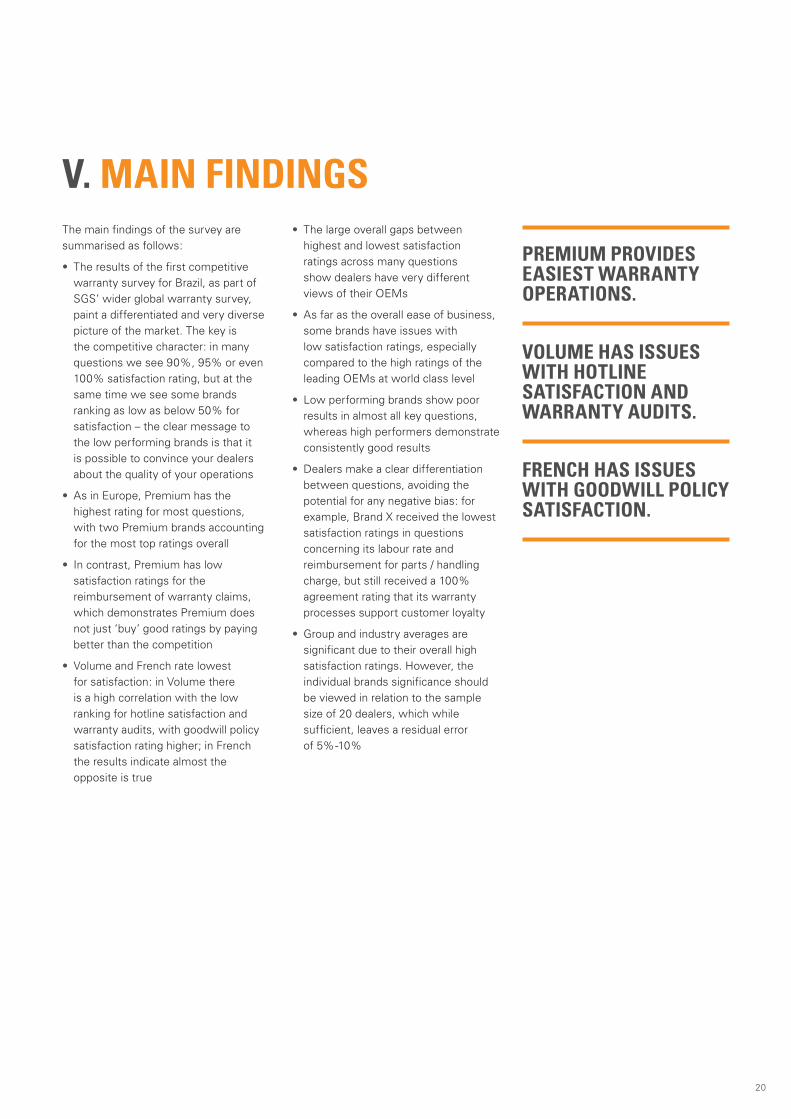
20
V. MAIN FINDINGSThe main findings of the survey are summarised as follows:
• The results of the first competitive warranty survey for Brazil, as part of SGS’ wider global warranty survey, paint a differentiated and very diverse picture of the market. The key is the competitive character: in many questions we see 90%, 95% or even 100% satisfaction rating, but at the same time we see some brands ranking as low as below 50% for satisfaction – the clear message to the low performing brands is that it is possible to convince your dealers about the quality of your operations
• As in Europe, Premium has the highest rating for most questions, with two Premium brands accounting for the most top ratings overall
• In contrast, Premium has low satisfaction ratings for the reimbursement of warranty claims, which demonstrates Premium does not just ‘buy’ good ratings by paying better than the competition
• Volume and French rate lowest for satisfaction: in Volume there is a high correlation with the low ranking for hotline satisfaction and warranty audits, with goodwill policy satisfaction rating higher; in French the results indicate almost the opposite is true
• The large overall gaps between highest and lowest satisfaction ratings across many questions show dealers have very different views of their OEMs
• As far as the overall ease of business, some brands have issues with low satisfaction ratings, especially compared to the high ratings of the leading OEMs at world class level
• Low performing brands show poor results in almost all key questions, whereas high performers demonstrate consistently good results
• Dealers make a clear differentiation between questions, avoiding the potential for any negative bias: for example, Brand X received the lowest satisfaction ratings in questions concerning its labour rate and reimbursement for parts / handling charge, but still received a 100% agreement rating that its warranty processes support customer loyalty
• Group and industry averages are significant due to their overall high satisfaction ratings. However, the individual brands significance should be viewed in relation to the sample size of 20 dealers, which while sufficient, leaves a residual error of 5%-10%
PREMIUM PROVIDES EASIEST WARRANTY OPERATIONS.
VOLUME HAS ISSUES WITH HOTLINE SATISFACTION AND WARRANTY AUDITS.
FRENCH HAS ISSUES WITH GOODWILL POLICY SATISFACTION.

21
VI. CONCLUSIONSBrazil has experienced 10-years of growth within its automotive market, and in that time much of the focus has been on the provision of affordable vehicles. Meanwhile, after sales has been rather neglected in Brazil, and as such dealers tend not to focus on customer satisfaction in the same way as more mature markets (i.e. EU, US and China) approach customer experience and after sales.
Premium is a clear leader in the ratings, which may not be all that surprising but it should be remembered that probably more so in Brazil than anywhere else in the world, due to Brazil’s high import tariffs, Premium OEMs must satisfy the most demanding end consumer (i.e. the Premium customer) and seller (i.e. the Premium dealer) – which in itself is no easy task.
In the detailed brand analysis, it is obvious that dealers have a very differentiated picture of the manufacturers. Some manufacturers within the French and Volume groups get very negative feedback on their warranty operations and would need to have a close look as to the competitiveness of their warranty offer. The instance of a gap of 55%, and a lowest performing brand with 30% of dealers finding warranty complicated, is an unprecedented finding in our warranty surveys. The call for action for this brand is self-evident.
Leaving a majority of dealers unsatisfied about the payment terms, as the results show for Brand S, is both uncooperative as well as short sighted. This will inevitably lead to dealers attempting to avoid warranty work, which will subsequently impact on customers. And it could increase the risk of fraudulent claims being made by dealers in order to make up for the ‘perceived imbalance’ in OEM payments. It is worth
noting that at the same time feedback on the warranty system is also low, the warranty audit rates bottom three and dealers rate the OEM last for whether its warranty processes support customer loyalty, all of which is an indication that warranty operations have significant potential to improve from their current low levels of satisfaction.
Warranty hotlines seem to concern some dealers. Three brands have low satisfaction ratings of just above 50%, which shows that dealers clearly have an issue with how the hotlines operate. Inevitably, this will impact customers, as slow or incompetent hotlines are a key driver in affecting the speed in which dealers can undertake repair. If this happens, customers have to wait longer for their car, or in the worst-case scenario do not even receive a repair, all because dealers are unsure about the payment approval of the hotline.
In regards to goodwill policy, Volume manufacturers exhibit quite positive results. Among single brands, the differentiation between process and level is quite high. And, as seen in previous SGS surveys, dealers make a clear differentiation between the process versus the level of goodwill. It is interesting to note that with the Volume group being quite diverse (i.e. one German, two US and one Korean manufacturer) the three cultural differences of the OEMs may be affecting their ratings.
On the extended warranty satisfaction (NB: not included in the charts in this white paper but part of the survey), two of the Volume manufacturers appear at the bottom of the individual brand rankings for administration, each with very low satisfaction ratings of only 20%. The coverage of the extended warranties rates more positively, but still the lowest rating of only 50% satisfaction is a Volume OEM.
COMPARED TO THE EU, US OR CHINA WARRANTY OPERATIONS IN BRAZIL DO NOT FOCUS ON CUSTOMER SATISFACTION TO THE SAME EXTENT.
MANY BRANDS HAVE ISSUES IN SEVERAL AREAS HOWEVER TOP PERFORMING BRANDS DEMONSTRATE THAT SERVICE EXCELLENCE IS ACHIEVABLE.
ENGAGED WARRANTY OPERATIONS ARE THE KEY TO ENSURING OPTIMAL CUSTOMER EXPERIENCE AND LOYALTY DURING AFTER SALES PROCESSES, RESULTING IN HIGHER REVENUES AND PROFITS.

22
COPYRIGHT NOTICE
© SGS Group Management SA – 2014 – All rights reserved - SGS is a registered trademark of SGS Group Management SA.
This study is the property of SGS Group Management SA and all intellectual property therein, including all proprietary and confidential information, know-how, designs and/or data, remains vested in and is owned by SGS Group Management SA. This document may also contain information, drawings, designs or plans owned by Third Parties and such information may be proprietary and confidential and protected by intellectual property rights of such Third Parties. This document may not be used, copied, and/or reproduced by any means, electronic or mechanical, in whole or in part for any purpose, unless such usage, copying and/or reproduction has been specifically permitted in writing by SGS Group Management SA and necessary royalty arrangements are concluded. Requests should be addressed to SGS ICS GmbH, Roland Gagel, Im Maisel 14, 65232 Taunusstein.
ABOUT THE AUTHOR
Roland Gagel Global Automotive Sector Manager, SGS
Roland Gagel is the Global Sector Manager for SGS Automotive, responsible for growing and developing SGS’ automotive audits and performance management business with manufacturers and suppliers. He joined SGS in 2011 after 15 years of extensive experience in the automotive sector. He started his career with General Motors Europe Purchasing Organisation at Adam Opel AG in Rüsselsheim. After holding a buyers position in Advance Purchasing, Roland was responsible for the QS 9000 (now ISO/TS 16949) certification of GM Europe’s suppliers.
Joining the Aftersales Organisation in 2001, he then moved into warranty; first in the area of supplier cost recovery, and then in operational warranty management of the Opel Germany Warranty team. Between 2008 and 2011, he was the head of European Warranty Operations of GM and led several projects to increase cost control within the dealer field while reducing warranty administration expenses.
Being the author of several warranty related studies and whitepapers, Roland is a frequent speaker at global warranty conferences in Europe and the US.
Roland was born and raised in Wiesbaden, Germany. He holds a joint masters degree in mechanical engineering and business administration from the Technical University Darmstadt.
ABOUT SGS
SGS is the world’s leading inspection, verification, testing and certification company. SGS is recognised as the global benchmark for quality and integrity. With more than 80,000 employees, SGS operates a network of over 1,650 offices and laboratories around the world.
SGS can support you in the goals of ensuring dealer franchise satisfaction by using our experience in the automotive industry and benchmarking best practices. We deliver results and analysis in a concise, clear and meaningful format; and make recommendations for action plans on any issues arising with dealers to ensure the improvement of your business.
Enhancing processes, systems and skills is fundamental to your ongoing success and sustained growth. We enable you to continuously improve, transforming your services and value chain by increasing performance, managing risks, better meeting stakeholder requirements, and managing sustainability.
With a global presence, we have a history of successfully executing large-scale, complex international projects. Our people speak the language, understand the culture of the local market and operate globally in a consistent, reliable and effective manner.
FOR MORE INFORMATION VISIT WWW.SGS.COM OR CONTACT [email protected]
TO VIEW THE RESULTS OF THE 2014 WARRANTY MANAGEMENT SURVEYS IN THE EU AND CHINA DOWNLOAD COMPLIMENTARY WHITEPAPERS AT WWW.SGS.COM/WHITEPAPERS

WWW.SGS.COM
© S
GS
Gro
up M
anag
emen
t S
A –
201
4 –
All
right
s re
serv
ed -
SG
S is
a r
egis
tere
d tr
adem
ark
of S
GS
Gro
up M
anag
emen
t S
A.